+ All Categories
Home > Documents > FACILITY LOCATION IN LOGISTIC NETWORK …aircconline.com/ijcsit/V9N5/9517ijcsit05.pdfFACILITY...

FACILITY LOCATION IN LOGISTIC NETWORK …aircconline.com/ijcsit/V9N5/9517ijcsit05.pdfFACILITY...

Date post: 24-May-2018
Category:
Upload: trandung
View: 220 times
Download: 1 times
Share this document with a friend
15
International Journal of Computer Science & Information Technology (IJCSIT) Vol 9, No 5, October 2017 DOI:10.5121/ijcsit.2017.9505 51 FACILITY LOCATION IN LOGISTIC NETWORK DESIGN USING SOFT COMPUTING OPTIMIZATION MODELS Shaju Varughese 1 and Gladston Raj S 2 1 Scholar, Bharathiar University, Coimbatore, Tamilnadu, India 2 Head of Department of CS, Govt. College, Nedumangadu , Thiruvananthapuram, Kerala, India. ABSTRACT Discovery of the optimal best possibility of location for facilities is the central problem associated in logistics management. The optimal places for the distribution centres (DCs) can be based on the selected attributes that are crucial to locate the best possible locations to increase the speed of the facility service and thus reduce the overall transport cost and time and to provide best service. The major task is to identifying and locating the required number of DCs and its optimum locations are considered as the important goals for the design of any logistics network. The number of DCs will clearly depends upon many factors like population, capacity of the facility, type of facility etc. but locating the optimum locations of DCs will reduce the overall cost. But, for solving such a wide problem space, the powerful tools are the soft computing based approaches and that are well suited and find a meaningful solution in finite time. In this work, we are going to find the optimum locations of DCs for logistics using various soft computing methods. .KEYWORDS Logistic, Heuristic, Hybrid, Inbounded, Crossover, Mutation, Simulated, Annealing, Direct Search. 1.INTRODUCTION The facility location analysis is the process identifying the location problem and generates a common model for finding the optimal location[22]. This is nothing but identify k center problem, which deal with the optimal placement of facilities to minimize transportation costs by satisfying some constraints[22]. The techniques also apply to cluster analysis so that the clustering algorithms used in data mining can also be applied for location analysis[22]. In this work, using the basic concept various soft computing based models are developed for finding the optimum location for facility location for logistics analysis. 1.1 Facility Location Problem (FLP) Facility Location problem in logistic management is the process of locating and allocating optimal location to construct one or more facilities in order to utilize the largest set of users within a specified service distance. The facility location problem is a challenging and non-linear problem in the areas of production, procurement, distribution, operations management and combinatorial optimization. The problem finds an optimal location of facilities considering facility construction costs, transportation costs, etc. This problem is very popular because it is faced by majority of companies. A large number of researchers have studied this problem and proposed different approaches as solution.
Transcript

International Journal of Computer Science & Information Technology (IJCSIT) Vol 9, No 5, October 2017

DOI:10.5121/ijcsit.2017.9505 51

FACILITY LOCATION IN LOGISTIC

NETWORK DESIGN USING SOFT

COMPUTING OPTIMIZATION MODELS

Shaju Varughese 1and Gladston Raj S

2

1

Scholar, Bharathiar University, Coimbatore, Tamilnadu, India 2Head of Department of CS, Govt. College, Nedumangadu , Thiruvananthapuram,

Kerala, India.

ABSTRACT

Discovery of the optimal best possibility of location for facilities is the central problem associated in

logistics management. The optimal places for the distribution centres (DCs) can be based on the selected

attributes that are crucial to locate the best possible locations to increase the speed of the facility service

and thus reduce the overall transport cost and time and to provide best service. The major task is to

identifying and locating the required number of DCs and its optimum locations are considered as the

important goals for the design of any logistics network. The number of DCs will clearly depends upon many

factors like population, capacity of the facility, type of facility etc. but locating the optimum locations of

DCs will reduce the overall cost. But, for solving such a wide problem space, the powerful tools are the soft

computing based approaches and that are well suited and find a meaningful solution in finite time. In this

work, we are going to find the optimum locations of DCs for logistics using various soft computing

methods.

.KEYWORDS

Logistic, Heuristic, Hybrid, Inbounded, Crossover, Mutation, Simulated, Annealing, Direct Search.

1.INTRODUCTION The facility location analysis is the process identifying the location problem and generates a

common model for finding the optimal location[22]. This is nothing but identify k center

problem, which deal with the optimal placement of facilities to minimize transportation costs by

satisfying some constraints[22]. The techniques also apply to cluster analysis so that the

clustering algorithms used in data mining can also be applied for location analysis[22]. In this

work, using the basic concept various soft computing based models are developed for finding the

optimum location for facility location for logistics analysis.

1.1 Facility Location Problem (FLP)

Facility Location problem in logistic management is the process of locating and allocating

optimal location to construct one or more facilities in order to utilize the largest set of users

within a specified service distance. The facility location problem is a challenging and non-linear

problem in the areas of production, procurement, distribution, operations management and

combinatorial optimization. The problem finds an optimal location of facilities considering

facility construction costs, transportation costs, etc. This problem is very popular because it is

faced by majority of companies. A large number of researchers have studied this problem and

proposed different approaches as solution.

International Journal of Computer Science & Information Technology (IJCSIT) Vol 9, No 5, October 2017

52

Location models are very difficult to solve, especially for large heterogeneous problem

instances[3]. There are a number of specific tools that are available in the operational industry

that overcome the tedious computational complexity of a location models. Besides, location

models are application dependent. Their objectives, constraints and variables are determined by

particular problem under study. So, it is very difficult to develop a common model that can

customize to a particular location model that is optimal for all potential or existing applications

[22].

There are two types of techniques in general[3]

• Exact Solution Techniques[3]

• Heuristic Solution Techniques[3]

1.2 The FLP and Logistics

1.2.1 Logistic

Logistic is a framework and it is essentially a planning orientation that seeks to create an efficient

planning for the flow of products and required information through a business. The traditional

orientation was to perform each functional task as well as possible with limited consideration

given to how one work area impacted another[22].

Optimization is the process of minimizing or maximizing the output of a well defined functions

model. Facility-location problem is the problem of locating facilities and its analysis deals with

existing facilities, if available, and clients in order to optimize several economic criteria. This

problem tries to satisfy the fixed, presumably known demands of m customers by supplying each

customer with the same commodity from a facility to be established at a particular site j [22]. It is

assumed that there are n candidate sites where facilities can be established if necessary. The

unfortunate aspect of this very general class of mathematical programming problems is the fact

that many of these problems have a high degree of complexity and general purpose algorithms to

solve them dependably are not readily available[22].

1.2.2 Facility Network Design

Classical economics neglected the importance of facility location in overall network design for

efficient business operation is not well defined in classical economics[22]. The economists

originally discussed supplier and customer demand relationships, facility location and

transportation cost were either nonexistent or equal among competitors. In business

management, the number, size, and geographical relationship of service providers used to perform

logistical operations directly affect the customer service capability and cost[22].

1.2.3 Logistics Network

A logistics network provides cost effective and efficient way of facilitates delivery of packages. It

is a network of DCs which can be utilized by multiple organizations[22]. These organizations can

share associated logistics costs. Consolidation of a variety of products and truckload

transportation help for mitigation of traffic congestion, saving of fuel, and reduction in

labour costs[22].

The type of products that can be handled by these DCs include furniture, consumer electronics,

paper products and stationary items, drugs, textile products, perishable and non-perishable food

products, non-food grocery products, home improvement and hardware items[22]. Since these

International Journal of Computer Science & Information Technology (IJCSIT) Vol 9, No 5, October 2017

53

products include almost everything related to domestic and office needs, implementation of the

PLN can reduce daily vehicle trips for purpose of shopping by substantial amount[22]. Moreover,

not only retailers, wholesalers and manufacturers can use of PLN but third party logistic

companies working with cooperative contract, small and mid-sized freight transportation

enterprises can collaborate with PLN and reduce the costs with high quality service to their

customers[22].

Figure 1. The Package Flow in Logistics Network

2. BACKGROUND ON FACILITY LOCATION AND ABOUT THIS WORK

2.1 Facility Location Problem

The following are the major criteria for finding the optimal location for facility location problem.

• Capacity of facility.

• Facility construction costs

• Transportation costs, etc.

These problems are the common issues faced by most of the companies. Also, number of research

proposals developed and implemented in this matter.

A decision maker or analysis system should build in this case that leads the decision makers to

decide the optimal location for a facility.

2.2 The Proposed Logistics Network Design

The Public Logistics Network (PLN) for the continental U.S. was based on the underlying road

networks and the state level population[2]. This research made use of the basic design approach

that was developed by Bansal. The Bansal proposal consists of the generation of the Underlying

Road Network (URN), developing the network of public DCs, estimation of average package

delivery time, and finding public DC locations that minimize average package delivery

time[22].

In this work, we modified and generate a new version of that design that make use of distance as

the major metric, instead of using the “average package delivery time” as a metric for

optimization, we used simple distance as the metric in the fitness function of the soft computing

International Journal of Computer Science & Information Technology (IJCSIT) Vol 9, No 5, October 2017

54

model[22]. This is minimizes the optimization time. Since the distance is directly proportional to

package delivery time, we believe that this approach also will lead to equal results, logically with

in lesser time[22].

• Structure the Road Network layout

• Design and develop the network for generating the DCs,

• Finding the DC locations that minimize the distance between the DCs and the User

locations.

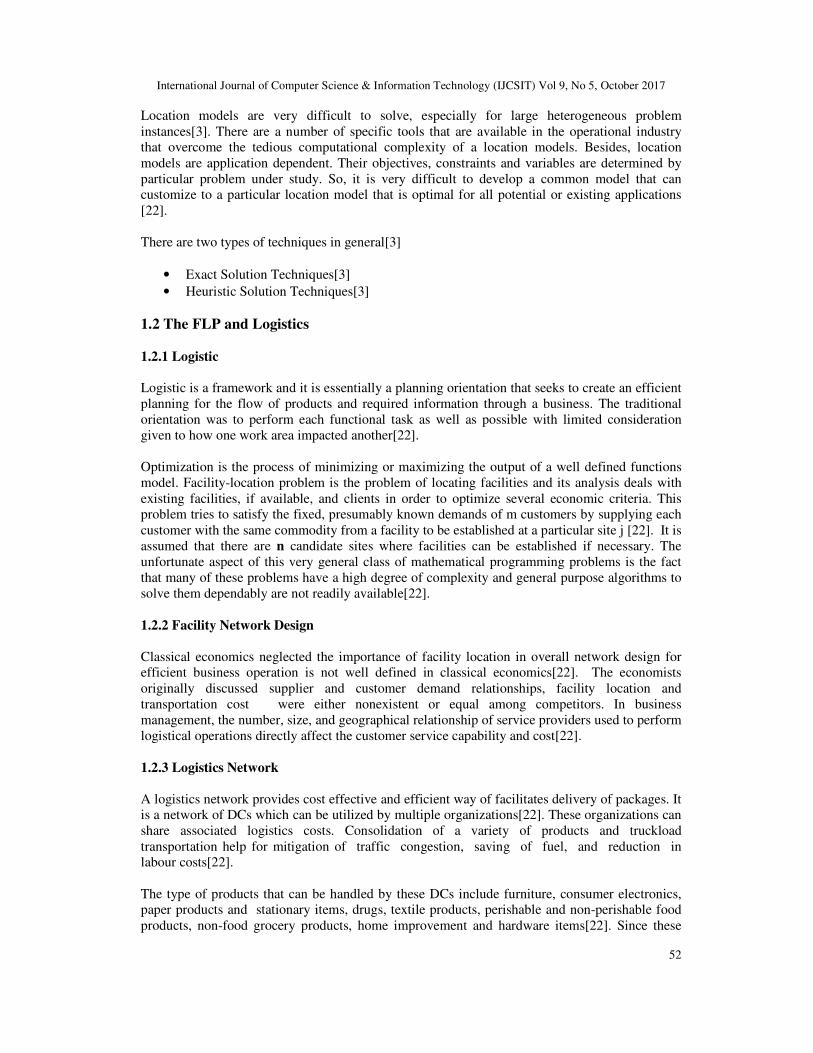
2.2.1 Road Network of USA

This map indicates the road network that using US census data set.

Figure 2. Road Network layout of USA

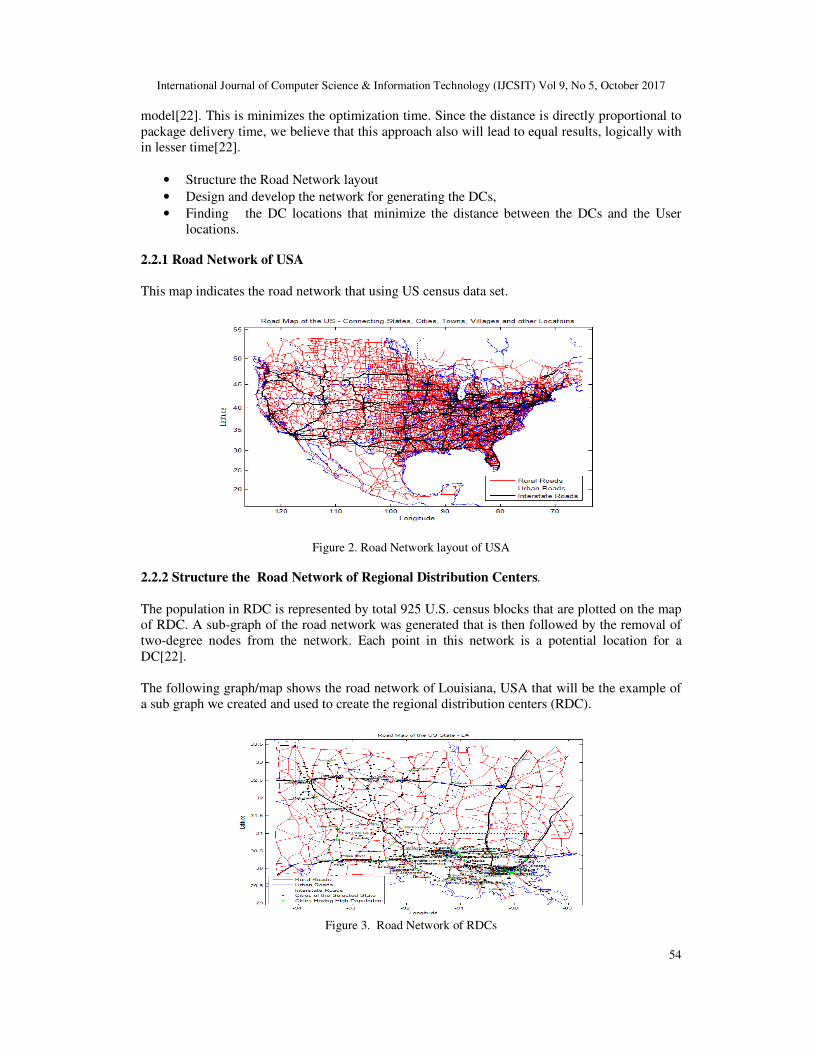
2.2.2 Structure the Road Network of Regional Distribution Centers.

The population in RDC is represented by total 925 U.S. census blocks that are plotted on the map

of RDC. A sub-graph of the road network was generated that is then followed by the removal of

two-degree nodes from the network. Each point in this network is a potential location for a

DC[22].

The following graph/map shows the road network of Louisiana, USA that will be the example of

a sub graph we created and used to create the regional distribution centers (RDC).

Figure 3. Road Network of RDCs

International Journal of Computer Science & Information Technology (IJCSIT) Vol 9, No 5, October 2017

55

2.2.3 Network of DCs

If needed, we may also create the network of DCs as follows.

The arcs connecting census blocks to the URN are added to the network and the shortest time

paths and distances between each pair of points are calculated using Dijkstra's algorithm[22]. DCs

will be located at some of the key points and then connected to each other using Delaunay

Triangulation [19] to form a network of public DCs. The shortest time paths between all pairs of

DCs is found and those paths and distances are then used to calculate the percent flow of the

packages, wij from DC i to DC j using order based proximity factors developed by Kay and

Parlikad [1] using following equations.

3.THE SOFT COMPUTING BASED FACILITY LOCATION SYSTEM MODELS

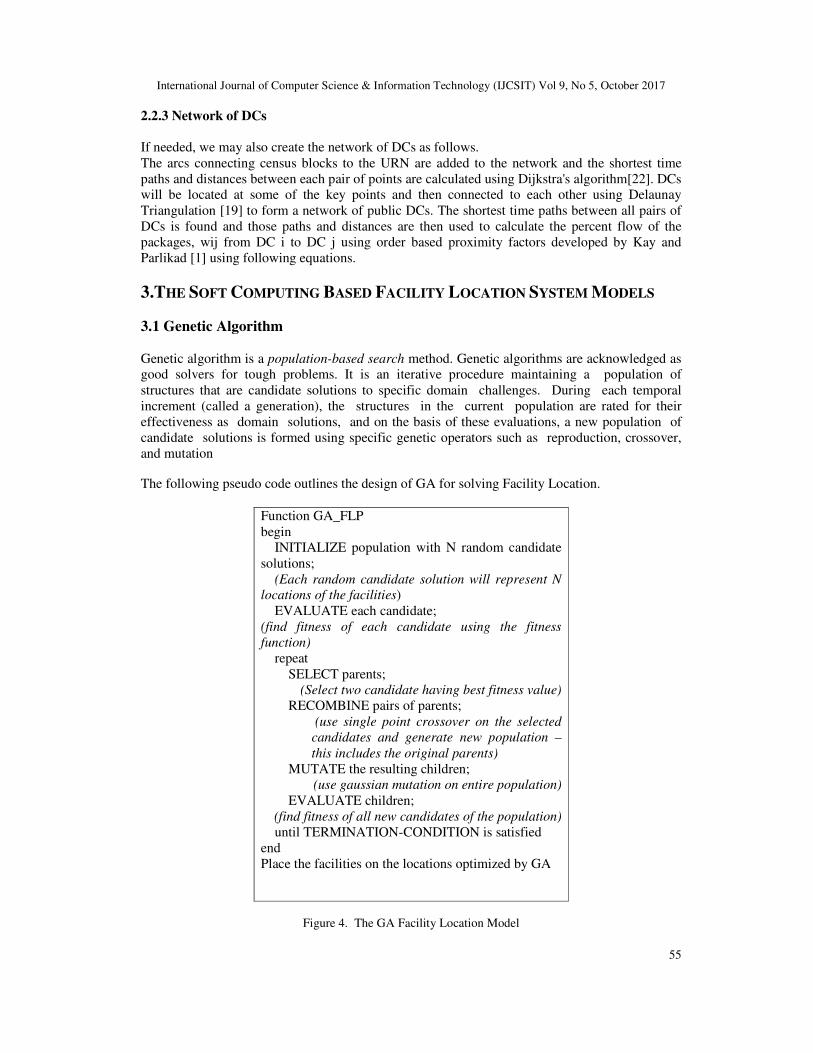
3.1 Genetic Algorithm

Genetic algorithm is a population-based search method. Genetic algorithms are acknowledged as

good solvers for tough problems. It is an iterative procedure maintaining a population of

structures that are candidate solutions to specific domain challenges. During each temporal

increment (called a generation), the structures in the current population are rated for their

effectiveness as domain solutions, and on the basis of these evaluations, a new population of

candidate solutions is formed using specific genetic operators such as reproduction, crossover,

and mutation

The following pseudo code outlines the design of GA for solving Facility Location.

Function GA_FLP

begin

INITIALIZE population with N random candidate

solutions;

(Each random candidate solution will represent N

locations of the facilities)

EVALUATE each candidate;

(find fitness of each candidate using the fitness

function)

repeat

SELECT parents;

(Select two candidate having best fitness value)

RECOMBINE pairs of parents;

(use single point crossover on the selected

candidates and generate new population –

this includes the original parents)

MUTATE the resulting children;

(use gaussian mutation on entire population)

EVALUATE children;

(find fitness of all new candidates of the population)

until TERMINATION-CONDITION is satisfied

end

Place the facilities on the locations optimized by GA

Figure 4. The GA Facility Location Model

International Journal of Computer Science & Information Technology (IJCSIT) Vol 9, No 5, October 2017

56

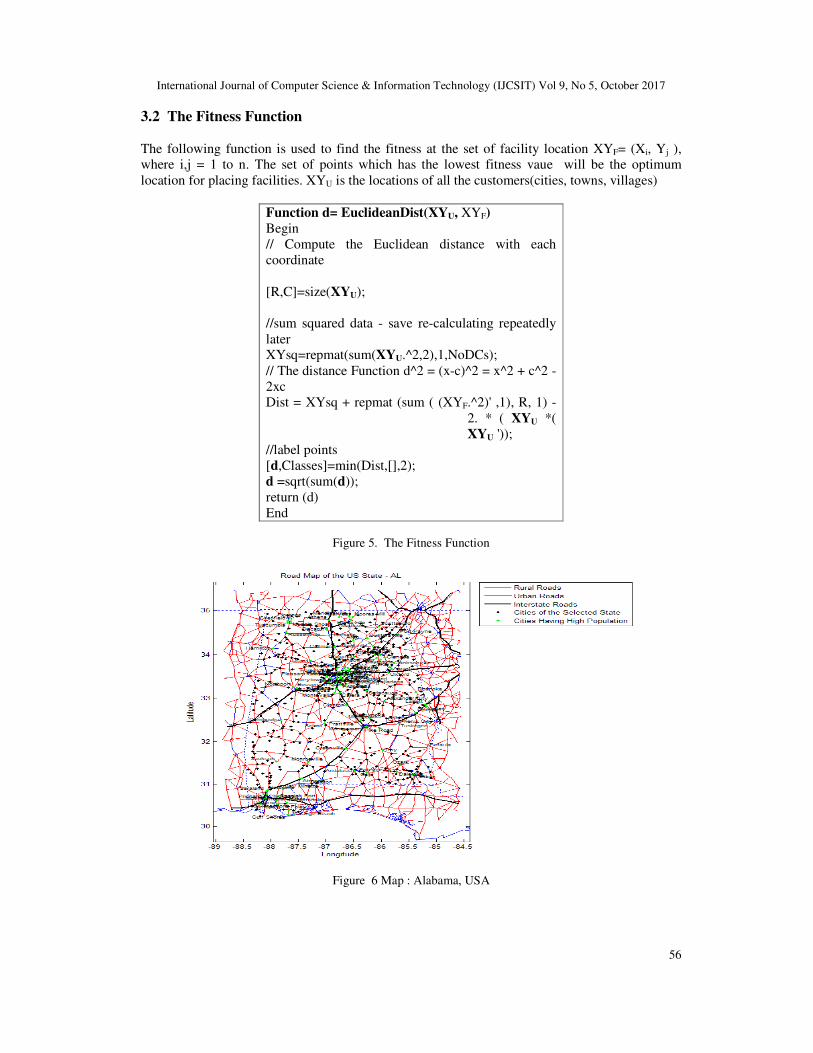
3.2 The Fitness Function

The following function is used to find the fitness at the set of facility location XYF= (Xi, Yj ),

where i,j = 1 to n. The set of points which has the lowest fitness vaue will be the optimum

location for placing facilities. XYU is the locations of all the customers(cities, towns, villages)

Function d= EuclideanDist(XYU, XYF)

Begin

// Compute the Euclidean distance with each

coordinate

[R,C]=size(XYU);

//sum squared data - save re-calculating repeatedly

later

XYsq=repmat(sum(XYU.^2,2),1,NoDCs);

// The distance Function d^2 = (x-c)^2 = x^2 + c^2 -

2xc

Dist = XYsq + repmat (sum ( (XYF.^2)' ,1), R, 1) -

2. * ( XYU *(

XYU '));

//label points

[d,Classes]=min(Dist,[],2);

d =sqrt(sum(d));

return (d)

End

Figure 5. The Fitness Function

Figure 6 Map : Alabama, USA

International Journal of Computer Science & Information Technology (IJCSIT) Vol 9, No 5, October 2017

57

Figure 7: Random Initial Locations of DCs

Fiqure 8: Facility Location by Genetic Algorithm

International Journal of Computer Science & Information Technology (IJCSIT) Vol 9, No 5, October 2017

58

Figure 9: Performance of Genetic Algorithm

3.3 Simulated Annealing

The structural change in the materials at the time of cooling is the concept and the working

terminology of Simulated Annealing(SA)[22]. The Metropolis algorithm developed in 1953 was

the basic structure of Simulated Annealing and it was published. The algorithm in this paper

simulated the cooling process of materials and their structural changes from their heavy hot stage

by using the heat bath[22]. This cool down process is known as annealing. The working of the

algorithm is that in step by step it will allow the material to cool and transform in to a steady solid

state.

The basic idea of metropolis algorithm has initiated by Kirkpatrick in 1982. It has been applied to

various optimization problems. The basic concept is to find the feasible solution to a problem by

using simulated annealing as a major tool and converge to an optimal solution[22].

The law of thermodynamics state that at temperature, st, the probability of an increase in energy

of magnitude, δEM, is given by P(δEM) = exp(-δEM /kst)

Where k is a Boltzmann’s constant.

Based on the calculated new energy The system has moved to the same state if the new energy

has decreased otherwise the new state is accepted using the probability returned by the above

formula[22]. A certain number of iterations are carried out at each temperature and then the

temperature is decreased. This process is an iteration process and recursive until the system

freezes in to a pre-assigned steady state[22]. This equation can make use for generating

simulated annealing concept directly. It is a common practice to drop the Boltzmann constant into

the equation to experiment with different materials. The acceptable probability for the worse case

is defined by the equation

PR = exp(-cf/ct) > rv

Where

cf = the change in the evaluation function

ct = the current temperature

rv = a value between 0 and 1

Function SIMULATED-ANNEALING(Problem, Schedule) returns a solution state

Inputs : Problem, a problem

International Journal of Computer Science & Information Technology (IJCSIT) Vol 9, No 5, October 2017

59

Schedule, a mapping from time to temperature

Local Variables : Current, a node

Next, a node

TH, a “temperature” controlling the probability of downward steps

Current = MAKE-NODE(INITIAL-STATE[Problem])

For temp = 1 to ∞ do

TH = Schedule[temp]

If TH = 0 then return Current

Next = a randomly selected successor of Current

ΛE = VALUE[Next] – VALUE[Current]

if ΛE > 0 then Current = Next

else Current = Next only with probability exp(-ΛE/TH)

Figure 10 Facility Location by Simulated Annealing

Figure 11 Simulated Annealing performance graph

International Journal of Computer Science & Information Technology (IJCSIT) Vol 9, No 5, October 2017

60

3.4 Direct Search

The optimal solutions finding procedure in multidimensional spaces is some extend similar to the

methods used in the single dimensional space for finding the optimal solution. In

multidimensional optimization the computational complexity of the applications depend the type

of application, solution method applied and the data extend.

The systematic search and find all possible evaluation procedures and corresponding solutions in

the multidimensional space and select the maximum or the minimum optimization solution based

on the objective. This is a very generally applicable approach and may even be useful if the

solution space is relatively small. However, as the dimensions of the problem space, (number of

independent variables), increase, the computational complexity of this solution approach quickly

becomes unmanageable. Therefore, apply the methods for finding the optimal solution by

applying the efficient form of search in the solution space and these are need not be in entire

solution space.

Figure 12: Facility Location based on Direct Search method

International Journal of Computer Science & Information Technology (IJCSIT) Vol 9, No 5, October 2017

61

Figure 13: Performance layout of Direct Search

3.5 K-means Clustering

Simply put, k-Means Clustering is an algorithm among several that attempt to find groups

in the data. In pseudo code, it follow this procedure:

The vector m contains a reference to the sample mean of each cluster. x refers to each of our

examples, and b contains our estimated class labels.

Explained perhaps more simply in words, the algorithm roughly follows this approach:

Choose some manner in which to initialize the mi to be the mean of each group (or cluster), and

do it.

For each example in your set, assign it to the closest group (represented by mi).

For each mi, recalculate it based on the examples that are currently assigned to it.

Repeat steps 2-3 until mi converge.

Initialize mi, i = 1,…,k, for example, to k

random xt

Repeat

For all xt in X

bit � 1 if || x

t - mi || = minj || x

t - mj ||

bit � 0 otherwise

For all mi, i = 1,…,k

mi � sum over t (bit x

t) / sum

over t (bit )

Until mi converge

International Journal of Computer Science & Information Technology (IJCSIT) Vol 9, No 5, October 2017

62

Figure 14: K-means clustering Algorithm based facilities

4 . RESULT AND DISCUSSION

We have implemented the proposed soft computing based models for facility location in logistics

analysis using Matlab software version R2012s. We used some of the functions of Logistics

Engineering Toolbox “Matlog Version 16” in this research. We tried to use almost equal input

parameters for each and every evaluated method. We used the USA census data and map data

which is much suitable for this kind of research. We decided to use USA data because, it is the

only data refereed in some of the previous works and there seems no such detailed data available

for any other country for validating the methods of facility location and logistics analysis.

The basic data set parameters of the Soft Computing Models Genetic Algorithm options

StallGenLimit : 20,

Generations : 200

PopulationSize : 20

CrossoverFcn : Two Point Crossover

MutationFcn : Gaussian

Simulated Annealing Options

MaxIter : 200

MaxFunEvals : 200

InitialTemperature : 100

AnnealingFcn : Fast Annealing

HybridFcn : fminsearch

TemperatureFcn : temperatureexp

Pattern Search Options

MaxIter : 200

MaxFunEvals : 200

InitialMeshSize : 1.0

PollMethod : MADSPositiveBasis2N

SearchMethod' : ADSPositiveBasis2N

k-means Clusterign

MaxRepetitions : 200

MaxIter : 20

International Journal of Computer Science & Information Technology (IJCSIT) Vol 9, No 5, October 2017

63

The following table shows the overall results of this work. Since the performance of a soft

computing model will depend up on several factors, and some random conditions, we run each

algorithms several times and only selected the values which are minimum.

Table 1 - The Overall Performance

Facility Location

Method

Avg.

Distance

Time

Consumed

Random

Location 9.44 -

GA 3.59 2.63

SA 5.67 5.13

DS 4.29 1.44

k-means 3.95 3

The following graph shows the performance of the four algorithms in terms of the minimum

average distance achieved. The average distance is the average of distance between all DCs and

the Customer locations. Each Customer is bound with a nearest DC and the distance between

each customer to that corresponding DC is calculated and then the average of all such distances

were calculated. In this graph, the first column shows the reference distance which is nothing but

the initial average distance of DCs that are randomly placed on the map.

With respect to the average distance, the GA based model performed well. It means, GA found

the optimum facility locations better than the other compared methods.

Figure 15. The Performance in Terms of distance

The following graph shows the performance in terms of cpu time. Even though direct search

consumed lesser time, it doesn’t fine much optimum locations like GA. We have to note that the

time in the case of GA,SA and DS includes some additional time that is spent of

displaying/updating some of the performance graphs also (without those performance graphs,

there will be much reduction in time in GA, SA and DS)

9.44

3.59

5.67

4.293.95

0

1

2

3

4

5

6

7

8

9

10

Random Initial

Location

GA SA DS k-means

Avg

.Dis

tan

ce

.

Facility Location Algorithm

Avg.Distance Achieved by Different Methods

International Journal of Computer Science & Information Technology (IJCSIT) Vol 9, No 5, October 2017

64

Figure 16. The Performance in Terms of CPU Time

5. CONCLUSION

The major issue faced logistic management is none other the facility location. Also, it is a one of

the leading research area. In this work we addressed the possibilities and its performance using

soft computing based models for facility location in for logistics. We used soft computing based

clustering approach is the basic facility Location Problem & Logistic Analysis.

As per the performance and dataset based results, soft computing based optimization models

successfully found optimum locations of facilities in considerably meaningful time limit.In this

work, we used a simple Euclidean distance function as the major fitness function in the design of

soft computing based location optimization model. But, there are much more constraints and

parameters in a practical logistics problem that can be included in the design of the fitness

function such as (1) travel time with respect to road type, (2) Collection and distribution time at

DCs, (3) Capacity of the facility (4) Facility type ( seasonal or not) . This kind of more constraints

and parameters can be included in future design of soft computing based optimization models.

Our future works will address these issues.

We have designed the proposed models as a single objective problem. But there may be the

situation where facility location and logistics analysis should optimized based on more than one

objective during optimization. Future works may address the design of soft computing based

optimization models for multi objective optimization scenarios.

REFERENCES [1] Erlenkotter, D., "A Dual-Based Procedure for the Uncapacitated Facility Location." Operations

Research, Vol 26(6), pg. 992-1009, 1978.

[2] Francis, R.L., McGinnis, F.L., Jr., White, J.A., "Facility Layout and Location: An Analytical

Approach." Prentice Hall, 2nd Ed., 1974.

[3] Juliana Karakaneva, "A LOCATION PROBLEM MODELING AND SOLVING", Trakia Journal of

Sciences, Vol 1, No 4, pp 1-7, 2003,ISSN 1312-1723, Copyright © 2003 Trakia University

[4] HK Smith, G Laporte and PR Harper, "Locational analysis: highlights of growth to maturity",

http://eprints.soton.ac.uk/68930/1/Locational_Analysis_-_Smith,_Laporte_and_Harper.doc

[5] Michael J. Bucci, Michael G. Kay, Donald P. Warsing†, Jeffrey A. Joines, "Metaheuristics for Facility

Location Problems with Economies of Scale", IIE Transactions

2.63

5.13

1.44

3

0

1

2

3

4

5

6

GA SA DS k-means

Tim

e (

sec

)

.

Facility Location Method

Time Taken for Facility Location

International Journal of Computer Science & Information Technology (IJCSIT) Vol 9, No 5, October 2017

65

[6] Michael J. Bucci, Ryan Woolard, Jeffrey Joines, Kristin Thoney, Russell E. King, "An Application of

Heuristics Incorporating Economies of Scale to Facility Location Problems in Carpet Recycling”

[7] Biehl, M., Prater, E., Realff, M.J., 2007, Assessing performance and uncertainty in developing carpet

reverse logistics systems, Computers and Operations Research, 34, 443-463.

[8]. Brimberg, J.,Hansen, P., Mladenovic, N.,Taillard, E.D. ,2000, Improvements and Comparison of

Heuristics for Solving the Uncapacitated Multisource Weber Problem, Operations Research, 48, 444-

460.

[9] Bucci, M.J., Kay, M.G., Warsing, D.P., Joines, J.A., 2009, Metaheuristics for Facility Location with

Economies of Scale, Fitts Department of Industrial and Systems Engineering working paper, North

Carolina State University, Raleigh NC.

[10] Cooper, L., 1963, Location-allocation problems, Operations Research, 11, 331-343.

[11]CARE (Carpet America Recovery Effort) annual report, 2007,

http://www.carpetrecovery.org/pdf/annual_report/07_CARE-annual-rpt.pdf

[12]CARE(Carpet America Recovery Effort) network website, 2009,

http://www.carpetrecovery.org/pdf/reclamation_centers/Carpet_Reclamation_Center s.pdf

[13] Daskin, M.S.,1995, Network and discrete location: models, algorithms, and applications, John Wiley

and Sons, New York.

[14] de Brito, M.P., Dekker, R., Flapper, S.D.P., 2003, Reverse Logistics - a review of case studies, ERIM

Report Series.

[15] Fleishchmann, M., Krikke, H.R., Dekker, R., Flapper, S.D.P., 2000, A characterization of logistics

networks for product recovery, Omega, 28, 653-666.

[16] Louwers, D., Kip, B.J., Peters, E., Souren, F., Flapper, S.D.P., 1999, A facility location allocation

model for reusing carpet, Computers and Industrial Engineering,

[17] Mirchandani, P.B., Francis, R.L., 1990, Discrete Location Theory, Wiley, NewYork.

[18] Realff, M.J., Ammons, J.C., Newton, D., 1999, Carpet Recycling: Determining the 38:3, 547-567.

[19] Realff, M., Systems Planning for Carpet Recycling. 2006, Recycling in Textiles, Editor Youjiang

Wang, CRC Press.

[20] Repa, E.W., 2005, NSWMA's 2005 Tip Fee Survey, National Solid Wastes Management Association

Website,://wastec.isproductions.net/webmodules/webarticles/articlefiles/478-

Tipping%20Fee%20Bulletin%202005.pdf

[21] Shaju Varghese, Gladston Raj S, “A Genetic Algorithm Based Optimization Model for Facility

Location in Logistic Network Design”, International Journal of Applied Engineering Research, Vol

10, No. 69, pp-338-344, 2015, ISSN 0973-4562.

[22] Shaju Varghese, Gladston Raj S, “Simulated Annealing and Direct Search Based Optimization

Models for Facility Location in Logistic Network Design” International Journal of Computer

Applications, Vol 132, pp- 31-37, December 2015, ISSN: 0975-8887

Authors Profile

Mr. Shaju Varghese received his M.Sc. (Maths), M.C.A., and M.Phil. in computer

Science. Now working as Head of the Department of Computer Applications at

Baselios Poulose II Catholicos (B. P. C ) College, Piravom, Kerala, India. He was

the Principal Investigator of the Minor Research Project "Computerized Facility

Location Analysis In Rural Area Using Clustering", 2010, funded by Universities

Grant Commission, India. His research interest includes Data Mining, Facility

Location Problem, and Cyber Criminology, and has four international Journal

publications in related to his research area. Currently he is pursuing Ph.D. in

Computer Science at Bharathiar University, Tamilnadu, India.

Dr. Gladston Raj S. received his M.Sc (CS), M.Tech (Image Computing) and PhD in

Computer Science from University of Kerala and Completed UGC-NET from

University of Kerala and PGDCH (Computer hardware) from MicroCode, He is

Now working as Head of the Department of Computer Science at Govt. College

Nedumangad, Kerala, India. His area of interest includes Image Processing, Signal

Processing, Datamining. He is providing research guidance for Ph.D scholars from

different areas of research and has presented several invited talks in this areas


Recommended