60
Facility Management Staffing Report Research Report #33

Facility Management Staffing Report
Research Report #33
FM StaFFing Survey CoMMittee MeMberS Jon Bredemeier, CFM, Sears Holdings Management Corporation Sheryl Callahan, CFM, Grubb & Ellis Jamie Galileo, Energy Solutions Arena Ted Maslin, CFM, City of Seattle Lyle Schall, General Dynamics Fred Weiss, CFM, IFMA Fellow, University of Texas at San Antonio Ed Wirth, CFM, Emprise Bank
Director of ResearchShari F. Epstein, CAE
Survey Design and ReportKevin Whorton, Whorton Marketing & Research
© Copyright 2010 by the International Facility Management Association All rights reserved. Printed in the United States of America.
This publication may not be reproduced, stored in a retrieval system or transmitted in whole or part, in any form or by any means, electronic, mechanical, photocopying, recording or otherwise without the written permission of the International Facility Management Association.
For more information, please contact: IFMA Research Department 1 East Greenway Plaza, Suite 1100, Houston, TX 77046-0104, USA
Phone: +1-713-623-4362 Fax: +1-713-623-6124 E-mail: [email protected]
ISBN 1-883176-81-6
Printed on 10% post-consumer waste recycled paper. FSC certified.
Introduction 4
Facility Description 7
Staffing the FM Function 15
Pay Practices 19
Estimate - Total U.S. Facility Management Professionals 23
Detailed Data Tables by Key Characteristics 25
A. Overall Staffing Levels 29
B. Staff Composition 31
C. Detailed Professional Staff Breakdown 34
D. Recent Changes 38
E. Salary Change and Basis 41
F. Outsourced Functions 47
Participant List 49
Facility Management Staffing report
table of Contents
4 International Facility Management Association Today’s Facility Manager Facility Management Staffing Report © 2010
Facility management – a profession that encompasses multiple disciplines to ensure functionality of the built environment by integrating people, place, process and technology. (IFMA)
The role of facility management is to support an organization’s core business by taking a strategic view of its facilities, operating them in a cost-efficient manner while providing a safe and optimum working environment. The size of the facility management department can be as small as one or consist of hundreds of staff members depending on the size and scope of the organization. When asked about issues that concern facility managers, the shortage of staff is often mentioned. In 2009 study, 28% of respondents cited lack of staff as a daily work struggle. It’s rare to hear a facility manager say his department is overstaffed.
To help facility managers gauge if they are applying sufficient resources to the facility management function, IFMA conducted a survey to assess staffing levels for professional, skill trade and non-skilled FM positions. The intent of this study was to measure total staffing levels and to identify factors that drive staffing—such as industry sector, size and type of space managed, outsourcing practices, employee turnover and location.
The decided approach to gather this information was to create a survey of members and subscribers of Today’s Facility Manager magazine. Because the survey needed to apply to a variety of different organizational models, it took a group of FM subject matter experts and two research professionals several months and multiple iterations to create. Incorporating common outsourcing practices added to the complexity of the survey.
A second objective of this research was to derive a ratio of FM staff to square footage managed. By creating such a ratio, one can create a model to determine the total number of FM professionals in the specific region and derive the size of the universe. This study was successful in this endeavor.
DeFinitionS
average Average is also referred to as the mean – the sum or total of all responses divided by the number of respondents.
biM Building Information Modeling
CaD Computer Aided Design
CaFM Computer Aided Facility Management
CMMS Computerized Maintenance Management System
CoLa Cost-of-Living Adjustments
giS Geographic information system
Mean See definition for average. Mean and average are used interchangeably and the interpretation is the same.
Median The middle value in a range of responses is the median. One-half of all respondents will be below this value, while one-half will have a higher value. The median is also known as the 50th percentile. The advantage in using the median is that it is not affected as much by extreme highs or lows in the range of values as is the case with the mean.
n N is the number of cases supplying the data being described. It is important to note the size of the sample for the value you are comparing.
about this report
introduction
© 2010 Facility Management Staffing Report Today’s Facility Manager International Facility Management Association 5
Staff Professional - Used in this report to identify FM staff, typically salaried exempt (not eligible for overtime) employees trained as specialists or managers.
Skilled Trades - Used in this report to identify trained crafts or trades staff such as electricians, plumbers, carpenters, painters, HVAC, controls, furniture tech or stationery engineer.
Non-skilled Workers - Used in this report to identify FM workers who are not necessarily trained or skilled performing duties such as custodial, grounds keeping, food service or moving.
MethoDoLogy
The International Facility Management Association and Today’s Facility Manager magazine conducted a study on staffing levels. Unique samples were chosen from the IFMA membership base and Today’s Facility Manager subscriber list, then merged to ensure that the file contained no duplicates. A total of 18,015 unique individuals were sent a survey. The survey was active from early June 2009 through July 31, 2009.
Respondents were offered a free electronic summary of the findings as an incentive for participation. Upon completion, the study had a total of 994 responses from IFMA members out of 8,133 net names in the sample, a response rate of 12.2%. Among Today’s Facility Manager subscribers, only 420 responded from a net sample of 9,882 names, a response rate of 4.3%.
Data analysis began soon thereafter, and within several weeks it was apparent to both researchers that the staffing data was inconsistent. It appeared that many of the respondents overcounted professional staff and undercounted trades staff and unskilled staff. After careful consideration, a decision was made to reissue a modified staffing question to the 1,400+ participants who had participated to make certain that all staff members were counted and incorporated in the appropriate category. This additional fielding occurred in January 2010. By the
end of January, 700 of the previous respondents had supplied updated data. The newer data was matched up to the previous set of data, and new staffing data was created.
Because standard error is a function of total responses, the study findings overall are statistically significant at the 95% confidence level with a low sampling error and a confidence interval of approximately +/- 3.5%.


Facility Description
8 International Facility Management Association Today’s Facility Manager Facility Management Staffing Report © 2010
Facility Description
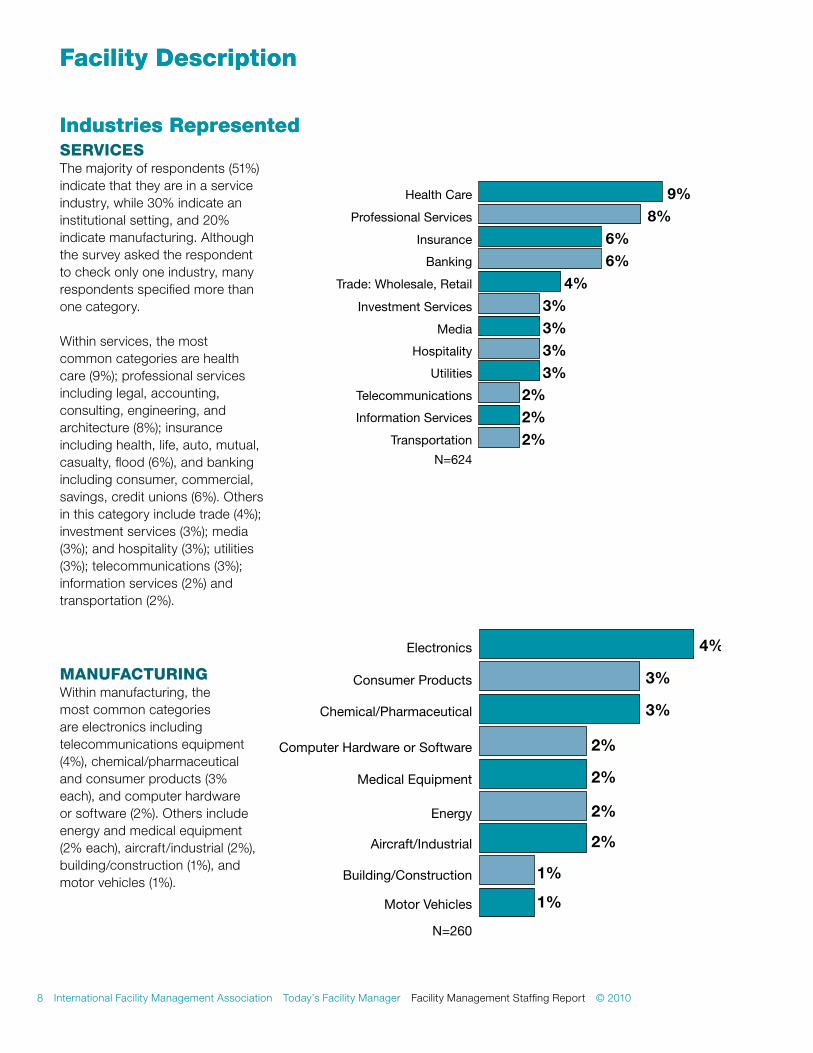
industries representedServiCeSThe majority of respondents (51%) indicate that they are in a service industry, while 30% indicate an institutional setting, and 20% indicate manufacturing. Although the survey asked the respondent to check only one industry, many respondents specified more than one category.
Within services, the most common categories are health care (9%); professional services including legal, accounting, consulting, engineering, and architecture (8%); insurance including health, life, auto, mutual, casualty, flood (6%), and banking including consumer, commercial, savings, credit unions (6%). Others in this category include trade (4%); investment services (3%); media (3%); and hospitality (3%); utilities (3%); telecommunications (3%); information services (2%) and transportation (2%).
Facility Description
9%Health Care
8%Professional Services
Insurance
6%Banking
4%Trade: Wholesale, Retail
3%Investment Services
3%Media
3%Hospitality
3%Utilities
Telecommunications
2%Information Services
2%Transportation
N=624
6%
2%
ManuFaCturingWithin manufacturing, the most common categories are electronics including telecommunications equipment (4%), chemical/pharmaceutical and consumer products (3% each), and computer hardware or software (2%). Others include energy and medical equipment (2% each), aircraft/industrial (2%), building/construction (1%), and motor vehicles (1%).
4%
3%
3%
2%
2%
2%
2%
1%
1%Motor Vehicles
N=260
Building/Construction
Aircraft/Industrial
Energy
Medical Equipment
Computer Hardware or Software
Consumer Products
Electronics
Chemical/Pharmaceutical
industries represented
© 2010 Facility Management Staffing Report Today’s Facility Manager International Facility Management Association 9
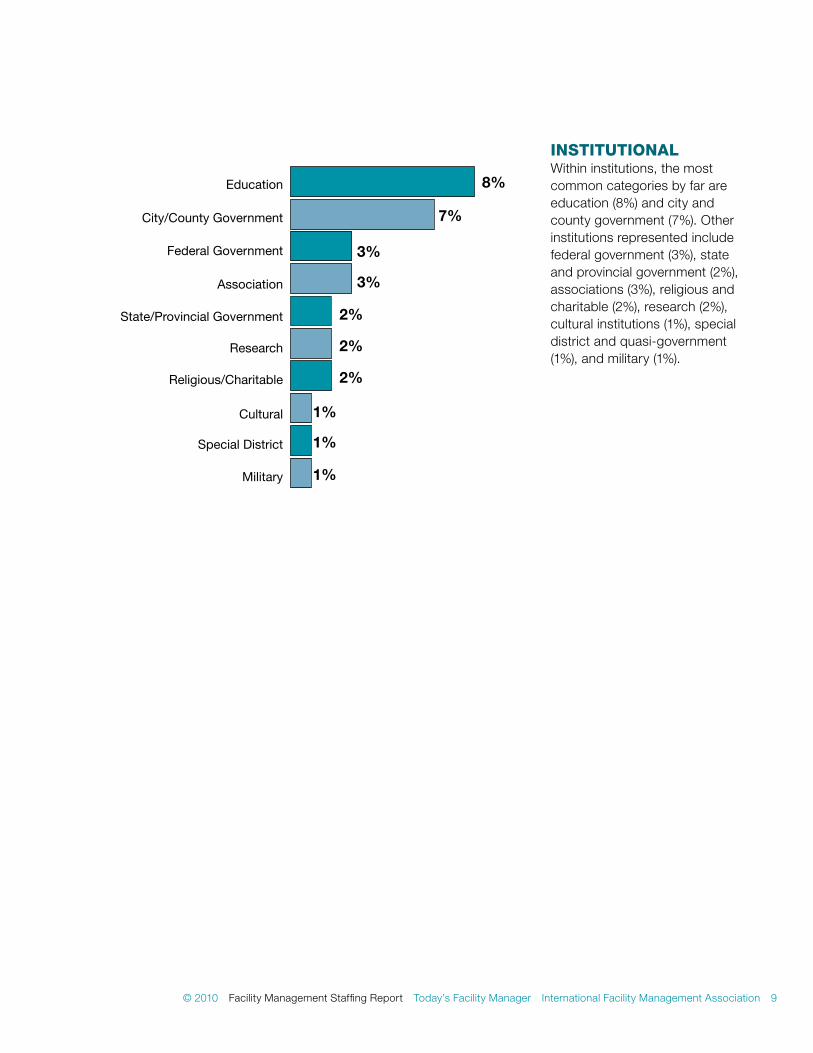
inStitutionaLWithin institutions, the most common categories by far are education (8%) and city and county government (7%). Other institutions represented include federal government (3%), state and provincial government (2%), associations (3%), religious and charitable (2%), research (2%), cultural institutions (1%), special district and quasi-government (1%), and military (1%).
8%
7%
3%
3%
2%
2%
2%
1%
1%Special District
N=379
Cultural
Religious/Charitable
Research
State/Provincial Government
Association
City/County Government
Education
Federal Government
1%Military
10 International Facility Management Association Today’s Facility Manager Facility Management Staffing Report © 2010
Facility Description
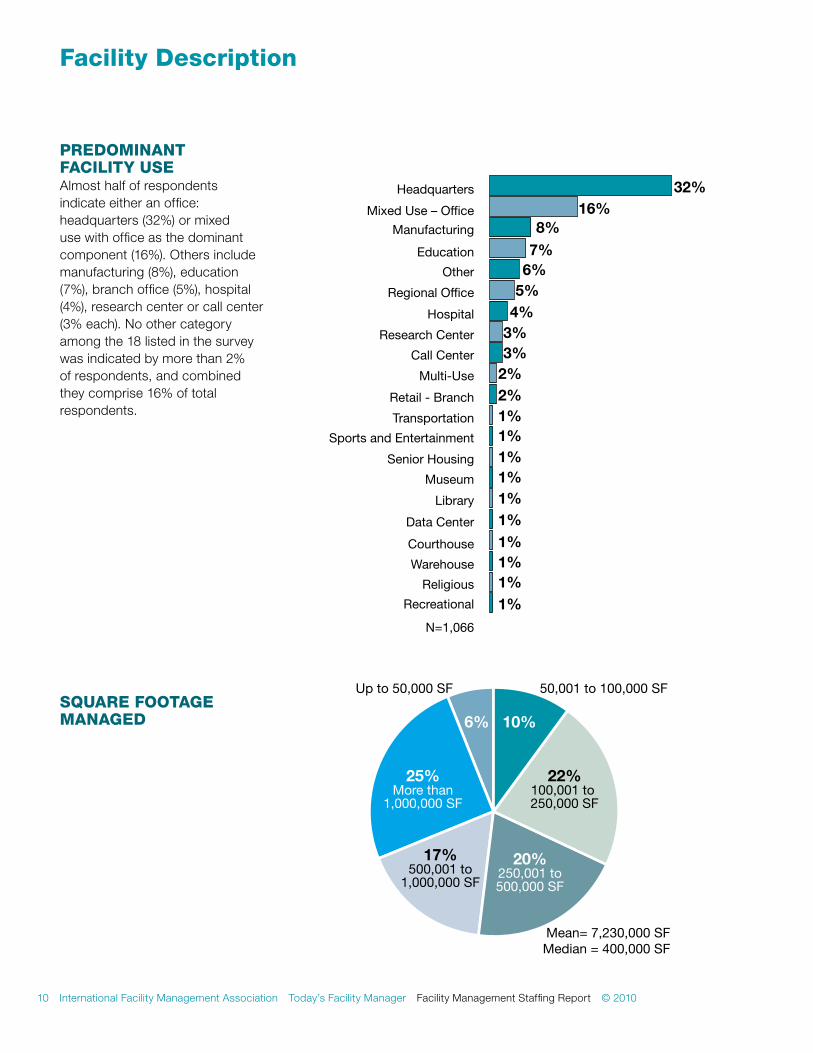
PreDoMinant FaCiLity uSeAlmost half of respondents indicate either an office: headquarters (32%) or mixed use with office as the dominant component (16%). Others include manufacturing (8%), education (7%), branch office (5%), hospital (4%), research center or call center (3% each). No other category among the 18 listed in the survey was indicated by more than 2% of respondents, and combined they comprise 16% of total respondents.
32%16%
8%7%
6%5%
4%3%3%
2%2%1%1%1%1%1%1%1%1%1%1%
Call Center
N=1,066
Research Center
Hospital
Regional Office
Other
Education
Mixed Use – Office
Headquarters
Manufacturing
Courthouse
Data Center
Library
Recreational
Religious
Warehouse
Museum
Senior Housing
Sports and Entertainment
Retail - Branch
Multi-Use
Transportation
Square Footage ManageD
Mean= 7,230,000 SFMedian = 400,000 SF
25%More than
1,000,000 SF
6% 10%
17%500,001 to
1,000,000 SF
20%250,001 to500,000 SF
22%100,001 to 250,000 SF
50,001 to 100,000 SFUp to 50,000 SF
© 2010 Facility Management Staffing Report Today’s Facility Manager International Facility Management Association 11
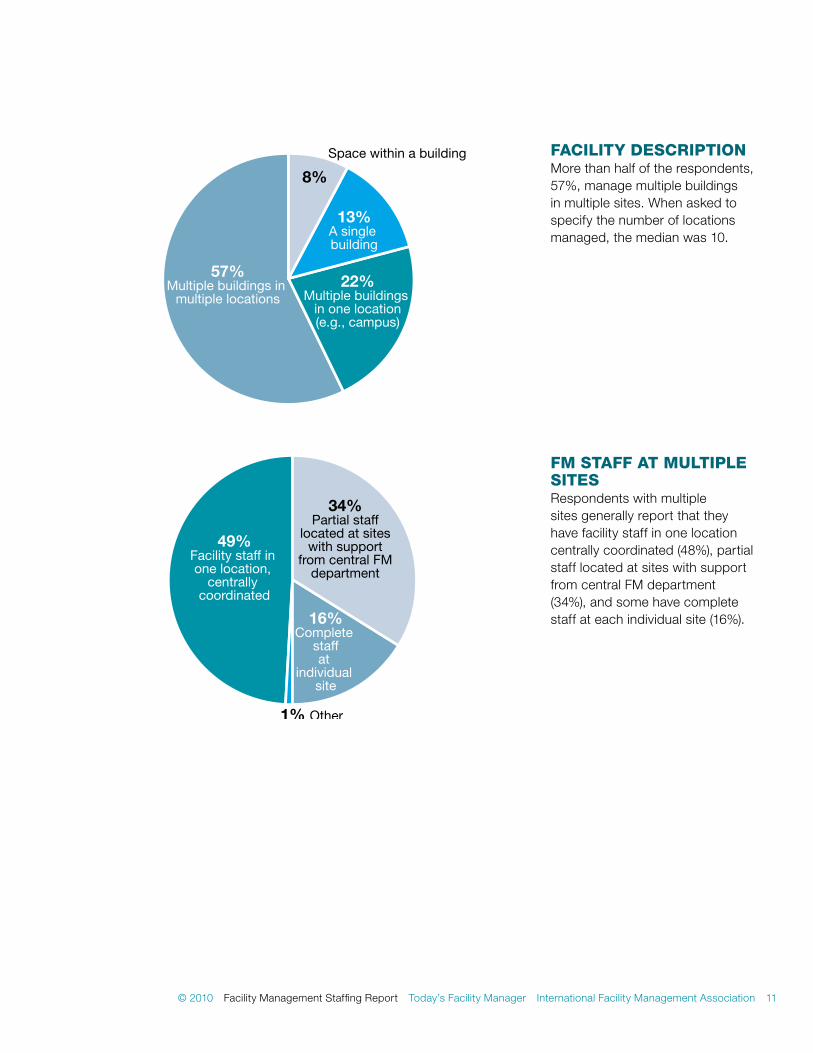
FaCiLity DeSCriPtionMore than half of the respondents, 57%, manage multiple buildings in multiple sites. When asked to specify the number of locations managed, the median was 10.
FM StaFF at MuLtiPLe SiteSRespondents with multiple sites generally report that they have facility staff in one location centrally coordinated (48%), partial staff located at sites with support from central FM department (34%), and some have complete staff at each individual site (16%).
Space within a building
57%Multiple buildings in
multiple locations22%
Multiple buildings in one location(e.g., campus)
13%A single building
8%
1% Other
49%Facility staff in one location,
centrallycoordinated
34%Partial staff
located at siteswith support
from central FMdepartment
16%Complete
staffat
individualsite
12 International Facility Management Association Today’s Facility Manager Facility Management Staffing Report © 2010
Facility Description
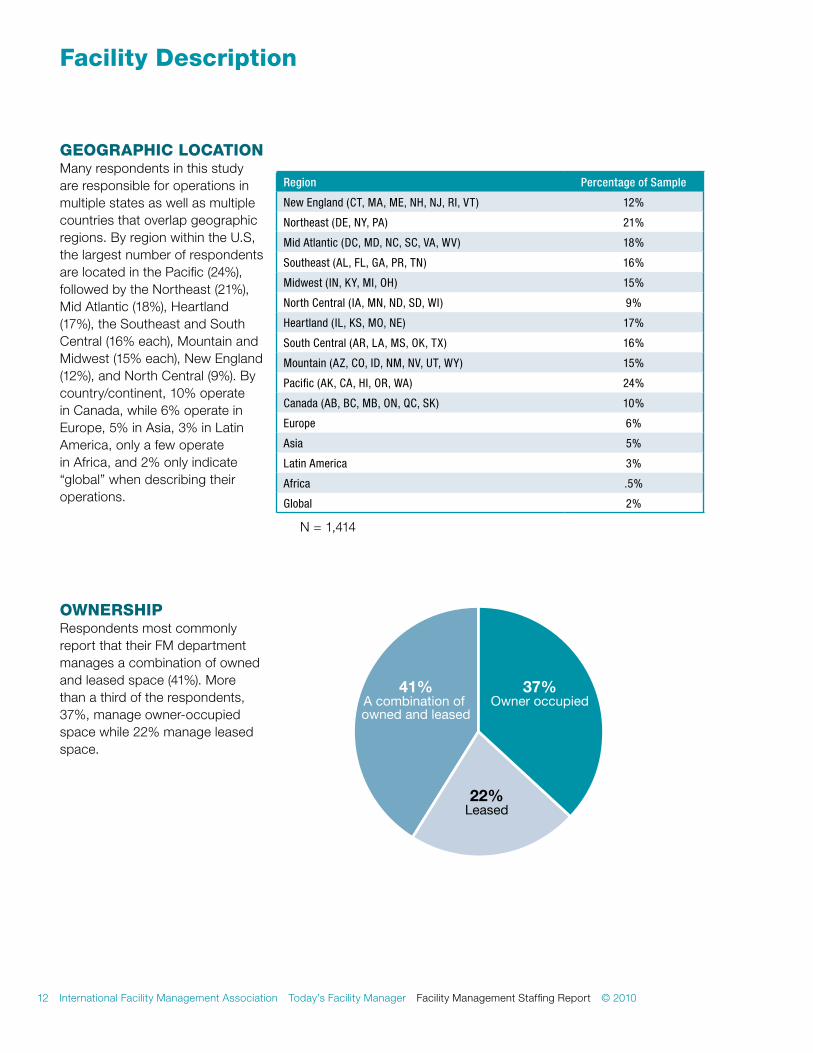
geograPhiC LoCation Many respondents in this study are responsible for operations in multiple states as well as multiple countries that overlap geographic regions. By region within the U.S, the largest number of respondents are located in the Pacific (24%), followed by the Northeast (21%), Mid Atlantic (18%), Heartland (17%), the Southeast and South Central (16% each), Mountain and Midwest (15% each), New England (12%), and North Central (9%). By country/continent, 10% operate in Canada, while 6% operate in Europe, 5% in Asia, 3% in Latin America, only a few operate in Africa, and 2% only indicate “global” when describing their operations.
Region Percentage of Sample
New England (CT, MA, ME, NH, NJ, RI, VT) 12%
Northeast (DE, NY, PA) 21%
Mid Atlantic (DC, MD, NC, SC, VA, WV) 18%
Southeast (AL, FL, GA, PR, TN) 16%
Midwest (IN, KY, MI, OH) 15%
North Central ( IA, MN, ND, SD, WI) 9%
Heartland (IL, KS, MO, NE) 17%
South Central (AR, LA, MS, OK, TX) 16%
Mountain (AZ, CO, ID, NM, NV, UT, WY) 15%
Pacific (AK, CA, HI, OR, WA) 24%
Canada (AB, BC, MB, ON, QC, SK) 10%
Europe 6%
Asia 5%
Latin America 3%
Africa .5%
Global 2%
N = 1,414
ownerShiPRespondents most commonly report that their FM department manages a combination of owned and leased space (41%). More than a third of the respondents, 37%, manage owner-occupied space while 22% manage leased space.
41%A combination of owned and leased
37%Owner occupied
22%Leased
© 2010 Facility Management Staffing Report Today’s Facility Manager International Facility Management Association 13
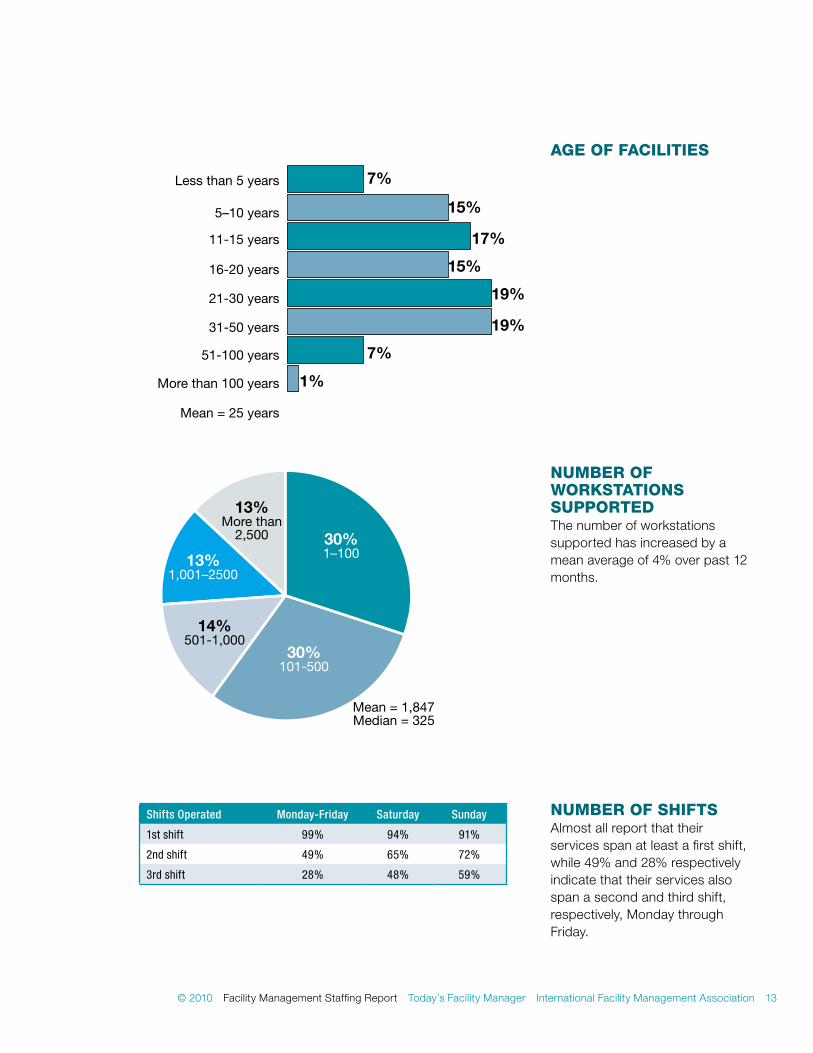
age oF FaCiLitieS
More than 100 years
51-100 years
31-50 years
21-30 years
16-20 years
11-15 years
5–10 years
Less than 5 years
Mean = 25 years
7%
7%
1%
15%
15%
17%
19%
19%
nuMber oF workStationS SuPPorteDThe number of workstations supported has increased by a mean average of 4% over past 12 months.
30%1–100
30%101-500
14%501-1,000
13%1,001–2500
13%More than
2,500
Mean = 1,847Median = 325
nuMber oF ShiFtS Almost all report that their services span at least a first shift, while 49% and 28% respectively indicate that their services also span a second and third shift, respectively, Monday through Friday.
Shifts Operated Monday-Friday Saturday Sunday
1st shift 99% 94% 91%
2nd shift 49% 65% 72%
3rd shift 28% 48% 59%


Staffing the FM Function
16 International Facility Management Association Today’s Facility Manager Facility Management Staffing Report © 2010
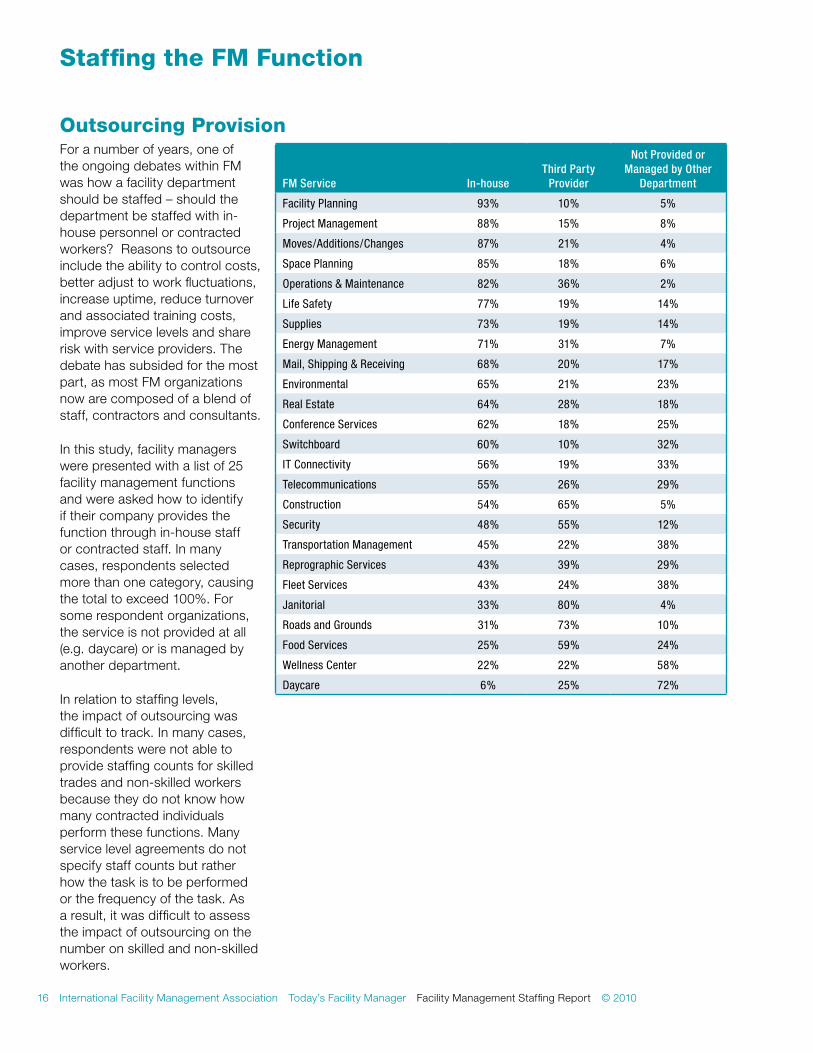
For a number of years, one of the ongoing debates within FM was how a facility department should be staffed – should the department be staffed with in-house personnel or contracted workers? Reasons to outsource include the ability to control costs, better adjust to work fluctuations, increase uptime, reduce turnover and associated training costs, improve service levels and share risk with service providers. The debate has subsided for the most part, as most FM organizations now are composed of a blend of staff, contractors and consultants.
In this study, facility managers were presented with a list of 25 facility management functions and were asked how to identify if their company provides the function through in-house staff or contracted staff. In many cases, respondents selected more than one category, causing the total to exceed 100%. For some respondent organizations, the service is not provided at all (e.g. daycare) or is managed by another department.
In relation to staffing levels, the impact of outsourcing was difficult to track. In many cases, respondents were not able to provide staffing counts for skilled trades and non-skilled workers because they do not know how many contracted individuals perform these functions. Many service level agreements do not specify staff counts but rather how the task is to be performed or the frequency of the task. As a result, it was difficult to assess the impact of outsourcing on the number on skilled and non-skilled workers.
Staffing the FM Function
outsourcing Provision
FM Service In-houseThird Party
Provider
Not Provided or Managed by Other
Department
Facility Planning 93% 10% 5%
Project Management 88% 15% 8%
Moves/Additions/Changes 87% 21% 4%
Space Planning 85% 18% 6%
Operations & Maintenance 82% 36% 2%
Life Safety 77% 19% 14%
Supplies 73% 19% 14%
Energy Management 71% 31% 7%
Mail, Shipping & Receiving 68% 20% 17%
Environmental 65% 21% 23%
Real Estate 64% 28% 18%
Conference Services 62% 18% 25%
Switchboard 60% 10% 32%
IT Connectivity 56% 19% 33%
Telecommunications 55% 26% 29%
Construction 54% 65% 5%
Security 48% 55% 12%
Transportation Management 45% 22% 38%
Reprographic Services 43% 39% 29%
Fleet Services 43% 24% 38%
Janitorial 33% 80% 4%
Roads and Grounds 31% 73% 10%
Food Services 25% 59% 24%
Wellness Center 22% 22% 58%
Daycare 6% 25% 72%
© 2010 Facility Management Staffing Report Today’s Facility Manager International Facility Management Association 17
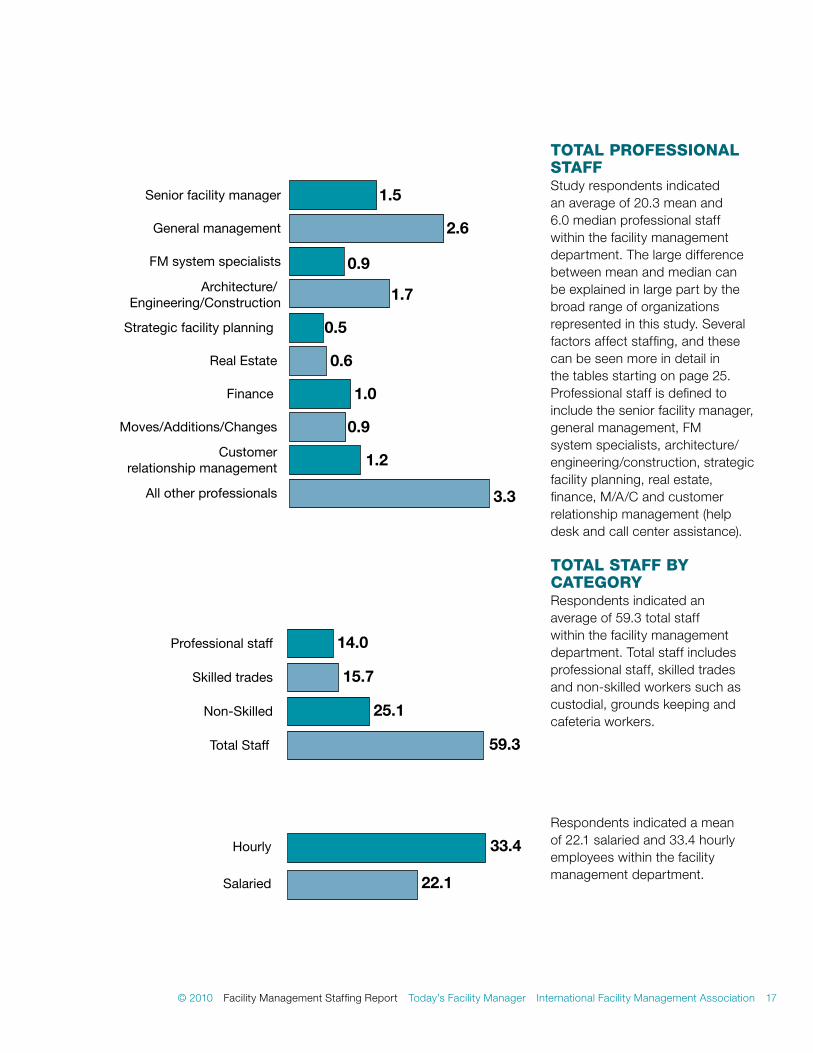
totaL ProFeSSionaL StaFF Study respondents indicated an average of 20.3 mean and 6.0 median professional staff within the facility management department. The large difference between mean and median can be explained in large part by the broad range of organizations represented in this study. Several factors affect staffing, and these can be seen more in detail in the tables starting on page 25. Professional staff is defined to include the senior facility manager, general management, FM system specialists, architecture/engineering/construction, strategic facility planning, real estate, finance, M/A/C and customer relationship management (help desk and call center assistance).
totaL StaFF by Category Respondents indicated an average of 59.3 total staff within the facility management department. Total staff includes professional staff, skilled trades and non-skilled workers such as custodial, grounds keeping and cafeteria workers.
Respondents indicated a mean of 22.1 salaried and 33.4 hourly employees within the facility management department.
Senior facility manager 1.5
General management 2.6
FM system specialists 0.9
Strategic facility planning 0.5
Real Estate 0.6
Finance 1.0
Moves/Additions/Changes 0.9
All other professionals 3.3
Architecture/ Engineering/Construction 1.7
1.2Customerrelationship management
Professional staff
Skilled trades
Non-Skilled
Total Staff
14.0
15.7
25.1
59.3
Hourly 33.4
Salaried 22.1
18 International Facility Management Association Today’s Facility Manager Facility Management Staffing Report © 2010
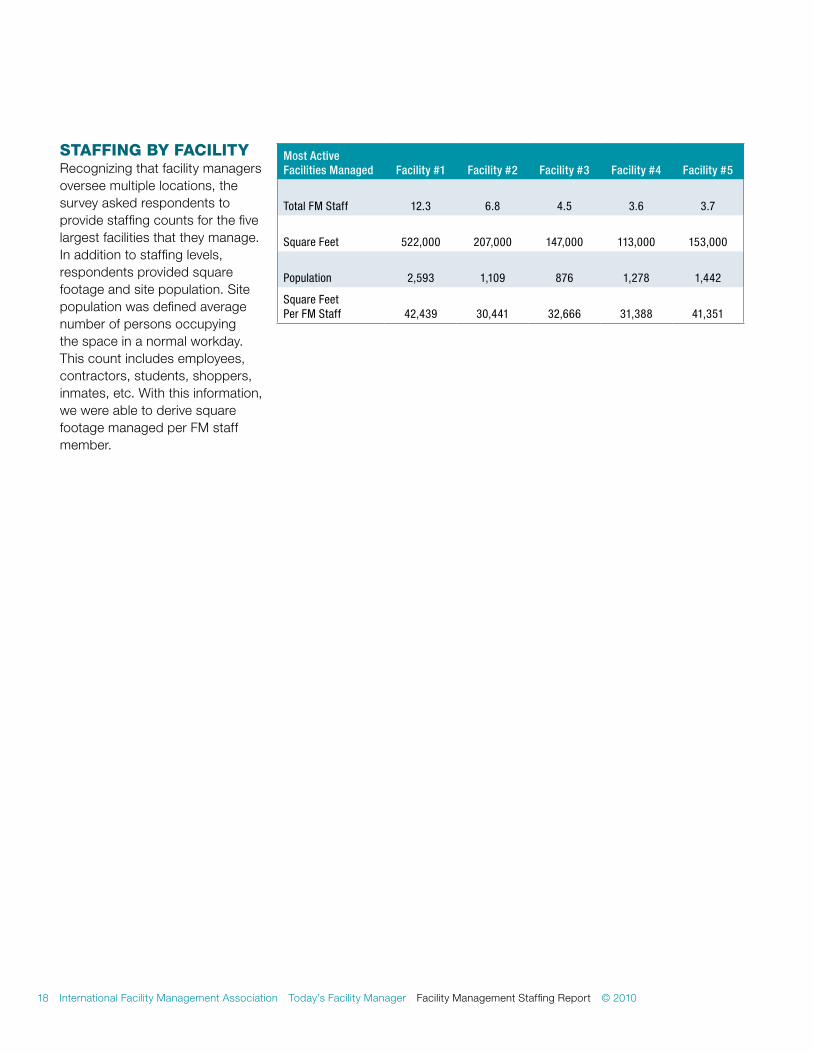
StaFFing by FaCiLityRecognizing that facility managers oversee multiple locations, the survey asked respondents to provide staffing counts for the five largest facilities that they manage. In addition to staffing levels, respondents provided square footage and site population. Site population was defined average number of persons occupying the space in a normal workday. This count includes employees, contractors, students, shoppers, inmates, etc. With this information, we were able to derive square footage managed per FM staff member.
Most Active Facilities Managed Facility #1 Facility #2 Facility #3 Facility #4 Facility #5
Total FM Staff 12.3 6.8 4.5 3.6 3.7
Square Feet 522,000 207,000 147,000 113,000 153,000
Population 2,593 1,109 876 1,278 1,442
Square Feet Per FM Staff 42,439 30,441 32,666 31,388 41,351

Pay Practices
20 International Facility Management Association Today’s Facility Manager Facility Management Staffing Report © 2010
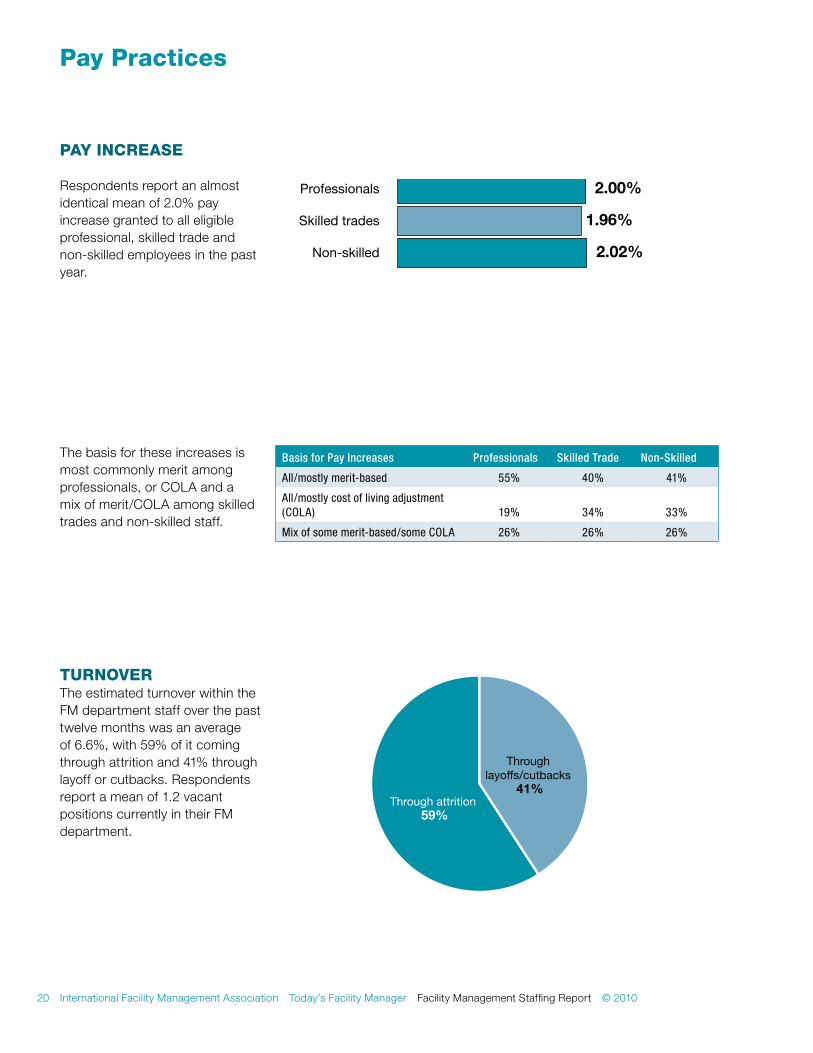
Pay inCreaSe
Respondents report an almost identical mean of 2.0% pay increase granted to all eligible professional, skilled trade and non-skilled employees in the past year.
Pay Practices
The basis for these increases is most commonly merit among professionals, or COLA and a mix of merit/COLA among skilled trades and non-skilled staff.
Basis for Pay Increases Professionals Skilled Trade Non-Skilled
All/mostly merit-based 55% 40% 41%
All/mostly cost of living adjustment (COLA) 19% 34% 33%
Mix of some merit-based/some COLA 26% 26% 26%
turnoverThe estimated turnover within the FM department staff over the past twelve months was an average of 6.6%, with 59% of it coming through attrition and 41% through layoff or cutbacks. Respondents report a mean of 1.2 vacant positions currently in their FM department.
Professionals
Skilled trades
Non-skilled
2.00%
1.96%
2.02%
Through layoffs/cutbacks
41%Through attrition
59%
© 2010 Facility Management Staffing Report Today’s Facility Manager International Facility Management Association 21
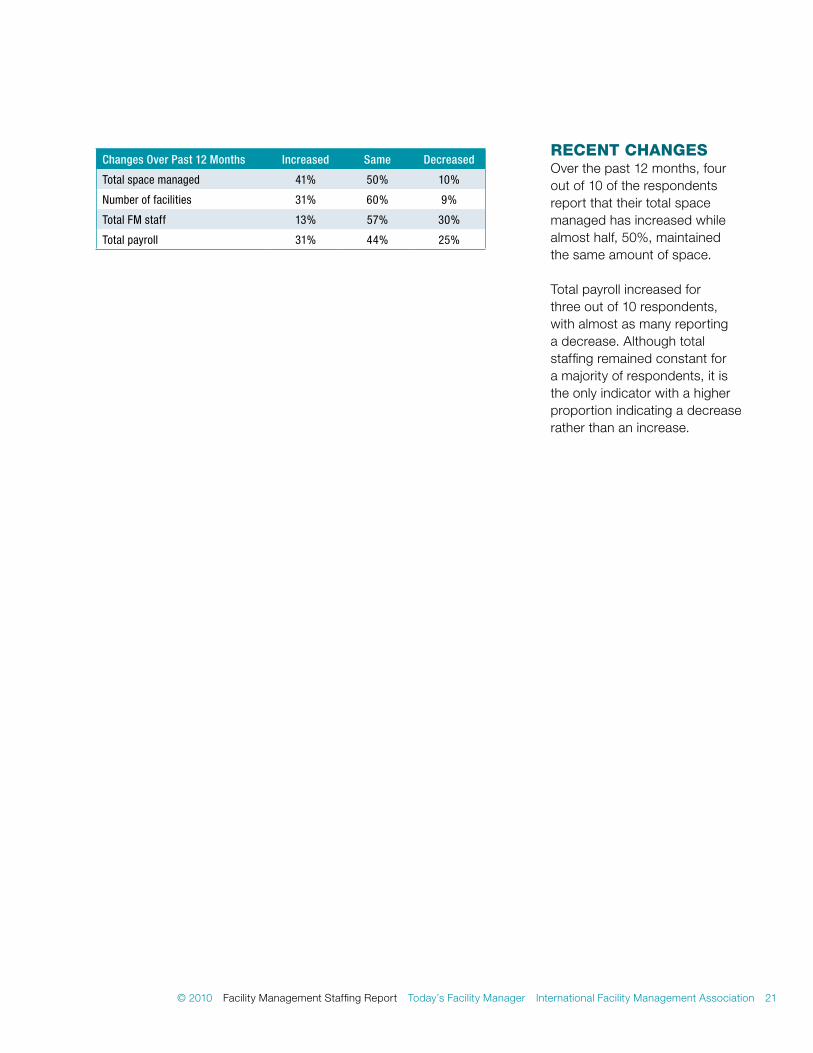
reCent ChangeSOver the past 12 months, four out of 10 of the respondents report that their total space managed has increased while almost half, 50%, maintained the same amount of space.
Total payroll increased for three out of 10 respondents, with almost as many reporting a decrease. Although total staffing remained constant for a majority of respondents, it is the only indicator with a higher proportion indicating a decrease rather than an increase.
Changes Over Past 12 Months Increased Same Decreased
Total space managed 41% 50% 10%
Number of facilities 31% 60% 9%
Total FM staff 13% 57% 30%
Total payroll 31% 44% 25%


Estimate of Total Facility Management Professionals
24 International Facility Management Association Today’s Facility Manager Facility Management Staffing Report © 2010
The majority of this study is dedicated to reporting research findings at the level of a single operation, to help readers understand what factors drive the staffing levels of their peers nationwide and around the world. Another logical application of this research is to determine how many professionals are engaged in facility management today.
Here is the three-step process that was used to estimate total professional facility management staff:
1. Aggregate key statistics from the current survey.
2. Determine what proportion of the total universe these responses comprise.
3. Inflate staffing statistics by an appropriate factor to estimate the actual total number of professional facility managers.
1. From this survey we compiled three specific statistics. After aggregating respondents’ data, there were a total of 18,300 professional staff members working in 134,900 locations/unique buildings, managing 9.91 billion square feet. The survey sample included international contacts, so the results included international data as well. To compensate, the above figures were reduced to reflect probable U.S. only figures. Reducing worldwide responses by 10% yields an estimate of 16,500 U.S. professional facility management
staff (i.e. senior and general managers, etc.) that was accounted for in this study.
2. To estimate the total universe, we used data from the Commercial Buildings Energy Consumption Survey (CBECS), published periodically by the U.S. Energy Information Administration. The U.S. Department of Energy most recently published CBECS data in 2003. At that time CBECS estimated 4.86 million commercial building/locations and 71.66 billion square feet. Applying our estimated U.S. total survey data to this total suggests that survey respondents comprised 2.5% of the total locations, and 12.5% of the total square footage. This makes sense because the majority of the survey respondents, IFMA members and Today’s Facility Manager subscribers, tend to manage large commercial buildings.
3. An inflation factor was used to multiply total U.S. FM professional staff (16,500) to estimate a nationwide total. The inflation factor could range between 8 and 40, depending on whether it is based on total locations or total square footage. Because the distribution and presence of total U.S. facility managers probably resembles the distribution of IFMA members and Today’s Facility Manager readers—that is, there are very few facility managers overseeing operations in many of the smaller buildings in the CBECS universe of commercial buildings (1,000 to 5,000 square feet), we chose to use an inflator
of 24.72. The selected inflator fell between the location and square footage inflators.
Using this inflation factor, we estimate a total of 408,000 total facility managers in the U.S. Once the U.S. Energy Information Administration releases its 2007 CBECS data set, it would be interesting to see if the estimate increases. If similar commercial building data existed in other countries, this data could be extrapolated further.
eConoMiC iMPaCt/Short terM StaFFing ChangeSWe were sensitive to the possibility that the economy has had a strong effect that could temporarily depress the estimates that were extrapolated. There is evidence of a strong economic impact. An estimated average of 41% of total turnover is due to layoffs/cutbacks. These positions may be gone forever; respondents report a mean of 1.2 vacant positions. The net change in total FM positions (not an average but rather the difference between those who indicate an increase compared to those who indicate a decrease) is a decrease among 17%, while the net change in total payroll is an increase among 5%. In general, facility managers are being asked to do more with less, as 22% of respondents report an increase in square footage managed rather than a decrease.
estimate total u.S. Facility Management Professionals

Detailed Data Tables by Key Characteristics
26 International Facility Management Association Today’s Facility Manager Facility Management Staffing Report © 2010
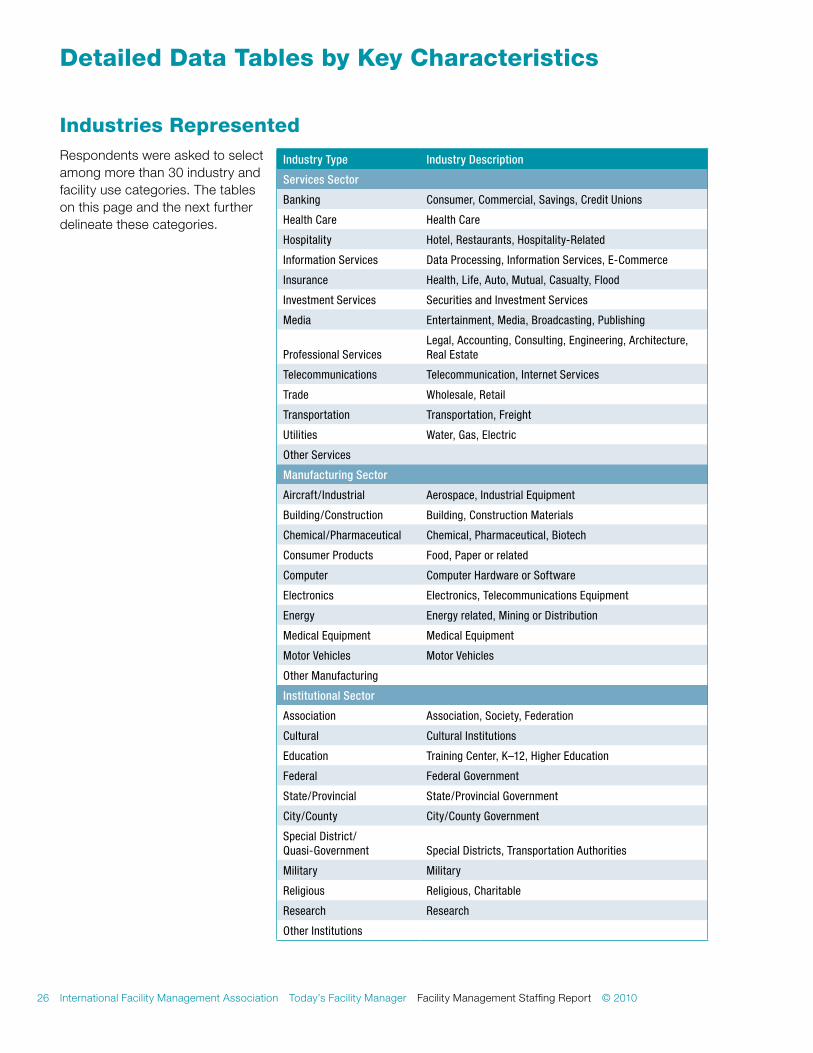
industries representedRespondents were asked to select among more than 30 industry and facility use categories. The tables on this page and the next further delineate these categories.
Industry Type Industry Description
Services Sector
Banking Consumer, Commercial, Savings, Credit Unions
Health Care Health Care
Hospitality Hotel, Restaurants, Hospitality-Related
Information Services Data Processing, Information Services, E-Commerce
Insurance Health, Life, Auto, Mutual, Casualty, Flood
Investment Services Securities and Investment Services
Media Entertainment, Media, Broadcasting, Publishing
Professional ServicesLegal, Accounting, Consulting, Engineering, Architecture, Real Estate
Telecommunications Telecommunication, Internet Services
Trade Wholesale, Retail
Transportation Transportation, Freight
Utilities Water, Gas, Electric
Other Services
Manufacturing Sector
Aircraft/Industrial Aerospace, Industrial Equipment
Building/Construction Building, Construction Materials
Chemical/Pharmaceutical Chemical, Pharmaceutical, Biotech
Consumer Products Food, Paper or related
Computer Computer Hardware or Software
Electronics Electronics, Telecommunications Equipment
Energy Energy related, Mining or Distribution
Medical Equipment Medical Equipment
Motor Vehicles Motor Vehicles
Other Manufacturing
Institutional Sector
Association Association, Society, Federation
Cultural Cultural Institutions
Education Training Center, K–12, Higher Education
Federal Federal Government
State/Provincial State/Provincial Government
City/County City/County Government
Special District/ Quasi-Government Special Districts, Transportation Authorities
Military Military
Religious Religious, Charitable
Research Research
Other Institutions
Detailed Data tables by key Characteristics
© 2010 Facility Management Staffing Report Today’s Facility Manager International Facility Management Association 27
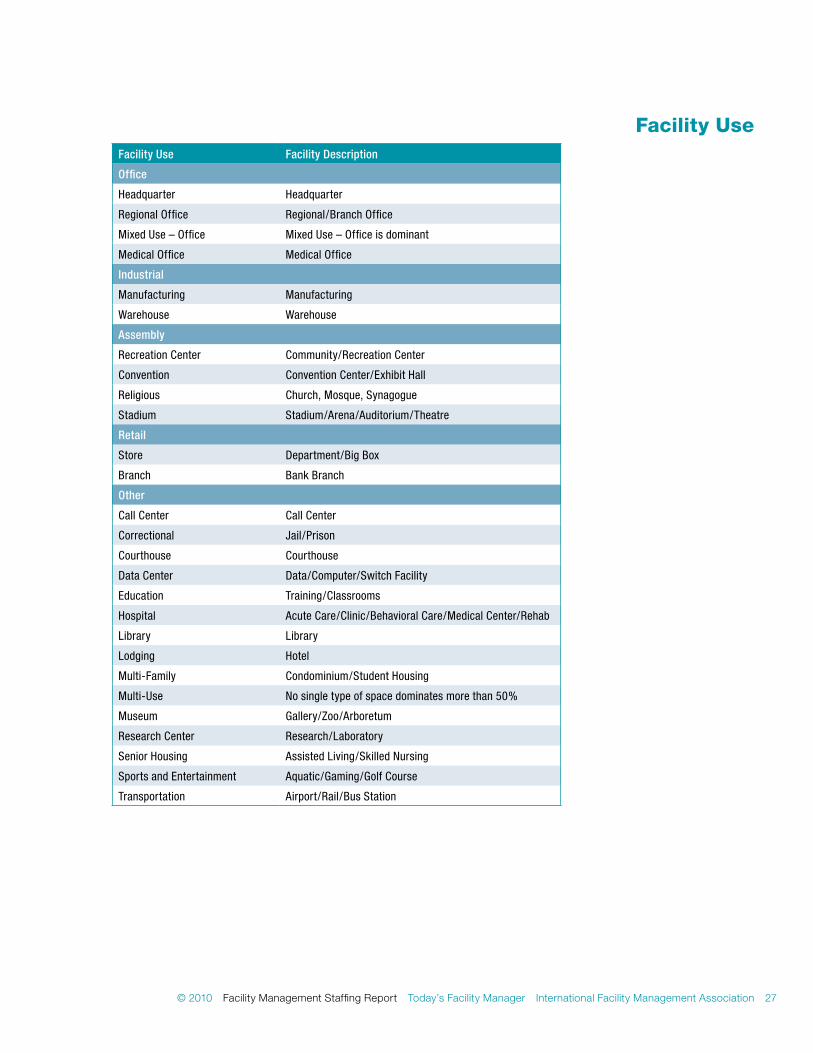
Facility Use Facility Description
Office
Headquarter Headquarter
Regional Office Regional/Branch Office
Mixed Use – Office Mixed Use – Office is dominant
Medical Office Medical Office
Industrial
Manufacturing Manufacturing
Warehouse Warehouse
Assembly
Recreation Center Community/Recreation Center
Convention Convention Center/Exhibit Hall
Religious Church, Mosque, Synagogue
Stadium Stadium/Arena/Auditorium/Theatre
Retail
Store Department/Big Box
Branch Bank Branch
Other
Call Center Call Center
Correctional Jail/Prison
Courthouse Courthouse
Data Center Data/Computer/Switch Facility
Education Training/Classrooms
Hospital Acute Care/Clinic/Behavioral Care/Medical Center/Rehab
Library Library
Lodging Hotel
Multi-Family Condominium/Student Housing
Multi-Use No single type of space dominates more than 50%
Museum Gallery/Zoo/Arboretum
Research Center Research/Laboratory
Senior Housing Assisted Living/Skilled Nursing
Sports and Entertainment Aquatic/Gaming/Golf Course
Transportation Airport/Rail/Bus Station
Facility use
28 International Facility Management Association Today’s Facility Manager Facility Management Staffing Report © 2010
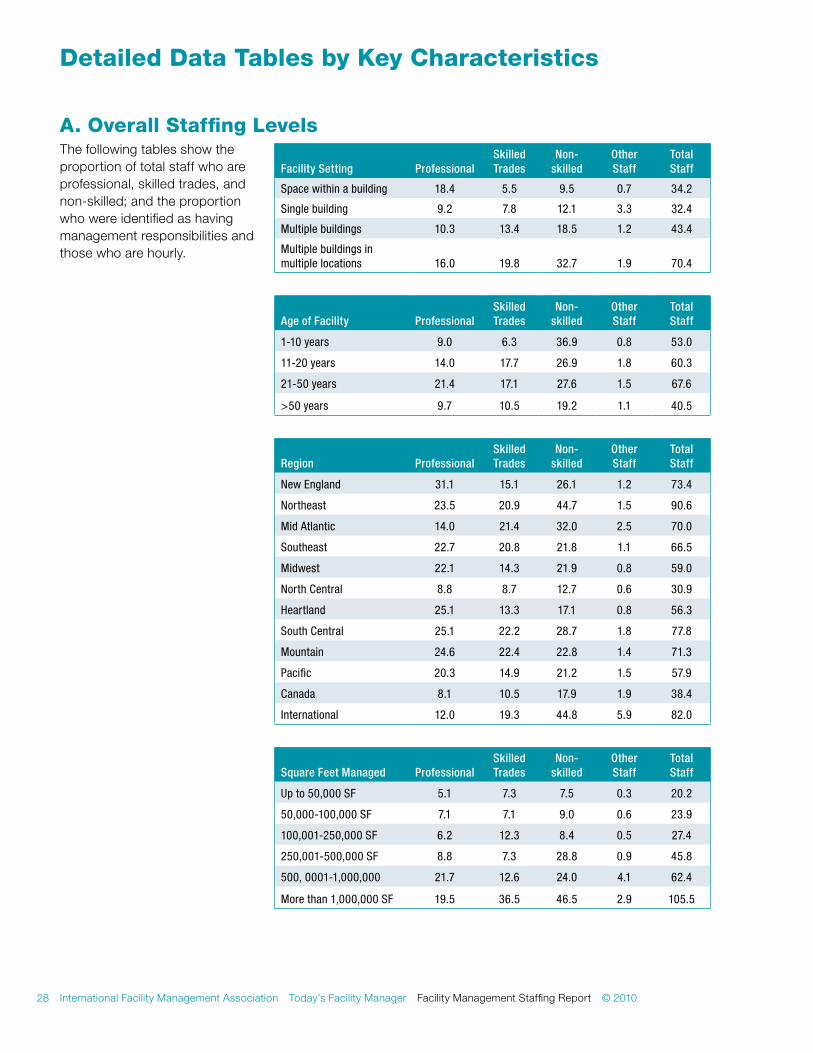
The following tables show the proportion of total staff who are professional, skilled trades, and non-skilled; and the proportion who were identified as having management responsibilities and those who are hourly.
Facility Setting Professional Skilled Trades
Non-skilled
Other Staff
Total Staff
Space within a building 18.4 5.5 9.5 0.7 34.2
Single building 9.2 7.8 12.1 3.3 32.4
Multiple buildings 10.3 13.4 18.5 1.2 43.4
Multiple buildings in multiple locations 16.0 19.8 32.7 1.9 70.4
Age of Facility Professional Skilled Trades
Non-skilled
Other Staff
Total Staff
1-10 years 9.0 6.3 36.9 0.8 53.0
11-20 years 14.0 17.7 26.9 1.8 60.3
21-50 years 21.4 17.1 27.6 1.5 67.6
>50 years 9.7 10.5 19.2 1.1 40.5
Region Professional Skilled Trades
Non-skilled
Other Staff
Total Staff
New England 31.1 15.1 26.1 1.2 73.4
Northeast 23.5 20.9 44.7 1.5 90.6
Mid Atlantic 14.0 21.4 32.0 2.5 70.0
Southeast 22.7 20.8 21.8 1.1 66.5
Midwest 22.1 14.3 21.9 0.8 59.0
North Central 8.8 8.7 12.7 0.6 30.9
Heartland 25.1 13.3 17.1 0.8 56.3
South Central 25.1 22.2 28.7 1.8 77.8
Mountain 24.6 22.4 22.8 1.4 71.3
Pacific 20.3 14.9 21.2 1.5 57.9
Canada 8.1 10.5 17.9 1.9 38.4
International 12.0 19.3 44.8 5.9 82.0
Square Feet Managed Professional Skilled Trades
Non-skilled
Other Staff
Total Staff
Up to 50,000 SF 5.1 7.3 7.5 0.3 20.2
50,000-100,000 SF 7.1 7.1 9.0 0.6 23.9
100,001-250,000 SF 6.2 12.3 8.4 0.5 27.4
250,001-500,000 SF 8.8 7.3 28.8 0.9 45.8
500, 0001-1,000,000 21.7 12.6 24.0 4.1 62.4
More than 1,000,000 SF 19.5 36.5 46.5 2.9 105.5
a. overall Staffing Levels
Detailed Data tables by key Characteristics
© 2010 Facility Management Staffing Report Today’s Facility Manager International Facility Management Association 29
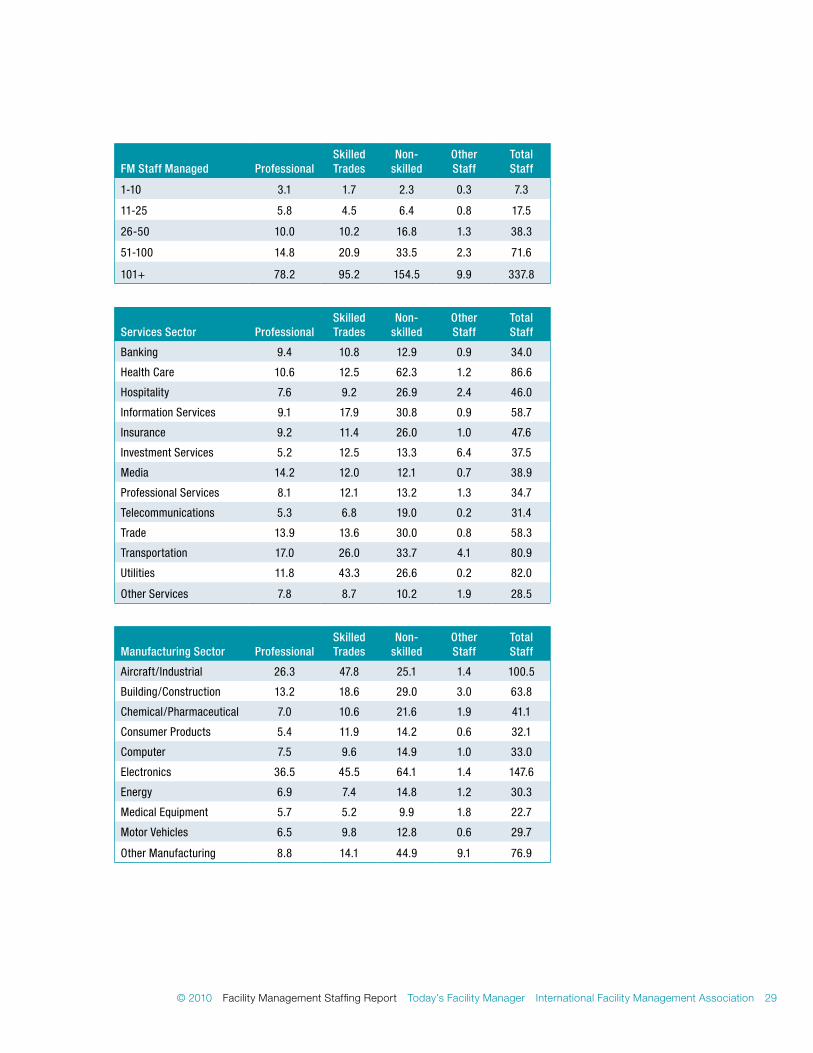
FM Staff Managed Professional Skilled Trades
Non-skilled
Other Staff
Total Staff
1-10 3.1 1.7 2.3 0.3 7.3
11-25 5.8 4.5 6.4 0.8 17.5
26-50 10.0 10.2 16.8 1.3 38.3
51-100 14.8 20.9 33.5 2.3 71.6
101+ 78.2 95.2 154.5 9.9 337.8
Services Sector Professional Skilled Trades
Non-skilled
Other Staff
Total Staff
Banking 9.4 10.8 12.9 0.9 34.0
Health Care 10.6 12.5 62.3 1.2 86.6
Hospitality 7.6 9.2 26.9 2.4 46.0
Information Services 9.1 17.9 30.8 0.9 58.7
Insurance 9.2 11.4 26.0 1.0 47.6
Investment Services 5.2 12.5 13.3 6.4 37.5
Media 14.2 12.0 12.1 0.7 38.9
Professional Services 8.1 12.1 13.2 1.3 34.7
Telecommunications 5.3 6.8 19.0 0.2 31.4
Trade 13.9 13.6 30.0 0.8 58.3
Transportation 17.0 26.0 33.7 4.1 80.9
Utilities 11.8 43.3 26.6 0.2 82.0
Other Services 7.8 8.7 10.2 1.9 28.5
Manufacturing Sector Professional Skilled Trades
Non-skilled
Other Staff
Total Staff
Aircraft/Industrial 26.3 47.8 25.1 1.4 100.5
Building/Construction 13.2 18.6 29.0 3.0 63.8
Chemical/Pharmaceutical 7.0 10.6 21.6 1.9 41.1
Consumer Products 5.4 11.9 14.2 0.6 32.1
Computer 7.5 9.6 14.9 1.0 33.0
Electronics 36.5 45.5 64.1 1.4 147.6
Energy 6.9 7.4 14.8 1.2 30.3
Medical Equipment 5.7 5.2 9.9 1.8 22.7
Motor Vehicles 6.5 9.8 12.8 0.6 29.7
Other Manufacturing 8.8 14.1 44.9 9.1 76.9
30 International Facility Management Association Today’s Facility Manager Facility Management Staffing Report © 2010
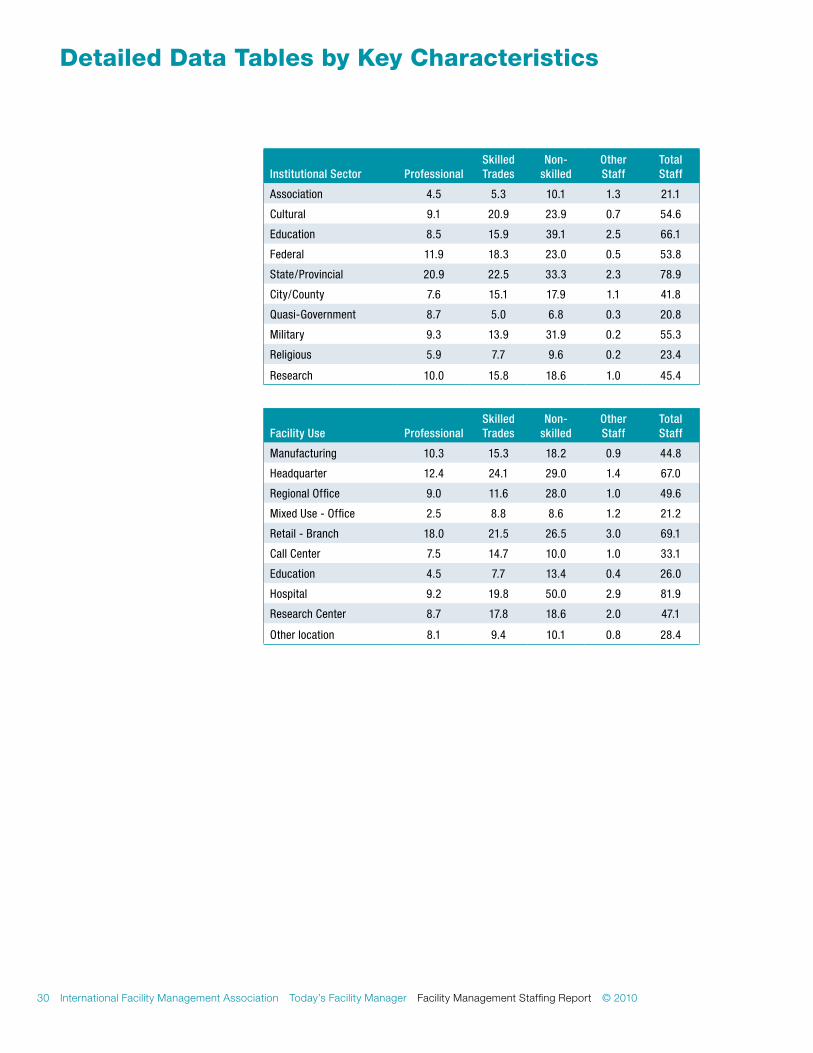
Institutional Sector Professional Skilled Trades
Non-skilled
Other Staff
Total Staff
Association 4.5 5.3 10.1 1.3 21.1
Cultural 9.1 20.9 23.9 0.7 54.6
Education 8.5 15.9 39.1 2.5 66.1
Federal 11.9 18.3 23.0 0.5 53.8
State/Provincial 20.9 22.5 33.3 2.3 78.9
City/County 7.6 15.1 17.9 1.1 41.8
Quasi-Government 8.7 5.0 6.8 0.3 20.8
Military 9.3 13.9 31.9 0.2 55.3
Religious 5.9 7.7 9.6 0.2 23.4
Research 10.0 15.8 18.6 1.0 45.4
Facility Use Professional Skilled Trades
Non-skilled
Other Staff
Total Staff
Manufacturing 10.3 15.3 18.2 0.9 44.8
Headquarter 12.4 24.1 29.0 1.4 67.0
Regional Office 9.0 11.6 28.0 1.0 49.6
Mixed Use - Office 2.5 8.8 8.6 1.2 21.2
Retail - Branch 18.0 21.5 26.5 3.0 69.1
Call Center 7.5 14.7 10.0 1.0 33.1
Education 4.5 7.7 13.4 0.4 26.0
Hospital 9.2 19.8 50.0 2.9 81.9
Research Center 8.7 17.8 18.6 2.0 47.1
Other location 8.1 9.4 10.1 0.8 28.4
Detailed Data tables by key Characteristics
© 2010 Facility Management Staffing Report Today’s Facility Manager International Facility Management Association 31
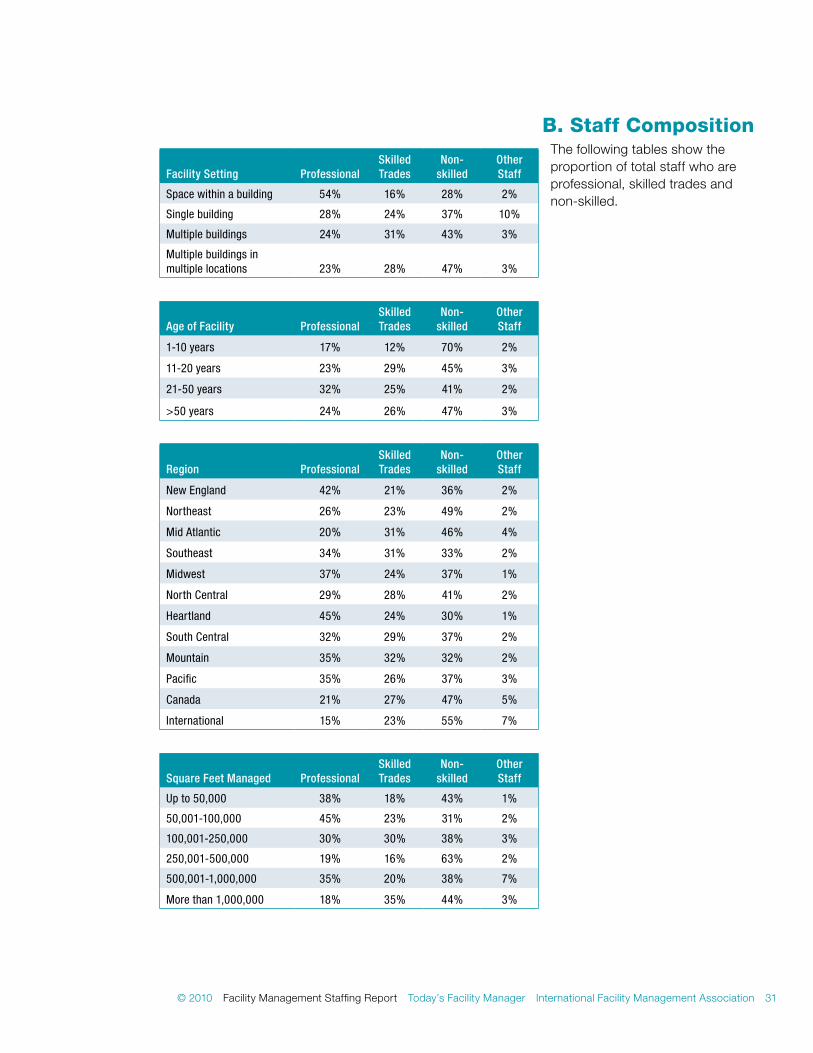
Facility Setting Professional Skilled Trades
Non-skilled
Other Staff
Space within a building 54% 16% 28% 2%
Single building 28% 24% 37% 10%
Multiple buildings 24% 31% 43% 3%
Multiple buildings in multiple locations 23% 28% 47% 3%
Age of Facility Professional Skilled Trades
Non-skilled
Other Staff
1-10 years 17% 12% 70% 2%
11-20 years 23% 29% 45% 3%
21-50 years 32% 25% 41% 2%
>50 years 24% 26% 47% 3%
Region Professional Skilled Trades
Non-skilled
Other Staff
New England 42% 21% 36% 2%
Northeast 26% 23% 49% 2%
Mid Atlantic 20% 31% 46% 4%
Southeast 34% 31% 33% 2%
Midwest 37% 24% 37% 1%
North Central 29% 28% 41% 2%
Heartland 45% 24% 30% 1%
South Central 32% 29% 37% 2%
Mountain 35% 32% 32% 2%
Pacific 35% 26% 37% 3%
Canada 21% 27% 47% 5%
International 15% 23% 55% 7%
Square Feet Managed Professional Skilled Trades
Non-skilled
Other Staff
Up to 50,000 38% 18% 43% 1%
50,001-100,000 45% 23% 31% 2%
100,001-250,000 30% 30% 38% 3%
250,001-500,000 19% 16% 63% 2%
500,001-1,000,000 35% 20% 38% 7%
More than 1,000,000 18% 35% 44% 3%
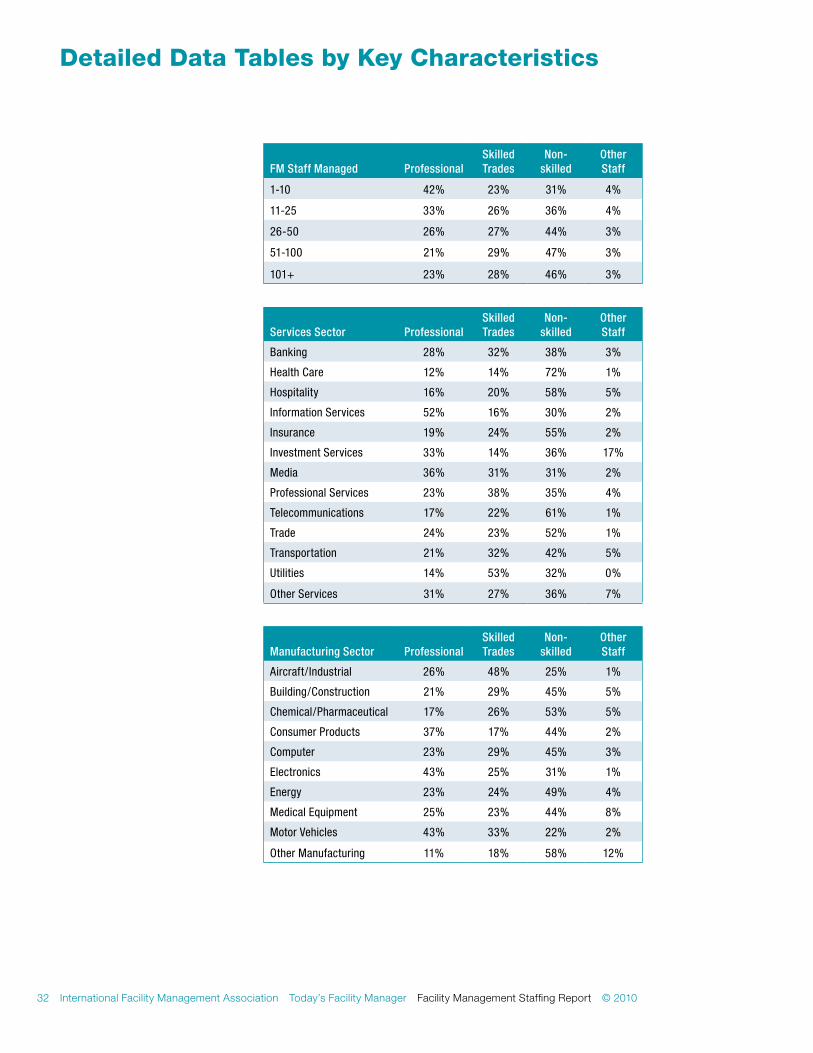
The following tables show the proportion of total staff who are professional, skilled trades and non-skilled.
b. Staff Composition
32 International Facility Management Association Today’s Facility Manager Facility Management Staffing Report © 2010
FM Staff Managed Professional Skilled Trades
Non-skilled
Other Staff
1-10 42% 23% 31% 4%
11-25 33% 26% 36% 4%
26-50 26% 27% 44% 3%
51-100 21% 29% 47% 3%
101+ 23% 28% 46% 3%
Services Sector Professional Skilled Trades
Non-skilled
Other Staff
Banking 28% 32% 38% 3%
Health Care 12% 14% 72% 1%
Hospitality 16% 20% 58% 5%
Information Services 52% 16% 30% 2%
Insurance 19% 24% 55% 2%
Investment Services 33% 14% 36% 17%
Media 36% 31% 31% 2%
Professional Services 23% 38% 35% 4%
Telecommunications 17% 22% 61% 1%
Trade 24% 23% 52% 1%
Transportation 21% 32% 42% 5%
Utilities 14% 53% 32% 0%
Other Services 31% 27% 36% 7%
Manufacturing Sector Professional Skilled Trades
Non-skilled
Other Staff
Aircraft/Industrial 26% 48% 25% 1%
Building/Construction 21% 29% 45% 5%
Chemical/Pharmaceutical 17% 26% 53% 5%
Consumer Products 37% 17% 44% 2%
Computer 23% 29% 45% 3%
Electronics 43% 25% 31% 1%
Energy 23% 24% 49% 4%
Medical Equipment 25% 23% 44% 8%
Motor Vehicles 43% 33% 22% 2%
Other Manufacturing 11% 18% 58% 12%
Detailed Data tables by key Characteristics
© 2010 Facility Management Staffing Report Today’s Facility Manager International Facility Management Association 33
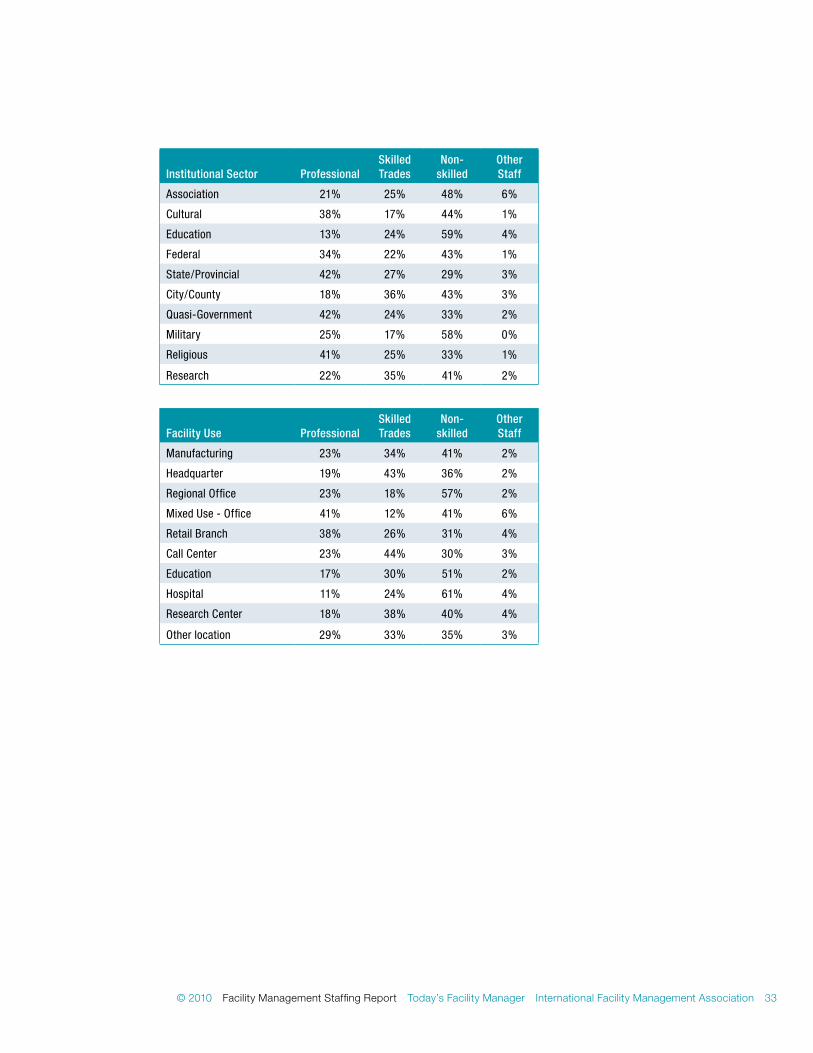
Institutional Sector Professional Skilled Trades
Non-skilled
Other Staff
Association 21% 25% 48% 6%
Cultural 38% 17% 44% 1%
Education 13% 24% 59% 4%
Federal 34% 22% 43% 1%
State/Provincial 42% 27% 29% 3%
City/County 18% 36% 43% 3%
Quasi-Government 42% 24% 33% 2%
Military 25% 17% 58% 0%
Religious 41% 25% 33% 1%
Research 22% 35% 41% 2%
Facility Use Professional Skilled Trades
Non-skilled
Other Staff
Manufacturing 23% 34% 41% 2%
Headquarter 19% 43% 36% 2%
Regional Office 23% 18% 57% 2%
Mixed Use - Office 41% 12% 41% 6%
Retail Branch 38% 26% 31% 4%
Call Center 23% 44% 30% 3%
Education 17% 30% 51% 2%
Hospital 11% 24% 61% 4%
Research Center 18% 38% 40% 4%
Other location 29% 33% 35% 3%
34 International Facility Management Association Today’s Facility Manager Facility Management Staffing Report © 2010
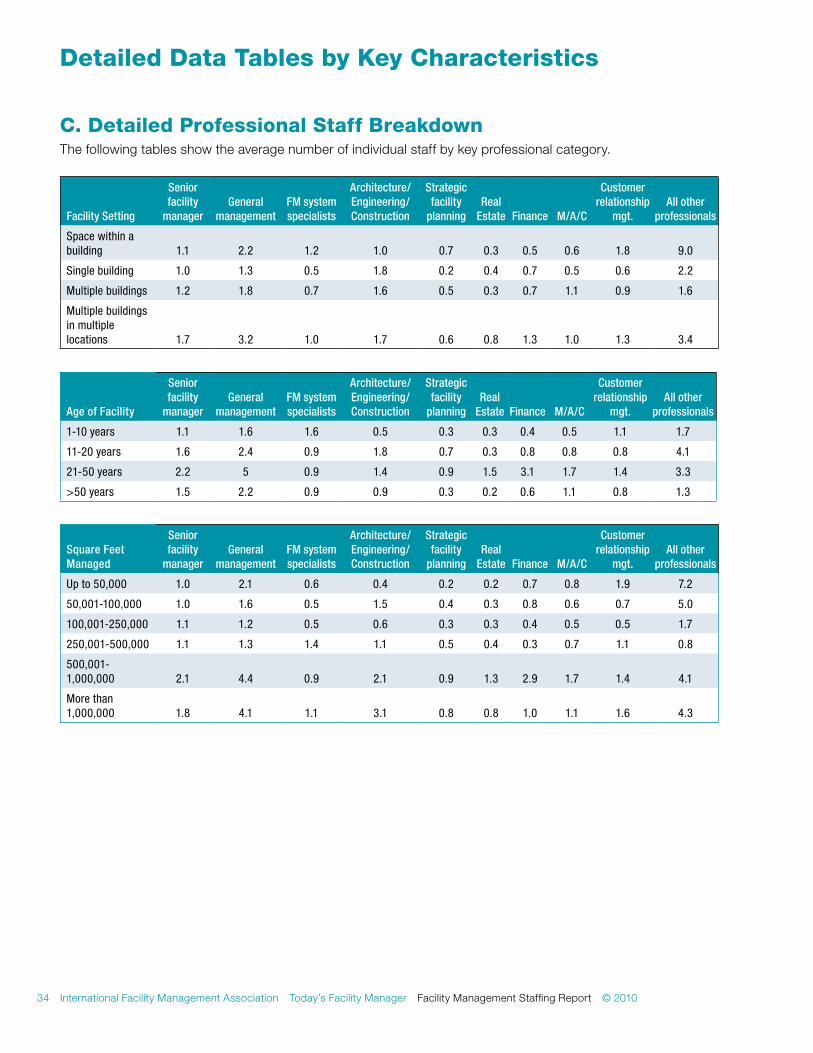
The following tables show the average number of individual staff by key professional category.
Facility Setting
Senior facility
managerGeneral
managementFM system specialists
Architecture/ Engineering/ Construction
Strategic facility
planning Real
Estate Finance M/A/C
Customer relationship
mgt. All other
professionals
Space within a building 1.1 2.2 1.2 1.0 0.7 0.3 0.5 0.6 1.8 9.0
Single building 1.0 1.3 0.5 1.8 0.2 0.4 0.7 0.5 0.6 2.2
Multiple buildings 1.2 1.8 0.7 1.6 0.5 0.3 0.7 1.1 0.9 1.6
Multiple buildings in multiple locations 1.7 3.2 1.0 1.7 0.6 0.8 1.3 1.0 1.3 3.4
Age of Facility
Senior facility
managerGeneral
managementFM system specialists
Architecture/ Engineering/ Construction
Strategic facility
planning Real
Estate Finance M/A/C
Customer relationship
mgt. All other
professionals
1-10 years 1.1 1.6 1.6 0.5 0.3 0.3 0.4 0.5 1.1 1.7
11-20 years 1.6 2.4 0.9 1.8 0.7 0.3 0.8 0.8 0.8 4.1
21-50 years 2.2 5 0.9 1.4 0.9 1.5 3.1 1.7 1.4 3.3
>50 years 1.5 2.2 0.9 0.9 0.3 0.2 0.6 1.1 0.8 1.3
Square Feet Managed
Senior facility
managerGeneral
managementFM system specialists
Architecture/ Engineering/ Construction
Strategic facility
planning Real
Estate Finance M/A/C
Customer relationship
mgt. All other
professionals
Up to 50,000 1.0 2.1 0.6 0.4 0.2 0.2 0.7 0.8 1.9 7.2
50,001-100,000 1.0 1.6 0.5 1.5 0.4 0.3 0.8 0.6 0.7 5.0
100,001-250,000 1.1 1.2 0.5 0.6 0.3 0.3 0.4 0.5 0.5 1.7
250,001-500,000 1.1 1.3 1.4 1.1 0.5 0.4 0.3 0.7 1.1 0.8
500,001-1,000,000 2.1 4.4 0.9 2.1 0.9 1.3 2.9 1.7 1.4 4.1
More than 1,000,000 1.8 4.1 1.1 3.1 0.8 0.8 1.0 1.1 1.6 4.3
C. Detailed Professional Staff breakdown
Detailed Data tables by key Characteristics
© 2010 Facility Management Staffing Report Today’s Facility Manager International Facility Management Association 35
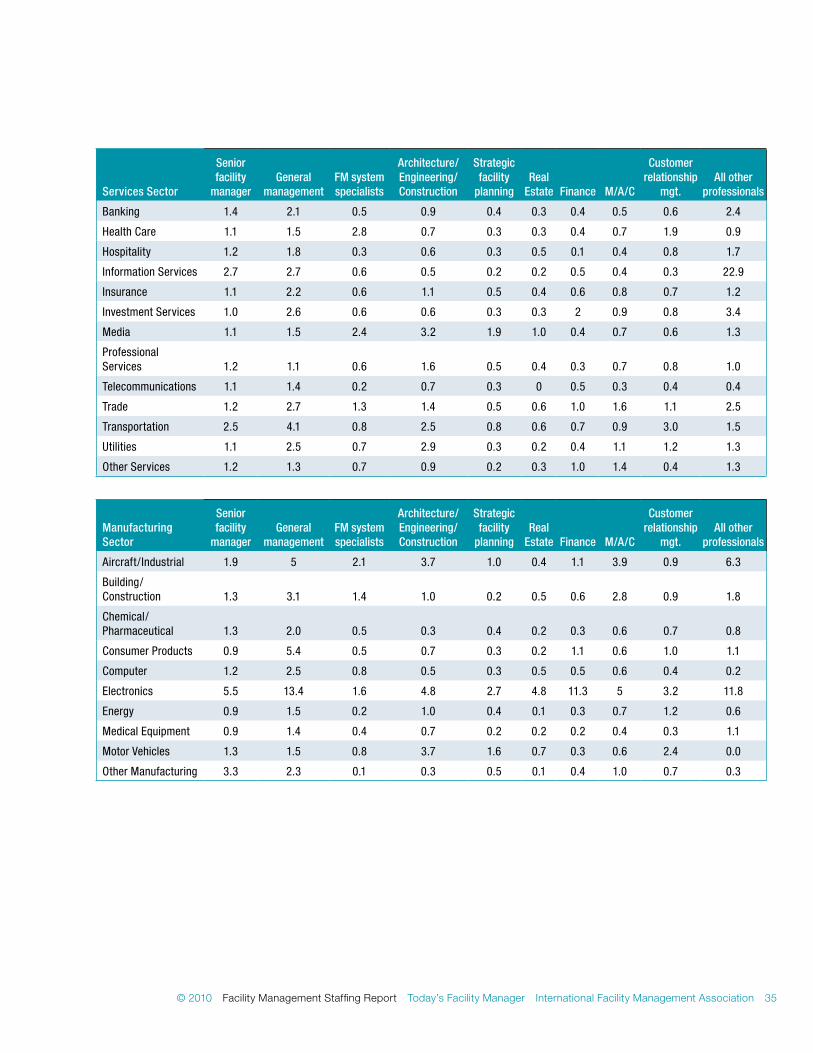
Services Sector
Senior facility
managerGeneral
managementFM system specialists
Architecture/ Engineering/ Construction
Strategic facility
planning Real
Estate Finance M/A/C
Customer relationship
mgt. All other
professionals
Banking 1.4 2.1 0.5 0.9 0.4 0.3 0.4 0.5 0.6 2.4
Health Care 1.1 1.5 2.8 0.7 0.3 0.3 0.4 0.7 1.9 0.9
Hospitality 1.2 1.8 0.3 0.6 0.3 0.5 0.1 0.4 0.8 1.7
Information Services 2.7 2.7 0.6 0.5 0.2 0.2 0.5 0.4 0.3 22.9
Insurance 1.1 2.2 0.6 1.1 0.5 0.4 0.6 0.8 0.7 1.2
Investment Services 1.0 2.6 0.6 0.6 0.3 0.3 2 0.9 0.8 3.4
Media 1.1 1.5 2.4 3.2 1.9 1.0 0.4 0.7 0.6 1.3
Professional Services 1.2 1.1 0.6 1.6 0.5 0.4 0.3 0.7 0.8 1.0
Telecommunications 1.1 1.4 0.2 0.7 0.3 0 0.5 0.3 0.4 0.4
Trade 1.2 2.7 1.3 1.4 0.5 0.6 1.0 1.6 1.1 2.5
Transportation 2.5 4.1 0.8 2.5 0.8 0.6 0.7 0.9 3.0 1.5
Utilities 1.1 2.5 0.7 2.9 0.3 0.2 0.4 1.1 1.2 1.3
Other Services 1.2 1.3 0.7 0.9 0.2 0.3 1.0 1.4 0.4 1.3
Manufacturing Sector
Senior facility
managerGeneral
managementFM system specialists
Architecture/ Engineering/ Construction
Strategic facility
planning Real
Estate Finance M/A/C
Customer relationship
mgt. All other
professionals
Aircraft/Industrial 1.9 5 2.1 3.7 1.0 0.4 1.1 3.9 0.9 6.3
Building/Construction 1.3 3.1 1.4 1.0 0.2 0.5 0.6 2.8 0.9 1.8
Chemical/Pharmaceutical 1.3 2.0 0.5 0.3 0.4 0.2 0.3 0.6 0.7 0.8
Consumer Products 0.9 5.4 0.5 0.7 0.3 0.2 1.1 0.6 1.0 1.1
Computer 1.2 2.5 0.8 0.5 0.3 0.5 0.5 0.6 0.4 0.2
Electronics 5.5 13.4 1.6 4.8 2.7 4.8 11.3 5 3.2 11.8
Energy 0.9 1.5 0.2 1.0 0.4 0.1 0.3 0.7 1.2 0.6
Medical Equipment 0.9 1.4 0.4 0.7 0.2 0.2 0.2 0.4 0.3 1.1
Motor Vehicles 1.3 1.5 0.8 3.7 1.6 0.7 0.3 0.6 2.4 0.0
Other Manufacturing 3.3 2.3 0.1 0.3 0.5 0.1 0.4 1.0 0.7 0.3
36 International Facility Management Association Today’s Facility Manager Facility Management Staffing Report © 2010
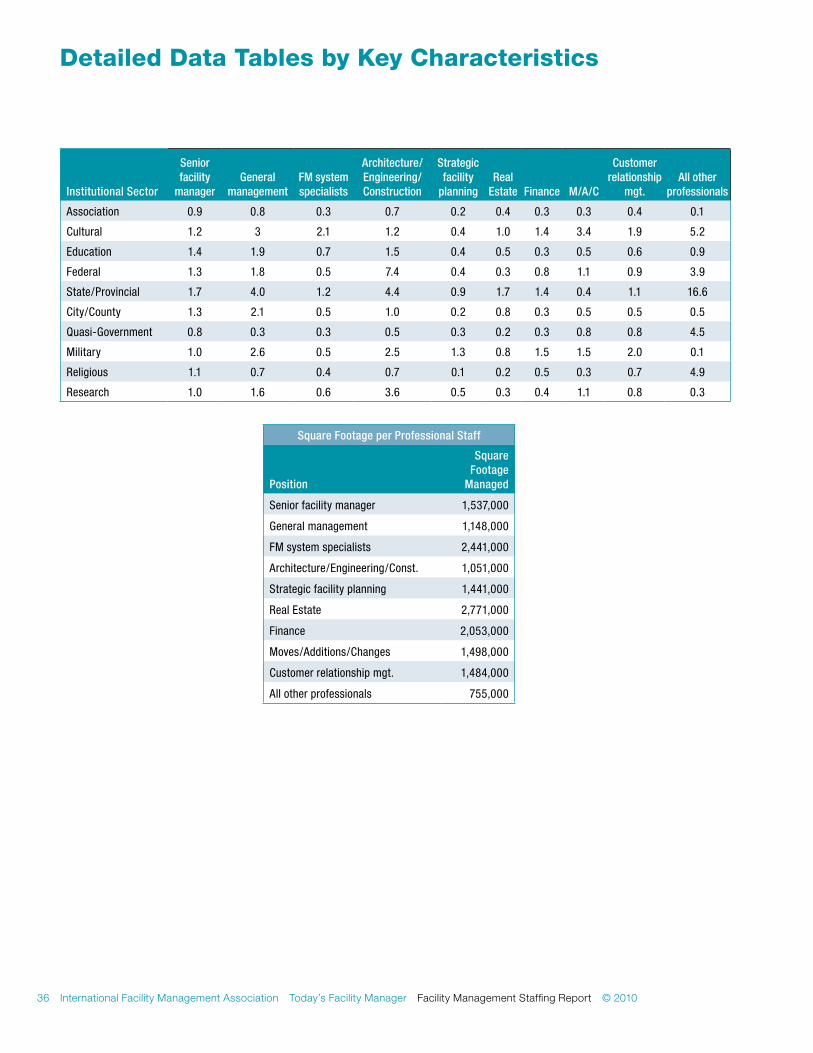
Institutional Sector
Senior facility
managerGeneral
managementFM system specialists
Architecture/ Engineering/ Construction
Strategic facility
planning Real
Estate Finance M/A/C
Customer relationship
mgt. All other
professionals
Association 0.9 0.8 0.3 0.7 0.2 0.4 0.3 0.3 0.4 0.1
Cultural 1.2 3 2.1 1.2 0.4 1.0 1.4 3.4 1.9 5.2
Education 1.4 1.9 0.7 1.5 0.4 0.5 0.3 0.5 0.6 0.9
Federal 1.3 1.8 0.5 7.4 0.4 0.3 0.8 1.1 0.9 3.9
State/Provincial 1.7 4.0 1.2 4.4 0.9 1.7 1.4 0.4 1.1 16.6
City/County 1.3 2.1 0.5 1.0 0.2 0.8 0.3 0.5 0.5 0.5
Quasi-Government 0.8 0.3 0.3 0.5 0.3 0.2 0.3 0.8 0.8 4.5
Military 1.0 2.6 0.5 2.5 1.3 0.8 1.5 1.5 2.0 0.1
Religious 1.1 0.7 0.4 0.7 0.1 0.2 0.5 0.3 0.7 4.9
Research 1.0 1.6 0.6 3.6 0.5 0.3 0.4 1.1 0.8 0.3
Square Footage per Professional Staff
Position
Square Footage
Managed
Senior facility manager 1,537,000
General management 1,148,000
FM system specialists 2,441,000
Architecture/Engineering/Const. 1,051,000
Strategic facility planning 1,441,000
Real Estate 2,771,000
Finance 2,053,000
Moves/Additions/Changes 1,498,000
Customer relationship mgt. 1,484,000
All other professionals 755,000
Detailed Data tables by key Characteristics
© 2010 Facility Management Staffing Report Today’s Facility Manager International Facility Management Association 37
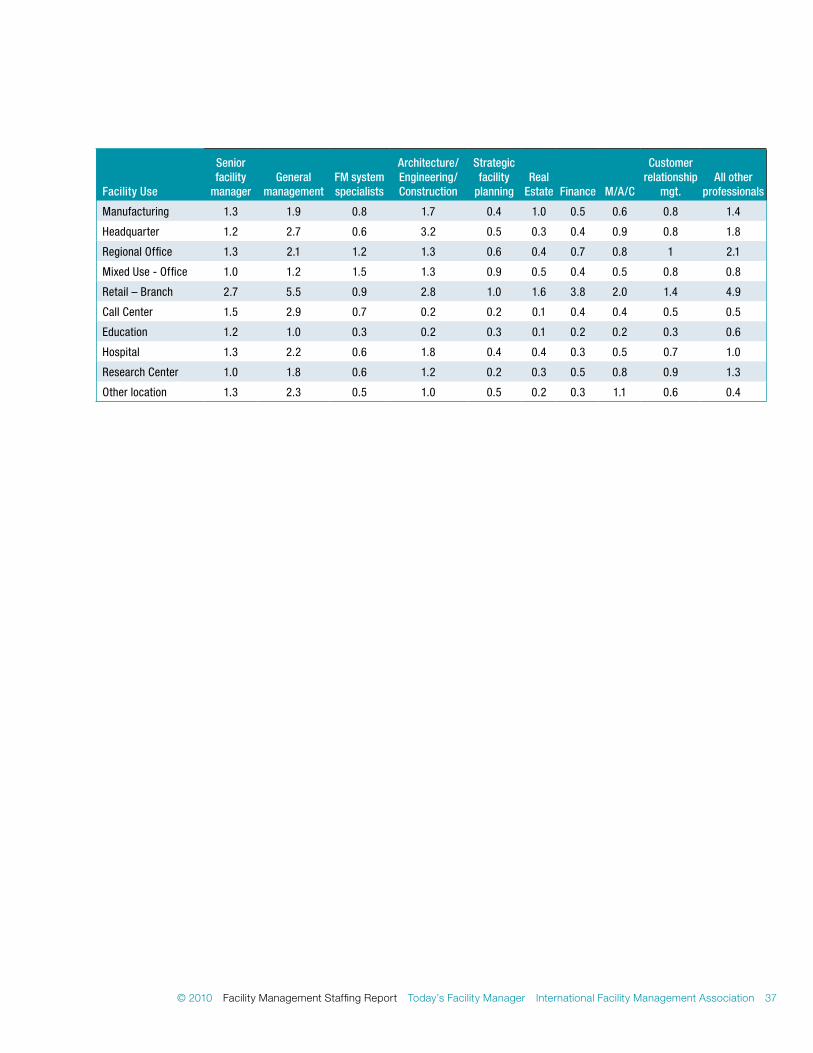
Facility Use
Senior facility
managerGeneral
managementFM system specialists
Architecture/ Engineering/ Construction
Strategic facility
planning Real
Estate Finance M/A/C
Customer relationship
mgt. All other
professionals
Manufacturing 1.3 1.9 0.8 1.7 0.4 1.0 0.5 0.6 0.8 1.4
Headquarter 1.2 2.7 0.6 3.2 0.5 0.3 0.4 0.9 0.8 1.8
Regional Office 1.3 2.1 1.2 1.3 0.6 0.4 0.7 0.8 1 2.1
Mixed Use - Office 1.0 1.2 1.5 1.3 0.9 0.5 0.4 0.5 0.8 0.8
Retail – Branch 2.7 5.5 0.9 2.8 1.0 1.6 3.8 2.0 1.4 4.9
Call Center 1.5 2.9 0.7 0.2 0.2 0.1 0.4 0.4 0.5 0.5
Education 1.2 1.0 0.3 0.2 0.3 0.1 0.2 0.2 0.3 0.6
Hospital 1.3 2.2 0.6 1.8 0.4 0.4 0.3 0.5 0.7 1.0
Research Center 1.0 1.8 0.6 1.2 0.2 0.3 0.5 0.8 0.9 1.3
Other location 1.3 2.3 0.5 1.0 0.5 0.2 0.3 1.1 0.6 0.4
38 International Facility Management Association Today’s Facility Manager Facility Management Staffing Report © 2010
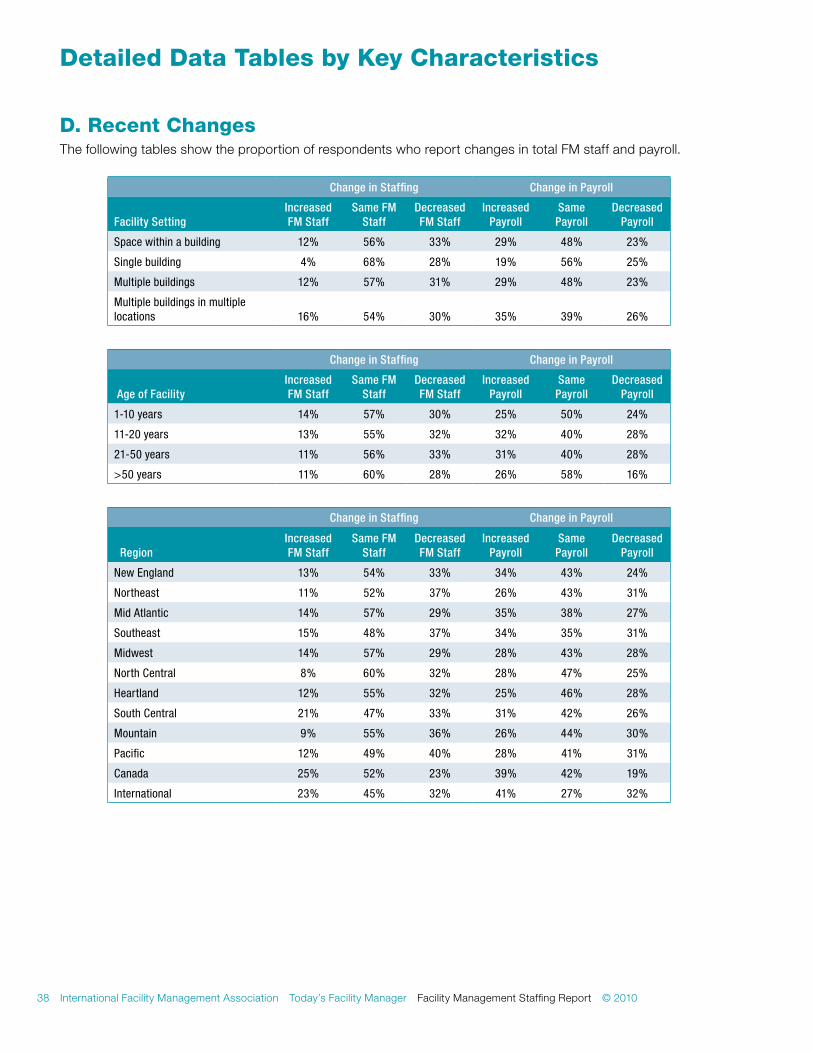
The following tables show the proportion of respondents who report changes in total FM staff and payroll.
Change in Staffing Change in Payroll
Facility SettingIncreased FM Staff
Same FM Staff
Decreased FM Staff
Increased Payroll
Same Payroll
Decreased Payroll
Space within a building 12% 56% 33% 29% 48% 23%
Single building 4% 68% 28% 19% 56% 25%
Multiple buildings 12% 57% 31% 29% 48% 23%
Multiple buildings in multiple locations 16% 54% 30% 35% 39% 26%
Change in Staffing Change in Payroll
Age of Facility Increased FM Staff
Same FM Staff
Decreased FM Staff
Increased Payroll
Same Payroll
Decreased Payroll
1-10 years 14% 57% 30% 25% 50% 24%
11-20 years 13% 55% 32% 32% 40% 28%
21-50 years 11% 56% 33% 31% 40% 28%
>50 years 11% 60% 28% 26% 58% 16%
Change in Staffing Change in Payroll
Region Increased FM Staff
Same FM Staff
Decreased FM Staff
Increased Payroll
Same Payroll
Decreased Payroll
New England 13% 54% 33% 34% 43% 24%
Northeast 11% 52% 37% 26% 43% 31%
Mid Atlantic 14% 57% 29% 35% 38% 27%
Southeast 15% 48% 37% 34% 35% 31%
Midwest 14% 57% 29% 28% 43% 28%
North Central 8% 60% 32% 28% 47% 25%
Heartland 12% 55% 32% 25% 46% 28%
South Central 21% 47% 33% 31% 42% 26%
Mountain 9% 55% 36% 26% 44% 30%
Pacific 12% 49% 40% 28% 41% 31%
Canada 25% 52% 23% 39% 42% 19%
International 23% 45% 32% 41% 27% 32%
D. recent Changes
Detailed Data tables by key Characteristics
© 2010 Facility Management Staffing Report Today’s Facility Manager International Facility Management Association 39
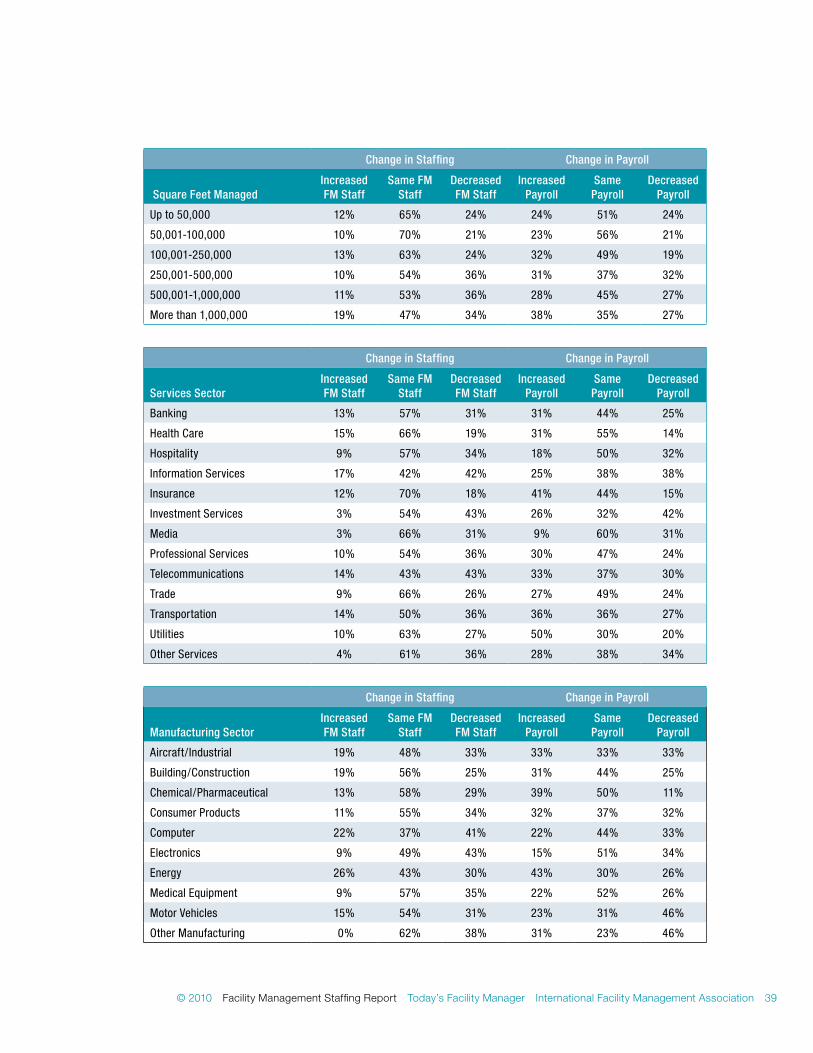
Change in Staffing Change in Payroll
Square Feet ManagedIncreased FM Staff
Same FM Staff
Decreased FM Staff
Increased Payroll
Same Payroll
Decreased Payroll
Up to 50,000 12% 65% 24% 24% 51% 24%
50,001-100,000 10% 70% 21% 23% 56% 21%
100,001-250,000 13% 63% 24% 32% 49% 19%
250,001-500,000 10% 54% 36% 31% 37% 32%
500,001-1,000,000 11% 53% 36% 28% 45% 27%
More than 1,000,000 19% 47% 34% 38% 35% 27%
Change in Staffing Change in Payroll
Services Sector Increased FM Staff
Same FM Staff
Decreased FM Staff
Increased Payroll
Same Payroll
Decreased Payroll
Banking 13% 57% 31% 31% 44% 25%
Health Care 15% 66% 19% 31% 55% 14%
Hospitality 9% 57% 34% 18% 50% 32%
Information Services 17% 42% 42% 25% 38% 38%
Insurance 12% 70% 18% 41% 44% 15%
Investment Services 3% 54% 43% 26% 32% 42%
Media 3% 66% 31% 9% 60% 31%
Professional Services 10% 54% 36% 30% 47% 24%
Telecommunications 14% 43% 43% 33% 37% 30%
Trade 9% 66% 26% 27% 49% 24%
Transportation 14% 50% 36% 36% 36% 27%
Utilities 10% 63% 27% 50% 30% 20%
Other Services 4% 61% 36% 28% 38% 34%
Change in Staffing Change in Payroll
Manufacturing SectorIncreased FM Staff
Same FM Staff
Decreased FM Staff
Increased Payroll
Same Payroll
Decreased Payroll
Aircraft/Industrial 19% 48% 33% 33% 33% 33%
Building/Construction 19% 56% 25% 31% 44% 25%
Chemical/Pharmaceutical 13% 58% 29% 39% 50% 11%
Consumer Products 11% 55% 34% 32% 37% 32%
Computer 22% 37% 41% 22% 44% 33%
Electronics 9% 49% 43% 15% 51% 34%
Energy 26% 43% 30% 43% 30% 26%
Medical Equipment 9% 57% 35% 22% 52% 26%
Motor Vehicles 15% 54% 31% 23% 31% 46%
Other Manufacturing 0% 62% 38% 31% 23% 46%
40 International Facility Management Association Today’s Facility Manager Facility Management Staffing Report © 2010
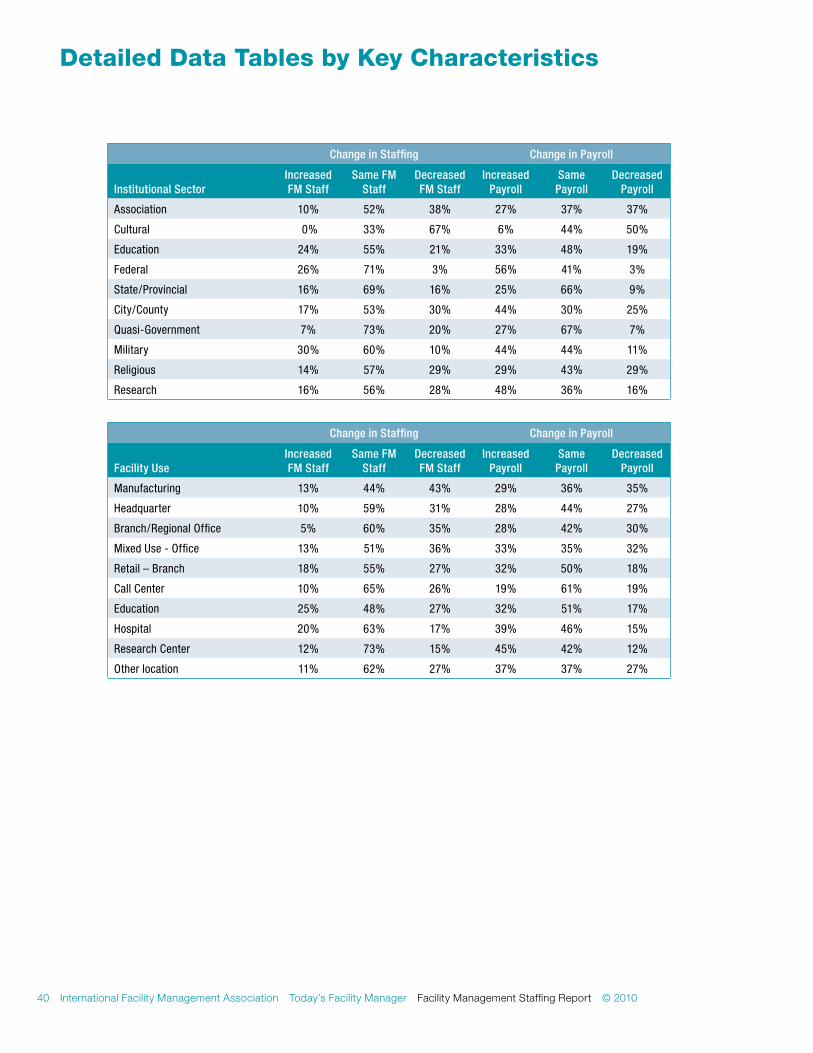
Change in Staffing Change in Payroll
Institutional SectorIncreased FM Staff
Same FM Staff
Decreased FM Staff
Increased Payroll
Same Payroll
Decreased Payroll
Association 10% 52% 38% 27% 37% 37%
Cultural 0% 33% 67% 6% 44% 50%
Education 24% 55% 21% 33% 48% 19%
Federal 26% 71% 3% 56% 41% 3%
State/Provincial 16% 69% 16% 25% 66% 9%
City/County 17% 53% 30% 44% 30% 25%
Quasi-Government 7% 73% 20% 27% 67% 7%
Military 30% 60% 10% 44% 44% 11%
Religious 14% 57% 29% 29% 43% 29%
Research 16% 56% 28% 48% 36% 16%
Change in Staffing Change in Payroll
Facility UseIncreased FM Staff
Same FM Staff
Decreased FM Staff
Increased Payroll
Same Payroll
Decreased Payroll
Manufacturing 13% 44% 43% 29% 36% 35%
Headquarter 10% 59% 31% 28% 44% 27%
Branch/Regional Office 5% 60% 35% 28% 42% 30%
Mixed Use - Office 13% 51% 36% 33% 35% 32%
Retail – Branch 18% 55% 27% 32% 50% 18%
Call Center 10% 65% 26% 19% 61% 19%
Education 25% 48% 27% 32% 51% 17%
Hospital 20% 63% 17% 39% 46% 15%
Research Center 12% 73% 15% 45% 42% 12%
Other location 11% 62% 27% 37% 37% 27%
Detailed Data tables by key Characteristics
© 2010 Facility Management Staffing Report Today’s Facility Manager International Facility Management Association 41
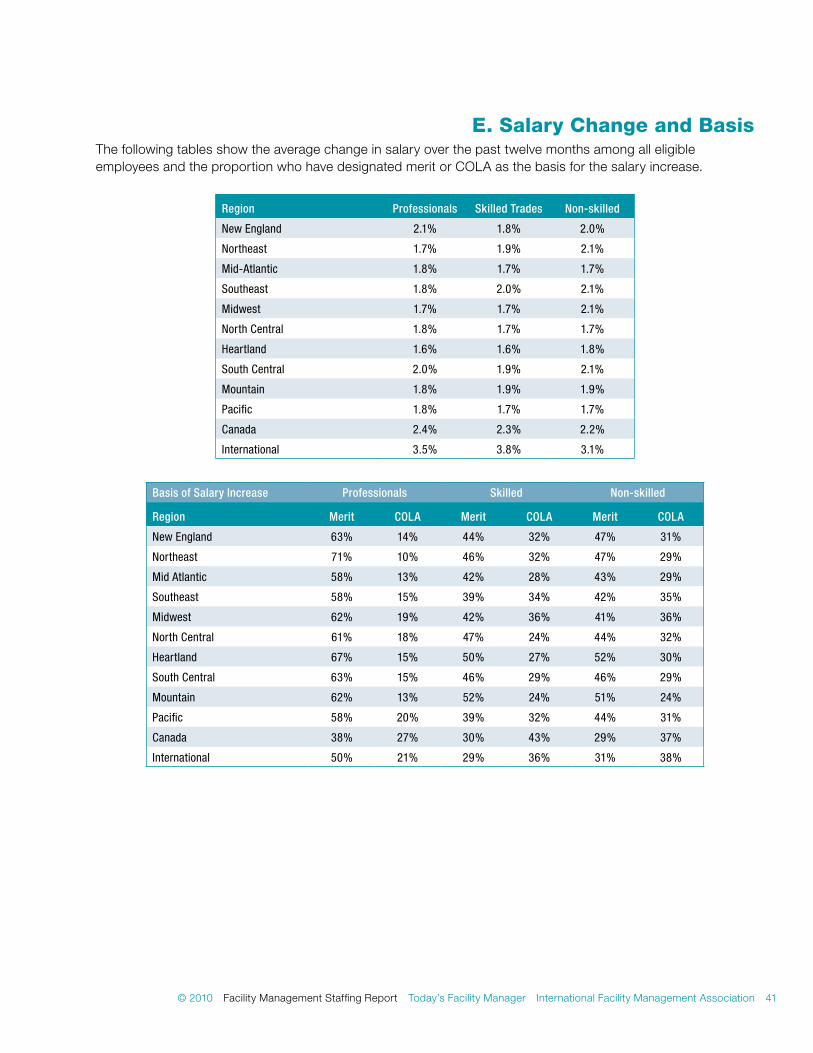
The following tables show the average change in salary over the past twelve months among all eligible employees and the proportion who have designated merit or COLA as the basis for the salary increase.
Region Professionals Skilled Trades Non-skilled
New England 2.1% 1.8% 2.0%
Northeast 1.7% 1.9% 2.1%
Mid-Atlantic 1.8% 1.7% 1.7%
Southeast 1.8% 2.0% 2.1%
Midwest 1.7% 1.7% 2.1%
North Central 1.8% 1.7% 1.7%
Heartland 1.6% 1.6% 1.8%
South Central 2.0% 1.9% 2.1%
Mountain 1.8% 1.9% 1.9%
Pacific 1.8% 1.7% 1.7%
Canada 2.4% 2.3% 2.2%
International 3.5% 3.8% 3.1%
Basis of Salary Increase Professionals Skilled Non-skilled
Region Merit COLA Merit COLA Merit COLA
New England 63% 14% 44% 32% 47% 31%
Northeast 71% 10% 46% 32% 47% 29%
Mid Atlantic 58% 13% 42% 28% 43% 29%
Southeast 58% 15% 39% 34% 42% 35%
Midwest 62% 19% 42% 36% 41% 36%
North Central 61% 18% 47% 24% 44% 32%
Heartland 67% 15% 50% 27% 52% 30%
South Central 63% 15% 46% 29% 46% 29%
Mountain 62% 13% 52% 24% 51% 24%
Pacific 58% 20% 39% 32% 44% 31%
Canada 38% 27% 30% 43% 29% 37%
International 50% 21% 29% 36% 31% 38%
e. Salary Change and basis
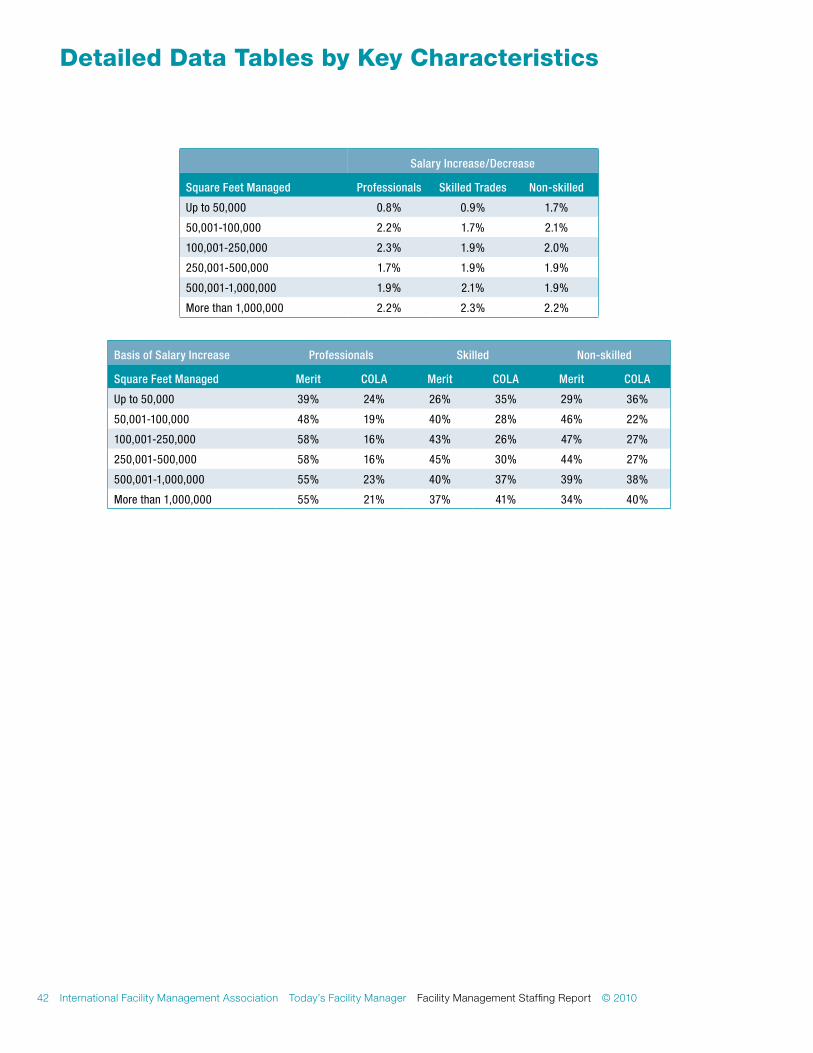
42 International Facility Management Association Today’s Facility Manager Facility Management Staffing Report © 2010
Salary Increase/Decrease
Square Feet Managed Professionals Skilled Trades Non-skilled
Up to 50,000 0.8% 0.9% 1.7%
50,001-100,000 2.2% 1.7% 2.1%
100,001-250,000 2.3% 1.9% 2.0%
250,001-500,000 1.7% 1.9% 1.9%
500,001-1,000,000 1.9% 2.1% 1.9%
More than 1,000,000 2.2% 2.3% 2.2%
Basis of Salary Increase Professionals Skilled Non-skilled
Square Feet Managed Merit COLA Merit COLA Merit COLA
Up to 50,000 39% 24% 26% 35% 29% 36%
50,001-100,000 48% 19% 40% 28% 46% 22%
100,001-250,000 58% 16% 43% 26% 47% 27%
250,001-500,000 58% 16% 45% 30% 44% 27%
500,001-1,000,000 55% 23% 40% 37% 39% 38%
More than 1,000,000 55% 21% 37% 41% 34% 40%
Detailed Data tables by key Characteristics
© 2010 Facility Management Staffing Report Today’s Facility Manager International Facility Management Association 43
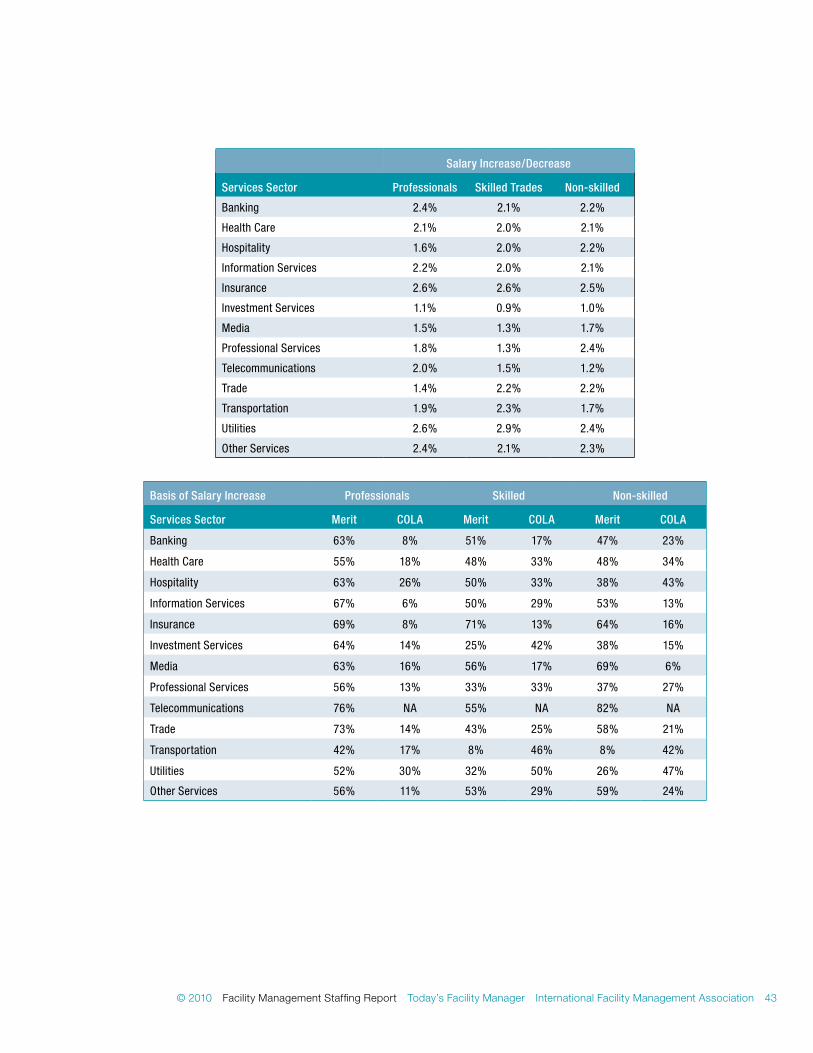
Salary Increase/Decrease
Services Sector Professionals Skilled Trades Non-skilled
Banking 2.4% 2.1% 2.2%
Health Care 2.1% 2.0% 2.1%
Hospitality 1.6% 2.0% 2.2%
Information Services 2.2% 2.0% 2.1%
Insurance 2.6% 2.6% 2.5%
Investment Services 1.1% 0.9% 1.0%
Media 1.5% 1.3% 1.7%
Professional Services 1.8% 1.3% 2.4%
Telecommunications 2.0% 1.5% 1.2%
Trade 1.4% 2.2% 2.2%
Transportation 1.9% 2.3% 1.7%
Utilities 2.6% 2.9% 2.4%
Other Services 2.4% 2.1% 2.3%
Basis of Salary Increase Professionals Skilled Non-skilled
Services Sector Merit COLA Merit COLA Merit COLA
Banking 63% 8% 51% 17% 47% 23%
Health Care 55% 18% 48% 33% 48% 34%
Hospitality 63% 26% 50% 33% 38% 43%
Information Services 67% 6% 50% 29% 53% 13%
Insurance 69% 8% 71% 13% 64% 16%
Investment Services 64% 14% 25% 42% 38% 15%
Media 63% 16% 56% 17% 69% 6%
Professional Services 56% 13% 33% 33% 37% 27%
Telecommunications 76% NA 55% NA 82% NA
Trade 73% 14% 43% 25% 58% 21%
Transportation 42% 17% 8% 46% 8% 42%
Utilities 52% 30% 32% 50% 26% 47%
Other Services 56% 11% 53% 29% 59% 24%
44 International Facility Management Association Today’s Facility Manager Facility Management Staffing Report © 2010
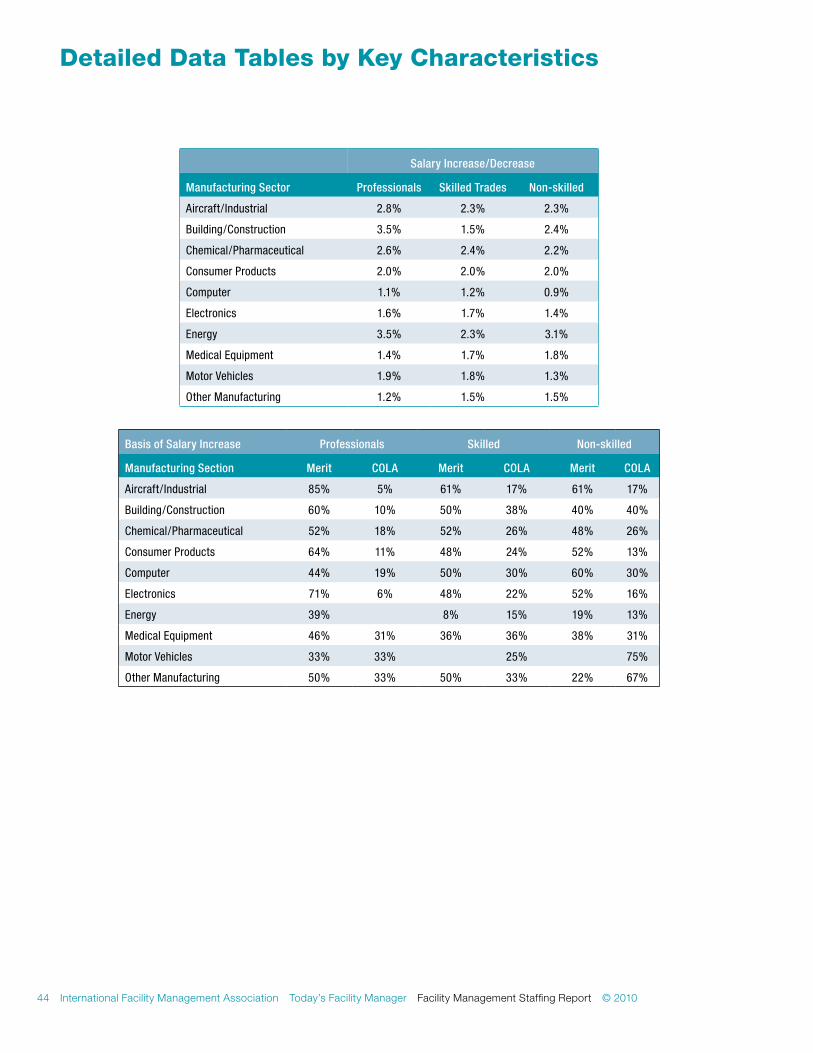
Salary Increase/Decrease
Manufacturing Sector Professionals Skilled Trades Non-skilled
Aircraft/Industrial 2.8% 2.3% 2.3%
Building/Construction 3.5% 1.5% 2.4%
Chemical/Pharmaceutical 2.6% 2.4% 2.2%
Consumer Products 2.0% 2.0% 2.0%
Computer 1.1% 1.2% 0.9%
Electronics 1.6% 1.7% 1.4%
Energy 3.5% 2.3% 3.1%
Medical Equipment 1.4% 1.7% 1.8%
Motor Vehicles 1.9% 1.8% 1.3%
Other Manufacturing 1.2% 1.5% 1.5%
Basis of Salary Increase Professionals Skilled Non-skilled
Manufacturing Section Merit COLA Merit COLA Merit COLA
Aircraft/Industrial 85% 5% 61% 17% 61% 17%
Building/Construction 60% 10% 50% 38% 40% 40%
Chemical/Pharmaceutical 52% 18% 52% 26% 48% 26%
Consumer Products 64% 11% 48% 24% 52% 13%
Computer 44% 19% 50% 30% 60% 30%
Electronics 71% 6% 48% 22% 52% 16%
Energy 39% 8% 15% 19% 13%
Medical Equipment 46% 31% 36% 36% 38% 31%
Motor Vehicles 33% 33% 25% 75%
Other Manufacturing 50% 33% 50% 33% 22% 67%
Detailed Data tables by key Characteristics
© 2010 Facility Management Staffing Report Today’s Facility Manager International Facility Management Association 45
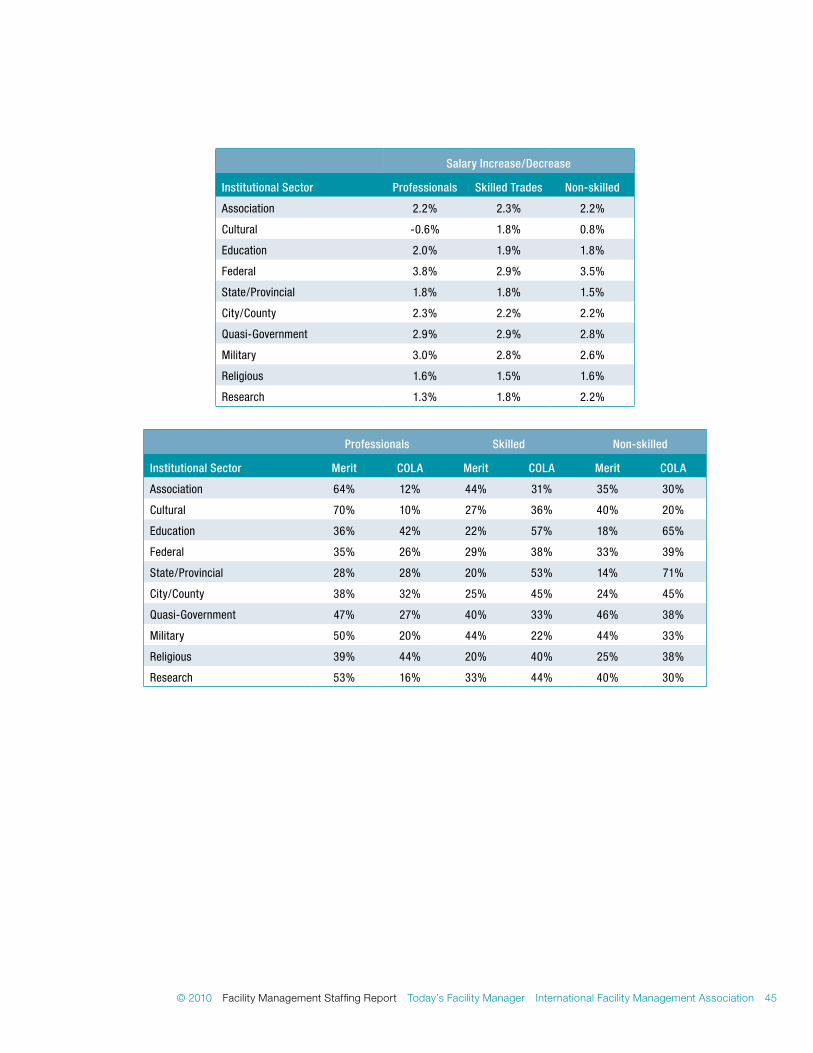
Salary Increase/Decrease
Institutional Sector Professionals Skilled Trades Non-skilled
Association 2.2% 2.3% 2.2%
Cultural -0.6% 1.8% 0.8%
Education 2.0% 1.9% 1.8%
Federal 3.8% 2.9% 3.5%
State/Provincial 1.8% 1.8% 1.5%
City/County 2.3% 2.2% 2.2%
Quasi-Government 2.9% 2.9% 2.8%
Military 3.0% 2.8% 2.6%
Religious 1.6% 1.5% 1.6%
Research 1.3% 1.8% 2.2%
Professionals Skilled Non-skilled
Institutional Sector Merit COLA Merit COLA Merit COLA
Association 64% 12% 44% 31% 35% 30%
Cultural 70% 10% 27% 36% 40% 20%
Education 36% 42% 22% 57% 18% 65%
Federal 35% 26% 29% 38% 33% 39%
State/Provincial 28% 28% 20% 53% 14% 71%
City/County 38% 32% 25% 45% 24% 45%
Quasi-Government 47% 27% 40% 33% 46% 38%
Military 50% 20% 44% 22% 44% 33%
Religious 39% 44% 20% 40% 25% 38%
Research 53% 16% 33% 44% 40% 30%
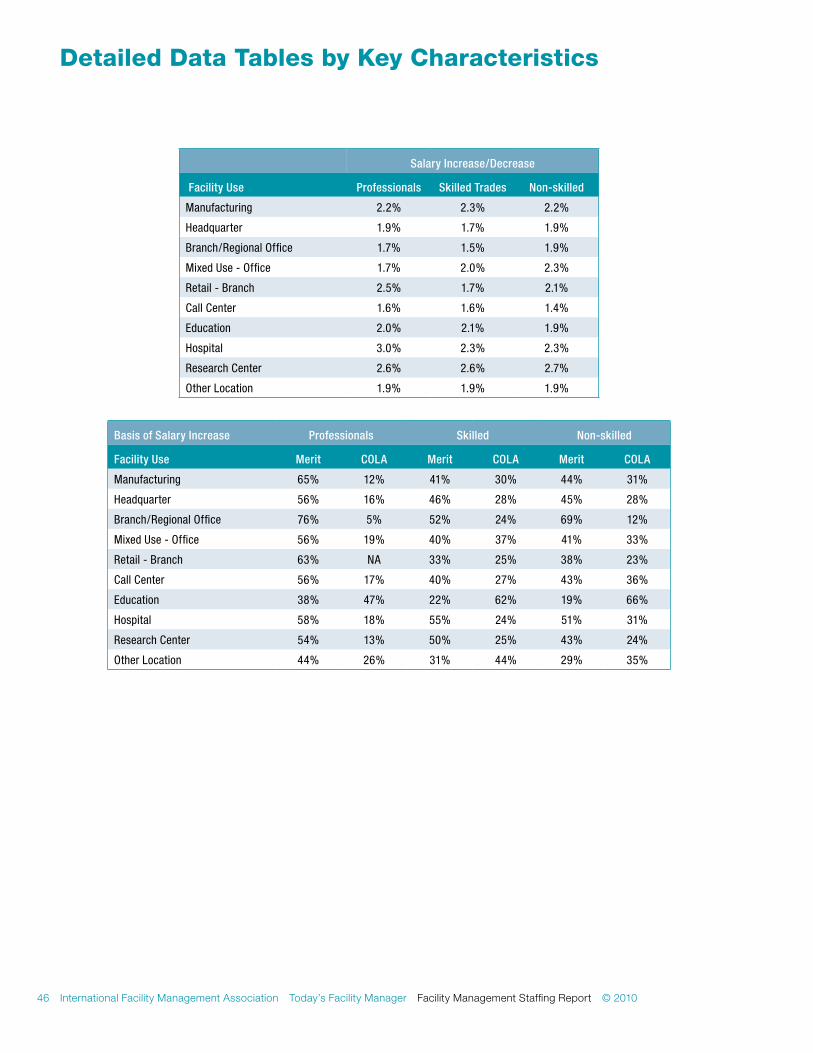
46 International Facility Management Association Today’s Facility Manager Facility Management Staffing Report © 2010
Salary Increase/Decrease
Facility Use Professionals Skilled Trades Non-skilled
Manufacturing 2.2% 2.3% 2.2%
Headquarter 1.9% 1.7% 1.9%
Branch/Regional Office 1.7% 1.5% 1.9%
Mixed Use - Office 1.7% 2.0% 2.3%
Retail - Branch 2.5% 1.7% 2.1%
Call Center 1.6% 1.6% 1.4%
Education 2.0% 2.1% 1.9%
Hospital 3.0% 2.3% 2.3%
Research Center 2.6% 2.6% 2.7%
Other Location 1.9% 1.9% 1.9%
Basis of Salary Increase Professionals Skilled Non-skilled
Facility Use Merit COLA Merit COLA Merit COLA
Manufacturing 65% 12% 41% 30% 44% 31%
Headquarter 56% 16% 46% 28% 45% 28%
Branch/Regional Office 76% 5% 52% 24% 69% 12%
Mixed Use - Office 56% 19% 40% 37% 41% 33%
Retail - Branch 63% NA 33% 25% 38% 23%
Call Center 56% 17% 40% 27% 43% 36%
Education 38% 47% 22% 62% 19% 66%
Hospital 58% 18% 55% 24% 51% 31%
Research Center 54% 13% 50% 25% 43% 24%
Other Location 44% 26% 31% 44% 29% 35%
Detailed Data tables by key Characteristics
© 2010 Facility Management Staffing Report Today’s Facility Manager International Facility Management Association 47
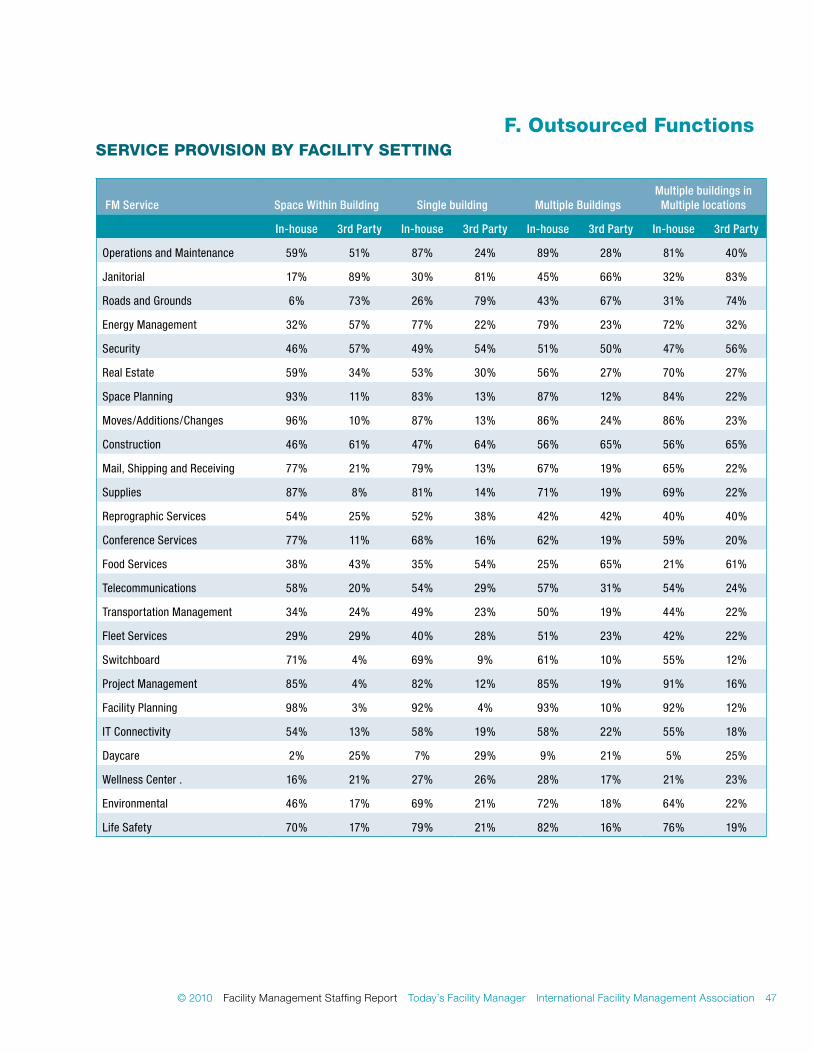
ServiCe ProviSion by FaCiLity Setting
FM Service Space Within Building Single building Multiple BuildingsMultiple buildings in
Multiple locations
In-house 3rd Party In-house 3rd Party In-house 3rd Party In-house 3rd Party
Operations and Maintenance 59% 51% 87% 24% 89% 28% 81% 40%
Janitorial 17% 89% 30% 81% 45% 66% 32% 83%
Roads and Grounds 6% 73% 26% 79% 43% 67% 31% 74%
Energy Management 32% 57% 77% 22% 79% 23% 72% 32%
Security 46% 57% 49% 54% 51% 50% 47% 56%
Real Estate 59% 34% 53% 30% 56% 27% 70% 27%
Space Planning 93% 11% 83% 13% 87% 12% 84% 22%
Moves/Additions/Changes 96% 10% 87% 13% 86% 24% 86% 23%
Construction 46% 61% 47% 64% 56% 65% 56% 65%
Mail, Shipping and Receiving 77% 21% 79% 13% 67% 19% 65% 22%
Supplies 87% 8% 81% 14% 71% 19% 69% 22%
Reprographic Services 54% 25% 52% 38% 42% 42% 40% 40%
Conference Services 77% 11% 68% 16% 62% 19% 59% 20%
Food Services 38% 43% 35% 54% 25% 65% 21% 61%
Telecommunications 58% 20% 54% 29% 57% 31% 54% 24%
Transportation Management 34% 24% 49% 23% 50% 19% 44% 22%
Fleet Services 29% 29% 40% 28% 51% 23% 42% 22%
Switchboard 71% 4% 69% 9% 61% 10% 55% 12%
Project Management 85% 4% 82% 12% 85% 19% 91% 16%
Facility Planning 98% 3% 92% 4% 93% 10% 92% 12%
IT Connectivity 54% 13% 58% 19% 58% 22% 55% 18%
Daycare 2% 25% 7% 29% 9% 21% 5% 25%
Wellness Center . 16% 21% 27% 26% 28% 17% 21% 23%
Environmental 46% 17% 69% 21% 72% 18% 64% 22%
Life Safety 70% 17% 79% 21% 82% 16% 76% 19%
F. outsourced Functions
48 International Facility Management Association Today’s Facility Manager Facility Management Staffing Report © 2010
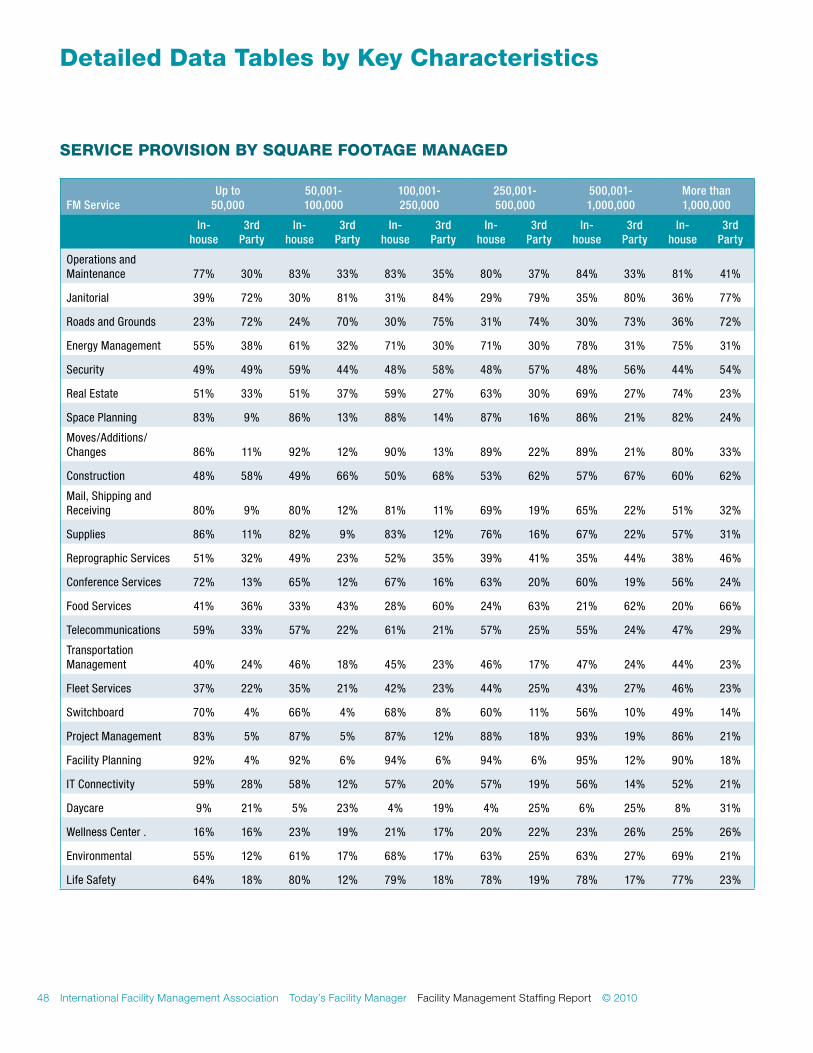
ServiCe ProviSion by Square Footage ManageD
FM ServiceUp to
50,00050,001- 100,000
100,001- 250,000
250,001- 500,000
500,001-1,000,000
More than 1,000,000
In- house
3rd Party
In- house
3rd Party
In- house
3rd Party
In- house
3rd Party
In- house
3rd Party
In- house
3rd Party
Operations and Maintenance 77% 30% 83% 33% 83% 35% 80% 37% 84% 33% 81% 41%
Janitorial 39% 72% 30% 81% 31% 84% 29% 79% 35% 80% 36% 77%
Roads and Grounds 23% 72% 24% 70% 30% 75% 31% 74% 30% 73% 36% 72%
Energy Management 55% 38% 61% 32% 71% 30% 71% 30% 78% 31% 75% 31%
Security 49% 49% 59% 44% 48% 58% 48% 57% 48% 56% 44% 54%
Real Estate 51% 33% 51% 37% 59% 27% 63% 30% 69% 27% 74% 23%
Space Planning 83% 9% 86% 13% 88% 14% 87% 16% 86% 21% 82% 24%
Moves/Additions/Changes 86% 11% 92% 12% 90% 13% 89% 22% 89% 21% 80% 33%
Construction 48% 58% 49% 66% 50% 68% 53% 62% 57% 67% 60% 62%
Mail, Shipping and Receiving 80% 9% 80% 12% 81% 11% 69% 19% 65% 22% 51% 32%
Supplies 86% 11% 82% 9% 83% 12% 76% 16% 67% 22% 57% 31%
Reprographic Services 51% 32% 49% 23% 52% 35% 39% 41% 35% 44% 38% 46%
Conference Services 72% 13% 65% 12% 67% 16% 63% 20% 60% 19% 56% 24%
Food Services 41% 36% 33% 43% 28% 60% 24% 63% 21% 62% 20% 66%
Telecommunications 59% 33% 57% 22% 61% 21% 57% 25% 55% 24% 47% 29%
Transportation Management 40% 24% 46% 18% 45% 23% 46% 17% 47% 24% 44% 23%
Fleet Services 37% 22% 35% 21% 42% 23% 44% 25% 43% 27% 46% 23%
Switchboard 70% 4% 66% 4% 68% 8% 60% 11% 56% 10% 49% 14%
Project Management 83% 5% 87% 5% 87% 12% 88% 18% 93% 19% 86% 21%
Facility Planning 92% 4% 92% 6% 94% 6% 94% 6% 95% 12% 90% 18%
IT Connectivity 59% 28% 58% 12% 57% 20% 57% 19% 56% 14% 52% 21%
Daycare 9% 21% 5% 23% 4% 19% 4% 25% 6% 25% 8% 31%
Wellness Center . 16% 16% 23% 19% 21% 17% 20% 22% 23% 26% 25% 26%
Environmental 55% 12% 61% 17% 68% 17% 63% 25% 63% 27% 69% 21%
Life Safety 64% 18% 80% 12% 79% 18% 78% 19% 78% 17% 77% 23%
Detailed Data tables by key Characteristics

Particpant List
50 International Facility Management Association Today’s Facility Manager Facility Management Staffing Report © 2010
The following is a list of the organizations that participated in this study. This report would not have been possible without their cooperation and participation.
Participant List
1st Advantage Federal Credit Union
24 Hour Fitness
2nd Presbyterian Church
AAA Arizona
AAR Corporation
ACCENT
Accent Marketing Services
Accenture
Access Group, Inc..
Ace Hardware Corporation
Action Systems
Acushnet Company
AD Facilities, Inc..
Adaptec, Inc.
ADMINISTAFF
Adobe Systems, Inc.
ADP Canada
ADTRAN
Adventist LaGrange Memorial Hospital
Advocate Illinois Masonic Medical Center
AEP River Operations
AETNA
Affymetrix
AFLAC, Inc.
Agribank
Agricultural Research Services (ARS)
AIG Advisor Group
AIG Marketing, Inc.
AIM Investments
AIMCO
AIPSO
Air Jamaica Ltd
Air Liquide
Airport Authority of Washoe County
Akamai Technologies, Inc.
Alachuna County
Alameda County
Alameda Unified School District
Alberta Infrastructure
Alcon Research Ltd
Alkermes, Inc.
All Risks Ltd
Allegan County Facilities Management
Allen Organ Company
Alliance Bernstein, LP
Alliant Energy
Allianz Group
Allstate Insurance Company
Alltel
Alpine Electronics
Altera Corporation
Amedisys Inc.
Amegy Bank
Ameren Services
American Academy of Pediatrics
American Airlines Center
American Automobile Association
American Cancer Society
American College of Obstetricians and Gynecologists
American Commercial Lines
American Crystal Sugar
American Embassy
American Family Insurance Company
American Fidelity Property Company
American General Finance
American General Life Companies
American Greetings Corporation
American Heritage Federal Credit Union
American Honda Motor Co., Inc.
American Psychological Association
American Red Cross
American Society of Clinical Oncology
Amerigroup Corporation
Ameritas Life Insurance Corporation
Amgen
Amicus Therapeutics
AMX
Andersen Corporation
Anthem Blue Cross & Blue Shield
AOL LLC
Apartment Investment & Management Company
APCO Worldwide, Inc
ARAMARK Facility Services
ARAMARK Uniform Services
Arapahoe County Government
Arizona Federal Credit Union
Arizona Public Service
Arkansas Arts Center
Armstrong World Industries
Arnold & Porter, LLP
Ashland Inc.
ASML
Association of American Medical Colleges
Assurant Solutions
ATB Financial
Atlanta History Center
AtSite
ATX Group
Audit Bureau of Circulations
Austin American-Statesman
Austin Convention Center
Automatic Data Processing, Inc.
Autotrader.com
Avanade
Avery Dennison
Babson College
BAE Systems Mission Solutions
BAE Systems, Inc.
Baesman Group
Bain & Company
Ball Aerospace & Technologies Corp.
Baptist Health - North Little Rock
Barnes Group Inc.
Barton Incorporated
Barton Malow Co.
Bath & Body Works
Baxter Healthcare Corporation
Bayer Corporation
Bayer Inc.
Baylake Bank
Baystate Health, Inc.
BCBS of Illinois
Bechtel Power Corporation
Benchmark Assisted Living
Berean Academy
Berkshire South Regional Community Center
Bernalillo County
Bexar County Forensic Science Center
BGEA
Bill & Melinda Gates Foundation
Birchwood Labs II
Birmingham Airport Authority
BlackRock Inc.
Blessed Trinity Catholic High School
Blue Coat Systems
Blue Cross Blue Shield
Blue Cross Blue Shield of Nebraska
BlueCross BlueShield of Texas
BMW Financial Services NA, LLC
BNIM Architects
BNSF
Bobs Stores Corporation
Boca Raton Community Hospital
Boeing Service Company
© 2010 Facility Management Staffing Report Today’s Facility Manager International Facility Management Association 51
Boone County National Bank
Boone County Schools
BOSIMCO
Boston Biomedical Research Institute, Inc.
Boston Properties
Boston Scientific Corporation
Bothwell Regional Health
Boult, Cummings, Conners & Berry, PLC.
Boy Scouts of America
BP Alaska
BP Solar
Brayton Purcell
Breazeale
Bridgewater State College
Bright Horizons Family Solutions
Brinks, Hofer, Gilson & Lione
British Columbia Lottery Corporation
Brooking Park
Brookwood School
Brown Brothers Harriman & Co.
Brunswick School District
Building Management System Inc.
Burson-Marsteller
Bush Brothers & Company
Calfee, Halter & Griswold, LLP
California Casualty Management Co.
California Department of Transportation
Calvary Chapel of the Triad
Calvary Church
Calvert
Cambridge Associates
Cambridge Innovation Center
Cameco Corporation
Campbell Soup Company LTD
Campus Federal Credit Union
Canadian Nurses Association
Canadian Standards Association
Canadian Western Bank
Canon USA, Inc.
Capella Education Company
Capella Univesity
Capital City Press, The Advocate
Capital Group
Careerbuilder.com
Caremark Rx, Inc.
CaridianBCT, Inc.
Carl Sandburg High School
Carolina Health Centers
Carroll College
Carson Center
Carson Guest Inc.
Carter
Cartoon Network Studios
Caterpillar Financial Services Corp
Caterpillar Global Paving
Catholic Health East
Causeway Tower LLC
CB Richard Ellis
CBORD Group Inc.
CBRE Management Services
CC Realty Advisors
Center for Creative Leadership
Center for Families and Children
Central Bancompany
Central Piedmont Community Center
Central United Methodist Church
Central Vermont Public Service
CFG
CGGVeritas
CH2M Hill
CH2M Hill Canada Ltd
Charles River Laboratories Clinical Services
Charles Schwab
Charles Schwab & Company, Inc.
Chemical Abstracts Service
Chestnut Health Systems
Chevron
Chevron Business and Real Estate Services
Children’s Aid Society of Ottawa
Christies
Church & Dwight Co., Inc.
Church of the Resurrection
CHW
Chyron Corporation
CIBC World Markets
Cigna Healthcare
Cingular Wireless
Citigroup
Citizens Business Bank
Citrix Systems, Inc.
City of Amarillo
City of Arvada
City of Bellingham
City of Commerce City
City of Daytona Beach
City of Edmonton
City of Evanston
City of Fort Collins
City of Fort Lauderdale
City of Gaithersburg
City of Grand Prairie
City of Kansas City
City of Largo
City of Leduc
City of Loveland
City of Minneapolis
City of Mississauga
City of Olympia
City of Ontario
City of Palm Bay Parks & Recreation
City of Pittsburgh
City of Red Deer
City of Redwood City
City of Richmond
City of San Antonio
City of San Bernardino
City of San Jose - Airport Dept
City of San Marcos
City of Schertz
City of Sedona
City of Spruce Grove
City of Westminster
City of Woodland
CKE Restaurants Inc.
Classified Ventures, Inc.
Clay County
Cliff Castle Casino
Cobb EMC
Cobham, Defense Electronics Systems, M/A-COM, Inc.
Cobleskill Regional Hospital
Coconino County Sheriffs Office
College of American Pathologists
Collier County Government
Colliers International
Collin County
Colorado Community College System
Columbia St.Mary’s Inc.
Columbus Fair Auto Auction
Columbus Regional Airport Authority
CommonHealth
Commonwealth of Massachusetts
Community Blood Center/Community Tissue Services
Community Care
Community Coffee Co., LLC
Community Fellowship Church
CompuCredit Corp.
Computer Associates
Concord Management, LTD
Connecticut General Assembly
Control Components, Inc.
52 International Facility Management Association Today’s Facility Manager Facility Management Staffing Report © 2010
ConvaTec
Convergys Corporation
Cooper Standard Automotive
Cordis Corporation
Corning, Inc.
Coronado Center
Corporate One Federal Credit Union
Corporation of Presiding Bishopric
Corporation of the Presiding Bishop of the Church of Jesus Christ of Latter Day Saints
Corsair Memory
County of Culpeper
County of Lycoming
County of San Diego
Covad Communications
Coventry Health Care, Inc.
CPS Energy
Crescent Real Estate Equities LP
Crittenton Medical Center
Cross Country Automotive Services
CTG
Cubic Defense Applications, Inc.
Cummins Power Generation
Cummins-Allison Corporation
CuraScript
Cushman & Wakefield
Custer Road United Methodist Church
Daimler Financial Services
Dallas Market Center
Danvers Bank
Ddb Chicago
De Lage Landen Financial Services
Dearn Health Systems Inc.
Deerfield Public Library
Del Valle ISD Maintenance
Dell USA
Dell Webb LInc.oln Hills
Deloitte & Touche
Deloitte Services, LP
Delta Center
Delta Dental Insurance Company
Delta Dental of California
Department of General Services
Dept of Human Services
Dept. of Health/Public Health Laboratories
Derco Aerospace
Det Norske Veritas USA, Inc.
DH Consulting
Dillin Industrial Services
Dimensional Merchandising
Direct General Corporation
Direct Supply Inc.
Disability Resources and Educational Services
Disney
DJO Inc.orporated, LLC
DLA Piper Rudnick Gray Cary US LLP
Dole Food Company
Dollar Tree
Dominion
Donalway Golf Systems Inc.
Douglas County Libraries
Downtown Aquarium
Dr Pepper Snapple Group, Inc.
Draftfcb
Drexel University
Duke Clinical Research Institute
Duke Realty Corporation
Dundee Wealth Management
Duquesne Light Company
Eagle Realty Group, LLC
Eagle Service Corp
Eagle’s Trace
East Alabama Medical Center
East Bay Regional Park Dist
eBay, Inc.
Echo Real Estate
Ecolab
Edelman
Education Development Center
Educational Testing Service
El Paso Corporation
Elavon
Elements IV Interiors
Elko County School District
EMCOR Facilities Services
EMCOR Facilities Services - Fidelity Investments
Emerson Process Management
EMI Christian Music Group
Emmaus Homes
EnCana Corporation
Endo Pharmaceuticals
Ensworth High School
Enterprise Rent-A-Car
Epping School District
EPSI
ERBM Recreation & Park District
Erie Insurance Group
Eugene Water & Electric Board
Eurest Business Services at Google
Evangelical Lutheran Church in America
Exchange Bank
ExxonMobil
F & M Trust Company
F & P America Manufacturing Inc.
F. Hoffmann-La Roche Ltd
Facilitech
Facility Programming & Consulting
Fairfax County Public Schools
Fallon Health Care
Family Dollar Stores, Inc.
Federal Communications Commission
Federal Deposit Insurance Company
Federal Reserve Bank of Kansas City
Federal-Mogul Corporation
FedEx
Fifth Third Bank
FINRA
Firmenich Inc.
First Calgary Savings & Credit Union
First Commonwealth Bank
First Data Corporation
First Midwest Bank
First Tennessee Bank, NA
First Unitarian Church
Fiserv Investment Support Services
Florence County
Florida Gulf Coast University
FMC Corporation
FMS
Follett Corp
Foremost Farms USA
Forest Hills Baptist Church
Forest Laboratories
Forsyth County General Services
Forsythe Technology Inc.
Fort Pierce Utilities Authority
Fossil, Inc.
Four Winds Casino Resort
Fox Interactive Media
Fox NE&O
Foxx Construction
Franciscan at St. Leonard
Franklin Electric Co. Inc.
Franklin Templeton Investments, LLC
Frasca Intl Inc.
Frauenshuh
Fred Hutchinson Cancer Research Center
Participant List
© 2010 Facility Management Staffing Report Today’s Facility Manager International Facility Management Association 53
Freddie Mac
Frederik Meijer Gardens
Freescale Semiconductor
FreeStore/FoodBank
Fresh Mark Inc.
Frito-Lay, Inc.
Fullerton Community Bank
Gabriel First Corp
Ganflec Corporation
Gaston County
GE Energy
GE Healthcare
General Dynamics
General Electric
Genoa-Kingston School District
Gentex Corporation
Gentex Optics
George Brown College
George Mason University
Georgetown University
Georgia Pacific Corp.
Gerber Products Co.
Getco LLC
Gibson Energy, Ltd.
Girl Scouts Of San Jacinto Council
GlaxoSmithKline
Glenview Park District
Global Knowledge
GMAC ResCap, LLC
GMAC-Nuvell Financial Services LLC
God’s Pantry Food Bank
Golin Harris
Goodmans Interiors Structures
Gordmans Inc.
Gorton’s
Grandview Heights City Schools
Grange Insurance
Greater Chicago Food Depository
Greater Toronto Airports Authority
Gross Schechter Day School
Grubb & Ellis
Grubb & Ellis Management Services Inc.,Wells Fargo Center
GSI Commerce Solutions
Guidant Corporation
Gwinnett Technical College
H&R BLOCK
Hallmark Cards, Inc.
Hampton Inn
Hancock Bank
Hardy Diagnostics
Harkins Theatres
Harley-Davidson Financial
Harley-Davidson Motor Company
Harrison Medical Center
Hart House, University Of Toronto
Harte-Hanks
Harvard Business School Publishing
Harvard Law School
Harvard Pilgrim Health Care
Harvard University Kennedy School of Government
Hastings Mutual Insurance Company
HDC International
Health Alliance Medical Plans
Health Net
Health Partners
Healthcare and Rehabilitation
HealthPartners
Heartland Communication
Helen Adams Realty
Hennepin County Government
Herman Miller, Inc.
Hi Desert Medical Center
Hilti, Inc.
Hilton Hotels Corporation
Hines Interests LP
Hines VA Hospital US Department of Veterans Affairs
Hochstein School of Music
Holy Innocents Episcopal School
Home Savings and Loan Company
Honey Baked Ham Company
Honeywell International Inc.
Hope Network
Hope Network West Michigan
Horizon Media
Hormel Foods Corporation
HospiceCare Inc.
Howard County Public School System
Howard Rice Nemerovski Canady Falk & Rabkin
Hubbell Caribe Limited
Huntington Bank
Husky Oil Operations LTD
IAP World Services
IBM
Idaho Power Company
IDC Research, Inc.
Idea Quest Academy
IHG
Illinois Farm Bureau
Illinois Tool Works Inc.
Impco Technologies
Incident Management Consultants
Indian Community School of Milwaukee
Industry Canada
IndyMac Bank
Infineum
Infinity Insurance Company
Infogix, Inc.
ING
ING Canada
InnoMedia Inc.
Insight Meditation Society
Inspire Pharmaceuticals, Inc.
Institute Of Contemporary Art
Institute Paper Science TC
Insurance Company of the West
Insurance Corporation of British Columbia
Insurer’s Administration Corporation
Interbake Foods Inc.
Intercontinental Hotels Group
Interior Savings Credit Union
Intermountain Farmers Association
Internal Revenue Service
Internal Revenue Service
International Finance Corporation
International Game Technology
International Monetary Fund
Intuit Canada Limited
Invensys
Investment Dealers Association
Isaac Commercial Properties, Inc.
Isis Pharmaceuticals
Iwasaki Brothers
J.B. Enterprises
Jackson County of Michigan
Jani-King International, Inc.
JBT AeroTech Services
Jefferson County Government
Jefferson Lab
Jesuit Center
Jewish Community Campus of Greater Kansas City, Inc.
JJ Keller & Associates, Inc.
JL McDaniel & Company, Inc.
JL PROPERTIES
Joe Gibbs Racing
John Hancock Financial Services, Inc.
Johns Hopkins University
Johnson & Johnson
54 International Facility Management Association Today’s Facility Manager Facility Management Staffing Report © 2010
Johnson Controls Inc.
Johnson Financial Group
Jones Lang LaSalle Americas LP
Jones Lang LaSalle CPS
JRS Architect PC
Juno Lighting Group
Justice Federal Credit Union
K and M Electronics Inc.
Kahala Nui Senior Living Community
Kaplan University
KBC Financial Products
KBR
Kendle International
Kenrick Glennon Seminary
Kent Place School
Kentucky Derby Museum
Kentucky Medical Services Foundation
Key Risk Management Services
KGB
KGO TV
Kimberly-Clark Corporation
Kindred Healthcare, Inc.
King County Housing Authority
King County Library System
Kiplinger Washington Editors
KRM Development
Krueger International Inc.
L-3 Communications
Labarge Products Inc.
Lake Forest College
Lake Michigan College
Lam Research Corporation
Land O’Lakes, Inc.
Latham & Watkins LLP
Lawrence Livermore National Laboratory
Lazydays RV Center, Inc.
Leapfrog
Lee County
Lee County Government
Lesueur Inc.
Liberty Bank
Liberty Mutual
Liberty Mutual Insurance Co.
Libery Tax Service
LifeNet Health
Lifescan, Inc. A Johnson & Johnson Company
Lifetouch Inc.
Lifeway Christian Resources
Lifeway Ridgecrest Conference Center
Light Sciences Oncology
LiveOps Inc. A Teleservices Company
LMC Properties
Lockheed Federal Credit Union
Lockheed Martin Corporation
LodgeNet Entertainment Corporation
Logical Management Systems
Lohmann Animal Health International
London Hunt and Country Club
Los Angeles County Metro Transportation Authority
Los Angeles Mission
Lower Merion School District
Lucas County Facilities
Lundbeck Research USA
Mackenzie Financial Corporation
Madeira School
Madison Valley Medical Center
Mahec
Maid of The Mist Corp.
Mandalay on the Hudson
Maple Leaf Consumer Foods
Maricopa Integrated Health System
Marriott International
Martha Jefferson Hospital
Maslon Law Firm
Massachusetts Institute Of Technology
Mayer Brown LLP
Mazda North American Operations
MBANK
MD Management Ltd.
MDS Analytical Technologies
MDS Pharma Services
Mecklenburg County
MedAmerica, Inc.
Medco Health Solutions, Inc.
Medline Industries Inc.
Medtronic
Medtronic Emergency Response System
Mercy Ridge
Mesirow Financial
Methodist Childrens Hospital
Metro
Metro Properties
Metropolitan Library System
Metropolitan Transit Authority
MFSD
MGIC
Michigan State Univ. - Secchia Center
Micron Technology, Inc.
Micropac Industries, Inc.
Microvision
Mid America Clinical Laboratories
Mid Atlantic Coca Cola Co
Midcontinent Communications
Middlesex Savings Bank
Millennium: The Takeda Oncology Company
Milwaukee Metropolitan Sewerage District
Minntech Corporation
Mission Federal Credit Union
Missouri University of Science and Technology
Mitsubishi International Corporation
Mitsubishi Motors
Mitsubishi Power Systems
MKFM Consultancy
Moet Hennessy USA
Momenta Pharmaceuticals
Monro Muffler Speedy Auto
Monticello Casino and Raceway
Morgan Stanley
Morningside House
Morris Museum
Morrison & Foerster, LLP
Motorists Mutual Insurance
Mount Prospect Public Library
Mountain West Farm Bureau Mutual Insurance
Mt Graham Regional Medical Center
Municipal Employees Retirement System of Michigan
NanoDynamics.com
National Academy of Recording Arts & Sciences
National Association of Insurance Commissioners
National Baseball Hall of Fame
National Board for Respiratory Care Inc.
National Conference of State Legislatures
National Grid
National Mutual Insurance Comp
National Oceanic and Atmospheric Administration
National Public Radio
National Recreation and Parks
National Research Council
National Restaurant Association Solutions LLC
National School Boards Association
National Security Technologies, LLC
Participant List
© 2010 Facility Management Staffing Report Today’s Facility Manager International Facility Management Association 55
Nautilus Insurance Company
Naval Sea Systems Command
NAVTEQ
Navy Federal Credit Union
NBC Universal
NCO
NetApp
New Balance Athletic Shoe, Inc.
New Edge Networks
New Mexico Student Loans
New York City Bar
New York City Department of Environmental Protection
New York Hospital Queens
Neways Facilities
Newsday, Inc.
Nike, Inc.orporated
Nixon Peabody LLP
NKF GMS
North Kansas City Hospital
North Western Energy
Northern Indiana Public Service Company
Northern Virginia Community College
Northern Virginia Criminal Justice Training Academy
Northrop Grumman
Northrop Grumman Mission Systems
Northwest Florida Facility Management
Northwest Medical Center Oro Valley
Northwood Associates
Novartis Pharmaceuticals Corporation
Novellus Systems, Inc.
Novozymes
Nuance Communication
NXP Semiconductors
Oak Ridge National Laboratory, Battelle LLC
Oakland Schools
Oakwood Village
ODS Companies
OG&E
Ogletree, Deakins, Nash, Smoak & Stewart, P.C.
Ohio Department of Transportation
Ohio Housing Finance Agency
Ohio State University
Ohio Valley Bank
Ohr Somayach
Okaloosa County, Florida
Oklahoma City Community College
Omaha Steaks
Omnicare Clinical Research
Omron Electronics
On Semiconductor
One Beacon Insurance
Oneida Tribe of Indians of Wisconsin
OnPoint Community Credit Union
Optical Society of America
Oracle Corporation
Orange County
Orange County Fire Authority
Orange County Transportation Authority
Orange County’s Credit Union
Orlando Regional Healthcare
OWP&P Architects
Oxygen Media
Pall Life Science
Palm Beach County Fire Rescue
Papa John’s
Paragon Casino Resort
Park Place Developers, LLC
Park Wilshire HOA
Parker Hannifin Aerospace Group
Parker Hannifin Corporation
Parkland School Division No. 70
Parsons
Pathways Local Management Entity
Patient First
Pearson Education
Penn National Insurance
Pennsylvania Department of Transportation
Pennsylvania State University
PennWell Publishing
Pentair Electronic Packaging
Pepco Holdings, Inc.
Peregrine Semiconductor
Pericom Semiconductor
Petro-Canada
Pfizer
Philadelphia Museum of Art
Philadelphia School District
Philips Medical Systems
Phoenix Art Museum
Phoenix Insurance Company
Physicians Committee for Responsible Medicine
Pine Castle United Methodist Church
Pinellas County
Pitkin County
Planning Design Build Inc.
Plantronics
Please Touch Museum
PNC Bank
Polaris Industries Inc.
Polk County Board Of County Commissioners
Portland General Electric
Powertech Labs
PPL Services Corp.
PRA International
Prairie Meadows Race Track and Casino
Praxair Inc.
Precision Dynamics
Premier Research Group
Presstek, Inc.
Prevea Clinic
Pricewaterhouse Coopers LLP
Prince William County
Princeton Medical Center
Progress Energy
Progressive Medical Inc.
ProLogis
Proskauer Rose LLP
Providence Day School
PSECU
Puget Sound Energy
Purdue Research Foundation
PWGSC
Quaboag Regional Middle High School
Quest Diagnostic
Questar Gas Company
Quintiles Transnational Corp
R. L. Polk & Co
Radialpoint Inc.
RadiSys Corporation
Raiz Corporative Services
Randolph Field I.S.D.
Raymond James & Associates, Inc.
Raytheon Company
RCI
RealNetworks, Inc.
Red Rock Job Corps Center
Regence BlueShield
Region 16 Education Service Center
Region of Peel
Regional Municipality of York
Regional Transportation Commission
REIT Management & Research LLC
Research in Motion Ltd.
Resources Global Professionals
Retriever Payment Systems Inc.
Retro Studios
56 International Facility Management Association Today’s Facility Manager Facility Management Staffing Report © 2010
RFK LLC
RH Donnelley
Ridge Management
Right Now Technologies
Roche Palo Alto
Rochelle Township High School
Rockford Orthopedic Associates
Rockford Public Library
Rockland County Sewer District
Rockwell Automation
Rockwell Medical Technologies, Inc.
Rodgers Builders Inc.
Rohm & Haas Electronic Materials
Rosalind Franklin University
Ross Stores Inc.
Roush Fenway Racing
Royal Oaks Retirement Community
Sacramento Municipal Utility District
SAIC
Salem Congregation
Samson Investment Co.
San Antonio City Employers Federal Credit Union
San Diego County Credit Union
San Diego Data Processing Corp.
San Francisco Ballet
San Francisco Public Library
SanDisk Corporation
Sanofi-Aventis
Santa Clara Valley Water District
Santaluz Club
SAP America, Inc.
SAP Labs Canada
Sarasota County Government
SAS Institute Inc.
Saskatoon Health Region
Saskcentral
Saskenergy, Inc.
Saunders Construction, Inc.
SC FCU
Scantron Corp.
Schaumburg Park District
Schering Plough Corporation
Schlumberger
School Employee’s Retirement System
Science Application International Corporation
Scottrade, Inc.
Seacoast Church
Seattle Central Community College
Self Regional Hospital
Seminole Electric Coop Inc.
Sempra Utilities
Sentara Enterprises
Sephora USA Inc.
Serrano Country Club
Sharp Electronics Corporation
Shaw Communications, Inc.
Sheraton Bloomington Hotel
Sheridan Memorial Hospital
Shippensburg University
SickKids Foundation
Siemens Molecular Energy
Simon Fraser University
Simpson Gumpertz & Heger Inc.
Sinsinawa Dominicans
Sisters of Divine Providence
Sisters of IHM
SMART Technologies ULC
Smith & Nephew, Inc.
Smith College
Smiths Medical MD Inc.
SNC Lavalin Nexacor
Snohomish County
Social & Scientific System, Inc.
Social Security Administration
Solomon R Guggenheim Museum
South Carolina Department of Mental Health
South Dakota State Medical Association
South Shore Savings Bank
South Texas College
Southeast Missouri Hospital
Southeastern Regional School District
Southern California Association of Governments
Southern Progress Corporation
Southwest Business Corporation
Southwest Florida Water Management District
Southwestern Energy Company
Sovereign Bank
Spanish Fork City Corp.
Spartanburg Community College
Spartanburg County Facilities Maintenance
Spectrum Health
Spherion Corporation
Spheris Operations, LLC
Spirit Aero Systems
Springfield-Greene County Library
Springs Valley Bank & Trust
SSOE Inc.
St. Clair County Community College
St. Francis Hospital & Health Center
St. John Fisher College
St. John’s University
St. Joseph Hospital
St. Jude Children’s Research Hospital
St. Louis Community College
St. Louis Science Center
St. Lukes Rest Home
St. Mary’s Home Of Erie
St. Michael’s Health Group
St. Norbert College
Stanford University
State Farm Insurance Companies
State of Connecticut, Office of Legislative Research
State of Washington
State of Wisconsin - Dept of Administration
StatOil Hydro
Sterling Jewelers, Inc.
Stikeman, Elliott
Stoel Rives LLP
Storr Office Environments
STP Nuclear Operating Company
Strathmore Hall Foundation
Sub Zero, Inc.
Sullivan Group
Summit Credit Union
Summitt
Sun Lakes Country Club
Suncor Energy Inc.
Sungard Sct, Inc.
Surewest Communications
SWN
Symantec
Synthes
Systems Material Handling
Talisman Energy, Inc.
Tampa Armature Works Inc.
Tampa Electric Company
Target Corporation
Taylor Corp
TCF Bank
Teachers Credit Union
Teachers Federal Credit Union
Technicolor by Thomson
TECNA S.A.
Tekelec
TeleCommunication Systems, Inc.
Participant List
© 2010 Facility Management Staffing Report Today’s Facility Manager International Facility Management Association 57
Tesoro
Texas Gas Service
Texas Guaranteed
Texas Mutual Insurance Company
The Aerospace Corporation
The American Board of Pediatrics
The Art Institute of California-San Francisco
The Auto Club Group
The Bartech Group
The Board of Pensions of The Presbyterian Church (U.S.A.)
The Boeing Company
The Capital Group Companies, Inc.
The Cementbloc
The Center For Health Affairs
The Chapel
The Church of Jesus Christ of Latter-Day Saints
The Colburn School
The Colonnade Hotel
The Columbus Foundation
The Country Club
The County of Dufferin
The Cultural Arts Center
The Cumis Group LTD
The Dow Chemical Company
The Economical Insurance Group
The Elliott-Lewis Corp
The Florida Aquarium Inc.
The Frazier International History Museum
The French Culinary Institute
The George Washington University
The Hanover Insurance Group
The Hartford
The International School of Port of Spain
The Lower Colorado River Authority
The Mariners Museum
The MathWorks, Inc.
The Menninger Clinic
The MITRE Corporation
The Money Group
The Morton Arboretum
The New York Public Library
The Newberry Library
The Ohio State University Facilities Operations And Development
The Procter & Gamble Company
The Pyne Company of Colorado, Inc.
The Rand Corporation
The RoomPlace
The Saban Free Clinic
The Salvation Army
The Toledo Blade
The Trizetto Group
The University Of North Carolina at Charlotte
The Vanguard Group
The Walt Disney Company
The World Bank
Thomson Financial
Thomson Reuters
Thrivent Financial For Lutherans
Tiffany & Co.
Time Warner Cable
T-Mobile
Total Logistic Control
Total Quality Logistics
Town and Country Manor
Town of Apex
Town of Stockbridge
Town Sports International
Towson University
Toyotetsu North America
Trammell Crow Co. at McKesson
TransAlta Utilities Corporation
TransCore Inc.
Transition Development Group Inc.
Transport Canada
Travis Credit Union
Treasure Coast Hospices
Trico Products
Trimble Navigation Ltd
Trover Solutions Inc.
Trueblue Inc.
TruMark Financial Credit Union
TTI Inc.
Tucson Airport Authority
Tuesday Morning
Tufts Associated Health Plans, Inc.
TW Telecom Inc.
Tweddle Group
Tybrin Corporation
U.S. Central Federal Credit Union
U.S. Coast Guard
U.S. Department of Agriculture
U.S. Embassy Vienna
U.S. Food and Drug Administration
U.S. General Services Administration
U.S. Government Accountability Office
U.S. Joint Forces Command
U.S. Patent & Trademark Office
UGL UNICCO Integrated Facilities Services
United Airlines
United Dairy Farmers
United Fire & Casualty Co.
United S A Federal Credit Union
United Services Automobile Association
United States Conference of Catholic Bishops
United Way of America
Universal American Financial Corp.
University of Alberta
University of Iowa Foundation/Levitt Center for University Advancement
University of Maryland Baltimore
University of North Carolina
University of Northern British Columbia
University of Pittsburgh
University of Redlands
University of St. Thomas
University of Tennessee
University of Texas at San Antonio
University of Washington
University of Winnipeg
Unum Group
Urban Land Interests
US Bank Corporate Properties
US Cellular
USA Federal Credit Union
USAA
USDA Research Service
USMD Hospital at Arlington
Valley Emergency
Van Andel Institute
Van Matre HealthSouth
Vangent Inc.
Vanguard
VB Schools
Ventana Medical Systems, Inc.
Vera Bradley Designs
Verisign, Inc.
Verizon Services Organization
Verizon Wireless
Viox Services, Inc.
Virginia Credit Union, Inc.
VLSI Standards Inc.
Vorys Sater Seymour & Pease
Waddell & Reed, Inc.
Walgreens
Walsh College
Waltham School District
58 International Facility Management Association Today’s Facility Manager Facility Management Staffing Report © 2010
Warren Hospital
Washington State Department of Transportation
Washington State Fire Training Academy
Washington-Centerville Public Library
Washoe County
Wayne State University
Weather Channel
Weil, Gotshal & Manges
Weinberg, Wheeler, Hudgins, Gunn & Dial, LLC
Welch Allyn
WellCare Health Plans
WellPoint, Inc.
Wells Dairy
Wells Fargo
Wells Fargo Home Mortgage
Well-Spring Retirement Community
WesCorp
Wesley Commons
Wesleyan University
Westchester Country Club
Western Michigan University Campus Facilities
Western New England College
Western Washington University
Weyerhaeuser Company
White Wave Foods Company
Whitman Walker Clinic
Wicomico Board of Education
Wildman, Harrold, Allen & Dixon
William Blair & Company
Williamson County
Wilmer Cutler Pickering Hale and Dorr
Winnebago County
Wizards of the Coast
WK Kellogg Foundation
Wood TV
Woods Hole Oceanographic Institution
Workforce Partnership
WorkSafeBC
Workscape, Inc.
World Trade Center of New Orleans
Worley
WSFS Bank
WTAS LLC
Wycliffe Bible Translators
Wyeth Research
Wyndham Hotels & Resorts
Xavier University
XL Capital Assurance Inc.
XL Global Services
Yale University Facilities Operations
Yale University, School of Management
Yale University, School of Medicine
York County General Services
Yukon Government
Zimmer Spine
Zurich North America
Participant List
iFMa anD iFMa FounDation reSearCh PubLiCationS:
Operations and Maintenance Benchmarks, Research Report #32
Distributed Work, Research Report #31
Benchmarks V Annual Facility Costs, Research Report #30
Profiles 2007 Salary Report, Research Report #29
Space and Project Management Benchmarks, Research Report #28
An Inside Look at FM Outsourcing, Research Report #27
European Benchmarks, Research Report # 22
Facilities Management Outsourcing: An Overview of the Industry and its Largest Companies
IFMA Standardized Facility Management Customer Satisfaction Questionnaire
Cut it Out! (IFMA Foundation Report)
The Business of Green Cleaning (IFMA Foundation Report)
FM Technology Update (IFMA Foundation Report)
Violence in the Workplace - The Role of the Facility Manager (IFMA Foundation Report)
Pandemic Preparedness Manual (IFMA Foundation Report)
Designing the Facility Management Organization (IFMA Foundation Report)
Wireless Systems in the Facility (IFMA Foundation Report)
MeaSureMent StanDarDS:
Standard Practice for Building Floor Area Measurements for Facility Management (ASTM E 1836-08)
Standard Practices for Measuring and Calculating Building Loss Features That Take Up Floor Area in Buildings (ASTM E 2619-08)
A Unified Approach for Measuring Office Space, For Use in Facility and Property Management (IFMA/BOMA)
Visit www.ifma.org to view findings from other IFMA and IFMA Foundation studies.
© 2010 iFMa all rights reserved. iSbn 1-883176-81-6Copyright and photocopying: Because this report is copyrighted, one must obtain permission to copy from the Copyright Clearance Center (CCC), 222 Rosewood Drive, Danvers, Mass. 01923. CCC’s phone number is +1-978-750-8400; www.copyright.com. There is a nominal charge payable to CCC to photocopy any page herein for personal or internal reference use. Unauthorized duplication or use of the information and/or contents herein without express written authorization of IFMA is strictly prohibited.
An InForMAtIon leAder For the FM proFessIon… In order to keep the profession informed of new developments in the industry, ongoing research is essential. IFMA conducts a variety of research programs year-round that serve to strengthen the knowledge and skills of FM professionals, while also advancing the profession itself.
From industry surveys to forecasting to best practices forums, IFMA’s research department draws on the practices and opinions of FM professionals and educators, covering topics vital to the day-to-day operations of facility professionals and the built environment in general.
aDDitionaL inForMation Please contact IFMA headquarters for:
For more information, contact iFMa at 1-713-623-4362.
Under no circumstances may an IFMA research publication or service by used or requested for any purpose of commercial or business solicitation. IFMA reserves all rights to publish information including data supplied to members through its information services and strictly prohibits the use for any form of commercial or self promotion.
Forming benchmarking consortiums
Information from existing IFMA reference sources
Custom research studies
•
•
•
Additional copies of IFMA research publications
Facility management books and publications
Permission for material reproduction, quotation or use
•
•
•
Achieving certification planted my feet
firmly in the profession, and made
me feel like a professional FM.
Sharon Kinsman, CFM, senior vice presi-
dent, administration, National Association
of Broadcasters, Washington, D.C.
Becoming an FMP and a CFM has
opened up new horizons with greater
resources that were unknown to me
beforehand. IFMA’s efforts to pro-
mote and formalize the FM profes-
sion is a much-needed endeavor that
I feel fortunate to be a part of.
Craig Hale, CFM, FMP
I am sure my career would not have
taken the same direction had I not
become a CFM. It led me to seek out
better employment, where the CFM
designation is a requirement, not a
preference.
David Ling, CFM, director of facilities &
technical services, Benaroya Hall, Seattle
Symphony
®
®
IFMA’s Certified Facility Manager® (CFM®)credential sets the industry standard for ensuring the knowledge and abilities of practicing facility managers. The CFM was the first in facility management and remains the only global certification for the profession. The competency-based CFM articulates the level of skill and talent required for the profession. Certified Facil-ity Managers are recognized industry-wide for their proven abilities and demonstrated commitment to achieving excellence in the profession.
Process:
SteP 1: Assess your readiness. Review the nine core competency areas on the IFMA Web site and estimate your level of knowl-edge. You may opt for additional training.
SteP 2: Submit your application.
SteP 3: Schedule and pass the exam. Candidates must take the exam within three months of acceptance.
SteP 4: You’re certified!
CFM Candidate Assistance:▪ Online CFM self-assessment test.▪ Online self-study and on-site instructor-
led competency courses.▪ CFM Exam Review course offered
throughout the year.▪ Chapter or council study groups
and mentoring programs.
The knowledge-based Facility Manage-ment Professional (FMP®) credential will prepare you for the unique challenges of the profession, focusing on competencies essential to daily responsibilities. Acquire career-building knowledge and skills, and set yourself apart by demonstrating your commitment to furthering your FM knowledge.
Process:
SteP 1: Complete the four required IFMA courses, taken in any order.
SteP 2: Submit your application.
SteP 3: You’re an FMP!
FMP Candidate Assistance:▪ FMP required instructor-led courses
held throughout the year.▪ Complete program requirements
with IFMA’s self-study courses.▪ Complete courses at colleges, univer-
sities or technical programs that offer certificates or professional degrees in facility management; or through IFMA Approved Providers.
IFMAProFeSSIonAl CredentIAlSThe recognized leader in professional FM credentialing
Public and private employers and government agencies rely on professional credentialing programs to ensure the knowledge and abilities of practicing facility managers.
“”
“
”
“”
1 E. Greenway Plaza, Suite 100Houston, Texas 77046-0194, USA
P: 713-623-4362F: 713-623-6124www.ifma.org
Credentials ad_back cover.indd 1 3/29/2010 11:45:12 AM


