30
Facing the end of fossil fuels
| Date post: | 22-Dec-2015 |
| Category: |
Documents |
| Upload: | jada-ellender |
| View: | 216 times |
| Download: | 0 times |

Facing the end of fossil fuels

“Our ignorance is not so vast as our failure to use what we know.”
M. King Hubbert

17th century
◦Archbishop Ussher – earth formed in 4004 BC
18th century
◦Count Buffon – 75 thousand years
19th century
◦Lord Kelvin – 98 million years
20th century
◦4.5 billion years

How long are we here for?
How much energy do we need?
How much energy do we have?
How quickly can we change?

Energy consumption is growing at ½ the rate of long term economic growth
Global economic growth rate is ~4%
Global energy growth rate is 2%
Current global oil consumption rate is ~31GBbl/yr, 1GBbl every 12 days

2035 2070 21051858 to 2000
Total consumption doubles every 35 years
MaintainingBAU will require 7 T BBL of oil this century
2T BBL
1T BBL1T BBL
4T BBL

Reserves: 5.5 Trillion BblRequirement: 7 Trillion Bbl

Conventional Oil

IEA undertook its first ground up analysis of energy production in 2008
Estimates for growth of oil production trimmed from 120 Mbpd to 105 Mbpd
IEA calls for investment of $28 Trillion to maintain growth


"The 120m figure always was nonsense but even today's number is much higher than can be justified and the IEA knows this.
"Many inside the organisation believe that maintaining oil supplies at even 90m to 95m barrels a day would be impossible but there are fears that panic could spread on the financial markets if the figures were brought down further.“
◦ “Key oil figures were distorted by US pressure, says whistleblower” Nov. 9, 2009, guardian.co.uk


“Traditional fossil fuel resources face serious supply constraints and an oil supply crunch is likely in the short-to-medium term with profound consequences for the way in which business functions today.”◦ - Lloyds 360° Risk Insight

“Christophe de Margerie, head of the French oil giant Total, flatly declared that the "optimistic case" for maximum daily output was 100 million barrels
Royal Dutch Shell's CEO, Jeroen van der Veer: "after 2015 supplies of easy-to-access oil and gas will no longer keep up with demand."

By 2012, surplus oil production capacity could entirely disappear, and as early as 2015, the shortfall in output could reach nearly 10 MBD.◦ The Joint Operating Environment (JOE) 2008◦ United States Joint Forces Command Center for Joint Futures

1. Few large fields, many small fields2. Increasing capital costs3. Declining energy return on energy
investment

Over half of our oil production comes from 130 giant, aging oil fields
Remainder comes from about 4500 currently active fields
As giant fields decline they will have to be replaced by many smaller fields
Exploration rates and investment will have to increase

Sources: AAPG Memoirs, Oil and Gas Journal, Rigzone, RJ Research estimates and analysis
Giant Oil Fields Reserve Adds Dropping Every Decade Since the 1960s
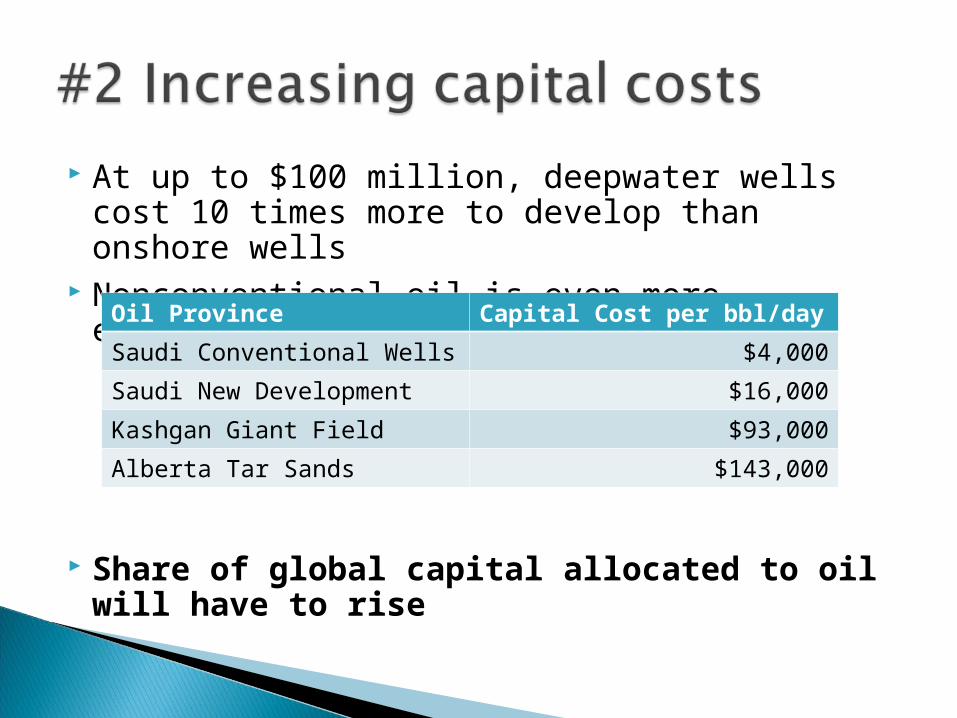
At up to $100 million, deepwater wells cost 10 times more to develop than onshore wells
Nonconventional oil is even more expensive
Share of global capital allocated to oil will have to rise
Oil Province Capital Cost per bbl/day
Saudi Conventional Wells $4,000
Saudi New Development $16,000
Kashgan Giant Field $93,000
Alberta Tar Sands $143,000

• Conventional oil 20:1• Tar Sands 5:1


Likely too late to start mitigation before peak
Rate of decline is unpredictable Peak may be masked by economic
recessions Mitigation strategies will take decades to
implement

Fossil Fuels85%

Vehicle efficiency◦ Mpg standards could be doubled◦ 20 year replacement time for auto fleet◦ Efficiency offset by growth in car ownership
Efficiency potential is limited◦ Engines at near practical limits◦ Aerodynamics are largest problem◦ Solution is small, lighter and slower

Coal-to-Liquids/Gas-to-liquids◦ Half of the energy content of coal consumed in
the conversion process◦ GHG emissions effectively double◦ URC Coal reserves being revised downward◦ Additional demand would reduce them faster

“it is feasible to keep atmospheric CO2 from exceeding about 450 ppm by 2100, provided that emissions from coal and unconventional fossil fuels are constrained. James E Hansen, “Implications of “peak oil” for atmospheric CO2 and climate”

Peak oil will not prevent climate change◦ But IPCC worst case emission scenarios may not
be realistic

We are exhausting our non-renewable energy resources to destroy our renewable resources
Within a century we will be left with neither
The rate at which we can adapt is likely to be slower than the rate of energy decline


