UNIVERSITÀ DEGLI STUDI DI MILANO FACOLTÀ DI SCIENZE E TECNOLOGIE Corso di Dottorato in Chimica Industriale XXXIII Ciclo New organic and hybrid organic/inorganic materials with intriguing solid state optoelectronic properties Andrea PREVITALI R12058 Tutor: Prof.ssa Elena CARIATI Coordinatore del corso: Prof.ssa Dominique Marie ROBERTO Anno Accademico 2019-2020
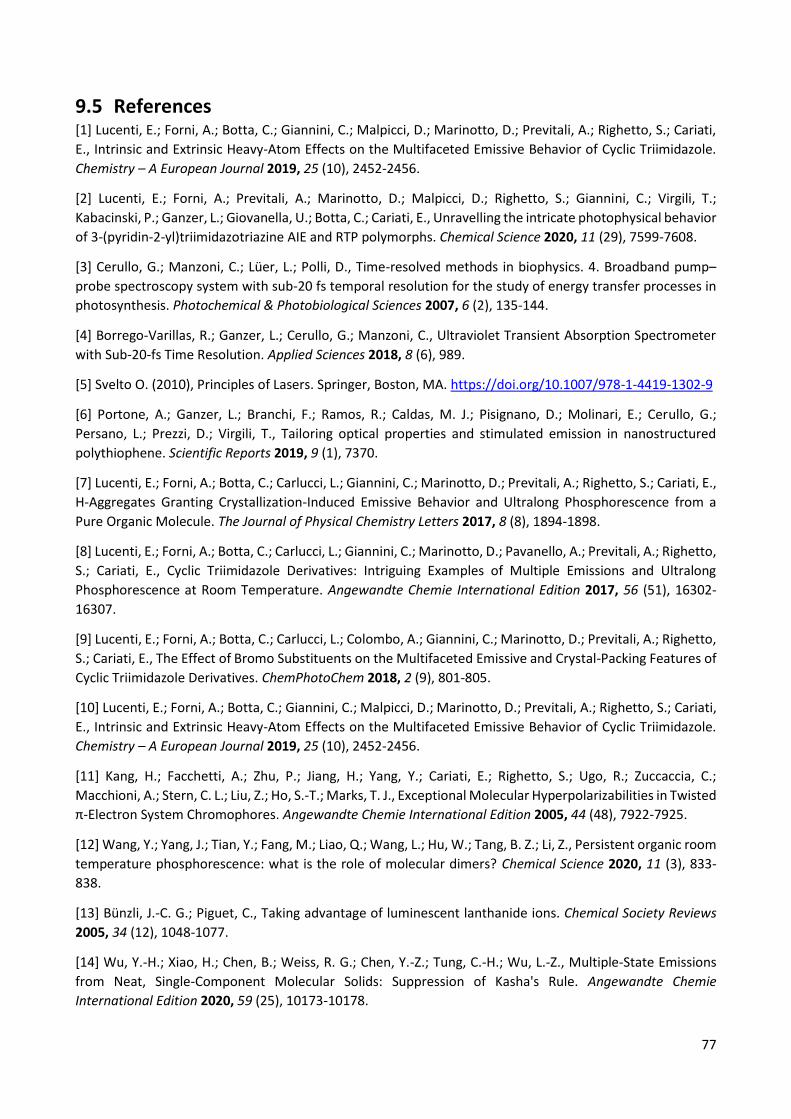
Transcript
UNIVERSITÀ DEGLI STUDI DI MILANO
FACOLTÀ DI SCIENZE E TECNOLOGIE
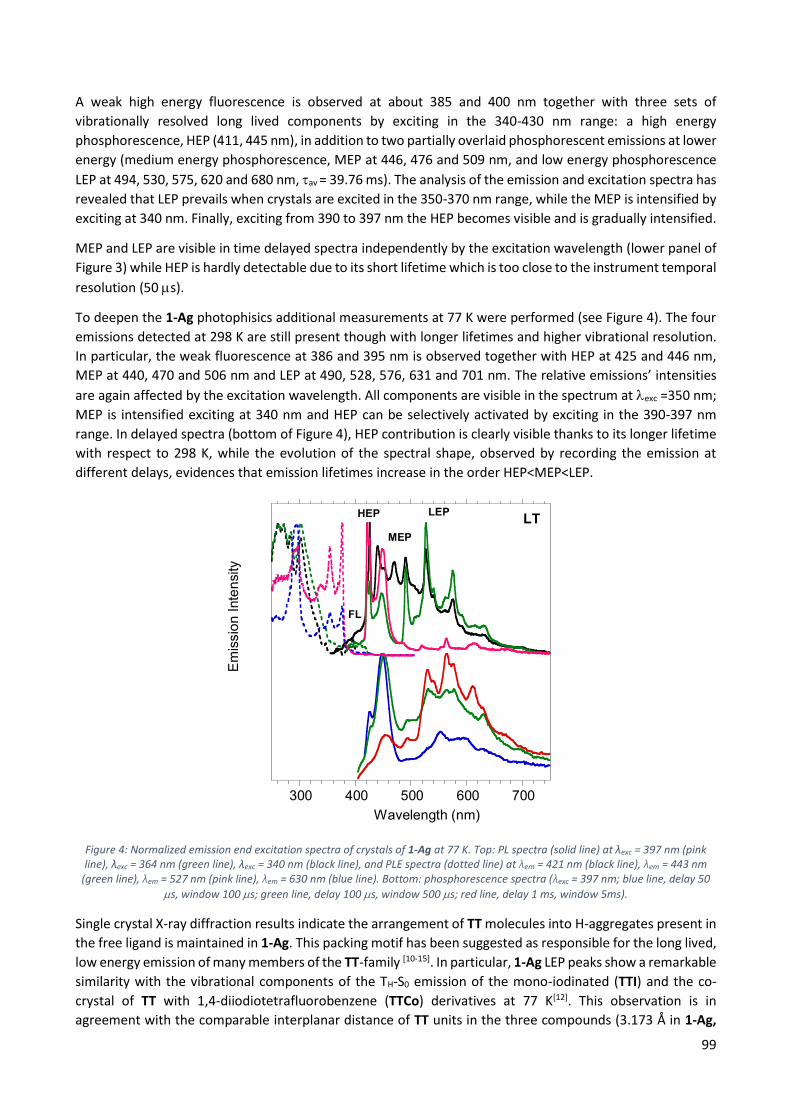
Corso di Dottorato in Chimica Industriale XXXIII Ciclo
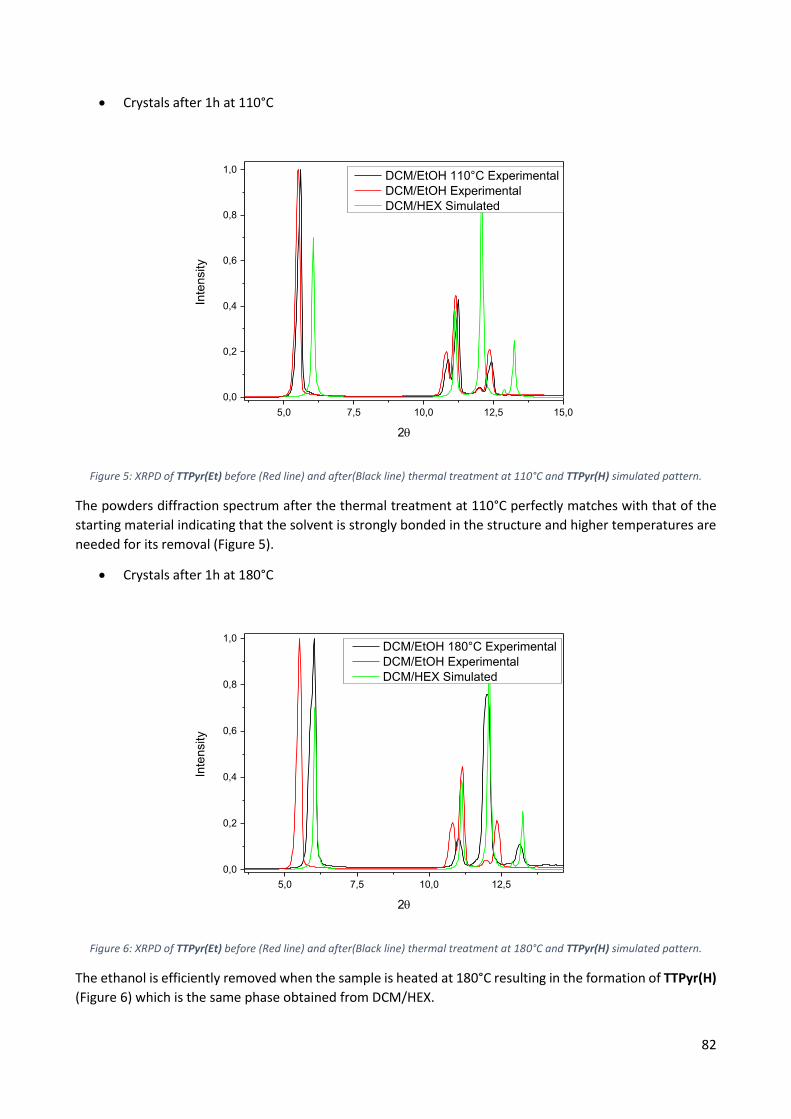
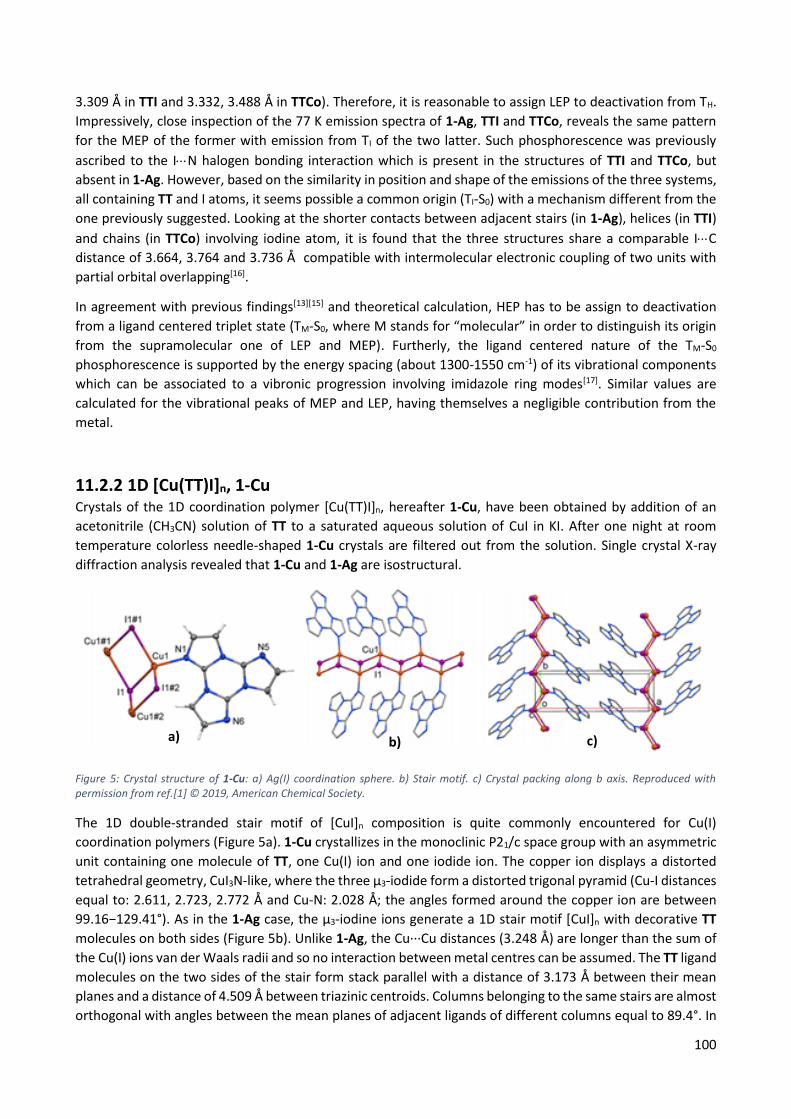
New organic and hybrid organic/inorganic materials
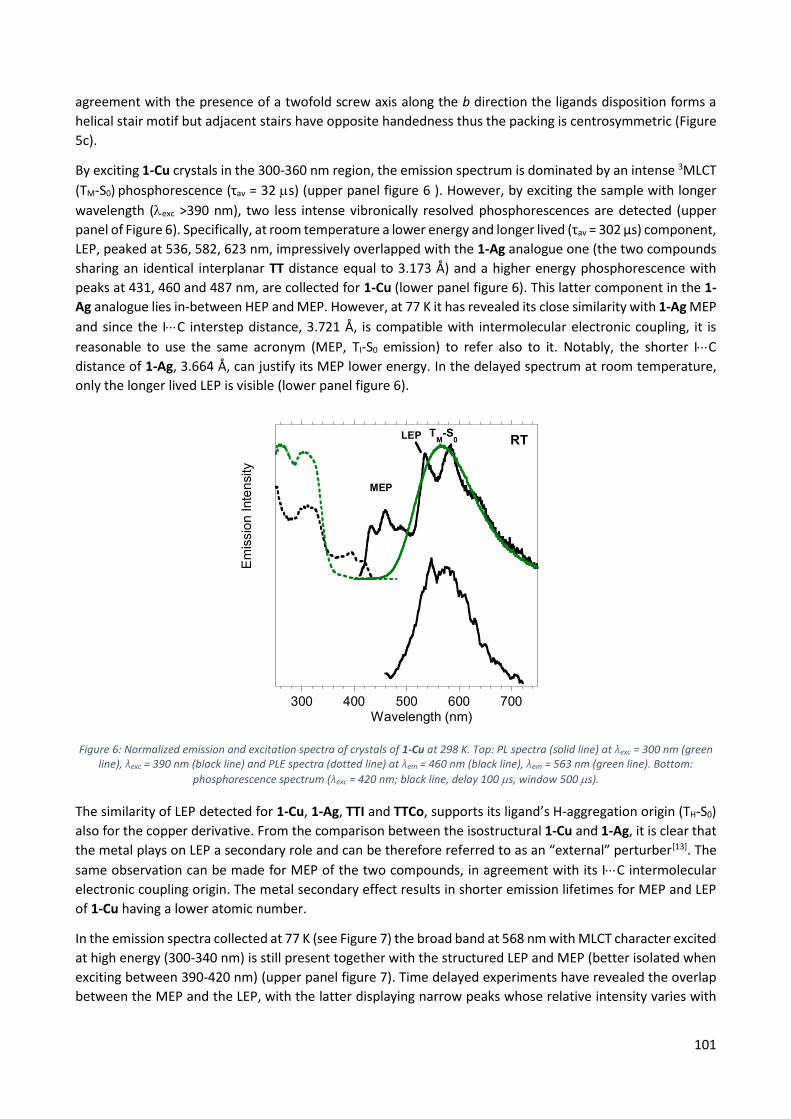
with intriguing solid state optoelectronic properties
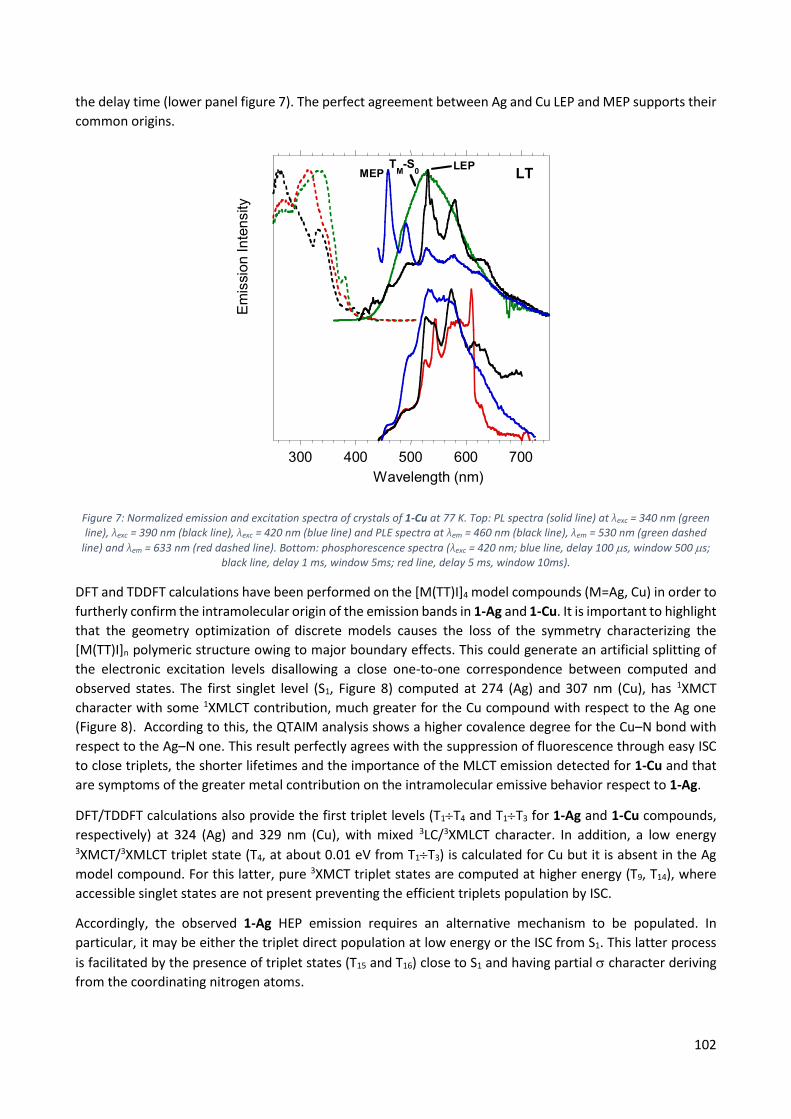
Andrea PREVITALI
R12058
Tutor: Prof.ssa Elena CARIATI
Coordinatore del corso: Prof.ssa Dominique Marie ROBERTO
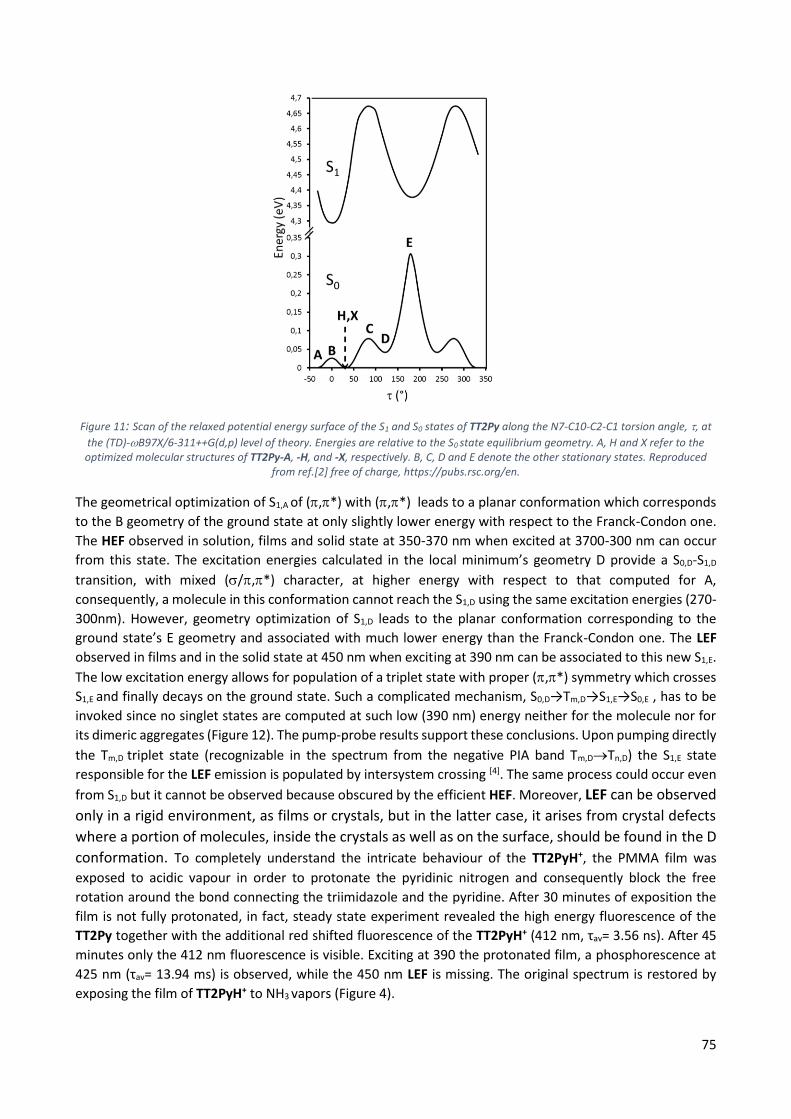
Anno Accademico 2019-2020
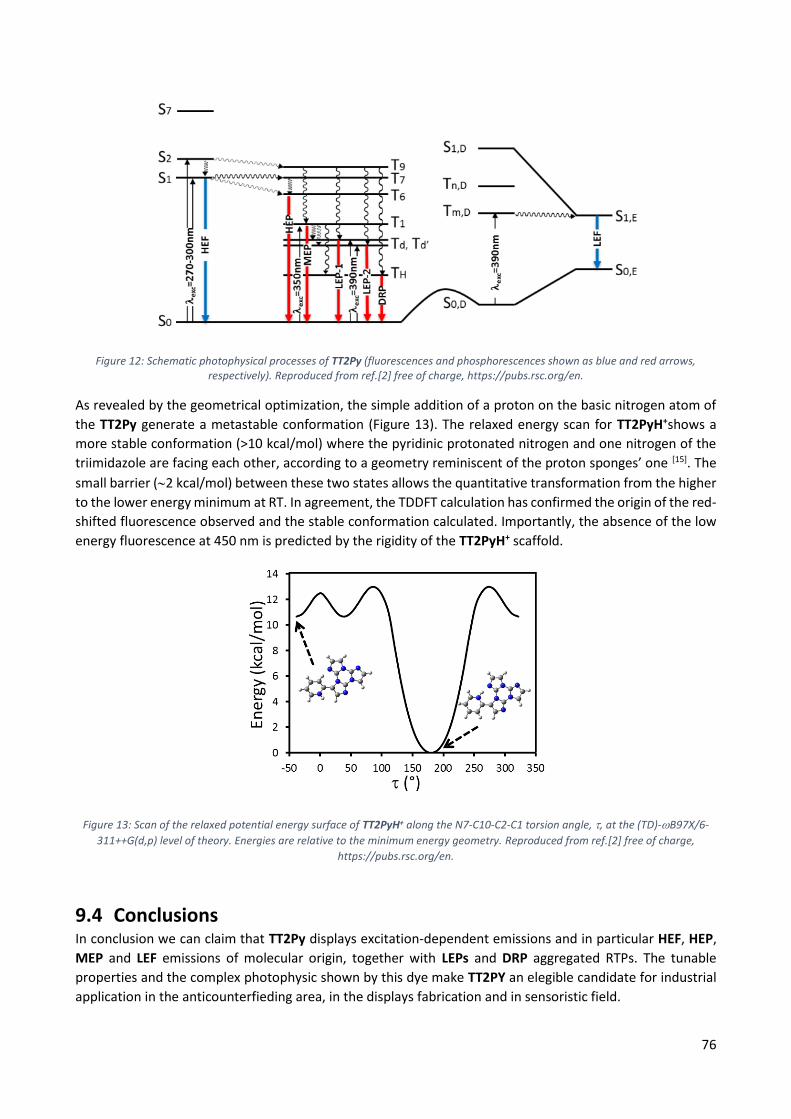
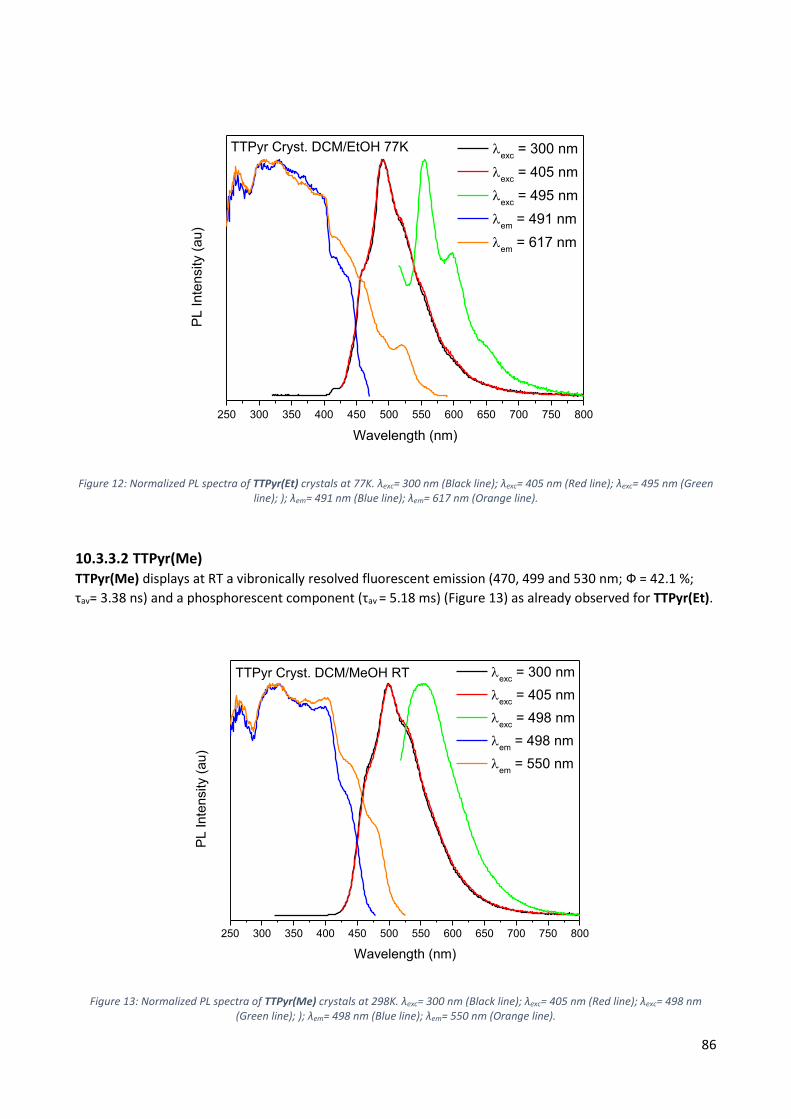
i
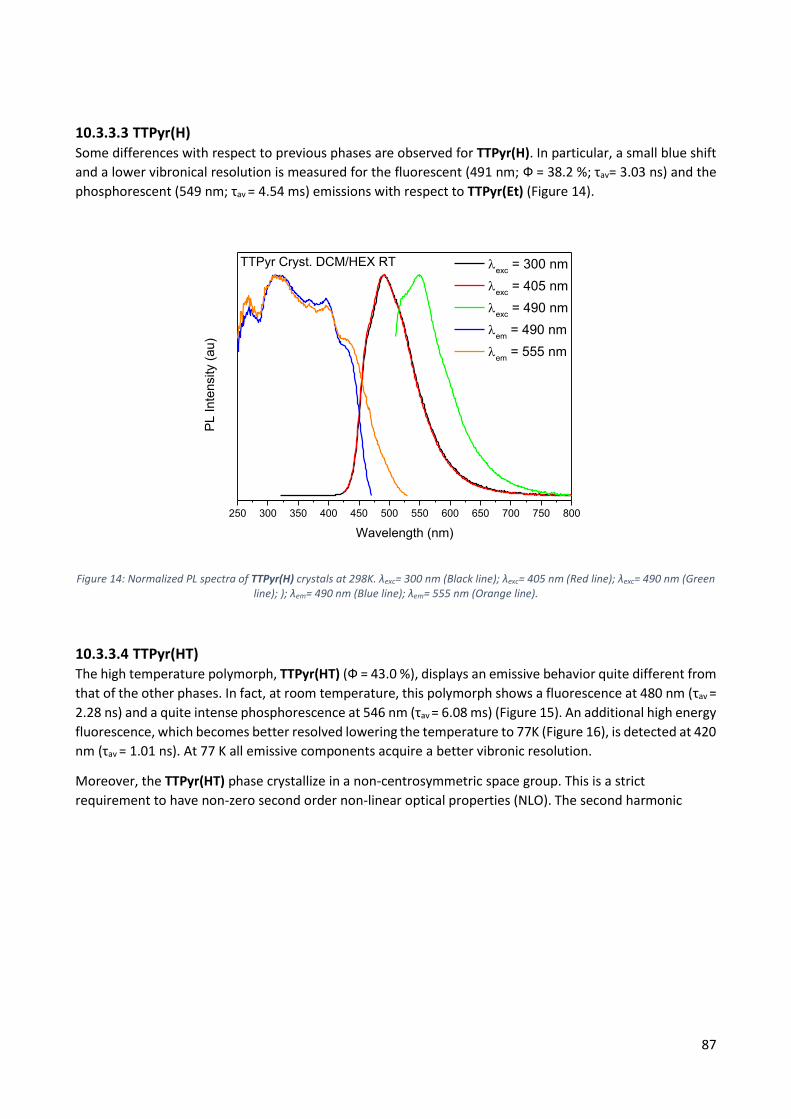
Index
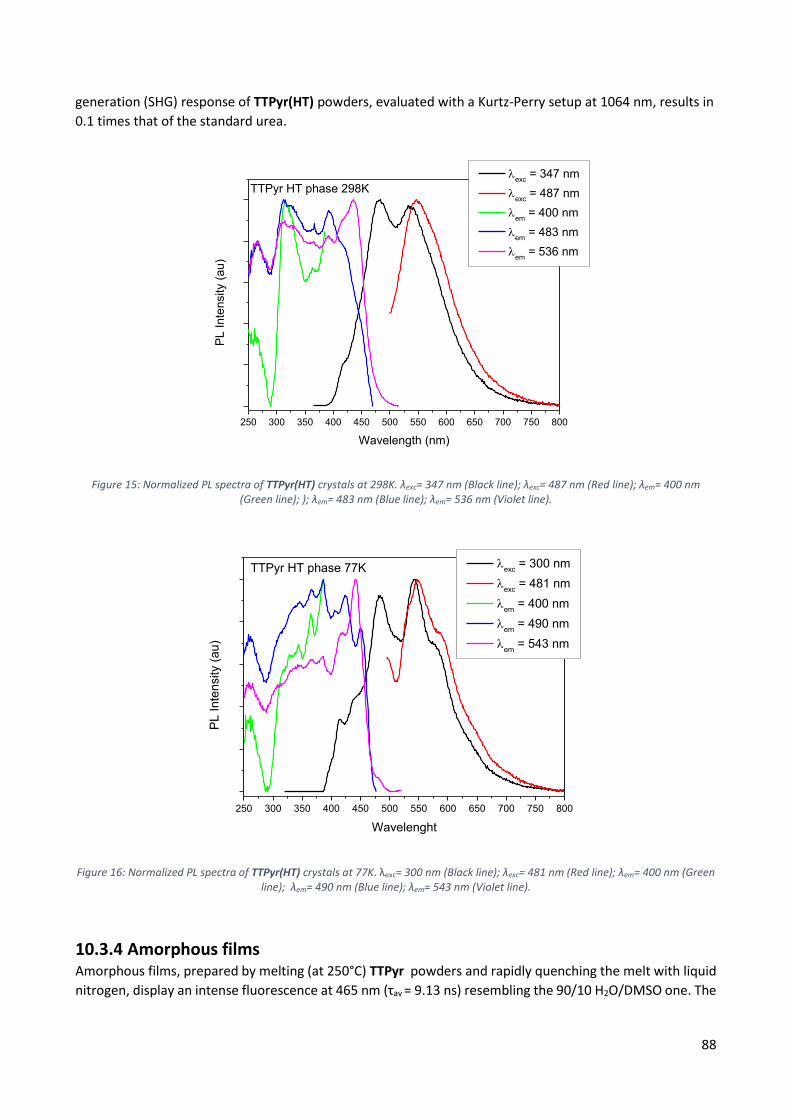
1 Fluorescence and Phosphorescence: a thousand-year history .......................... 1
1 Fluorescence and Phosphorescence: a thousand-year history The modern perception of the photoluminescent phenomena is the product of an intensive work mostly
concentrated in the 19th and 20th centuries. Actually, even before the discovery of the photoelectric effect
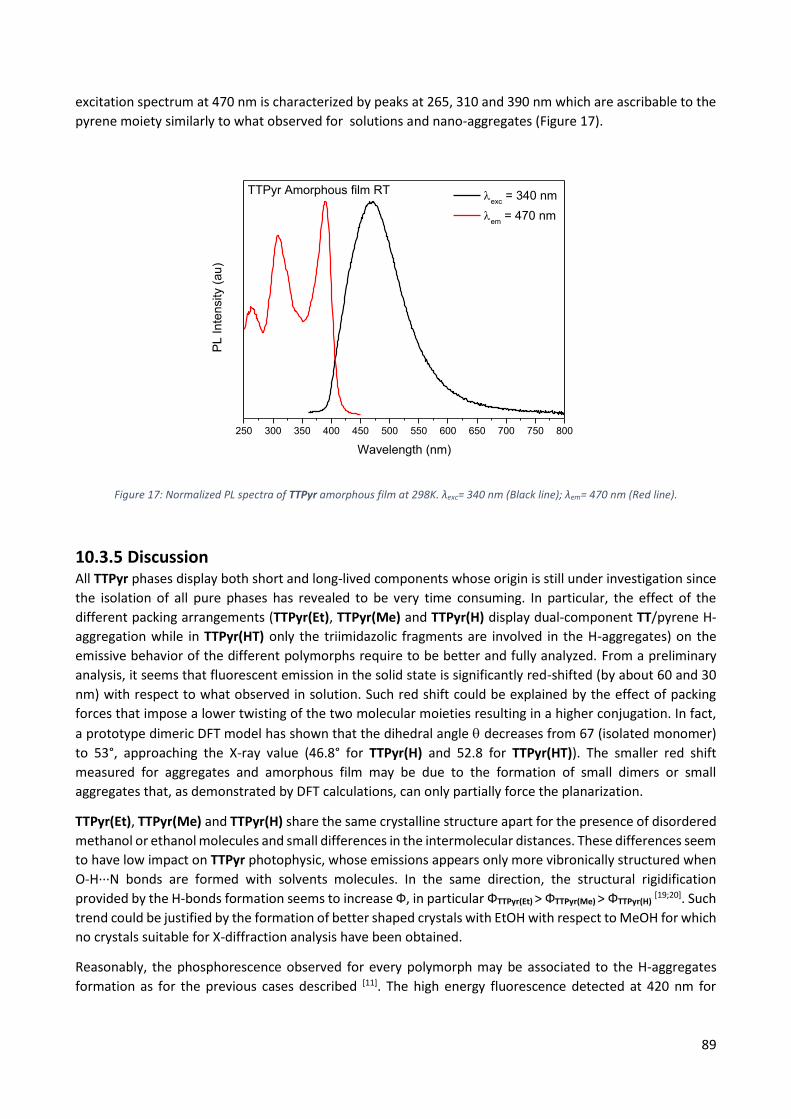
and the wave-particle duality in quantum mechanics, the scientific community has tried to explain some
exceptional phenomena observed when light and some specific materials are interacting[1].
Figure 1: Representation of Pliny the Elder
Along the centuries many proof of the observation of photoluminescent phenomena can be find. Evidences
of this are present in the documents written by Pliny the Elder (Naturalis Historia (libri XXXVI e XXXVII)) in
the ancient Rome and by Saint Albert the great (Historia animalium (1555)) during the Middle age. During
the middle ages it is possible to date the born of the terms phosphor that was use to describe materials able
to glow in the dark after exposure to light, this term derives from the Greek name of Venus and it literally
means the light bearer. Only later, the name Phosphor, was given to the element discovered by Brandt in
1677, that has observed the glow from the vapors produced by this new element exposes to the atmosphere.
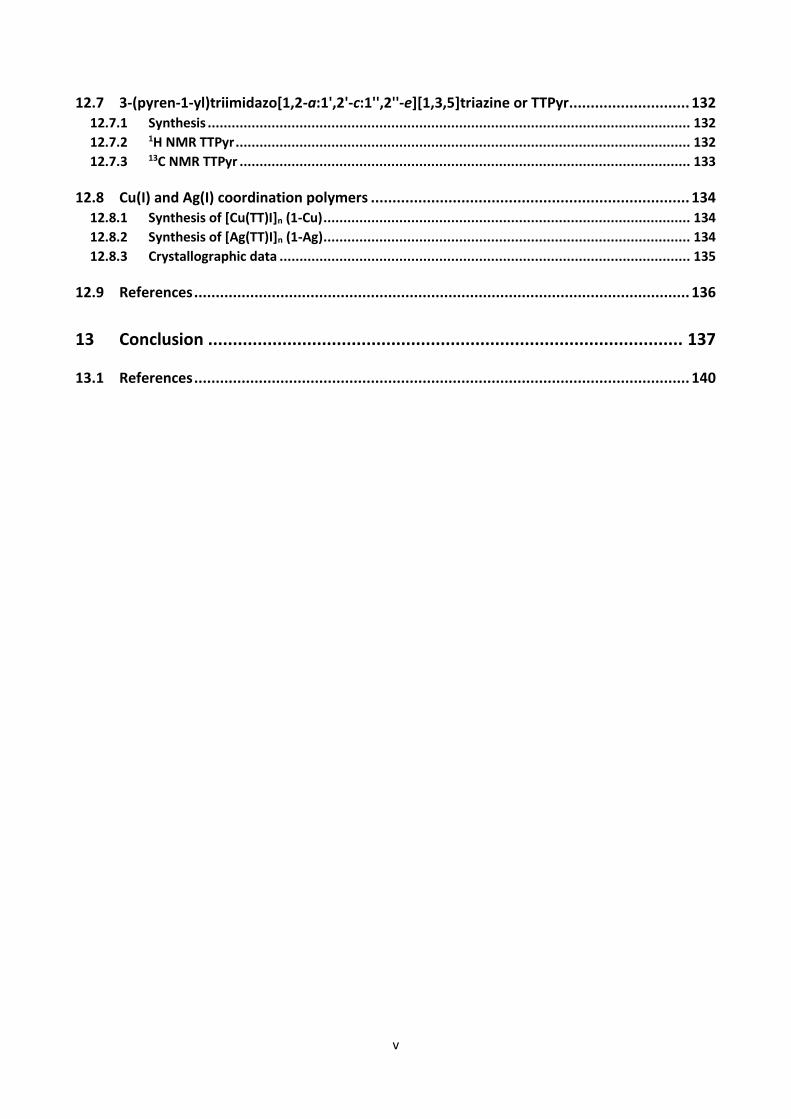
The most famous case of glow-in-the-dark material is the rock known as the Bolognian Phosphors (impure
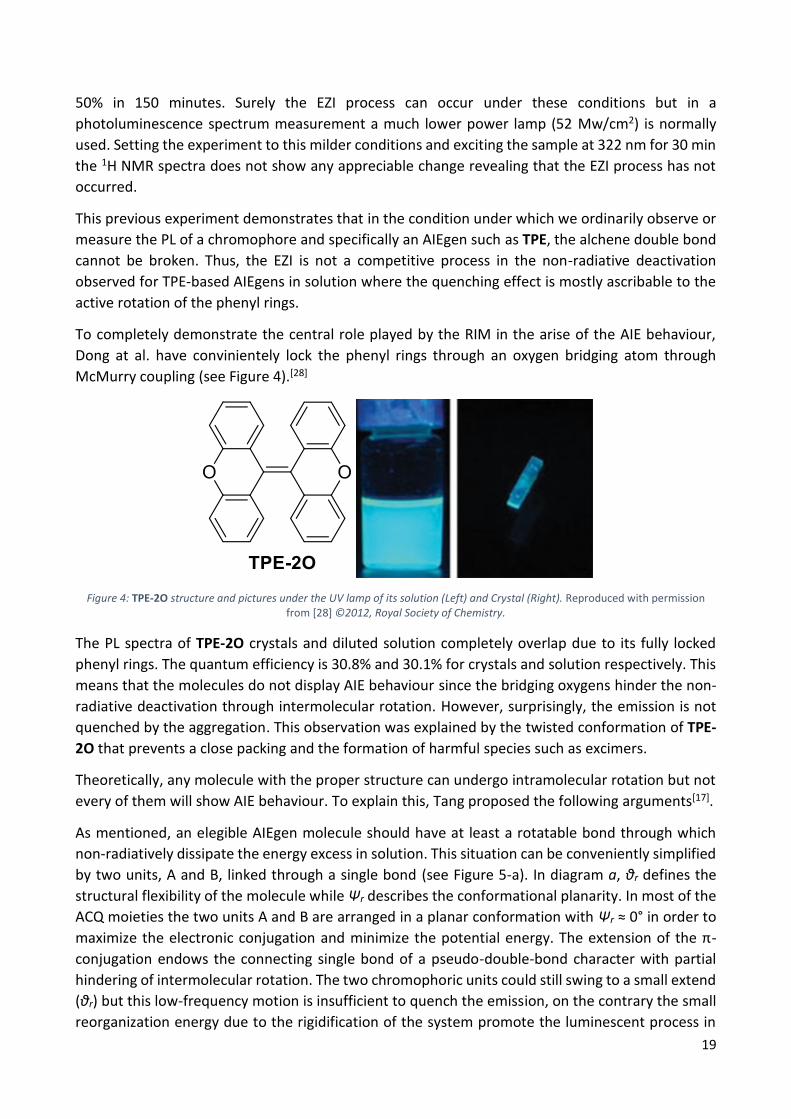
barium sulfate) discovered by a cobbler, Vincenzo Casciarolo, in Bologna in 1602. This rock, after calcination
with coal, was able to store and re-emit the sunlight for a certain time.
Figure 2: Bolognian Phosphors
2
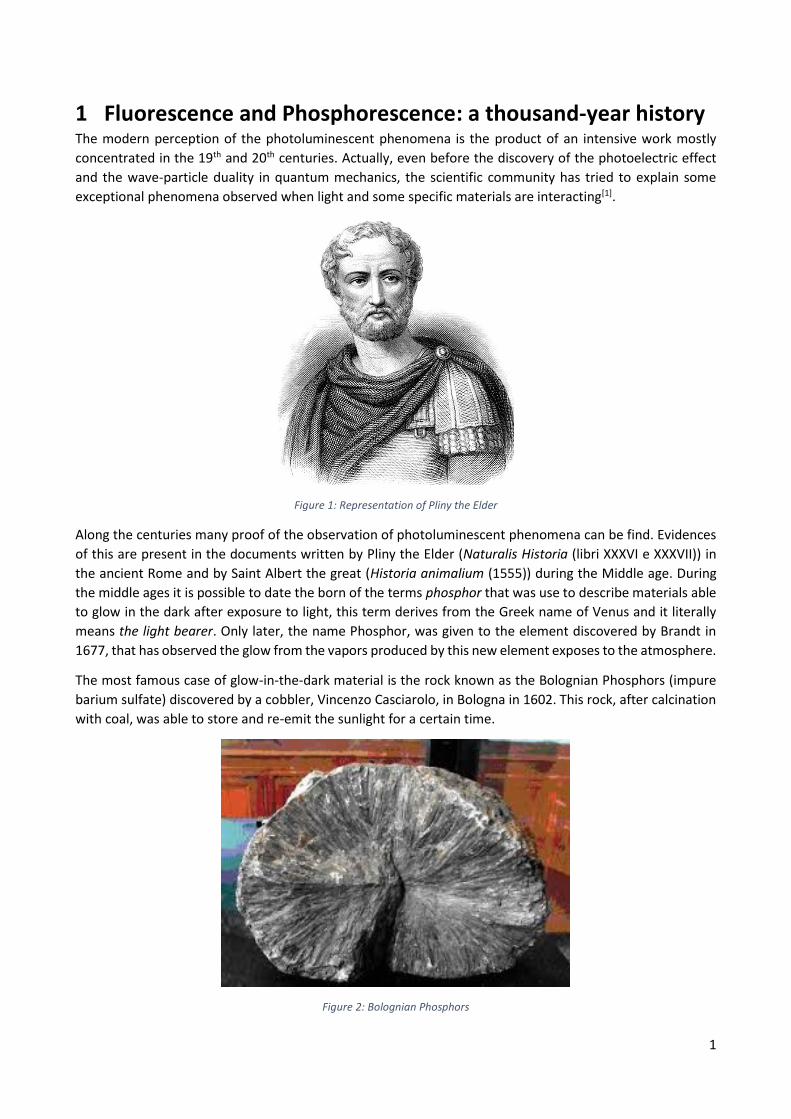
Previously, in 1565, the botanist Nicolas Monardes, noticed the bluish colour of an infuse of a plant, named Lignum Nephriticum, that was used by the Incas population as medicine. Matlaline is responsible for the particular coloration and is the oxidation product of the flavonoids contained in the plant. The peculiar bluish coloration of the infuse, observed under particular observation condition, is the very first case of anti-counterfeiting system, in fact, Monardes explain that another plant was sold as Lignum Nephriticum, but the false plant shows only a yellow infusion and no blueish emission[2-4].
Figure 3: Left: Lignum Nephriticum paint. Right: Lignum Nephriticum picture under day and UV light.
However, many famous scientists, as Newton and Boyle, have investigated the particular behaviour of this
solution but its nature wasn’t completely understood at that time.
In 1819, a British geologist, Edward D. Clarke, has firstly reported the discovery of a fluorite crystal in Durham
describing the mineral as the most beautiful crystal he had ever seen before. Crystals of the “Durham fluor”,
as it was later called, show deep blue sapphire colour by reflected light and an intense emerald green by the
transmitted light. Clarke offered no explanation for this behaviour but, in 1822, the French mineralogist Rene-
Just Haüy, observed a similar behaviour in a fluorite crystal and it explain the phenomenon as a kind of
opalescence, unfortunately for him he was wrong and many years were required to understand this
uncommon behaviour.
Sir David Brewster, in 1833, describe a red dichroism in a green alcoholic extract of chlorophyll when is
observed from a side. The case was considered analogous to the one of the Durham fluor, and explained
through opalescence[5].
In 1845, Sir John Herschel, inventor of the term “photography”, describes the blue surface colour of an inner
colourless concentrate quinine sulfate solution. He named the phenomenon “epipolic dispersion” from the
greek term “surface”. In this case the high concentration prevents the light to be adsorbed by the inner part
of the solution and the blue emission seems to be only superficial. Herschel, using a prism, demonstrated
that only using the blue end of the spectrum was possible to observe the epiploic dispersion but he did not
recognise that the emission had a lower energy, with a blue-green colour. He extended his theory even to
fluorite crystals but, in the Lignum Nephriticum case, he claimed the effect was due to a tiny particles
dispersion. When Brewster read about the epopilic dispersion and the intrinsic contradiction with his theory
decided to further investigate this phenomenon proving the phenomenon was not superficial. For this
reason, Brewster proposed that the behaviour observed was a new case of interaction between light and
3
some specific fluid and solid, in particular he claim that the media he studied contained minute crystals
randomly oriented able to disperse the unpolarised light. Unfortunately, he was wrong[6].
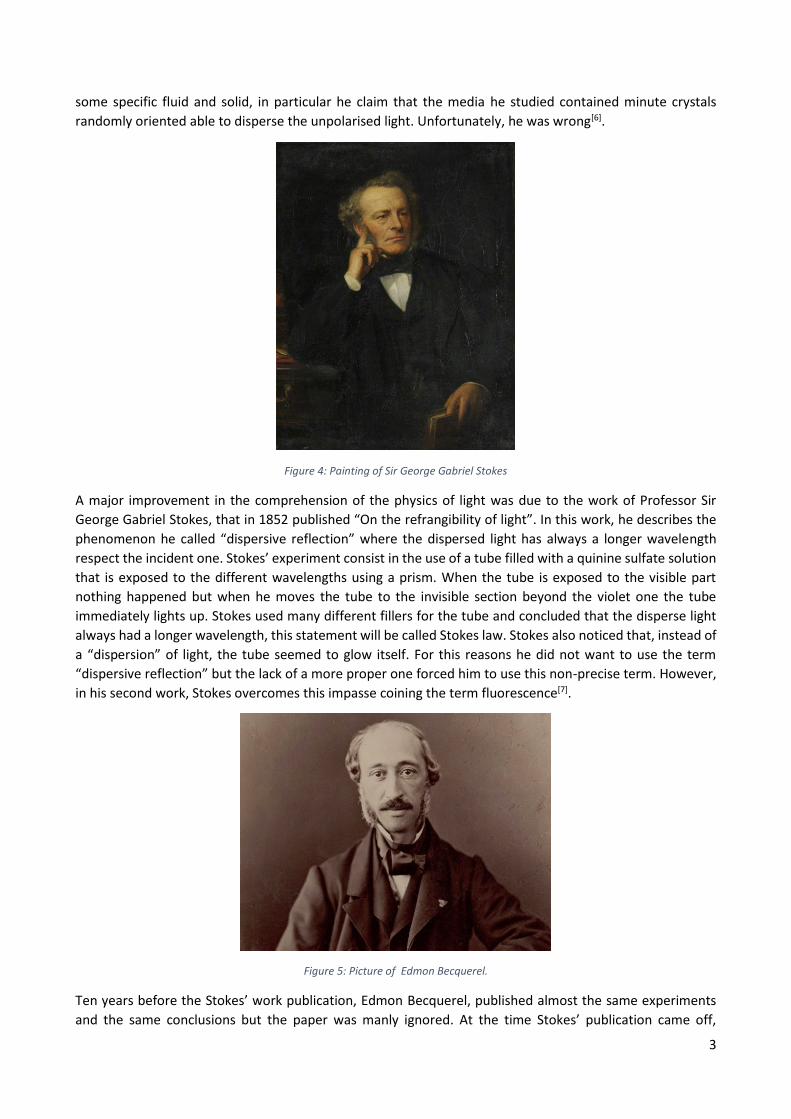
Figure 4: Painting of Sir George Gabriel Stokes
A major improvement in the comprehension of the physics of light was due to the work of Professor Sir
George Gabriel Stokes, that in 1852 published “On the refrangibility of light”. In this work, he describes the
phenomenon he called “dispersive reflection” where the dispersed light has always a longer wavelength
respect the incident one. Stokes’ experiment consist in the use of a tube filled with a quinine sulfate solution
that is exposed to the different wavelengths using a prism. When the tube is exposed to the visible part
nothing happened but when he moves the tube to the invisible section beyond the violet one the tube
immediately lights up. Stokes used many different fillers for the tube and concluded that the disperse light
always had a longer wavelength, this statement will be called Stokes law. Stokes also noticed that, instead of
a “dispersion” of light, the tube seemed to glow itself. For this reasons he did not want to use the term
“dispersive reflection” but the lack of a more proper one forced him to use this non-precise term. However,
in his second work, Stokes overcomes this impasse coining the term fluorescence[7].
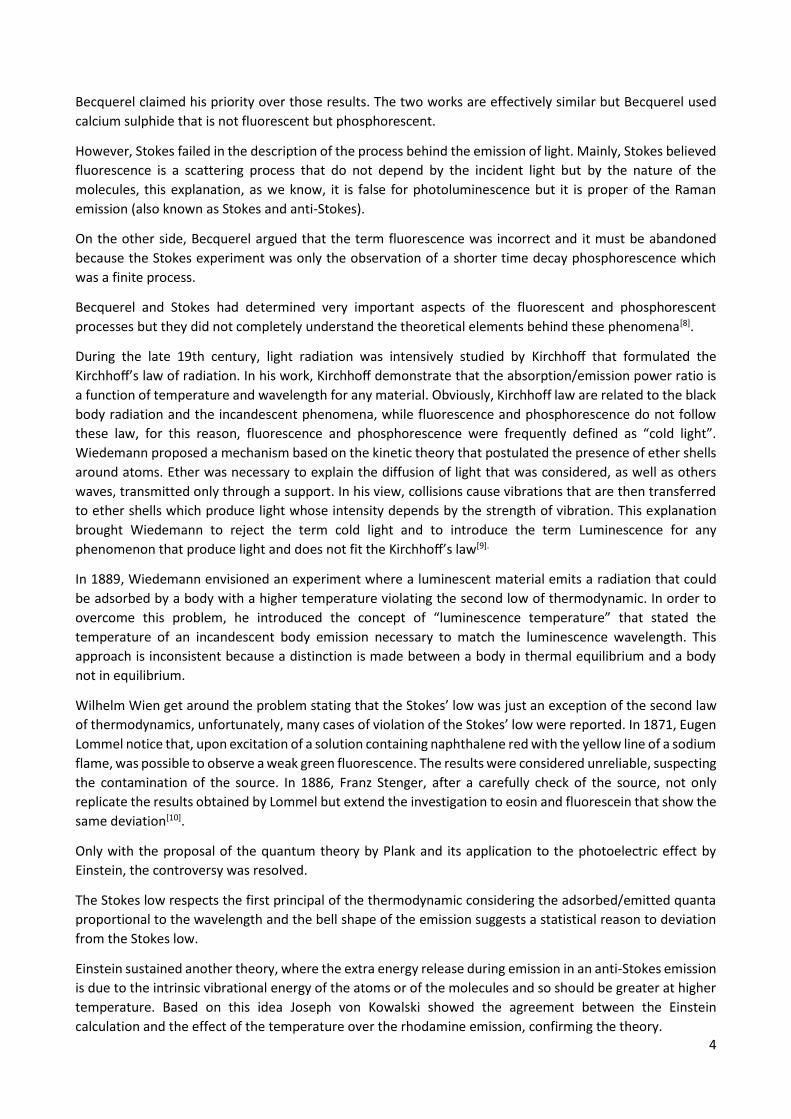
Figure 5: Picture of Edmon Becquerel.
Ten years before the Stokes’ work publication, Edmon Becquerel, published almost the same experiments
and the same conclusions but the paper was manly ignored. At the time Stokes’ publication came off,
4
Becquerel claimed his priority over those results. The two works are effectively similar but Becquerel used
calcium sulphide that is not fluorescent but phosphorescent.
However, Stokes failed in the description of the process behind the emission of light. Mainly, Stokes believed
fluorescence is a scattering process that do not depend by the incident light but by the nature of the
molecules, this explanation, as we know, it is false for photoluminescence but it is proper of the Raman
emission (also known as Stokes and anti-Stokes).
On the other side, Becquerel argued that the term fluorescence was incorrect and it must be abandoned
because the Stokes experiment was only the observation of a shorter time decay phosphorescence which
was a finite process.
Becquerel and Stokes had determined very important aspects of the fluorescent and phosphorescent
processes but they did not completely understand the theoretical elements behind these phenomena[8].
During the late 19th century, light radiation was intensively studied by Kirchhoff that formulated the
Kirchhoff’s law of radiation. In his work, Kirchhoff demonstrate that the absorption/emission power ratio is
a function of temperature and wavelength for any material. Obviously, Kirchhoff law are related to the black
body radiation and the incandescent phenomena, while fluorescence and phosphorescence do not follow
these law, for this reason, fluorescence and phosphorescence were frequently defined as “cold light”.
Wiedemann proposed a mechanism based on the kinetic theory that postulated the presence of ether shells
around atoms. Ether was necessary to explain the diffusion of light that was considered, as well as others
waves, transmitted only through a support. In his view, collisions cause vibrations that are then transferred
to ether shells which produce light whose intensity depends by the strength of vibration. This explanation
brought Wiedemann to reject the term cold light and to introduce the term Luminescence for any
phenomenon that produce light and does not fit the Kirchhoff’s law[9].
In 1889, Wiedemann envisioned an experiment where a luminescent material emits a radiation that could
be adsorbed by a body with a higher temperature violating the second low of thermodynamic. In order to
overcome this problem, he introduced the concept of “luminescence temperature” that stated the
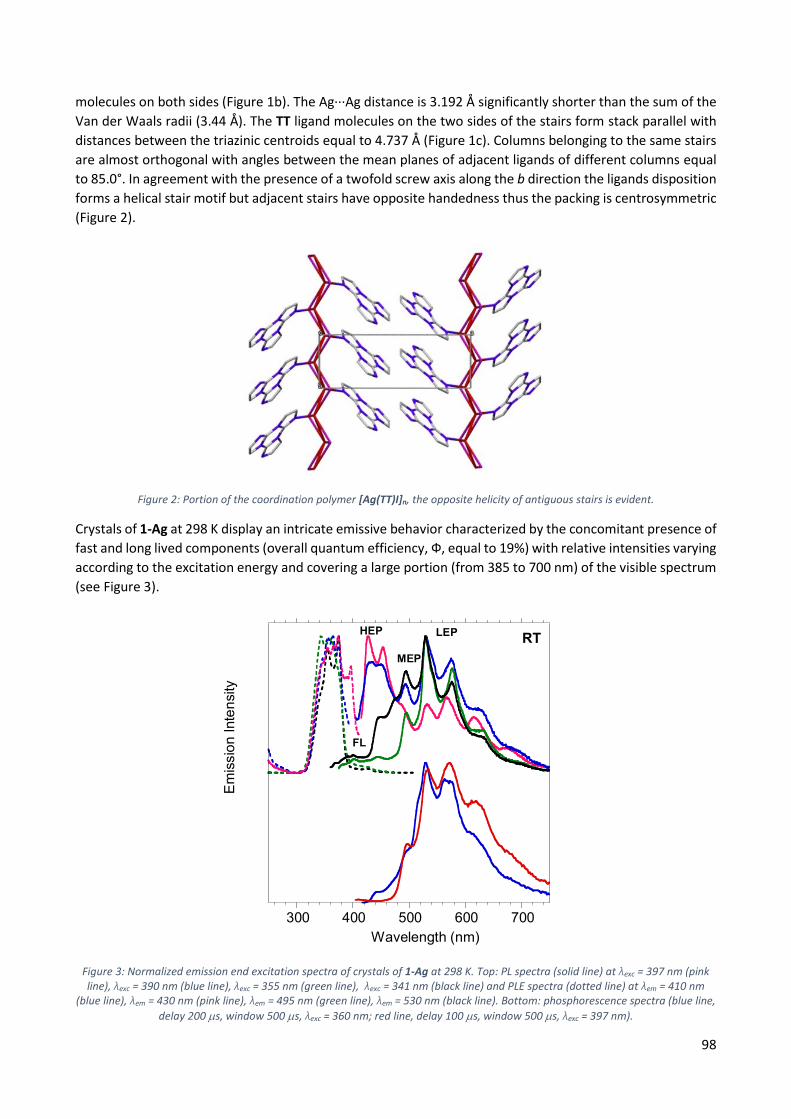
temperature of an incandescent body emission necessary to match the luminescence wavelength. This
approach is inconsistent because a distinction is made between a body in thermal equilibrium and a body
not in equilibrium.
Wilhelm Wien get around the problem stating that the Stokes’ low was just an exception of the second law
of thermodynamics, unfortunately, many cases of violation of the Stokes’ low were reported. In 1871, Eugen
Lommel notice that, upon excitation of a solution containing naphthalene red with the yellow line of a sodium
flame, was possible to observe a weak green fluorescence. The results were considered unreliable, suspecting
the contamination of the source. In 1886, Franz Stenger, after a carefully check of the source, not only
replicate the results obtained by Lommel but extend the investigation to eosin and fluorescein that show the
same deviation[10].
Only with the proposal of the quantum theory by Plank and its application to the photoelectric effect by
Einstein, the controversy was resolved.
The Stokes low respects the first principal of the thermodynamic considering the adsorbed/emitted quanta
proportional to the wavelength and the bell shape of the emission suggests a statistical reason to deviation
from the Stokes low.
Einstein sustained another theory, where the extra energy release during emission in an anti-Stokes emission
is due to the intrinsic vibrational energy of the atoms or of the molecules and so should be greater at higher
temperature. Based on this idea Joseph von Kowalski showed the agreement between the Einstein
calculation and the effect of the temperature over the rhodamine emission, confirming the theory.
5
While the disputation over the Stokes’ low was ongoing, Edmon Becquerel had focused his attention on
phosphorescence. In 1858, he built his phosphorocope to run the very first time resolved photoluminescence
experiment. The instrument was pretty simple but sufficiently accurate to detected decay times longer than
0.1 ms. It consists in two rotating discs with four unmatched windows with the sample inbetween. The
rotation allows the incident light to reach the sample passing through the first disc while the second one is
covering the passage to the detector, proceeding with the rotation, the excitation window before the sample
closes while the emission window to the detector is opening. The lag time between the excitation and the
measure of the emission intensity is related to the speed of the discs[8].
To Becquerel is due one of the first application of the photoluminescence, in fact, he designs the fluorescent
tube which consist in the coating of the inner surface of an electric discharge tube with a luminophore to
produce light. Nowadays, the modern fluorescent tubes are made in a similar way with EuII, EuIII and TbIII in
the coating to produce withe light.
As well as Becquerel even Stokes understood the great potential behind the luminescence, theorizing the
application of this phenomenon for the recognition of specific targets present in mixtures. On the same way,
Victor Pierre in 1862 published an article where he was able to identify single fluorescent molecules in
mixtures noting that, fluorescent bands, were characteristic of specific molecules.
Later, Göppelsröderd, firstly reported the enhancement of the emission intensity of morin due to the
aluminium complexation, referring for the first time to this technique as fluorescent analysis.
Among the oldest application of the fluorescence, it is noteworthy the use of uranin in 1877 to monitor the
flow of Danube river. Ten litres of a concentrate solution of uranin were poured in the Danube at the spring
of the river. As obvious, after a long way the Danube water reach the Black sea, but after 50 hours the
fluorescence was detected in the Aache river 12 Km in the south. This river flows into the Constanz lake that
feed the Rhine showing that, most of the water of Danube, flows into the North sea thanks to sinks on the
bed of the river[11].
6
1.1 References [1] Valeur, B.; Berberan-Santos, M. r. N., A Brief History of Fluorescence and Phosphorescence before the
Emergence of Quantum Theory. Journal of Chemical Education 2011, 88 (6), 731-738.
[2] Muyskens, M.; Ed, V., The Fluorescence of Lignum nephriticum: A Flash Back to the Past and a Simple
Demonstration of Natural Substance Fluorescence. Journal of Chemical Education 2006, 83 (5), 765.
[3] Partington, J. R., Lignum nephriticum. Annals of Science 1955, 11 (1), 1-26.
[4] Acuña, A. U.; Amat-Guerri, F.; Morcillo, P.; Liras, M.; Rodríguez, B., Structure and Formation of the
[5] Brewster, D., XIX. On the Colours of Natural Bodies. Transactions of the Royal Society of Edinburgh 1834,
12 (2), 538-545.
[6] Herschel, J. F. W., V. ’Aμóρϕω⋎a, no. II.— on the epipölic dispersion of light, being a supplement to a
paper entitled, “On a case of superficial colour presented by a homogeneous liquid internally colourless.".
Philosophical Transactions of the Royal Society of London 1845, 135, 147-153.
[7] Stokes, G. G., XXX. On the change of refrangibility of light. Philosophical Transactions of the Royal Society of London 1852, 142, 463-562. [8] Becquerel, E., La lumière, ses causes et ses effets. Firmin Didot frères, fils et cie: 1867.
[9] Wiedemann, E., Ueber Fluorescenz und Phosphorescenz I. Abhandlung. Annalen der Physik 1888, 270 (7),
446-463.
[10] Malley, M., Thermodynamics and cold light. Annals of Science 1994, 51 (3), 203-224. Lommel, E., Ueber
Fluorescenz. Annalen der Physik 1871, 219 (5), 26-51.
[11] Kass, W., Tracing Technique in Geohydrology. CRC Press: 2018.
7
2 Theoretical concepts
2.1 Introduction The very first step that every system has to undergo before any transitions can take place is the absorption
of a photon with the proper energy that promotes an electron from an orbital in the ground state to an
unoccupied orbital generating a molecular excited state. The energy of the photon adsorbed will be equal to
the “promotion jump” made by the electron implying that there must be a match between the energy
transferred and the energetic gap between the ground and the excited states. The direct consequence is that
not every molecule can absorb every photon but its chemical structure will define the distribution of the
energetic levels thus, which portion of the electromagnetic spectrum will be absorbed[1].
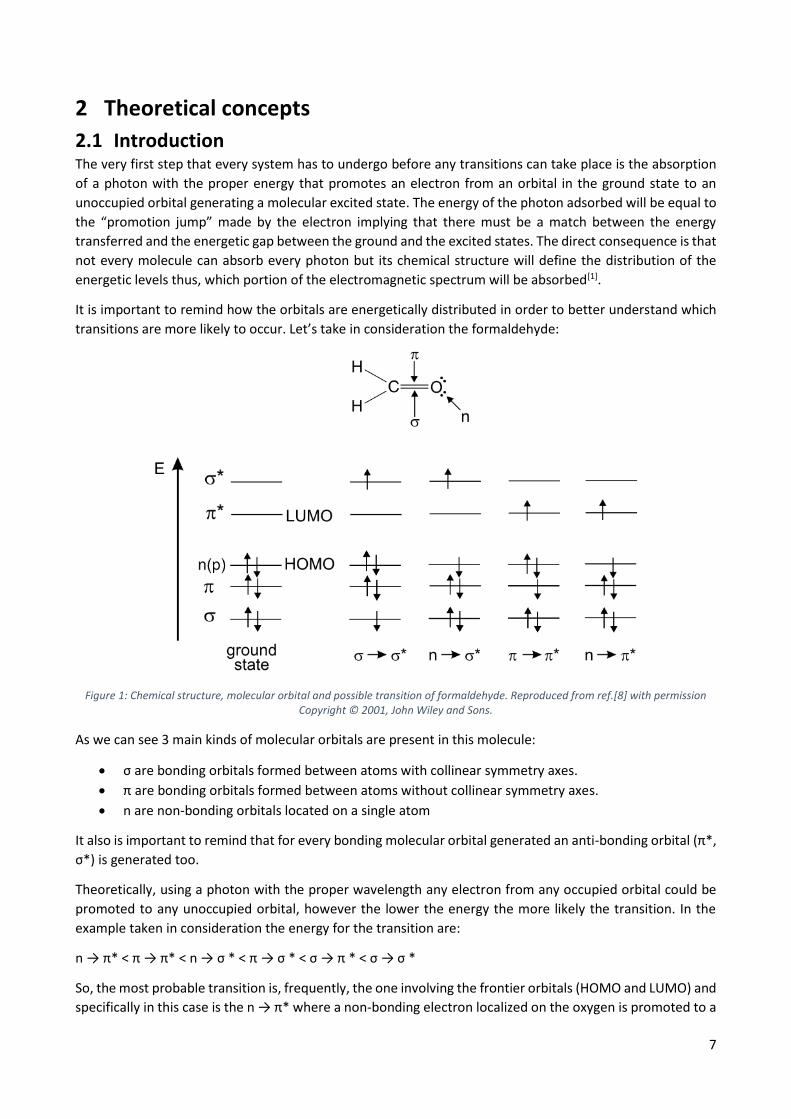
It is important to remind how the orbitals are energetically distributed in order to better understand which
transitions are more likely to occur. Let’s take in consideration the formaldehyde:
2.2 Lambert-Beer law and oscillator strength The probability that a molecule will absorb an incident photon with a specific wavelength is experimentally
described by the molar absorption coefficient 휀(𝜆) that, in the Lambert-Beer law, correlates the absorbed
light (𝐼) to the concentration of a chromophore (𝑐) when the optical path (𝑙) is fixed.
𝐴(𝜆) = log (𝐼0
𝐼) = 휀(𝜆)𝑙𝑐
The Lambert-Beer law is valid until the concentration does not cause the formation of aggregates or micelles
that have different optical properties with respect to the isolated molecule.
Classically, the absorption probability is defined through the oscillator strength 𝑓:
𝑓 =4 𝑙𝑛10휀0𝑚𝑐
𝑁𝑎𝑒2 ∫ 휀(𝜈) 𝑑𝜈 =
4 𝑙𝑛10휀0𝑚𝑐2
𝑁𝑎𝑒2𝜆𝑎𝑣2
∫ 휀(𝜆) 𝑑𝜆
The value of 𝑓 can vary between 0 and 1. When 𝑓 = 0 none of the incident photons will be absorbed
oppositely when 𝑓 = 1 all the incident photons will be adsorbed.
If we consider the absorption of a photon from a quantum mechanical point of view, the process can be
described as a displacement of charges that generates a transient dipole represented by a specific transition
moment for each transition. The transition dipole can be drawn as a vector whose coordinates are defined
9
by the nuclei positions of the atoms in the molecule. When an incident photon “hits” a molecule the
probability to be absorbed depends by the angle between the transient dipole vector of the transition and
the electric vector of the photon, in fact the probability is proportional to the square of the scalar product
between them. This means that for every molecule with a transition dipole parallel to the electric vector of
the incident photon the probability is maximum while if the two are perpendicular the probability drops to
zero[2].
2.3 Selection rules The number of the allowed transitions for a molecule in its ground state to an excited state or for a molecule
that relaxes from an excited state is limited by the so called “selection rules”. Particularly selective is the spin
selection rule according to which a transition between states of different spin multiplicity (singlet to triplet
or vice versa) is forbidden. This selection rule becomes less stringent due to spin-orbit coupling (i.e. the
interaction between the magnetic field associated with the rotation of the electron around the nucleus and
that associated its spin motion) which results in mixing states of different multiplicity so that the multiplicity
of a specific wavefunction is no more clearly defined. The result is that the intensity integral between singlet/
triplet states in not null and the transition can occur even though with low probability.
Similarly, symmetry forbidden transitions can take place through vibronic coupling which breaks the
symmetry of a molecule.
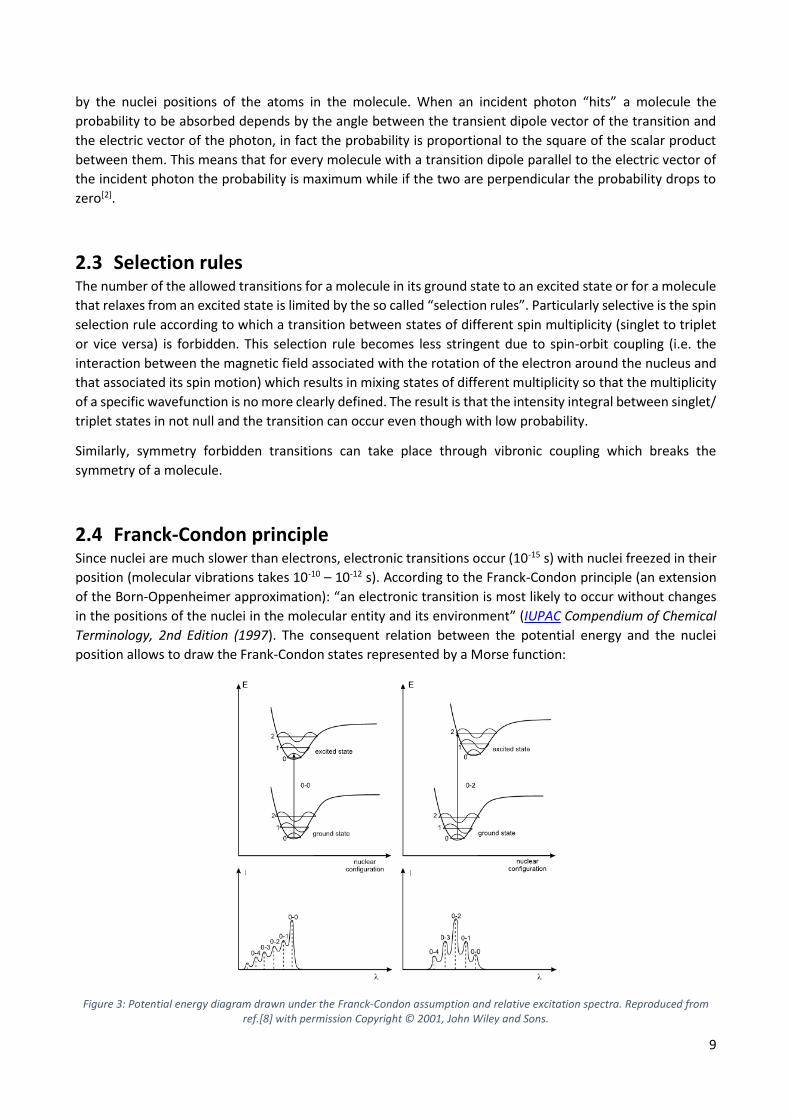
2.4 Franck-Condon principle Since nuclei are much slower than electrons, electronic transitions occur (10-15 s) with nuclei freezed in their
position (molecular vibrations takes 10-10 – 10-12 s). According to the Franck-Condon principle (an extension
of the Born-Oppenheimer approximation): “an electronic transition is most likely to occur without changes
in the positions of the nuclei in the molecular entity and its environment” (IUPAC Compendium of Chemical
Terminology, 2nd Edition (1997). The consequent relation between the potential energy and the nuclei
position allows to draw the Frank-Condon states represented by a Morse function:
The Boltzmann distribution predicts that at room temperature most of the molecules are in the lowest vibration level of the ground state. However, an experimental spectrum of a generic transition only rarely displays a very sharp shape because many broadening effects are possible. Firstly, there is a continuous set of accessible vibrational sublevels for each electronic state, and secondly the fluctuation of the environment around the molecules are the main cause of the widening of the bands. The Franck-Condon principle implies that the transitions can only occur vertically. As stated by the Boltzmann distribution a molecule at room temperature is prone to be find at the lower vibrational level of the ground state but, the absorption can bring it to different vibrational levels of an excited state. After the excitation the molecules usually converge to the lower vibrational level of the excited state and only after they will relax to a vibrational level of the ground state[3]. The probability (𝑃) to reach a certain vibrational level depends on the overlap integral of the wavefunctions involved in the transition:
𝑃 = ⟨ 𝜓𝑓 | 𝝁 | 𝜓𝑖 ⟩ = ∫ 𝜓𝑓∗𝝁 𝜓𝑖 𝑑𝜏
Where the dipole operator 𝝁 of the transition between an initial vibrational level ”𝑖“ of the ground state to
a final vibrational level ”𝑓“ of an excited state is determined by nuclei and electrons positions (𝑹𝒏 and 𝒓𝒎
respectively) and by their charges:
𝝁 = 𝝁𝒆 + 𝝁𝑵 = −𝑒 ∑ 𝒓𝒊
𝑖
+ 𝑒 ∑ 𝑍𝑗𝑹𝒋
𝑗
Since:
𝜓 = 𝜓𝑒𝜓𝑣𝜓𝑠
Under the Born-Oppenheimer approximation it is possible to calculate the probability for electronic, spin and
vibrational contributions separately:
𝑃 = ⟨𝜓𝑒𝑓
𝜓𝑣𝑓
𝜓𝑠𝑓|𝝁 |𝜓𝑒
𝑖 𝜓𝑣𝑖 𝜓𝑠
𝑖⟩ = ∫ 𝜓𝑒𝑓∗
𝜓𝑣𝑓∗
𝜓𝑠𝑓∗
(𝝁𝒆 + 𝝁𝑵) 𝜓𝑒𝑖 𝜓𝑣
𝑖 𝜓𝑠𝑖 𝑑𝜏
= ∫ 𝜓𝑒𝑓∗
𝜓𝑣𝑓∗
𝜓𝑠𝑓∗
𝝁𝒆 𝜓𝑒𝑖 𝜓𝑣
𝑖 𝜓𝑠𝑖 𝑑𝜏 + 𝜓𝑒
𝑓∗𝜓𝑣
𝑓∗𝜓𝑠
𝑓∗ 𝝁𝑵 𝜓𝑒
𝑖 𝜓𝑣𝑖 𝜓𝑠
𝑖 𝑑𝜏
= ∫ 𝜓𝑣𝑓∗
𝜓𝑣𝑖 𝑑𝜏𝑣 ∫ 𝜓𝑒
𝑓∗𝝁𝒆𝜓𝑒
𝑖 𝑑𝜏𝑒 ∫ 𝜓𝑠𝑓∗
𝜓𝑠𝑖 𝑑𝜏𝑠
+ ∫ 𝜓𝑒𝑓∗
𝜓𝑒𝑖 𝑑𝜏𝑒 ∫ 𝜓𝑣
𝑓∗𝝁𝑵𝜓𝑣
𝑖 𝑑𝜏𝑣 ∫ 𝜓𝑠𝑓∗
𝜓𝑠𝑖 𝑑𝜏𝑠
The second term of this equation is null because the electronic wavefunction of different states are
orthogonal thus no overlap is possible.
= ∫ 𝜓𝑣𝑓∗
𝜓𝑣𝑖 𝑑𝜏𝑣 ∫ 𝜓𝑒
𝑓∗𝝁𝒆𝜓𝑒
𝑖 𝑑𝜏𝑒 ∫ 𝜓𝑠𝑓∗
𝜓𝑠𝑖 𝑑𝜏𝑠
The three remaining integrals represent the Frank-Condon factor (which defines the most probable
vibrational transitions), the orbital selection rule and the spin selection rule, respectively. Franck-Condon
factor has only a limited weigh on the intensity of a transition respect the two other selection rules.
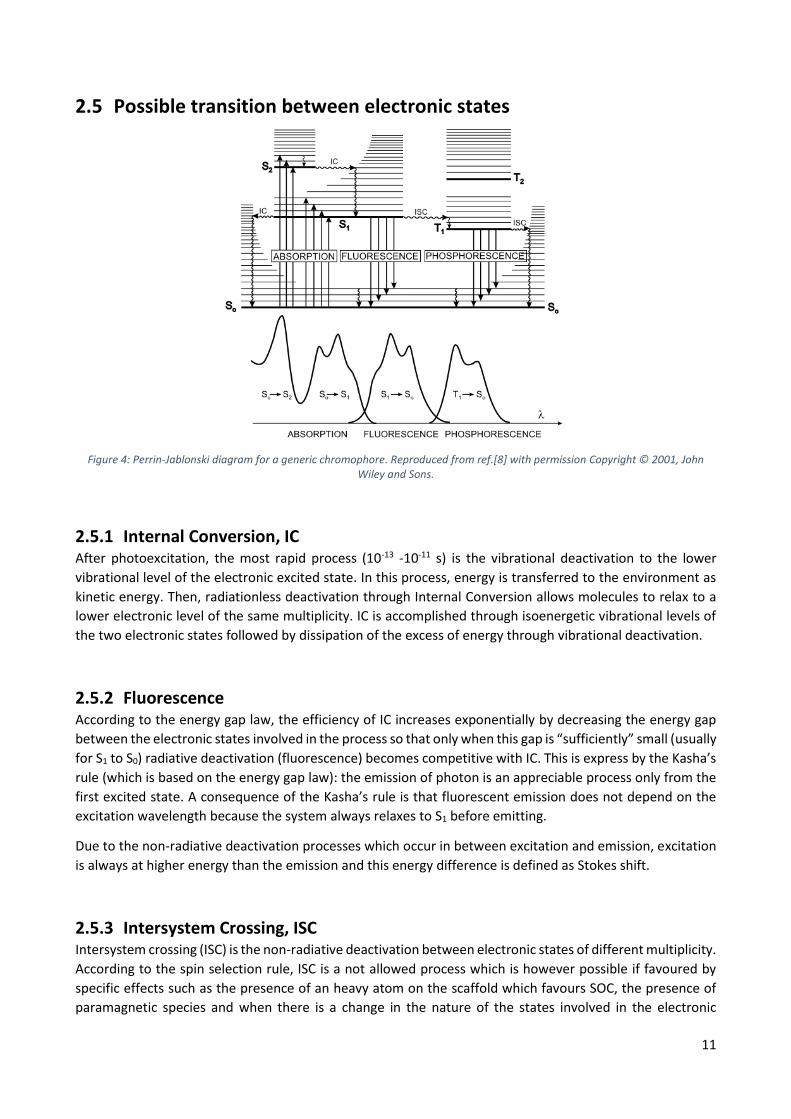
2.5.1 Internal Conversion, IC After photoexcitation, the most rapid process (10-13 -10-11 s) is the vibrational deactivation to the lower
vibrational level of the electronic excited state. In this process, energy is transferred to the environment as
kinetic energy. Then, radiationless deactivation through Internal Conversion allows molecules to relax to a
lower electronic level of the same multiplicity. IC is accomplished through isoenergetic vibrational levels of
the two electronic states followed by dissipation of the excess of energy through vibrational deactivation.
2.5.2 Fluorescence According to the energy gap law, the efficiency of IC increases exponentially by decreasing the energy gap
between the electronic states involved in the process so that only when this gap is “sufficiently” small (usually
for S1 to S0) radiative deactivation (fluorescence) becomes competitive with IC. This is express by the Kasha’s
rule (which is based on the energy gap law): the emission of photon is an appreciable process only from the
first excited state. A consequence of the Kasha’s rule is that fluorescent emission does not depend on the
excitation wavelength because the system always relaxes to S1 before emitting.
Due to the non-radiative deactivation processes which occur in between excitation and emission, excitation
is always at higher energy than the emission and this energy difference is defined as Stokes shift.
2.5.3 Intersystem Crossing, ISC Intersystem crossing (ISC) is the non-radiative deactivation between electronic states of different multiplicity.
According to the spin selection rule, ISC is a not allowed process which is however possible if favoured by
specific effects such as the presence of an heavy atom on the scaffold which favours SOC, the presence of
paramagnetic species and when there is a change in the nature of the states involved in the electronic
12
transition, in particular, the El-Sayed’s rule predicts larger 𝑘𝑆𝑇 when the two states are of different orbital
parentage[4].
2.5.4 Phosphorescence Once the system is brought to a generic triplet state through ISC, it can relax to T1 through IC. Since, according
to the Hund’s rule, T1 is always lower in energy with respect to S1, the Stokes of phosphorescence is larger
than that of fluorescence. Since triplet states undergo non-radiative deactivation more easily than singlet
states, phosphorescence is rarely observed, in particular in solution and at RT where collision with solvent
molecules, vibrational relaxation and oxygen quenching strongly affect the phosphorescent quantum
efficiency.
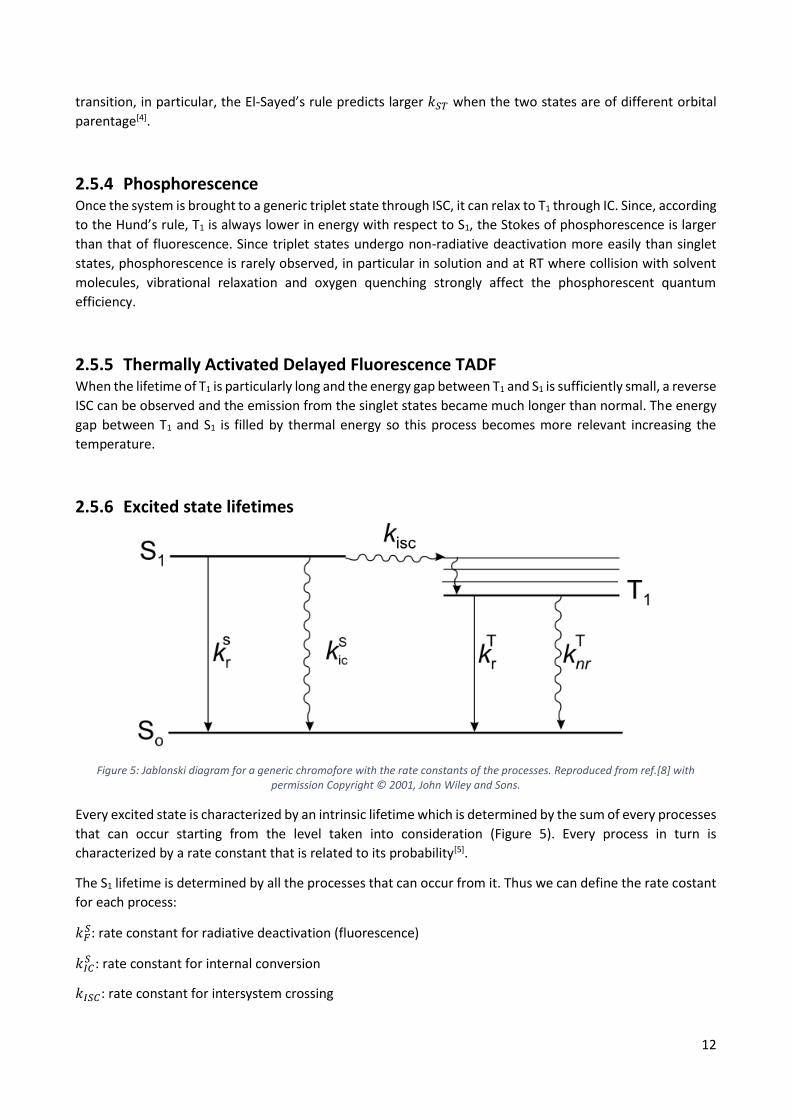
2.5.5 Thermally Activated Delayed Fluorescence TADF When the lifetime of T1 is particularly long and the energy gap between T1 and S1 is sufficiently small, a reverse
ISC can be observed and the emission from the singlet states became much longer than normal. The energy
gap between T1 and S1 is filled by thermal energy so this process becomes more relevant increasing the
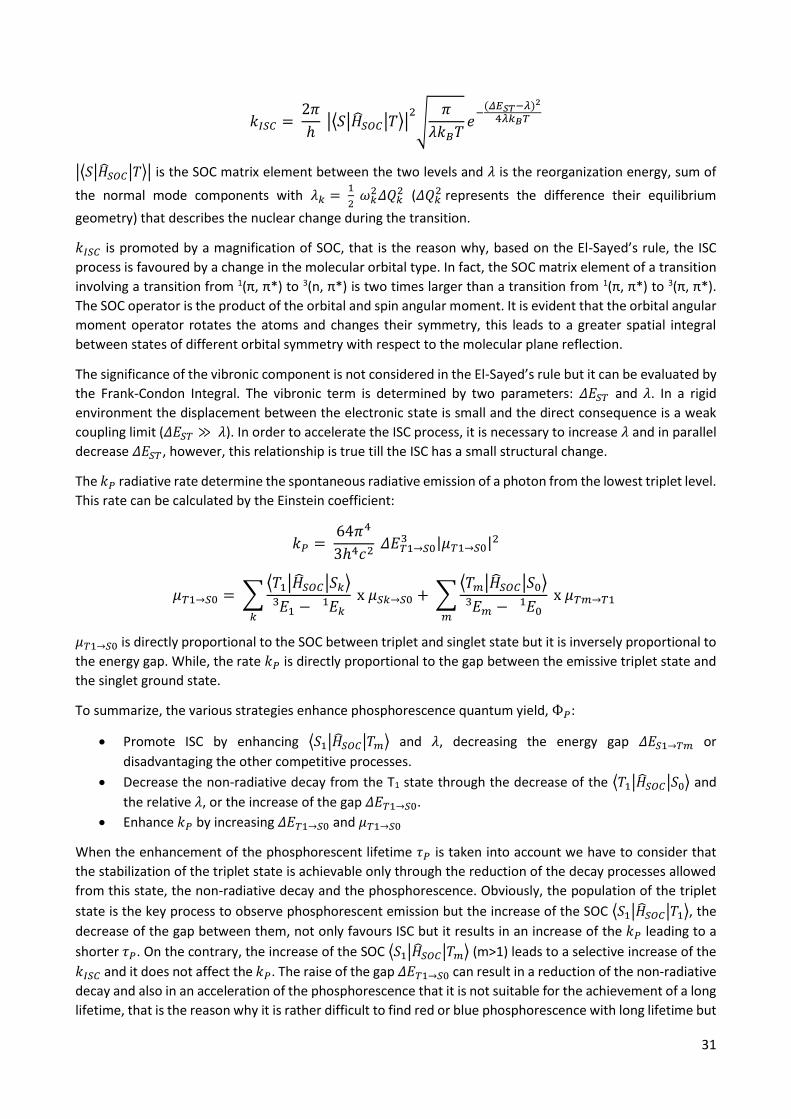
As an example bromobenzene derivatives reported in figure 2 are here reported as bromine atoms induced
RTP behaviour [5;6]. All the species presented are poorly or completely non emissive in diluted solution while
crystals display intense green phosphorescences. To understand the role played by the presence of bromine
atoms the crystal structures are fundamental. Br(CHO)PhC6 has a weak fluorescence in solution which is
followed by a phosphorescence in the solid state (ФP = 2.9%). The relative intensities of these two emissions
depend by the quality of the crystals, where strong C-Br···O=C interactions were detected (rBr···O= 2.86 Å) that
allow an efficient SOC and thus an efficient ISC.
The four others compounds Br2PhC6, Br2PhC8, Br2PhC6Br2 and Br2PhC6Br8 display similar features. In their
crystal structures close Br···Br interactions can be found, moreover Br2PhC6Br2 and Br2PhC6Br8 form multiple
halogen bonds. The differences between the phosphorescence quantum yields detected (Br2PhC6; ФP = 3.4%,
Br2PhC8; ФP = 8.9%, Br2PhC6Br2; ФP = 21.9%, Br2PhC6Br8; ФP = 13.1%) are ascribable to the different number
of XB that, not only provides a rigidification of the environment and promotes SOC, but even prevents triplet-
triplet annihilation.
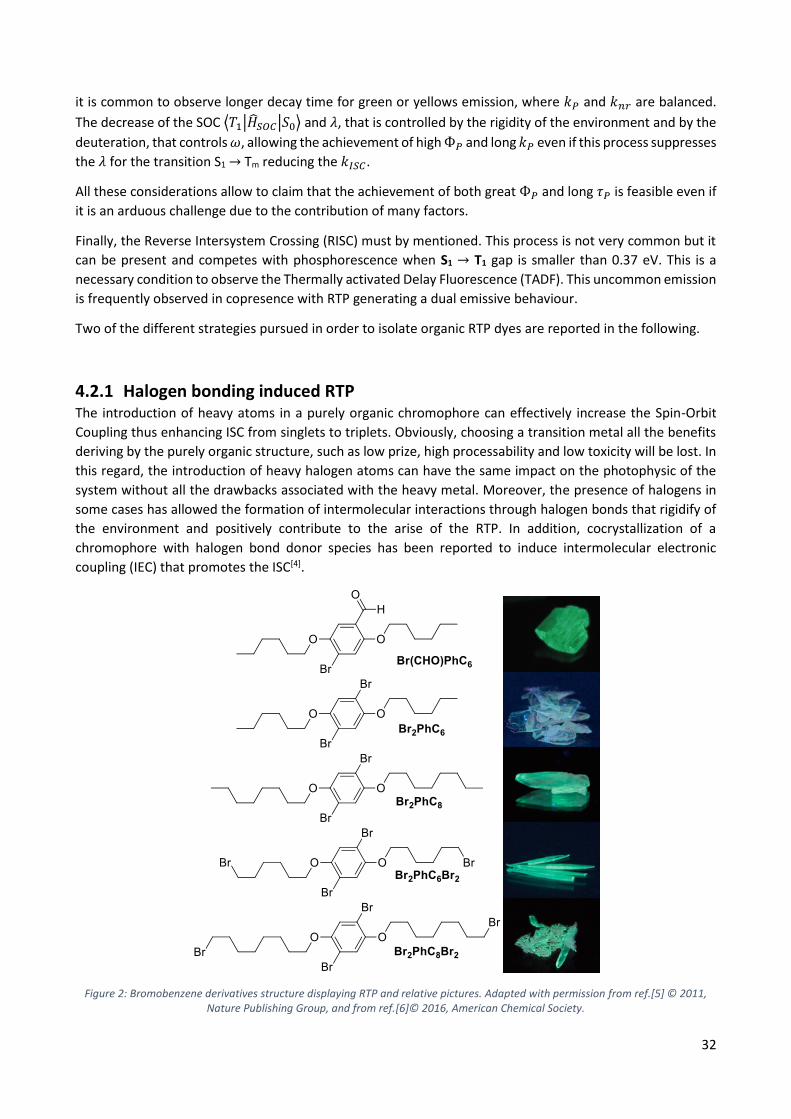
4.2.2 Strong π-π interaction induced RTP Since the introduction of the exciton model by Kasha at the end of the ‘50s[7], the formation of strong π-π
stacking interaction in a chromophore aggregate was considered to be the main cause of the emission
quenching.
Figure 3: Modified Jablonski diagram for dimer formation for the Kasha’s exciton model.
In fact, when two molecules (represented by an oval with a double arrow which is the transition moment,
see Figure 3) form a dimer an exciton split is observed for singlet and triplet states but the latter one is almost
negligible. When more than two molecules are considered the splitting results in the formation of bands
instead of discrete levels. The angle formed between the axis connecting the molecular centroids and the
molecular plane defines the magnitude of the splitting (Figure 3). At 54.7° the splitting is null as well as the
dipole-dipole interaction. Larger angles are associated with the formation of H-dimers (or aggregates if N
34
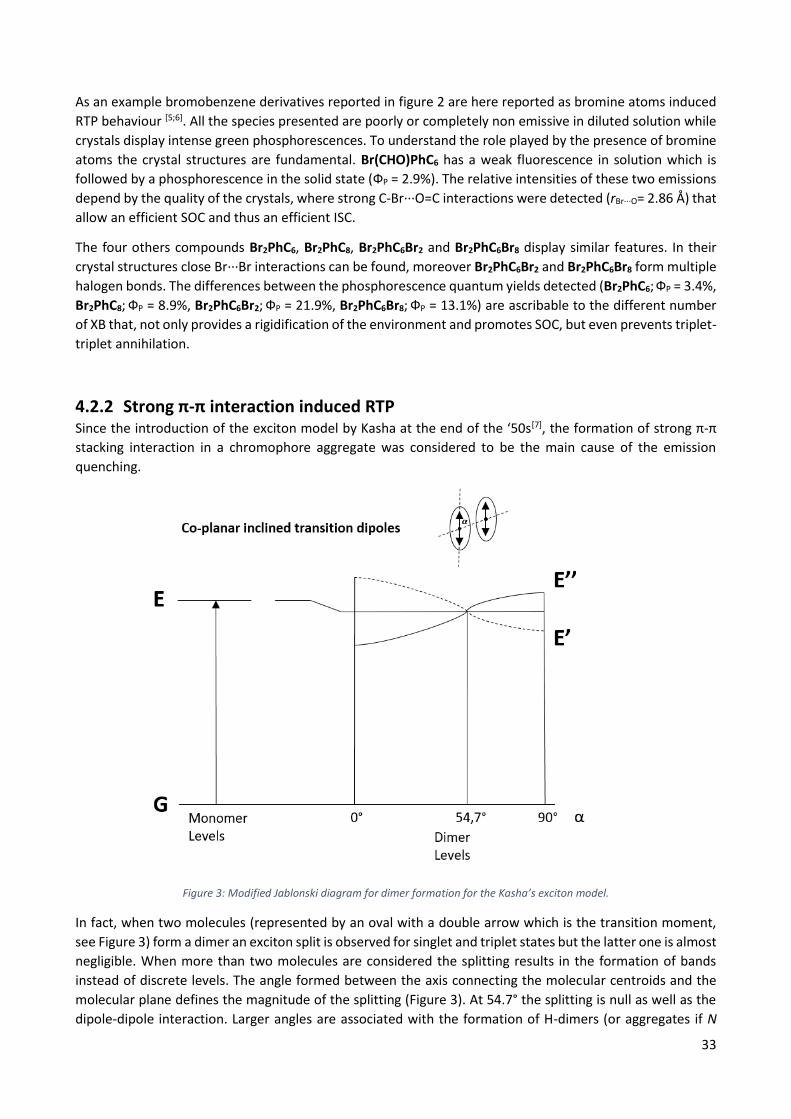
molecules are taken in consideration; figure 4 right) while smaller angles generate J-dimers (or aggregates;
Figure 4 left).
Figure 4: Modified Jablonski diagram for J-dimer (Left) and H-dimer (Right) for the Kasha’s exciton model.
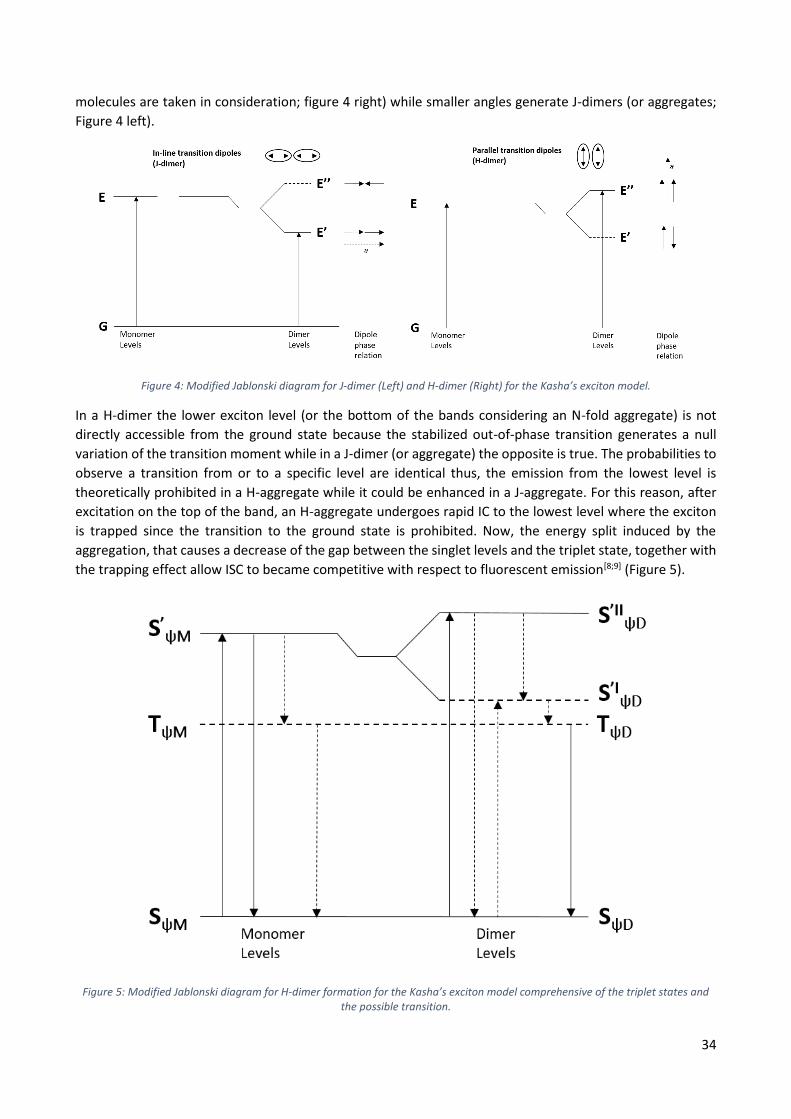
In a H-dimer the lower exciton level (or the bottom of the bands considering an N-fold aggregate) is not
directly accessible from the ground state because the stabilized out-of-phase transition generates a null
variation of the transition moment while in a J-dimer (or aggregate) the opposite is true. The probabilities to
observe a transition from or to a specific level are identical thus, the emission from the lowest level is
theoretically prohibited in a H-aggregate while it could be enhanced in a J-aggregate. For this reason, after
excitation on the top of the band, an H-aggregate undergoes rapid IC to the lowest level where the exciton
is trapped since the transition to the ground state is prohibited. Now, the energy split induced by the
aggregation, that causes a decrease of the gap between the singlet levels and the triplet state, together with
the trapping effect allow ISC to became competitive with respect to fluorescent emission[8;9] (Figure 5).
Figure 5: Modified Jablonski diagram for H-dimer formation for the Kasha’s exciton model comprehensive of the triplet states and the possible transition.
35
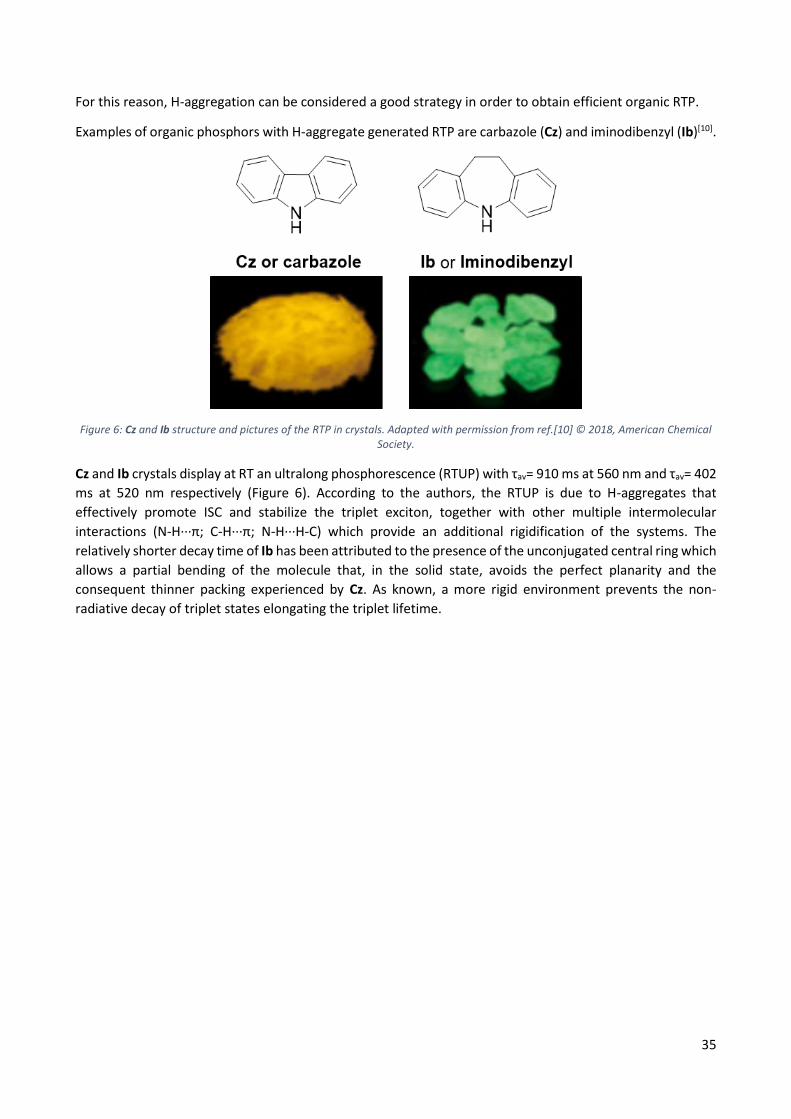
For this reason, H-aggregation can be considered a good strategy in order to obtain efficient organic RTP.
Examples of organic phosphors with H-aggregate generated RTP are carbazole (Cz) and iminodibenzyl (Ib)[10].
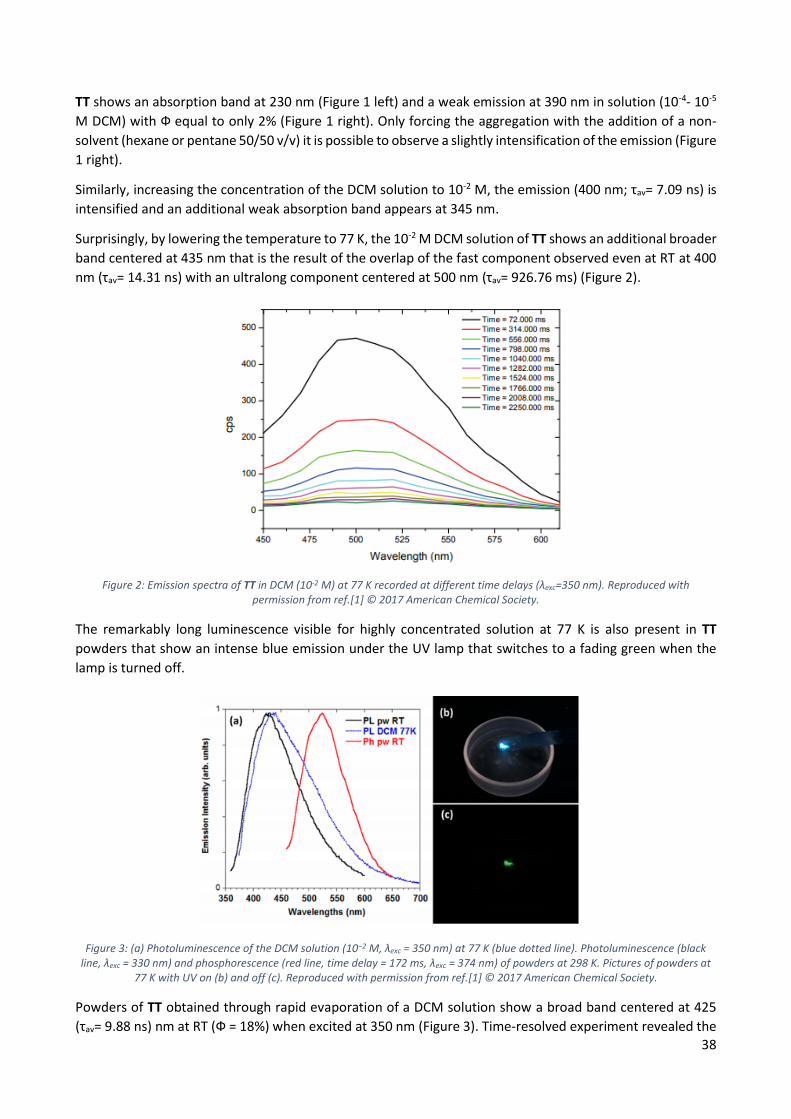
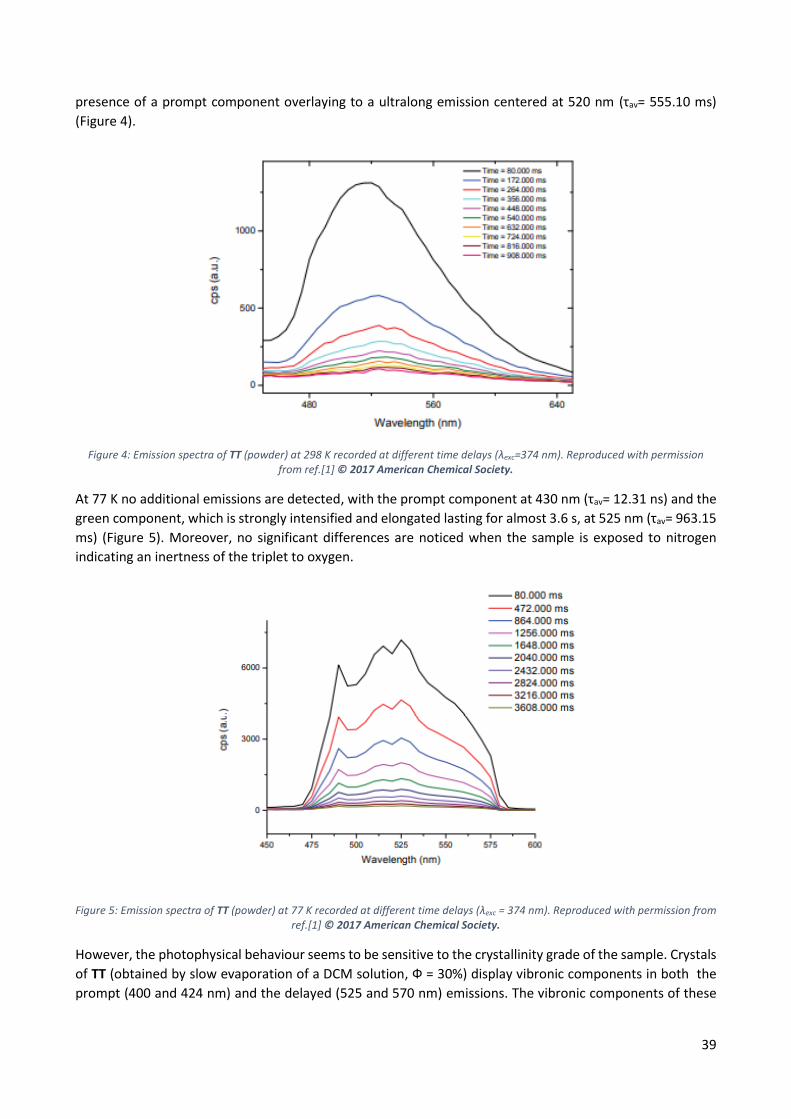
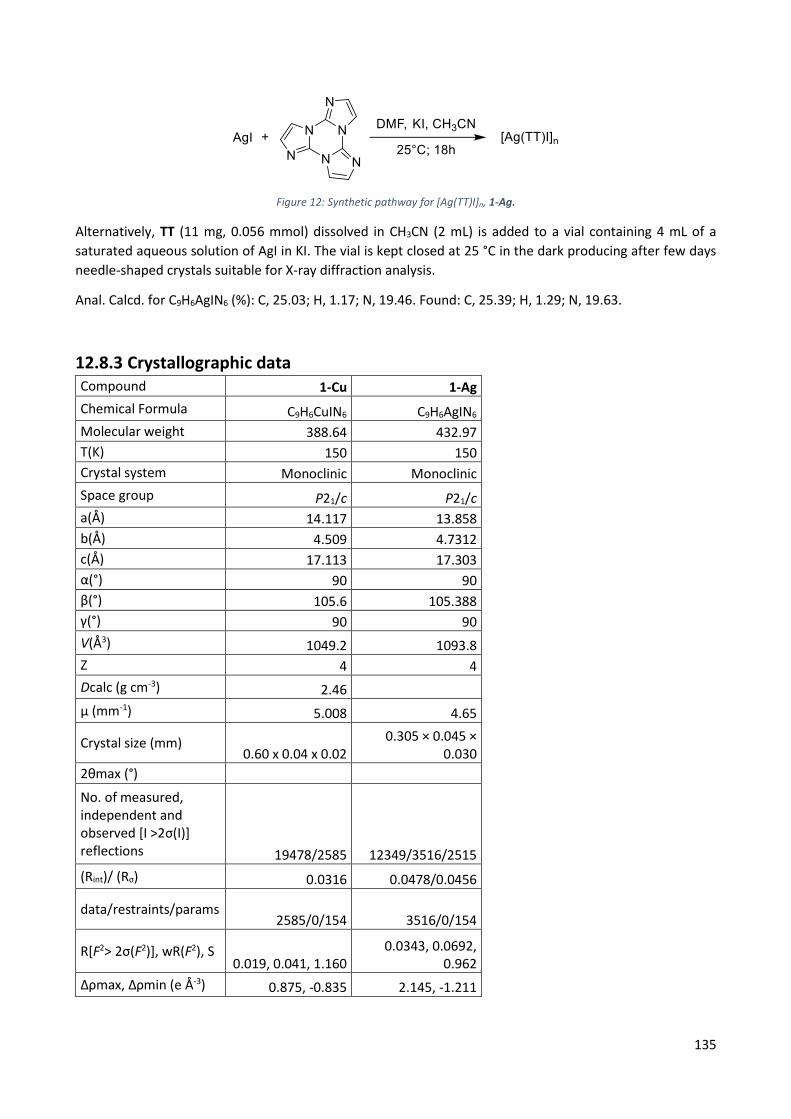
The remarkably long luminescence visible for highly concentrated solution at 77 K is also present in TT
powders that show an intense blue emission under the UV lamp that switches to a fading green when the
lamp is turned off.
Figure 3: (a) Photoluminescence of the DCM solution (10−2 M, λexc = 350 nm) at 77 K (blue dotted line). Photoluminescence (black line, λexc = 330 nm) and phosphorescence (red line, time delay = 172 ms, λexc = 374 nm) of powders at 298 K. Pictures of powders at
However, the photophysical behaviour seems to be sensitive to the crystallinity grade of the sample. Crystals
of TT (obtained by slow evaporation of a DCM solution, Ф = 30%) display vibronic components in both the
prompt (400 and 424 nm) and the delayed (525 and 570 nm) emissions. The vibronic components of these
40
two emissions are lost when the sample is ground and in parallel the Ф decreases to 22% revealing a
mechanochromic behaviour[7][8][9].
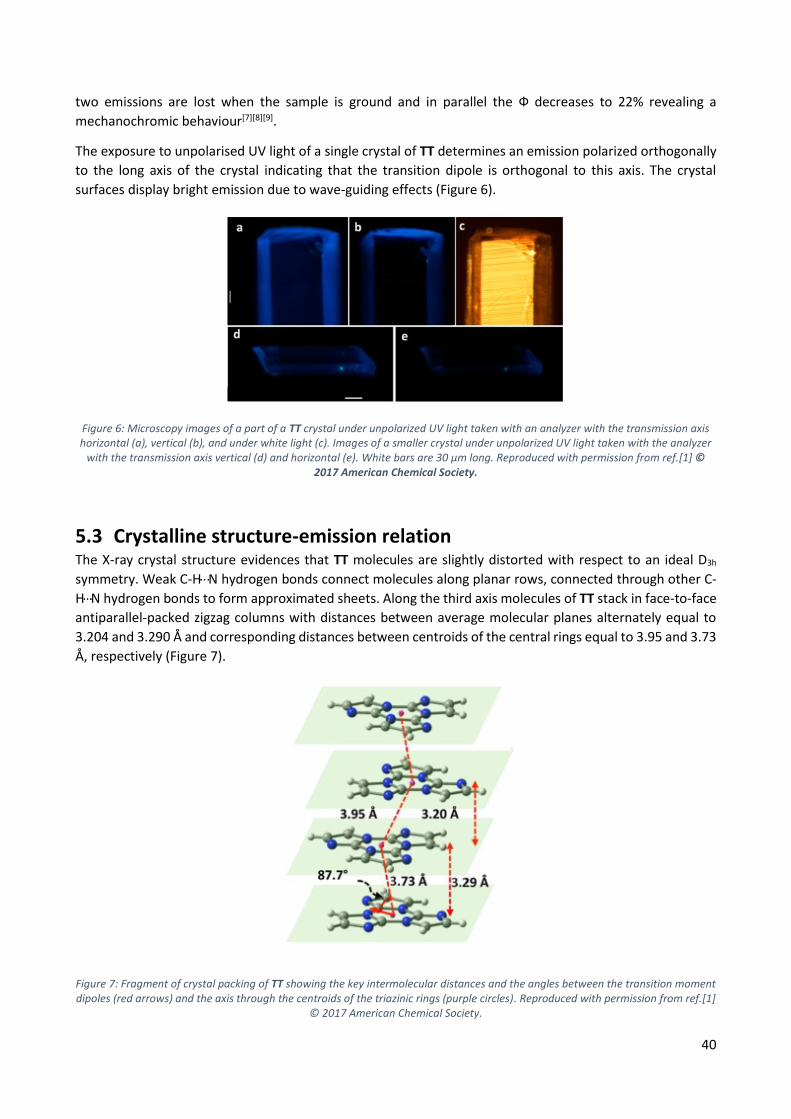
The exposure to unpolarised UV light of a single crystal of TT determines an emission polarized orthogonally
to the long axis of the crystal indicating that the transition dipole is orthogonal to this axis. The crystal
surfaces display bright emission due to wave-guiding effects (Figure 6).
Figure 6: Microscopy images of a part of a TT crystal under unpolarized UV light taken with an analyzer with the transmission axis horizontal (a), vertical (b), and under white light (c). Images of a smaller crystal under unpolarized UV light taken with the analyzer
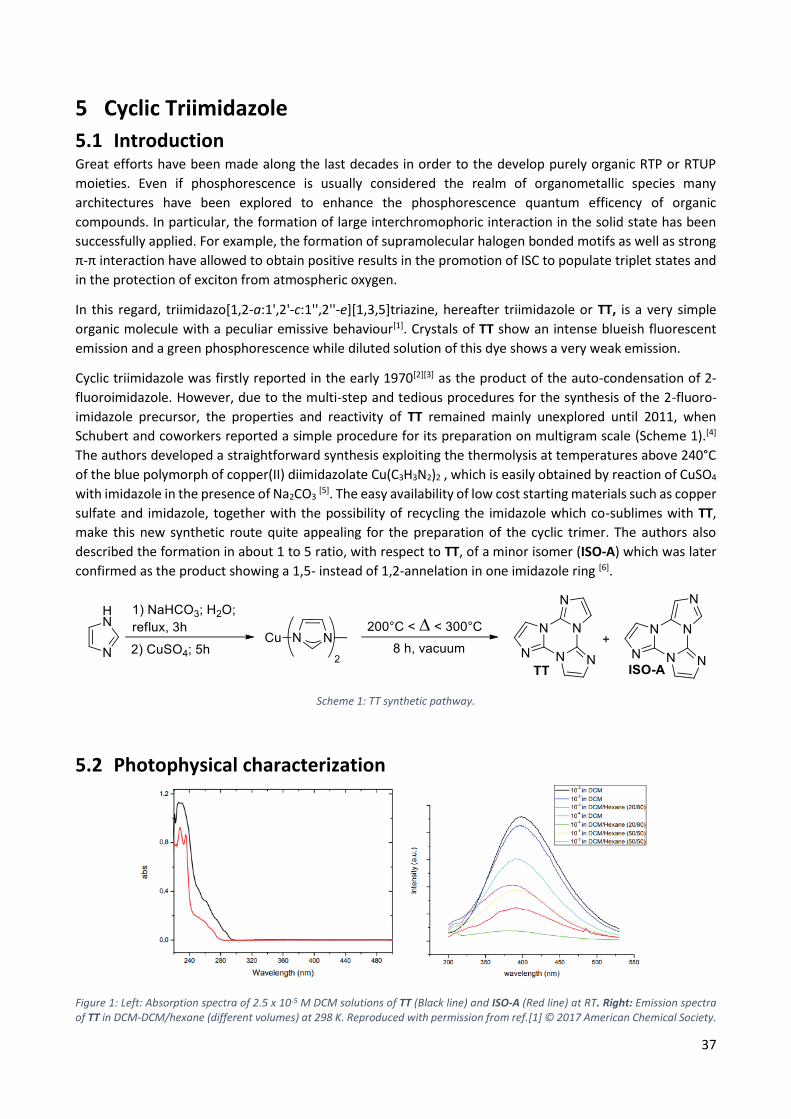
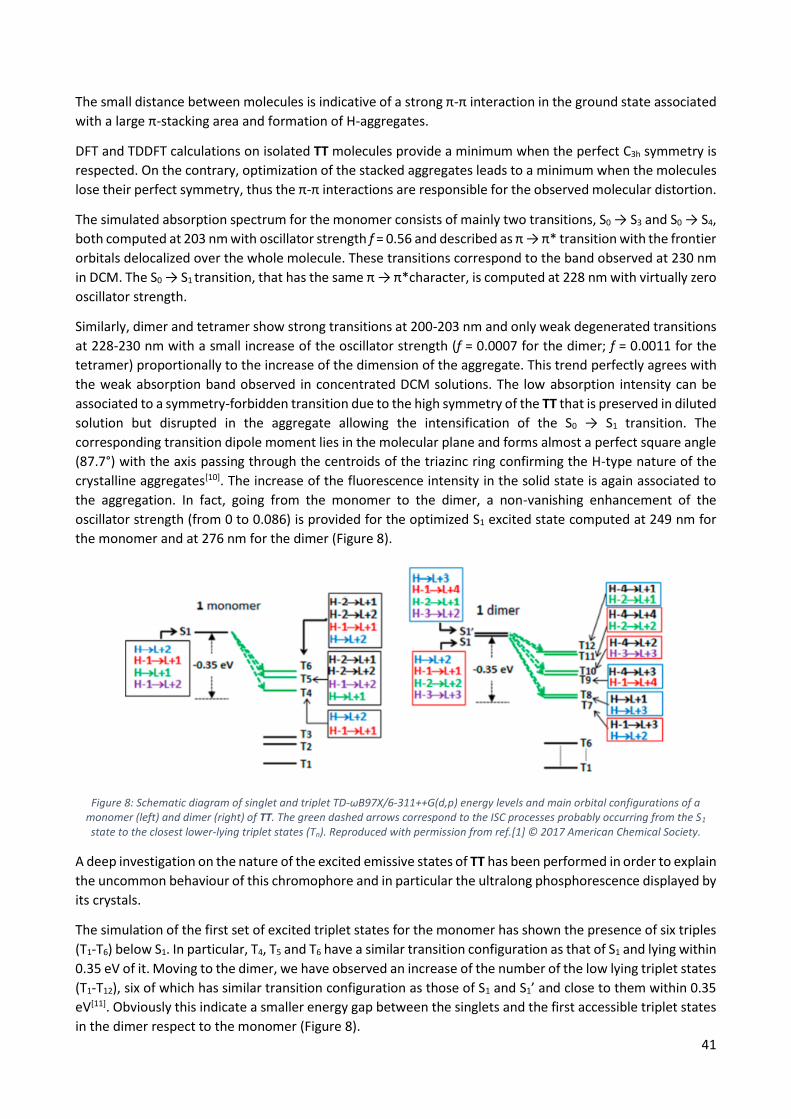
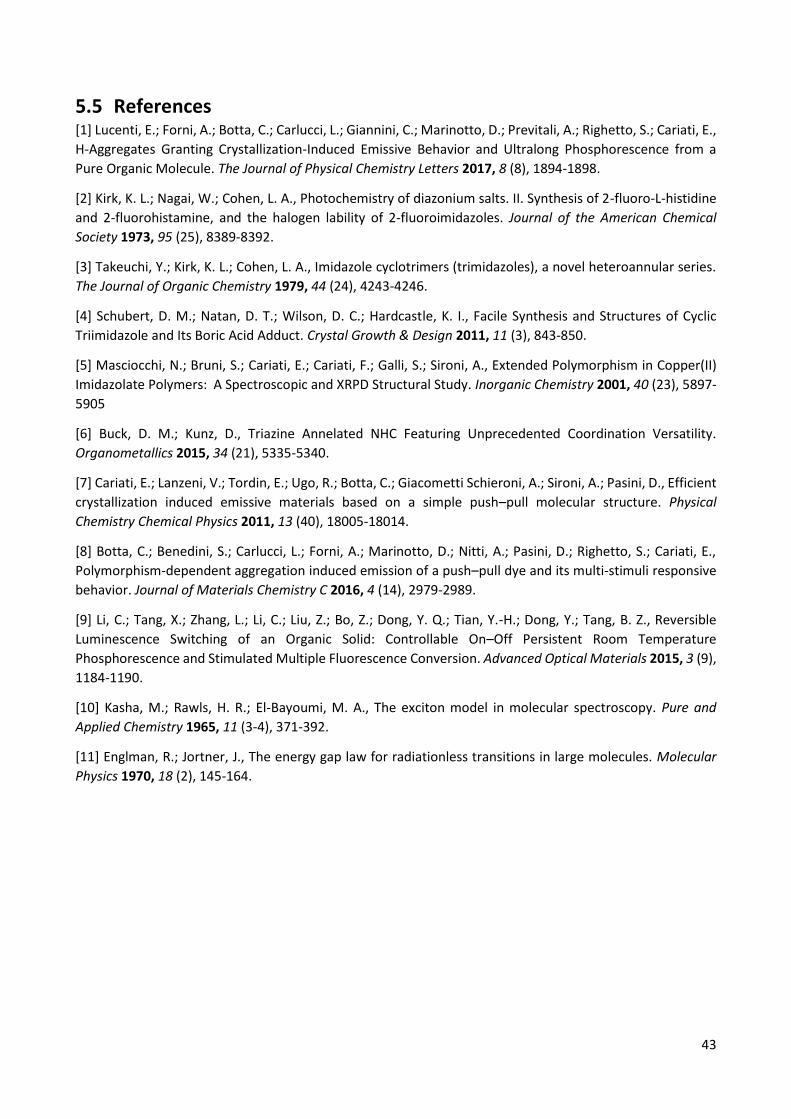
5.3 Crystalline structure-emission relation The X-ray crystal structure evidences that TT molecules are slightly distorted with respect to an ideal D3h
symmetry. Weak C-Hּּּּ ּּּ ּּּּN hydrogen bonds connect molecules along planar rows, connected through other C-
Hּּּּ ּּּ ּּּּN hydrogen bonds to form approximated sheets. Along the third axis molecules of TT stack in face-to-face
antiparallel-packed zigzag columns with distances between average molecular planes alternately equal to
3.204 and 3.290 Å and corresponding distances between centroids of the central rings equal to 3.95 and 3.73
Å, respectively (Figure 7).
Figure 7: Fragment of crystal packing of TT showing the key intermolecular distances and the angles between the transition moment dipoles (red arrows) and the axis through the centroids of the triazinic rings (purple circles). Reproduced with permission from ref.[1]
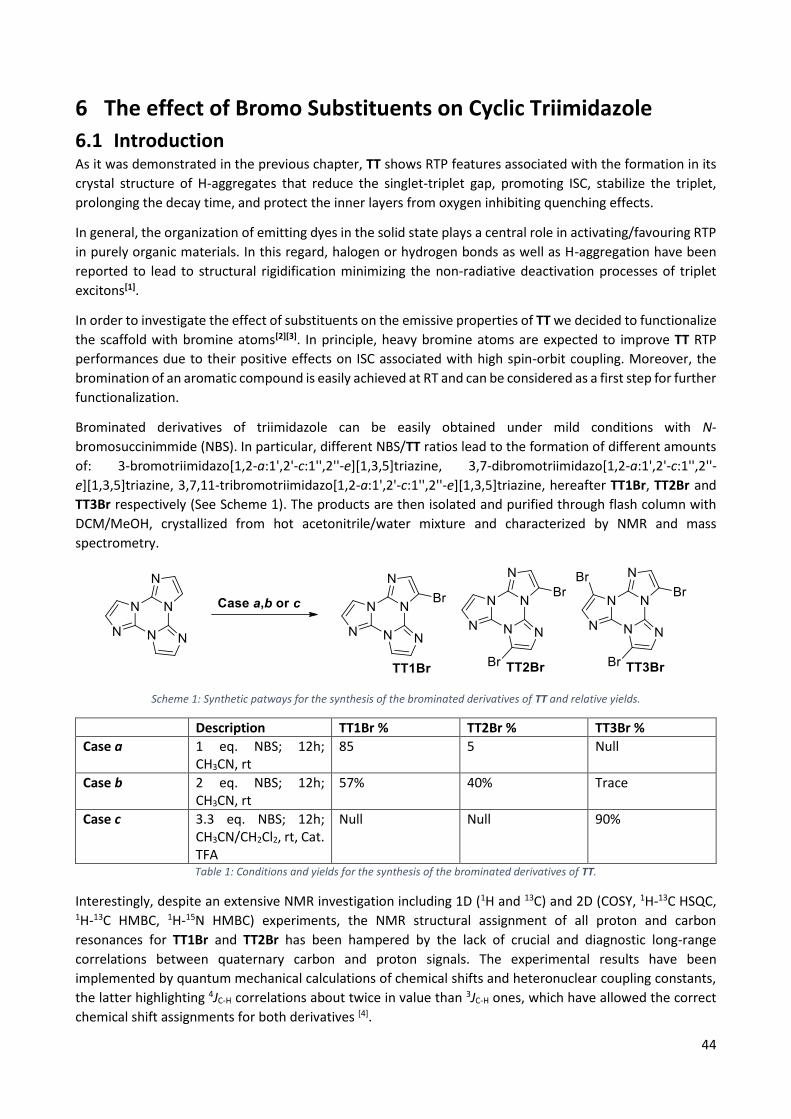
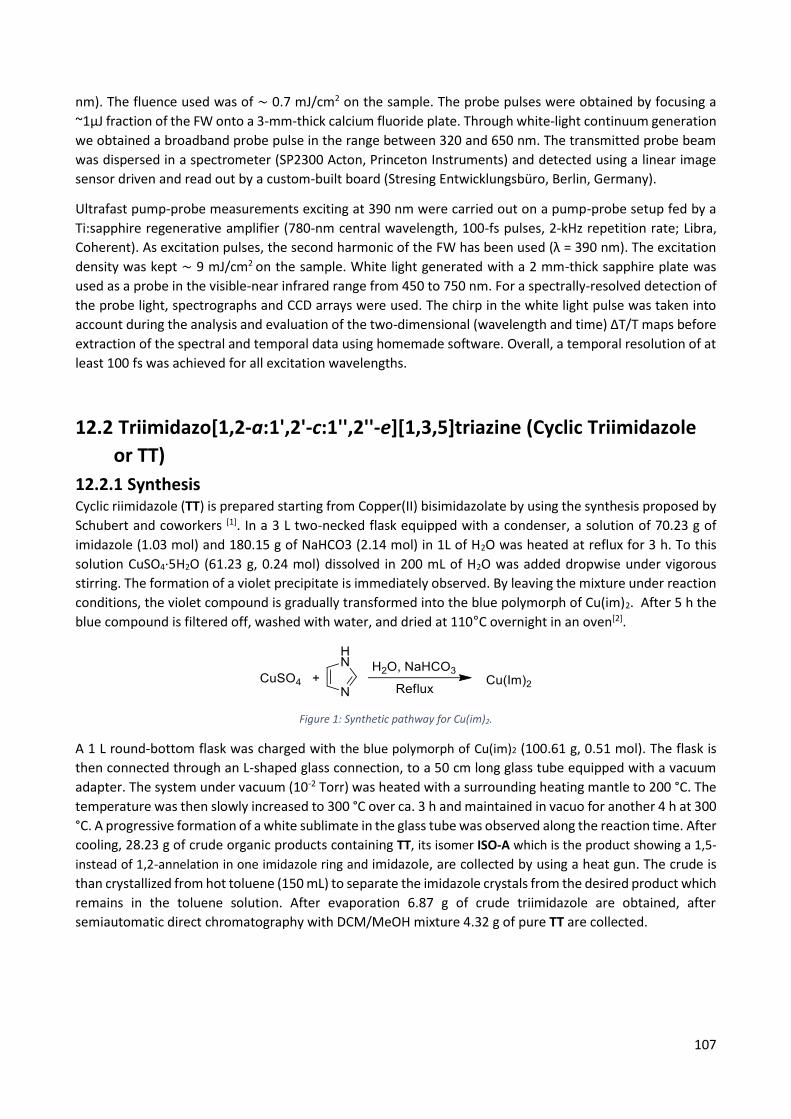
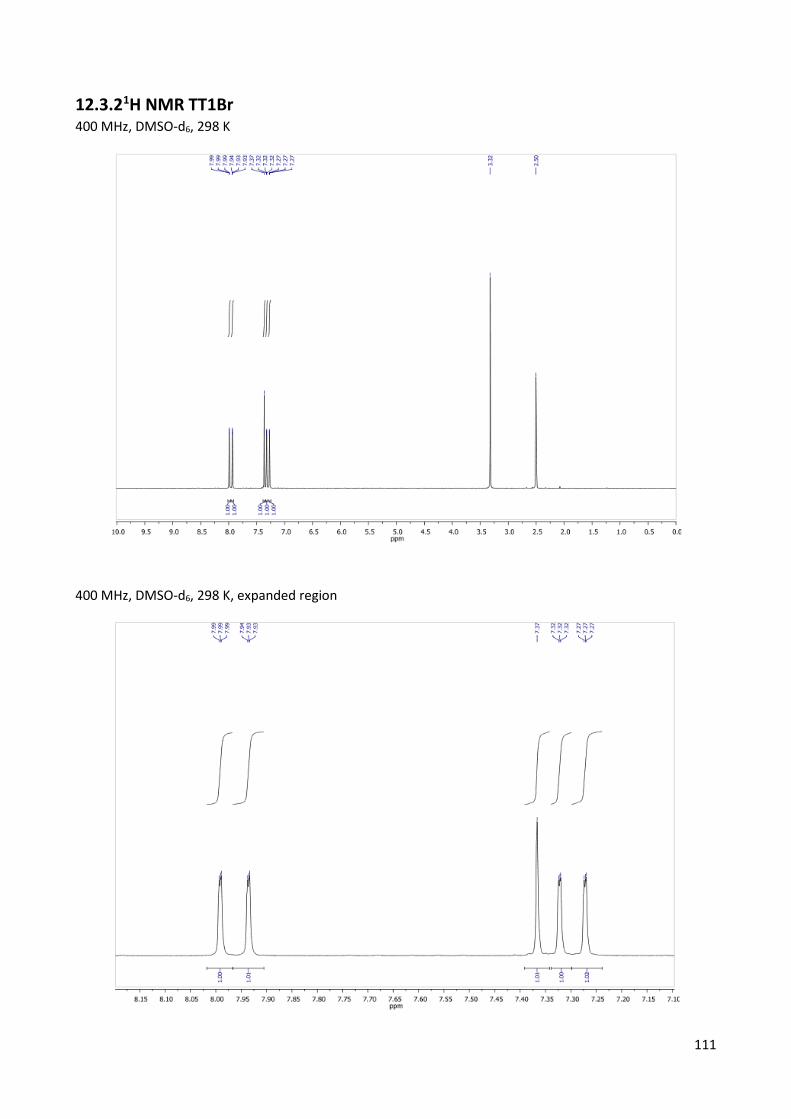
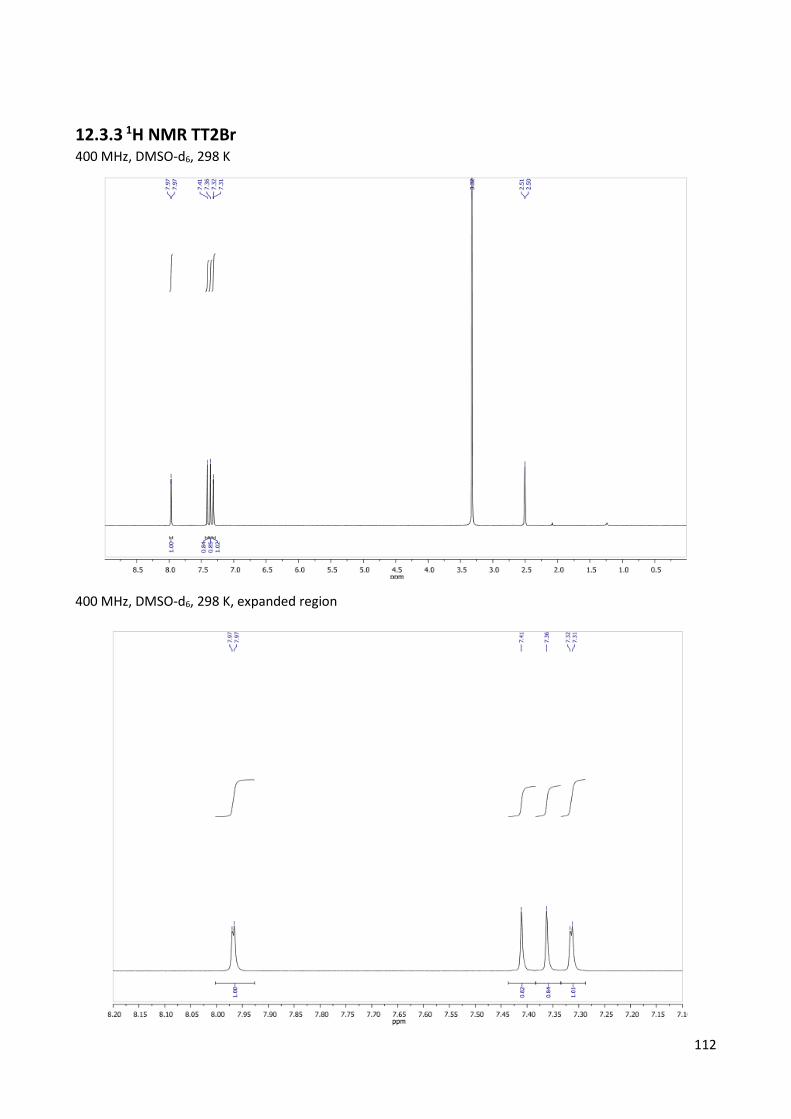
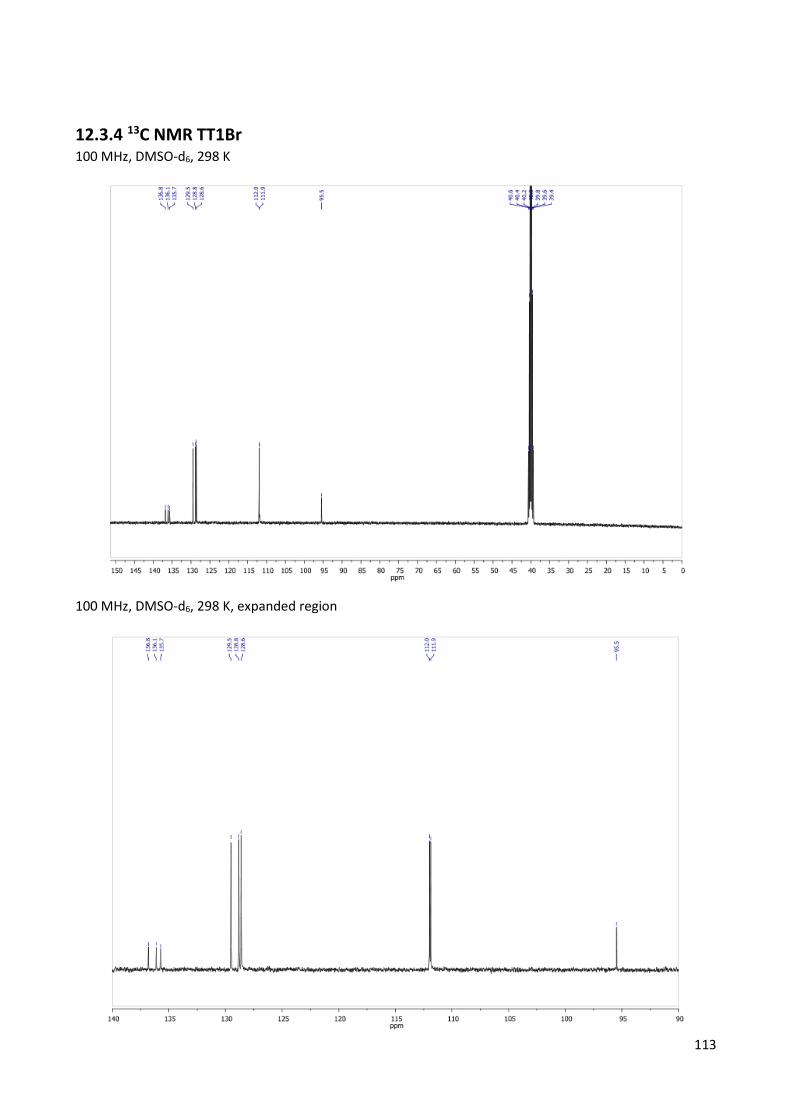
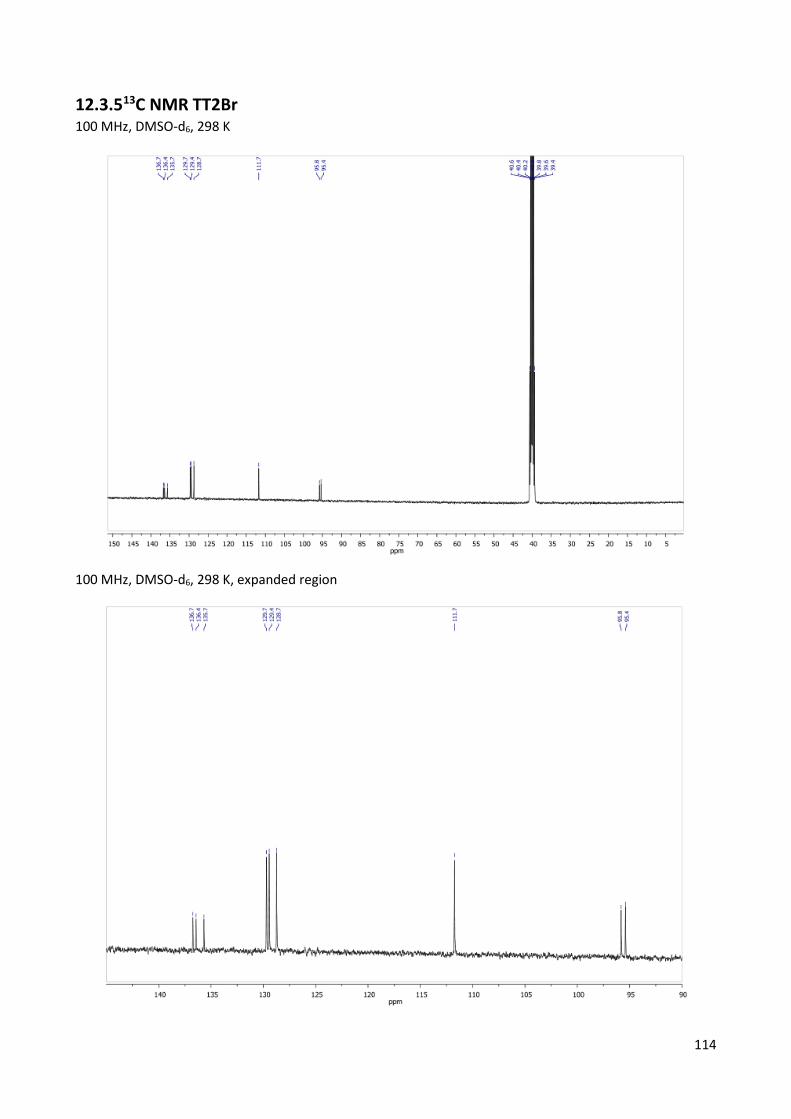
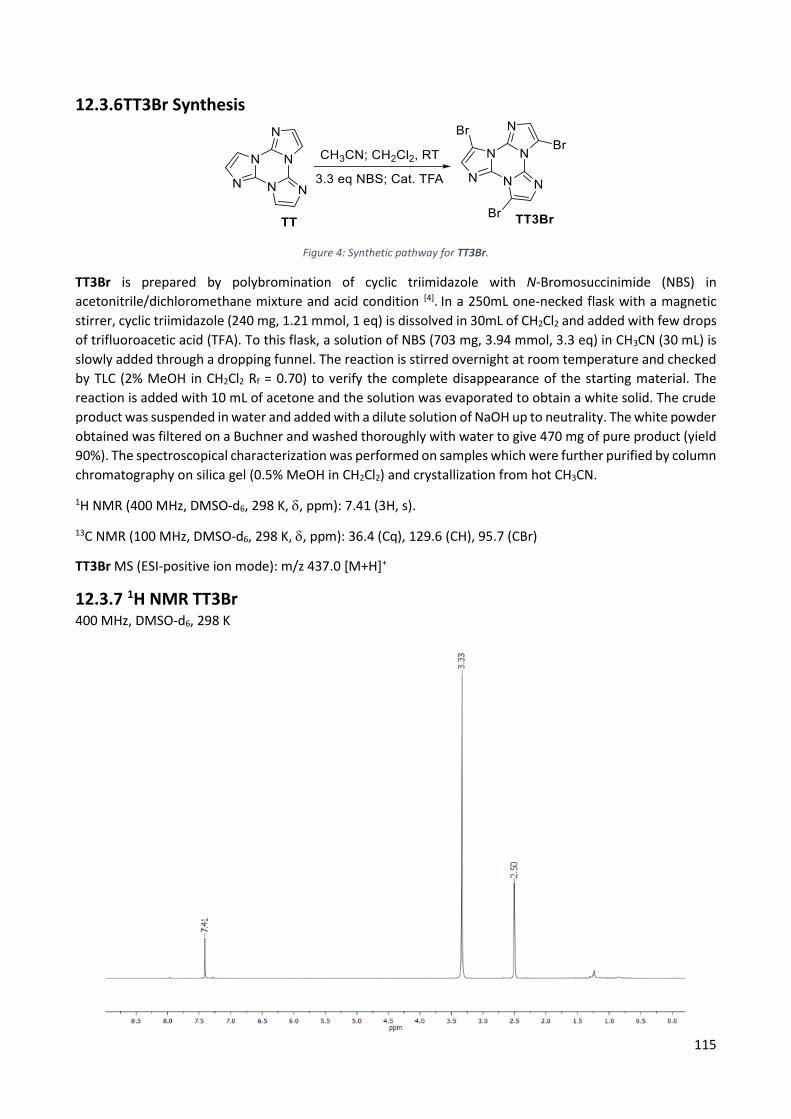
e][1,3,5]triazine, 3,7,11-tribromotriimidazo[1,2-a:1',2'-c:1'',2''-e][1,3,5]triazine, hereafter TT1Br, TT2Br and
TT3Br respectively (See Scheme 1). The products are then isolated and purified through flash column with
DCM/MeOH, crystallized from hot acetonitrile/water mixture and characterized by NMR and mass
spectrometry.
Scheme 1: Synthetic patways for the synthesis of the brominated derivatives of TT and relative yields.
Description TT1Br % TT2Br % TT3Br %
Case a 1 eq. NBS; 12h; CH3CN, rt
85 5 Null
Case b 2 eq. NBS; 12h; CH3CN, rt
57% 40% Trace
Case c 3.3 eq. NBS; 12h; CH3CN/CH2Cl2, rt, Cat. TFA
Null Null 90%
Table 1: Conditions and yields for the synthesis of the brominated derivatives of TT.
Interestingly, despite an extensive NMR investigation including 1D (1H and 13C) and 2D (COSY, 1H-13C HSQC, 1H-13C HMBC, 1H-15N HMBC) experiments, the NMR structural assignment of all proton and carbon
resonances for TT1Br and TT2Br has been hampered by the lack of crucial and diagnostic long-range
correlations between quaternary carbon and proton signals. The experimental results have been
implemented by quantum mechanical calculations of chemical shifts and heteronuclear coupling constants,
the latter highlighting 4JC-H correlations about twice in value than 3JC-H ones, which have allowed the correct
chemical shift assignments for both derivatives [4].
45
Moreover, an electrochemical investigation of the brominated derivatives on glassy carbon has revealed a
shift of the reduction peak toward more positive potentials with respect to TT, with the carbon-halogen bond
undergoing dissociative electron transfer with concerted mechanism. This result is quite interesting since
such pathway is usually observed in alkyl derivatives (for which the injection of an electron leads to a purely
dissociative state) while aromatic halides follow a stepwise mechanism (due to the presence of low lying
LUMO orbitals that stabilize the incoming electron). In addition, the electrocleavage of the C–X bond is only
slightly influenced by increasing the number of halogens when going from TT1Br to TT3Br. These findings
support the hypothesis that each imidazole unit in the cyclic trimer acts as an almost independent redox site,
with very poor heteroannular aromaticity [4].
6.2 Photophysical characterization and discussion
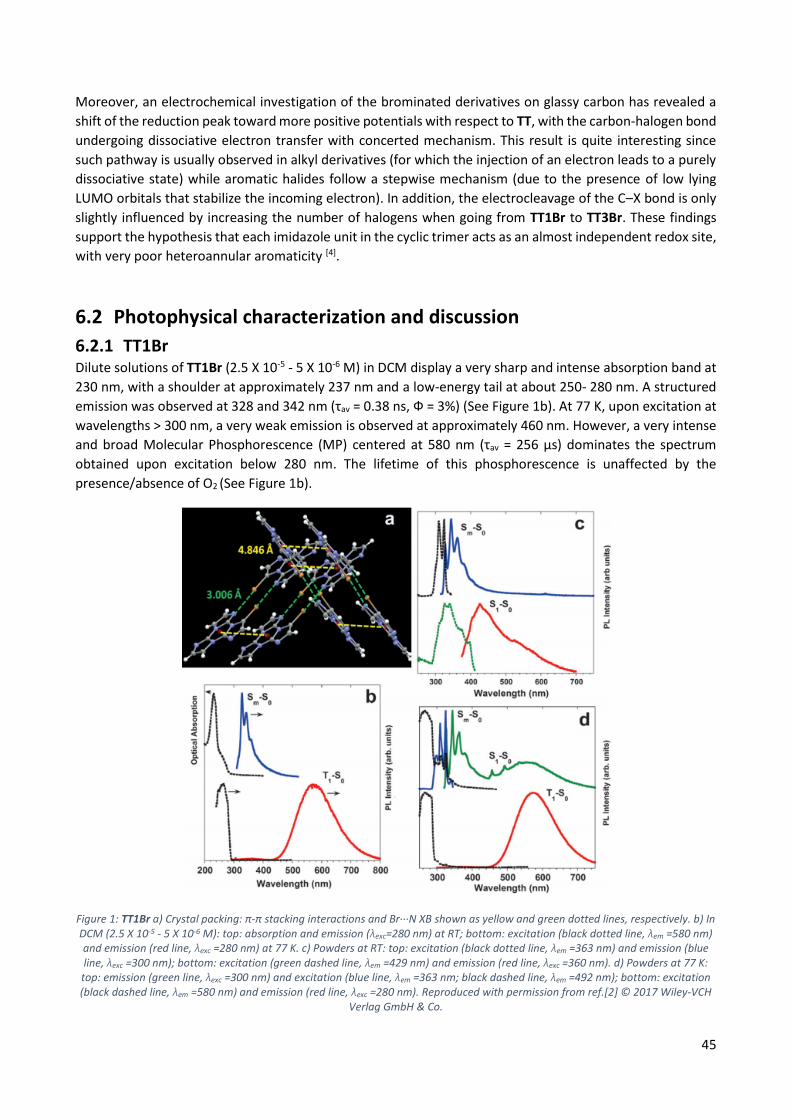
6.2.1 TT1Br Dilute solutions of TT1Br (2.5 X 10⁻⁵ - 5 X 10⁻⁶ M) in DCM display a very sharp and intense absorption band at
230 nm, with a shoulder at approximately 237 nm and a low-energy tail at about 250- 280 nm. A structured
emission was observed at 328 and 342 nm (τav = 0.38 ns, Ф = 3%) (See Figure 1b). At 77 K, upon excitation at
wavelengths > 300 nm, a very weak emission is observed at approximately 460 nm. However, a very intense
and broad Molecular Phosphorescence (MP) centered at 580 nm (τav = 256 μs) dominates the spectrum
obtained upon excitation below 280 nm. The lifetime of this phosphorescence is unaffected by the
Crystals of TT1Br, prepared from a hot CH3CN/H2O solution and manually selected using a microscope, when
excited at 300 nm at room temperature are characterized, similarly to its diluted solution, by a structured
emission at 326, 345, and 365 nm (τ < 1 ns, with Ф below the instrumental sensitivity). Moreover, an
additional fluorescence centered at approximately 426 nm is activated by exciting at 360 nm (τav = 4 ns) (See
Figure 1c). Upon lowering the temperature, similar features are observed for excitation above 300 nm, while
upon excitation at 280 nm, the spectrum is dominated by the MP at 575 nm (τav = 274 μs) (See Figure 1d).
TD-DFT calculations on TT1Br monomer provide an allowed S0 → S1 transition with π → π* character at 231
nm (f= 0.024) owing to the introduction of bromine which disrupts the perfect symmetry of the triimidazolic
scaffold. Stronger transitions are computed at 214, 208 and 204 nm (S0 → S3 f= 0.203; S0 → S4 f= 0.400; S0 →
S5 f= 0.524) in perfect agreement with the experimental spectrum. Calculations also provide an explanation
to the observed dual emission, in fact, the fluorescence detected at 326 nm in solution is an anti-Kasha
process Sm → S0 while the weak emission detected at 426 nm is a fluorescence S1 → S0 that is accessible only
when the S1 level is selectively populated. The origin of the 580 nm phosphorescence observed at 77 K both
in solution and in the solid state when exciting at high energy, below 280 nm, was disclosed through
theoretical calculations. An efficient ISC is expected to occur from a high energy Sn to a close Tn level with σ
→ σ* symmetry where the σ orbital is mainly delocalized on the bromine. No other phosphorescence is
detected, in particular, no ultralong component is present in the solid sample at RT or at 77 K. H-aggregates
are absent in the crystal structure of TT1Br where dimers with large distances between centroids (4.846 Å)
self-assembled through cyclic Br···N halogen-bonded motifs, interact through C-H···N hydrogen bonds along
the molecular plane and through C-H···π hydrogen bonds perpendicularly to the plane (See Figure 1a).
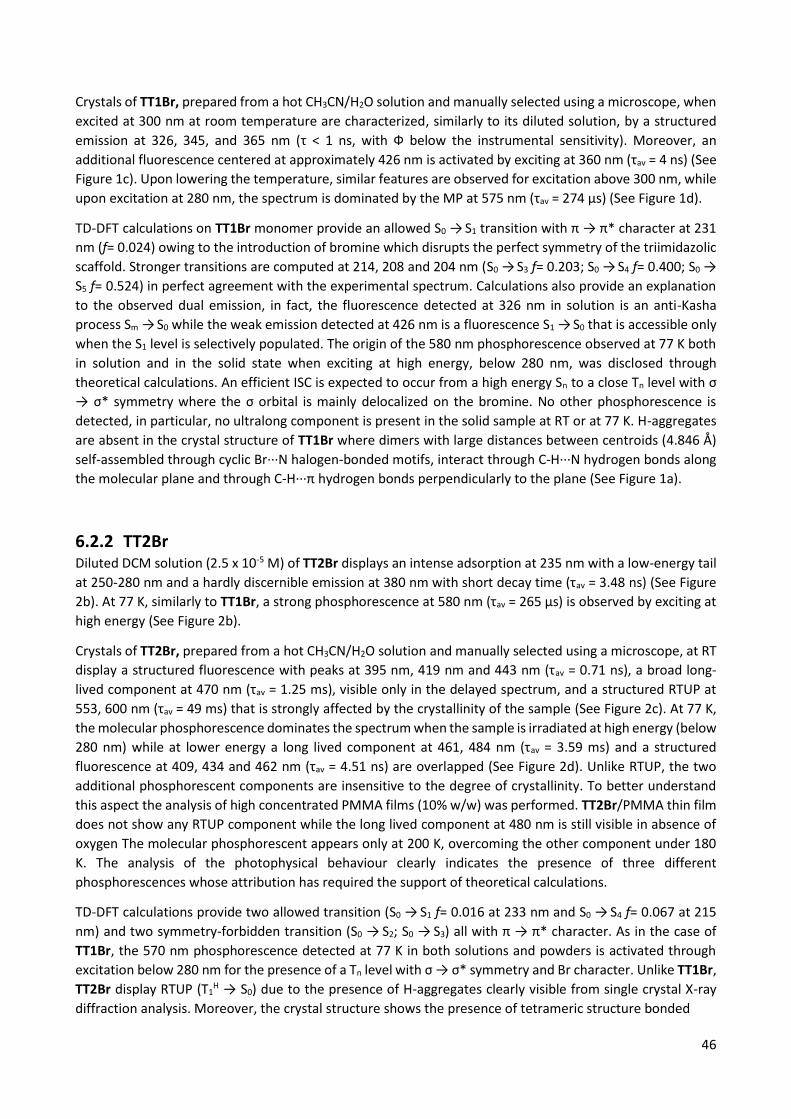
6.2.2 TT2Br Diluted DCM solution (2.5 x 10⁻⁵ M) of TT2Br displays an intense adsorption at 235 nm with a low-energy tail
at 250-280 nm and a hardly discernible emission at 380 nm with short decay time (τav = 3.48 ns) (See Figure
2b). At 77 K, similarly to TT1Br, a strong phosphorescence at 580 nm (τav = 265 μs) is observed by exciting at
high energy (See Figure 2b).
Crystals of TT2Br, prepared from a hot CH3CN/H2O solution and manually selected using a microscope, at RT
display a structured fluorescence with peaks at 395 nm, 419 nm and 443 nm (τav = 0.71 ns), a broad long-
lived component at 470 nm (τav = 1.25 ms), visible only in the delayed spectrum, and a structured RTUP at
553, 600 nm (τav = 49 ms) that is strongly affected by the crystallinity of the sample (See Figure 2c). At 77 K,
the molecular phosphorescence dominates the spectrum when the sample is irradiated at high energy (below
280 nm) while at lower energy a long lived component at 461, 484 nm (τav = 3.59 ms) and a structured
fluorescence at 409, 434 and 462 nm (τav = 4.51 ns) are overlapped (See Figure 2d). Unlike RTUP, the two
additional phosphorescent components are insensitive to the degree of crystallinity. To better understand
this aspect the analysis of high concentrated PMMA films (10% w/w) was performed. TT2Br/PMMA thin film
does not show any RTUP component while the long lived component at 480 nm is still visible in absence of
oxygen The molecular phosphorescent appears only at 200 K, overcoming the other component under 180
K. The analysis of the photophysical behaviour clearly indicates the presence of three different
phosphorescences whose attribution has required the support of theoretical calculations.
TD-DFT calculations provide two allowed transition (S0 → S1 f= 0.016 at 233 nm and S0 → S4 f= 0.067 at 215
nm) and two symmetry-forbidden transition (S0 → S2; S0 → S3) all with π → π* character. As in the case of
TT1Br, the 570 nm phosphorescence detected at 77 K in both solutions and powders is activated through
excitation below 280 nm for the presence of a Tn level with σ → σ* symmetry and Br character. Unlike TT1Br,
TT2Br display RTUP (T1H → S0) due to the presence of H-aggregates clearly visible from single crystal X-ray
diffraction analysis. Moreover, the crystal structure shows the presence of tetrameric structure bonded
47
Figure 2: TT2Br a) Top: powders at 77 K under a 360 nm (left) and 254 nm lamp (right); bottom: crystal packing: π-π stacking interactions and Br···Br XB shown as yellow and green dotted lines, respectively. b) In DCM (2.5 x 10⁻⁵ M): absorption at RT (black line); excitation (green dashed line, λem =580 nm) and emission (red line, λexc =280 nm) at 77 K. c) Powders at RT: top: excitation (black dotted line, λem =418 nm) and emission (black line, lex=355 nm); middle: excitation and phosphorescence emission (blue
dashed line, λem =475 nm; blue line, λexc =355 nm, 5 ms delay, window 0.1 ms); bottom: excitation and phosphorescence emission (red dashed line, λem =600 nm; red line, λexc =355 nm, 0.5 ms delay, window 30 ms). d) Powders at 77 K: top: excitation (black dotted
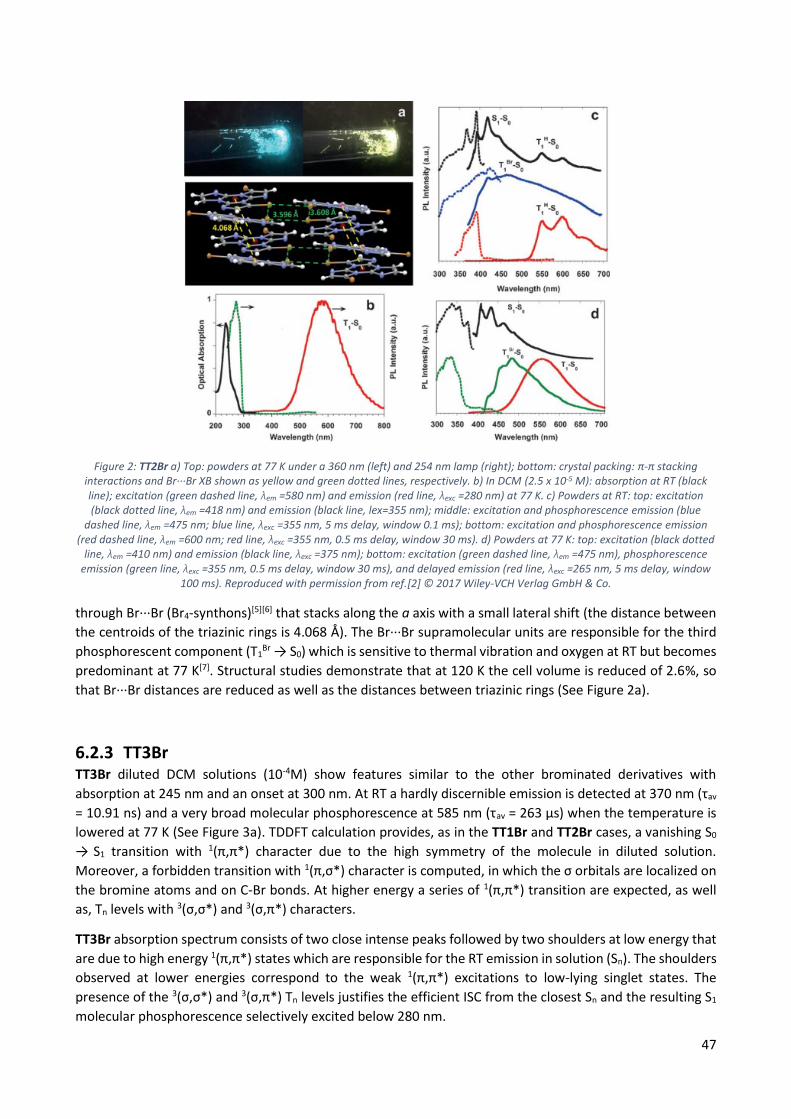
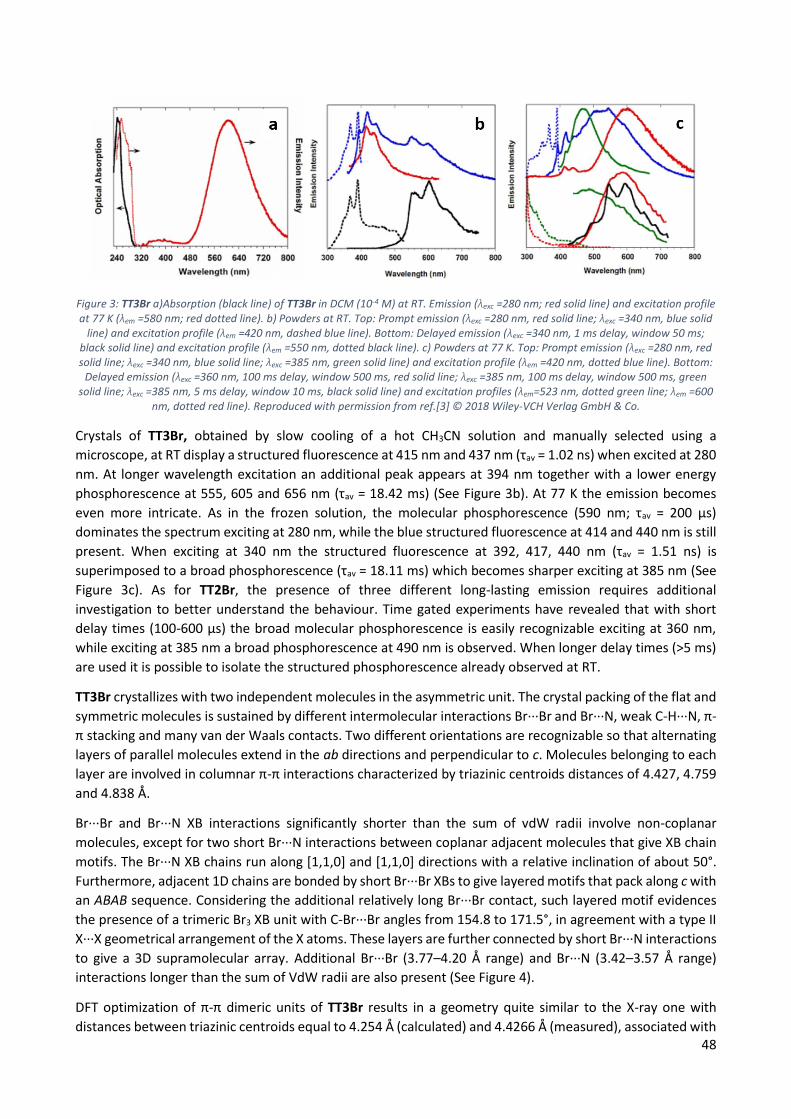
Figure 3: TT3Br a)Absorption (black line) of TT3Br in DCM (10-4 M) at RT. Emission (λexc =280 nm; red solid line) and excitation profile at 77 K (λem =580 nm; red dotted line). b) Powders at RT. Top: Prompt emission (λexc =280 nm, red solid line; λexc =340 nm, blue solid
line) and excitation profile (λem =420 nm, dashed blue line). Bottom: Delayed emission (λexc =340 nm, 1 ms delay, window 50 ms; black solid line) and excitation profile (λem =550 nm, dotted black line). c) Powders at 77 K. Top: Prompt emission (λexc =280 nm, red solid line; λexc =340 nm, blue solid line; λexc =385 nm, green solid line) and excitation profile (λem =420 nm, dotted blue line). Bottom:
Delayed emission (λexc =360 nm, 100 ms delay, window 500 ms, red solid line; λexc =385 nm, 100 ms delay, window 500 ms, green solid line; λexc =385 nm, 5 ms delay, window 10 ms, black solid line) and excitation profiles (λem=523 nm, dotted green line; λem =600
Crystals of TT3Br, obtained by slow cooling of a hot CH3CN solution and manually selected using a
microscope, at RT display a structured fluorescence at 415 nm and 437 nm (τav = 1.02 ns) when excited at 280
nm. At longer wavelength excitation an additional peak appears at 394 nm together with a lower energy
phosphorescence at 555, 605 and 656 nm (τav = 18.42 ms) (See Figure 3b). At 77 K the emission becomes
even more intricate. As in the frozen solution, the molecular phosphorescence (590 nm; τav = 200 μs)
dominates the spectrum exciting at 280 nm, while the blue structured fluorescence at 414 and 440 nm is still
present. When exciting at 340 nm the structured fluorescence at 392, 417, 440 nm (τav = 1.51 ns) is
superimposed to a broad phosphorescence (τav = 18.11 ms) which becomes sharper exciting at 385 nm (See
Figure 3c). As for TT2Br, the presence of three different long-lasting emission requires additional
investigation to better understand the behaviour. Time gated experiments have revealed that with short
delay times (100-600 μs) the broad molecular phosphorescence is easily recognizable exciting at 360 nm,
while exciting at 385 nm a broad phosphorescence at 490 nm is observed. When longer delay times (>5 ms)
are used it is possible to isolate the structured phosphorescence already observed at RT.
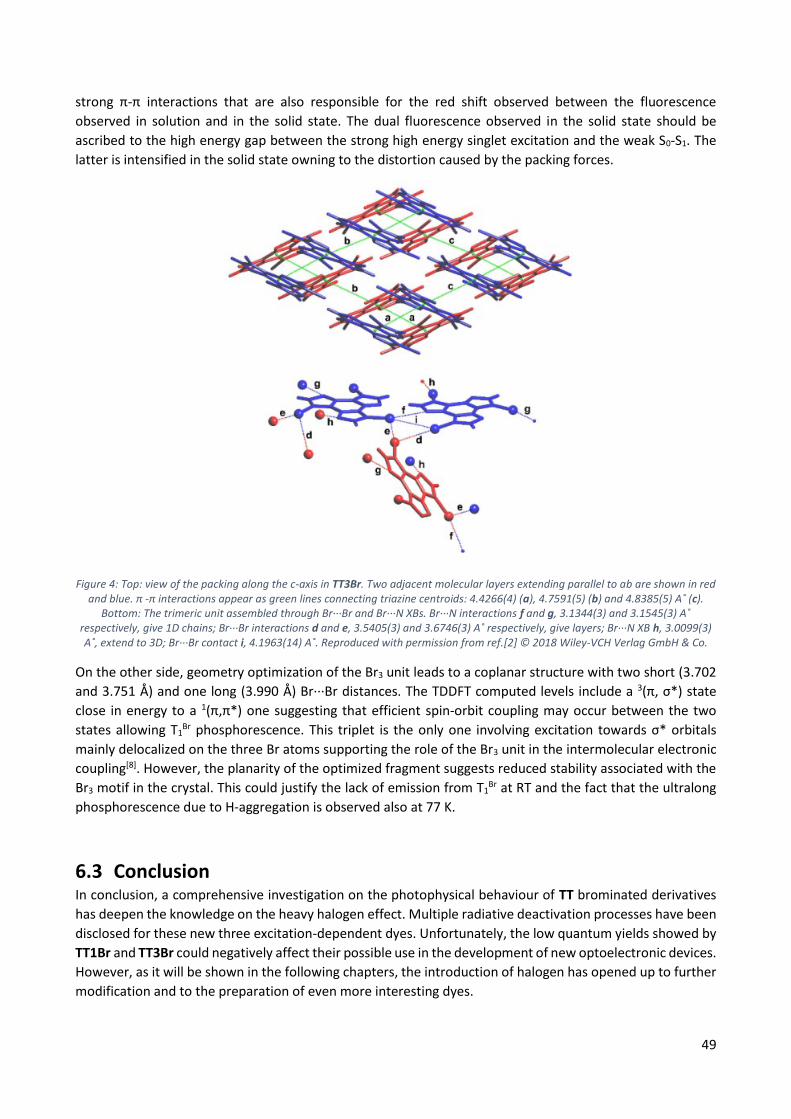
TT3Br crystallizes with two independent molecules in the asymmetric unit. The crystal packing of the flat and
symmetric molecules is sustained by different intermolecular interactions Br···Br and Br···N, weak C-H···N, π-
π stacking and many van der Waals contacts. Two different orientations are recognizable so that alternating
layers of parallel molecules extend in the ab directions and perpendicular to c. Molecules belonging to each
layer are involved in columnar π-π interactions characterized by triazinic centroids distances of 4.427, 4.759
and 4.838 Å.
Br···Br and Br···N XB interactions significantly shorter than the sum of vdW radii involve non-coplanar
molecules, except for two short Br···N interactions between coplanar adjacent molecules that give XB chain
motifs. The Br···N XB chains run along [1,1,0] and [1,1,0] directions with a relative inclination of about 50°.
Furthermore, adjacent 1D chains are bonded by short Br···Br XBs to give layered motifs that pack along c with
an ABAB sequence. Considering the additional relatively long Br···Br contact, such layered motif evidences
the presence of a trimeric Br3 XB unit with C-Br···Br angles from 154.8 to 171.5°, in agreement with a type II
X···X geometrical arrangement of the X atoms. These layers are further connected by short Br···N interactions
to give a 3D supramolecular array. Additional Br···Br (3.77–4.20 Å range) and Br···N (3.42–3.57 Å range)
interactions longer than the sum of VdW radii are also present (See Figure 4).
DFT optimization of π-π dimeric units of TT3Br results in a geometry quite similar to the X-ray one with
distances between triazinic centroids equal to 4.254 Å (calculated) and 4.4266 Å (measured), associated with
49
strong π-π interactions that are also responsible for the red shift observed between the fluorescence
observed in solution and in the solid state. The dual fluorescence observed in the solid state should be
ascribed to the high energy gap between the strong high energy singlet excitation and the weak S0-S1. The
latter is intensified in the solid state owning to the distortion caused by the packing forces.
Figure 4: Top: view of the packing along the c-axis in TT3Br. Two adjacent molecular layers extending parallel to ab are shown in red and blue. π -π interactions appear as green lines connecting triazine centroids: 4.4266(4) (a), 4.7591(5) (b) and 4.8385(5) A˚ (c).
Lien, A.; Bryce, M. R., Intermolecular Electronic Coupling of Organic Units for Efficient Persistent Room-
Temperature Phosphorescence. Angewandte Chemie International Edition 2016, 55 (6), 2181-2185.
51
7 Iodine introduction on the triimidazole scaffold: Intrinsic vs
Extrinsic effect.
7.1 Introduction The introduction of heavy halogen atoms (like Br or I)[1] in the molecular structure (intrinsic effect) or the
formation of intramolecular interactions based on halogen bonding (extrinsic effect) [2][3][4], with molecules of
the same type (one component)[5][6][7][8] or with molecules of a different type (two components)[9][10][11][12],
can effectively modulate the emissive properties of a chromophore providing an efficient strategy for the
preparation of functional materials.
The wide range of possible halogen bonds (XB) patterns can produce various effects either on fluorescence
and phosphorescence, as previously demonstrated by the brominated derivatives of TT, which displays an
extrinsic one-component effect combined with an intrinsic one[13][14][15]. For example, TT2Br forms strong and
rigid Br4 XB intramolecular units that induces a long lived RTP which is absent in TT3Br where only weaker
and non-planar Br3 XB units are formed.
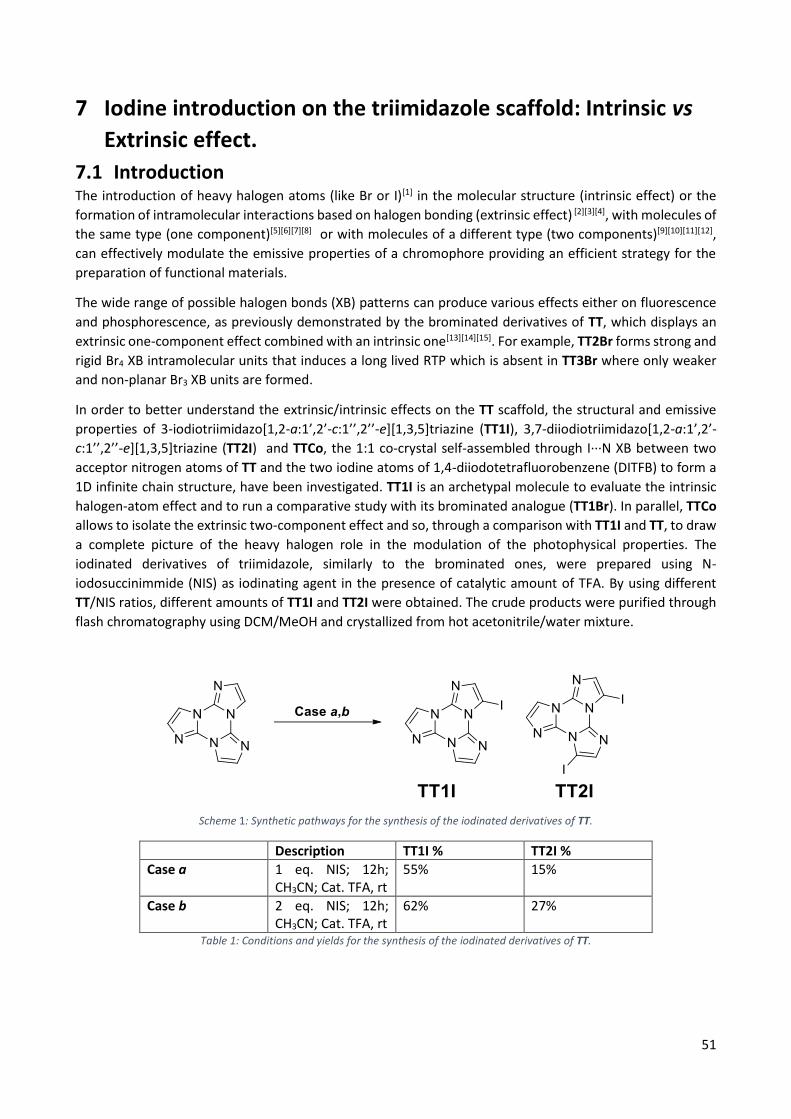
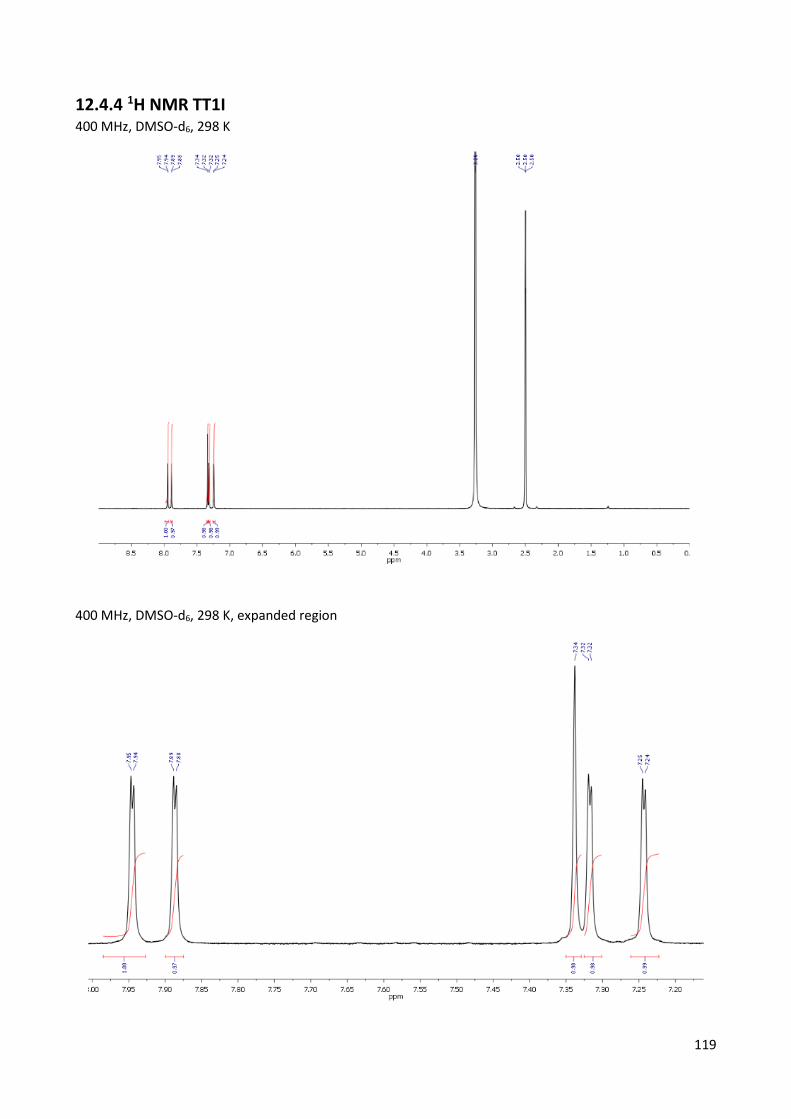
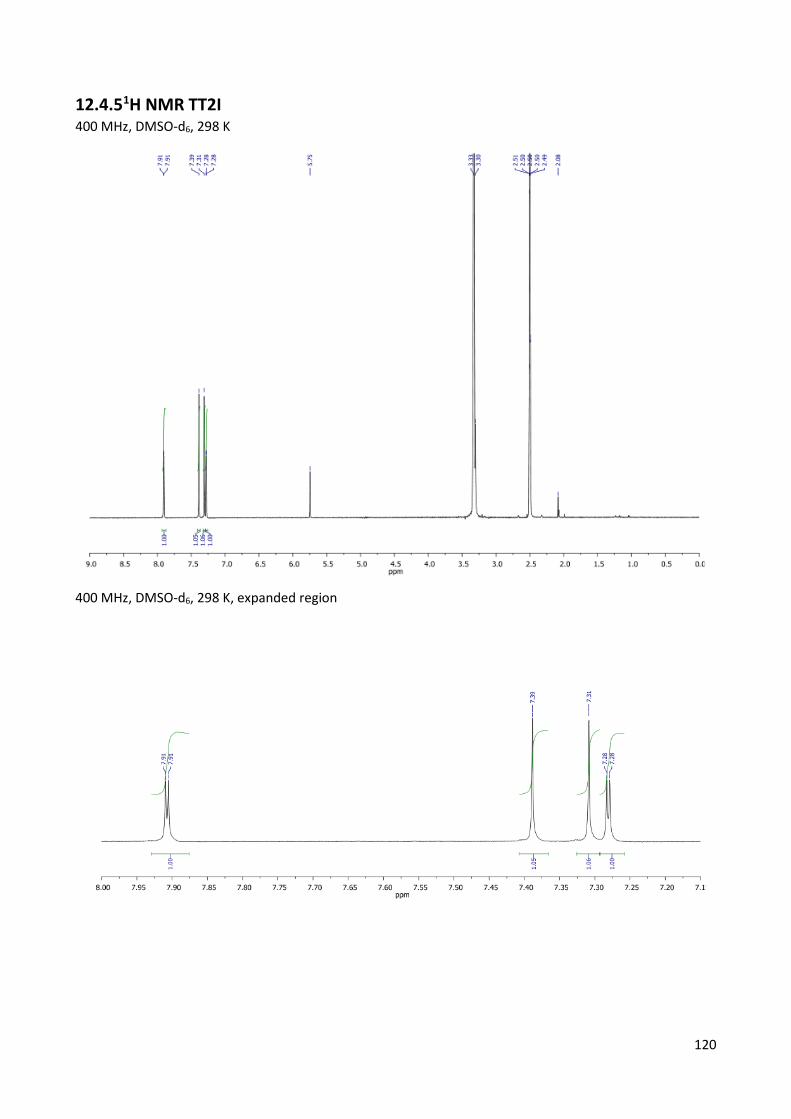
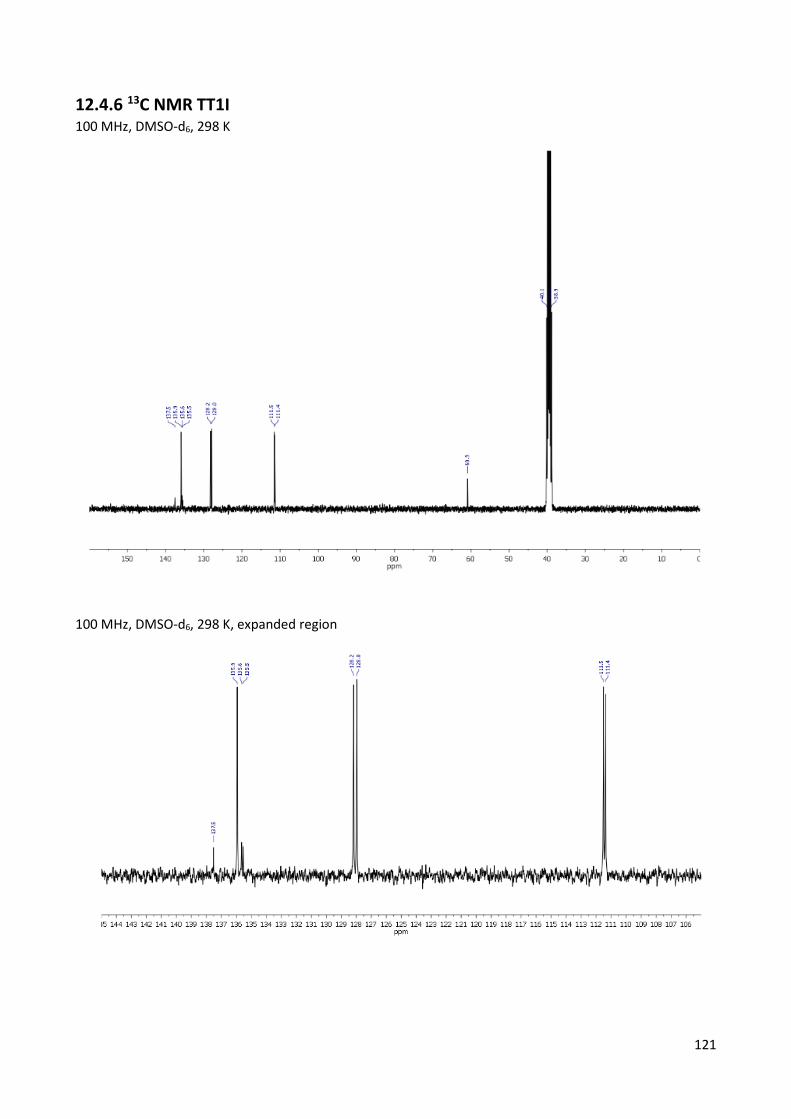
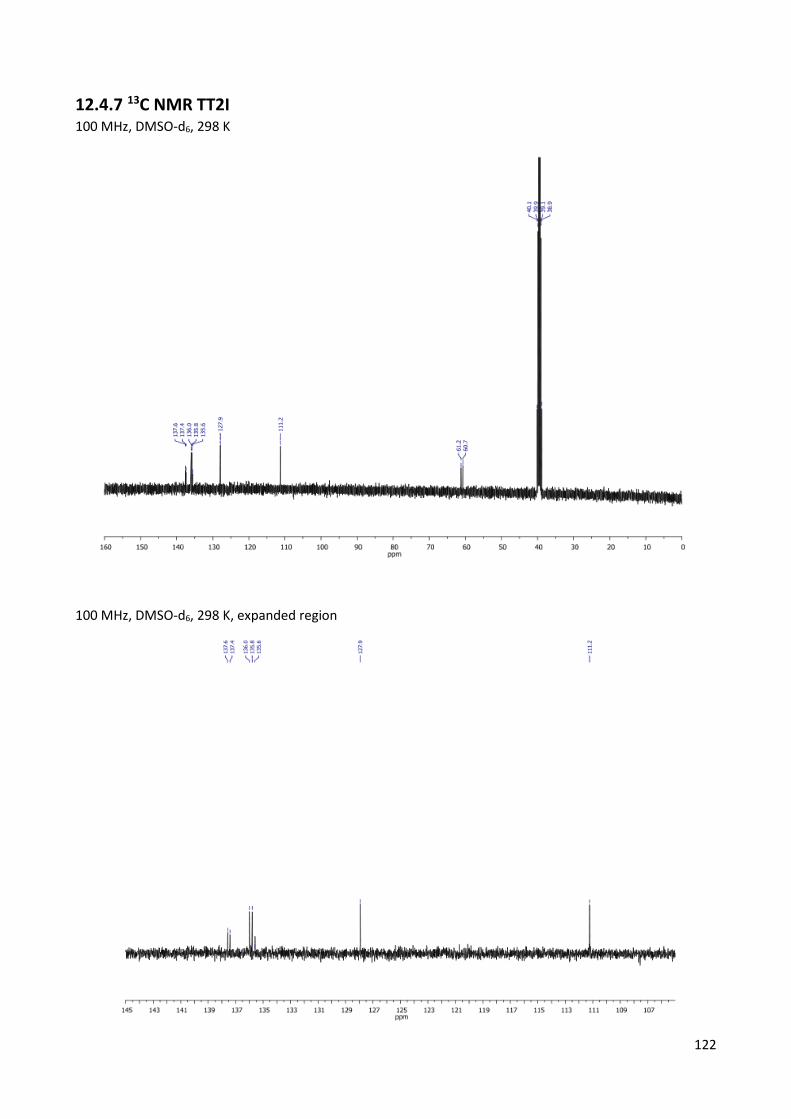
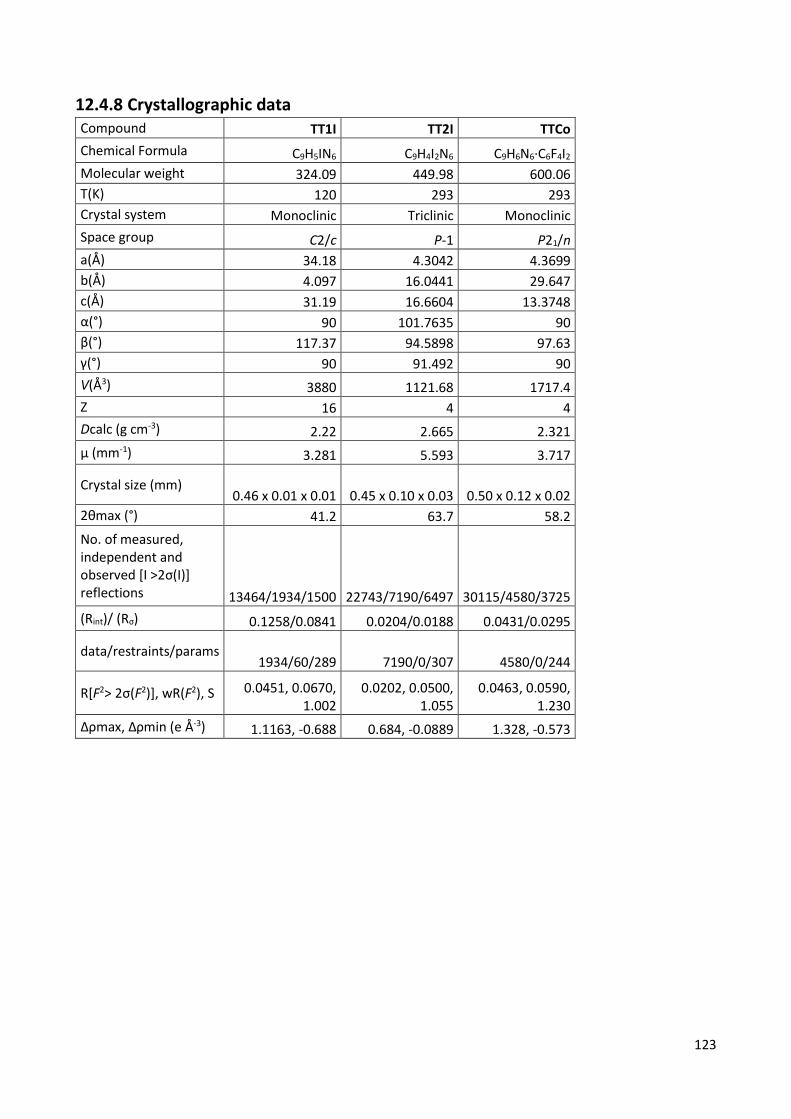
In order to better understand the extrinsic/intrinsic effects on the TT scaffold, the structural and emissive
properties of 3-iodiotriimidazo[1,2-a:1’,2’-c:1’’,2’’-e][1,3,5]triazine (TT1I), 3,7-diiodiotriimidazo[1,2-a:1’,2’-
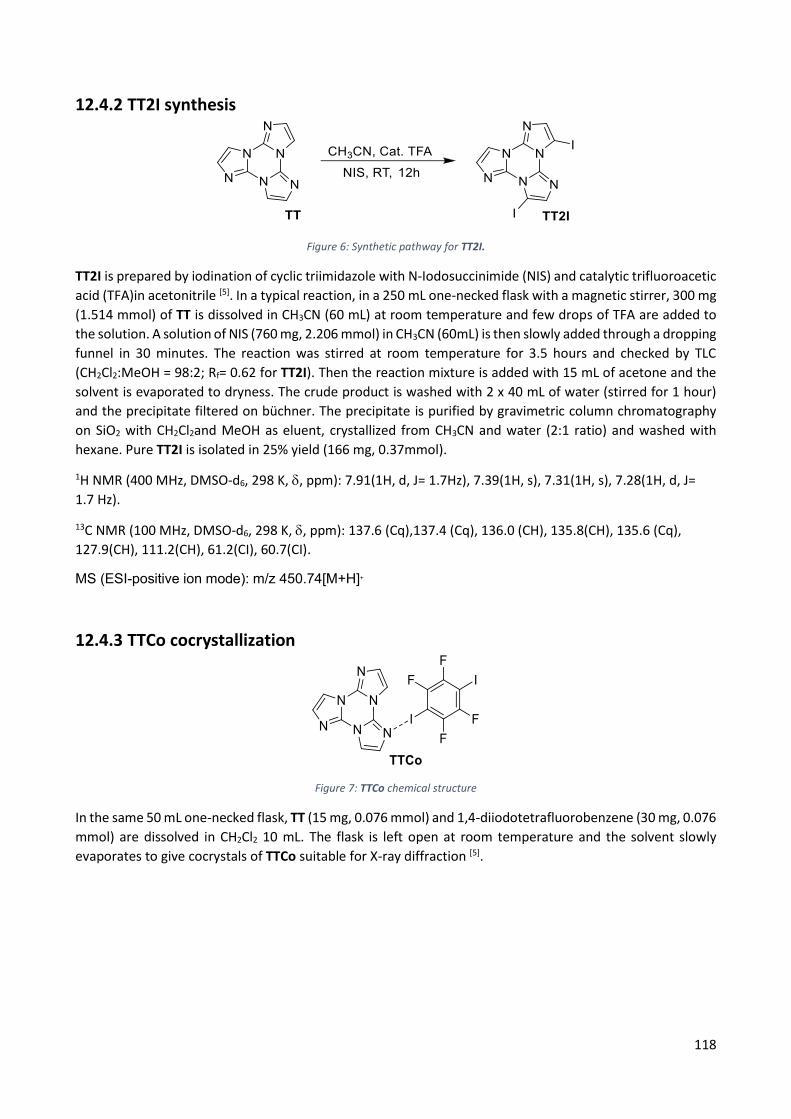
c:1’’,2’’-e][1,3,5]triazine (TT2I) and TTCo, the 1:1 co-crystal self-assembled through I···N XB between two
acceptor nitrogen atoms of TT and the two iodine atoms of 1,4-diiodotetrafluorobenzene (DITFB) to form a
1D infinite chain structure, have been investigated. TT1I is an archetypal molecule to evaluate the intrinsic
halogen-atom effect and to run a comparative study with its brominated analogue (TT1Br). In parallel, TTCo
allows to isolate the extrinsic two-component effect and so, through a comparison with TT1I and TT, to draw
a complete picture of the heavy halogen role in the modulation of the photophysical properties. The
iodinated derivatives of triimidazole, similarly to the brominated ones, were prepared using N-
iodosuccinimmide (NIS) as iodinating agent in the presence of catalytic amount of TFA. By using different
TT/NIS ratios, different amounts of TT1I and TT2I were obtained. The crude products were purified through
flash chromatography using DCM/MeOH and crystallized from hot acetonitrile/water mixture.
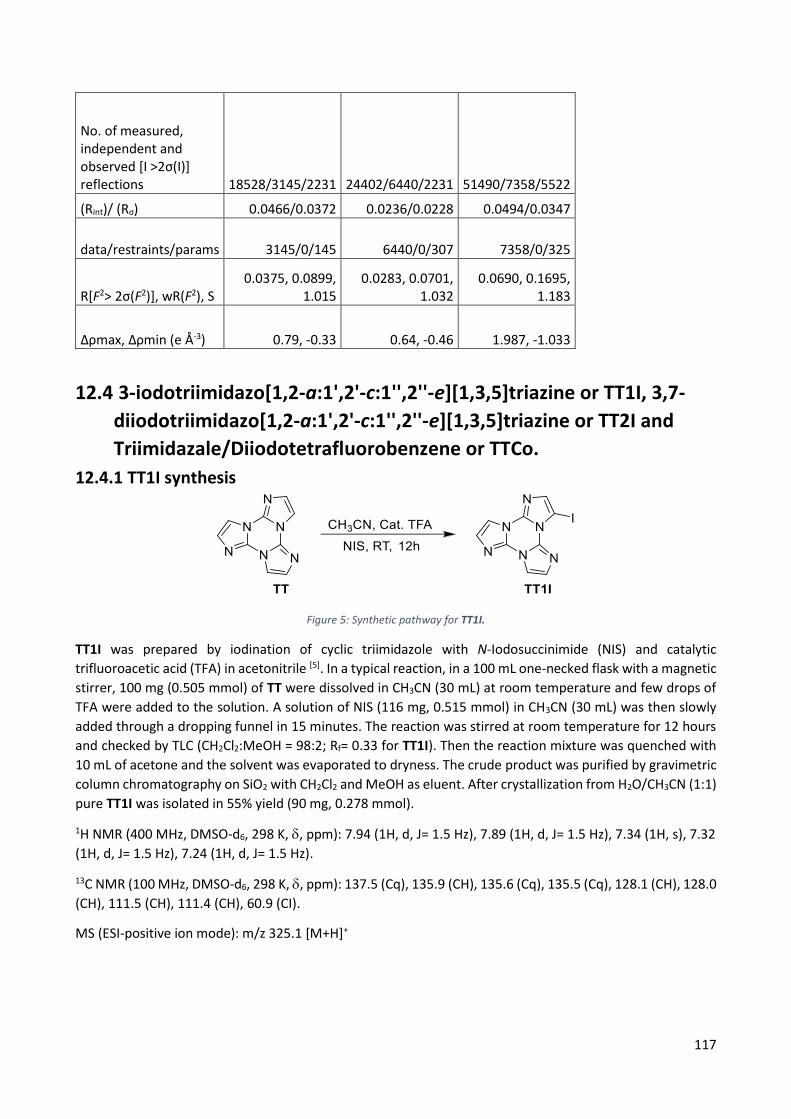
Scheme 1: Synthetic pathways for the synthesis of the iodinated derivatives of TT.
Description TT1I % TT2I %
Case a 1 eq. NIS; 12h; CH3CN; Cat. TFA, rt
55% 15%
Case b 2 eq. NIS; 12h; CH3CN; Cat. TFA, rt
62% 27%
Table 1: Conditions and yields for the synthesis of the iodinated derivatives of TT.
52
7.2 Photophysical characterization and discussion
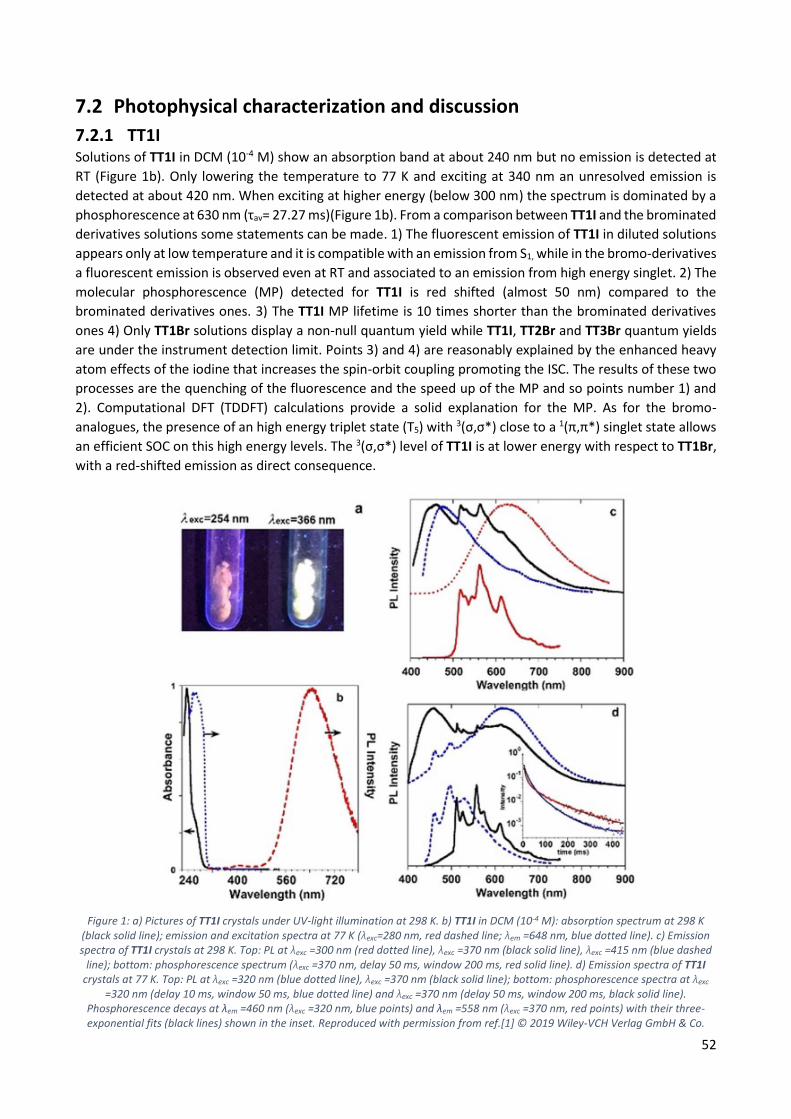
7.2.1 TT1I Solutions of TT1I in DCM (10-4 M) show an absorption band at about 240 nm but no emission is detected at
RT (Figure 1b). Only lowering the temperature to 77 K and exciting at 340 nm an unresolved emission is
detected at about 420 nm. When exciting at higher energy (below 300 nm) the spectrum is dominated by a
phosphorescence at 630 nm (τav= 27.27 ms)(Figure 1b). From a comparison between TT1I and the brominated
derivatives solutions some statements can be made. 1) The fluorescent emission of TT1I in diluted solutions
appears only at low temperature and it is compatible with an emission from S1, while in the bromo-derivatives
a fluorescent emission is observed even at RT and associated to an emission from high energy singlet. 2) The
molecular phosphorescence (MP) detected for TT1I is red shifted (almost 50 nm) compared to the
brominated derivatives ones. 3) The TT1I MP lifetime is 10 times shorter than the brominated derivatives
ones 4) Only TT1Br solutions display a non-null quantum yield while TT1I, TT2Br and TT3Br quantum yields
are under the instrument detection limit. Points 3) and 4) are reasonably explained by the enhanced heavy
atom effects of the iodine that increases the spin-orbit coupling promoting the ISC. The results of these two
processes are the quenching of the fluorescence and the speed up of the MP and so points number 1) and
2). Computational DFT (TDDFT) calculations provide a solid explanation for the MP. As for the bromo-
analogues, the presence of an high energy triplet state (T5) with 3(σ,σ*) close to a 1(π,π*) singlet state allows
an efficient SOC on this high energy levels. The 3(σ,σ*) level of TT1I is at lower energy with respect to TT1Br,
with a red-shifted emission as direct consequence.
Figure 1: a) Pictures of TT1I crystals under UV-light illumination at 298 K. b) TT1I in DCM (10-4 M): absorption spectrum at 298 K (black solid line); emission and excitation spectra at 77 K (λexc=280 nm, red dashed line; λem =648 nm, blue dotted line). c) Emission spectra of TT1I crystals at 298 K. Top: PL at λexc =300 nm (red dotted line), λexc =370 nm (black solid line), λexc =415 nm (blue dashed
line); bottom: phosphorescence spectrum (λexc =370 nm, delay 50 ms, window 200 ms, red solid line). d) Emission spectra of TT1I crystals at 77 K. Top: PL at λexc =320 nm (blue dotted line), λexc =370 nm (black solid line); bottom: phosphorescence spectra at λexc
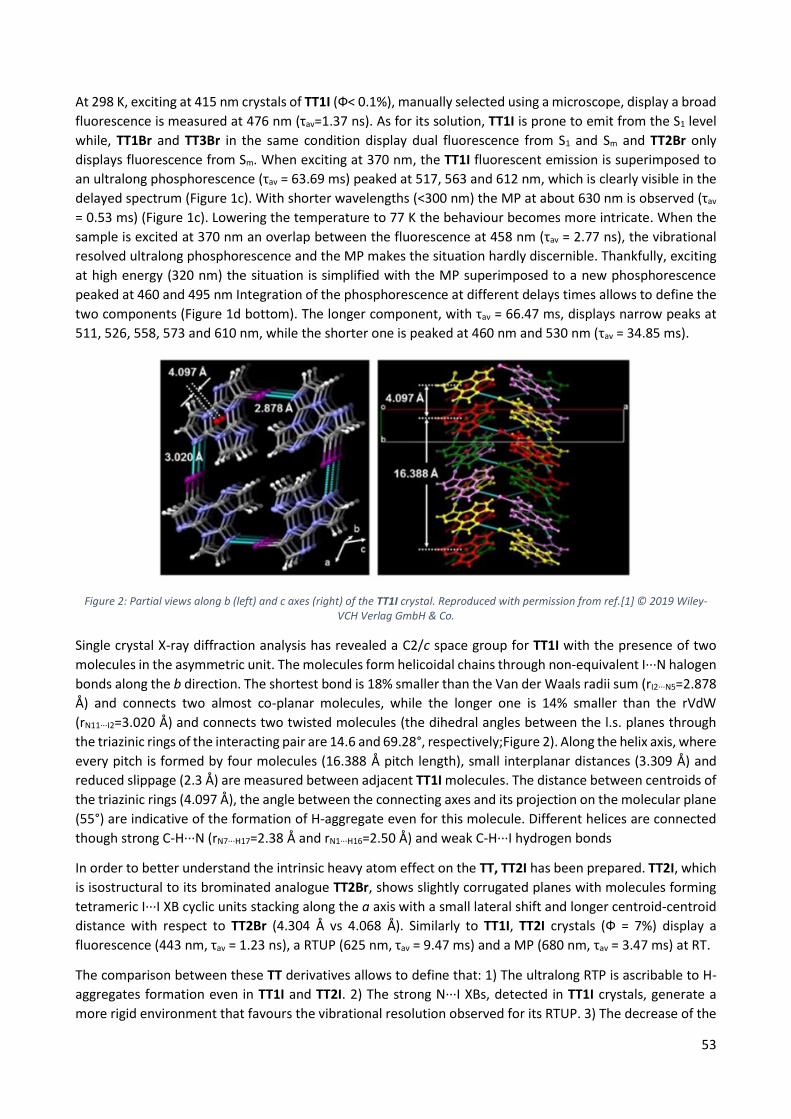
Single crystal X-ray diffraction analysis has revealed a C2/c space group for TT1I with the presence of two
molecules in the asymmetric unit. The molecules form helicoidal chains through non-equivalent I···N halogen
bonds along the b direction. The shortest bond is 18% smaller than the Van der Waals radii sum (rI2···N5=2.878
Å) and connects two almost co-planar molecules, while the longer one is 14% smaller than the rVdW
(rN11···I2=3.020 Å) and connects two twisted molecules (the dihedral angles between the l.s. planes through
the triazinic rings of the interacting pair are 14.6 and 69.28°, respectively;Figure 2). Along the helix axis, where
every pitch is formed by four molecules (16.388 Å pitch length), small interplanar distances (3.309 Å) and
reduced slippage (2.3 Å) are measured between adjacent TT1I molecules. The distance between centroids of
the triazinic rings (4.097 Å), the angle between the connecting axes and its projection on the molecular plane
(55°) are indicative of the formation of H-aggregate even for this molecule. Different helices are connected
though strong C-H···N (rN7···H17=2.38 Å and rN1···H16=2.50 Å) and weak C-H···I hydrogen bonds
In order to better understand the intrinsic heavy atom effect on the TT, TT2I has been prepared. TT2I, which
is isostructural to its brominated analogue TT2Br, shows slightly corrugated planes with molecules forming
tetrameric I···I XB cyclic units stacking along the a axis with a small lateral shift and longer centroid-centroid
distance with respect to TT2Br (4.304 Å vs 4.068 Å). Similarly to TT1I, TT2I crystals (Ф = 7%) display a
fluorescence (443 nm, τav = 1.23 ns), a RTUP (625 nm, τav = 9.47 ms) and a MP (680 nm, τav = 3.47 ms) at RT.
The comparison between these TT derivatives allows to define that: 1) The ultralong RTP is ascribable to H-
aggregates formation even in TT1I and TT2I. 2) The strong N···I XBs, detected in TT1I crystals, generate a
more rigid environment that favours the vibrational resolution observed for its RTUP. 3) The decrease of the
54
RTUP decay time (TT (970 ms)>TT1I (64 ms)>TT2Br (29 ms)> TT3Br (18 ms)>TT2I (9 ms)) is a consequence of
the different strength of the H-aggregates and the presence of heavy atoms. 4) The formation of XB generates
a ms order phosphorescence that, differently from TT2Br and TT3Br, is present even at RT. Interestingly, a
similar phosphorescent emission is absent in TT1Br, showing in its structure only weaker Br···N XB (rBr···N =
3.006 Å, 12% shorter than the sum of van der Waals radii). 5) In agreement with the presence of the heavier
iodine atom on the molecule, the iodinated derivatives display at RT a MP which is much more intense than
the one observed for the brominated analogues that appears only at 77K. In addition, high energy
wavelengths are not required to observe the MP of TT1I that can be activated even populating S1 in the solid
sample.
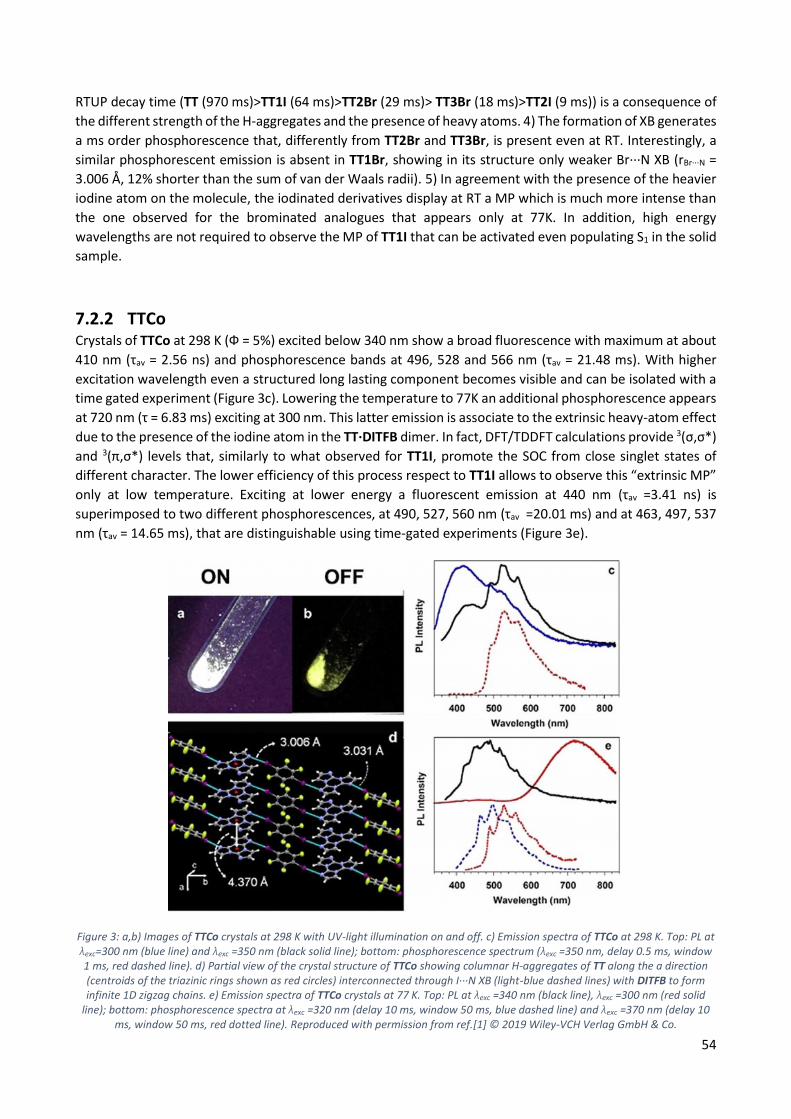
7.2.2 TTCo Crystals of TTCo at 298 K (Ф = 5%) excited below 340 nm show a broad fluorescence with maximum at about
410 nm (τav = 2.56 ns) and phosphorescence bands at 496, 528 and 566 nm (τav = 21.48 ms). With higher
excitation wavelength even a structured long lasting component becomes visible and can be isolated with a
time gated experiment (Figure 3c). Lowering the temperature to 77K an additional phosphorescence appears
at 720 nm (τ = 6.83 ms) exciting at 300 nm. This latter emission is associate to the extrinsic heavy-atom effect
due to the presence of the iodine atom in the TT·DITFB dimer. In fact, DFT/TDDFT calculations provide 3(σ,σ*)
and 3(π,σ*) levels that, similarly to what observed for TT1I, promote the SOC from close singlet states of
different character. The lower efficiency of this process respect to TT1I allows to observe this “extrinsic MP”
only at low temperature. Exciting at lower energy a fluorescent emission at 440 nm (τav =3.41 ns) is
superimposed to two different phosphorescences, at 490, 527, 560 nm (τav =20.01 ms) and at 463, 497, 537
nm (τav = 14.65 ms), that are distinguishable using time-gated experiments (Figure 3e).
Figure 3: a,b) Images of TTCo crystals at 298 K with UV-light illumination on and off. c) Emission spectra of TTCo at 298 K. Top: PL at λexc=300 nm (blue line) and λexc =350 nm (black solid line); bottom: phosphorescence spectrum (λexc =350 nm, delay 0.5 ms, window 1 ms, red dashed line). d) Partial view of the crystal structure of TTCo showing columnar H-aggregates of TT along the a direction (centroids of the triazinic rings shown as red circles) interconnected through I···N XB (light-blue dashed lines) with DITFB to form infinite 1D zigzag chains. e) Emission spectra of TTCo crystals at 77 K. Top: PL at λexc =340 nm (black line), λexc =300 nm (red solid
E., H-Aggregates Granting Crystallization-Induced Emissive Behavior and Ultralong Phosphorescence from a
Pure Organic Molecule. The Journal of Physical Chemistry Letters 2017, 8 (8), 1894-1898.
58
8 Pyridinyl fragment conjugation: (2-fluoropyridin-4-yl)
8.1 Introduction The greater attention gained by molecules with prolonged solid state emission[1,2], that can find various
applications in the development of new technologies, makes the development of these materials an hot-
topic today[3-7].
As reported in the previous chapters, the introduction of Br and I atoms on the trimidazolic scaffold strongly
affects its photophysical behaviour that comprises dual fluorescence, molecular phosphorescence,
supramolecular room temperature phosphorescence (RTP) and RTUP[8–10]. Unfortunately, the Ф of these
compounds dramatically drops in comparison with the PLQY measured for TT, probably because of the
introduction of heavy atoms that promotes new non-radiative deactivation processes in addition to the
emissive ones, reducing their potential applications.
To solve this drawback, a step forward in the chemistry and photophysics of TT-derivatives has been
accomplished by insertion of a chromophoric fragment (2-fluoropyridine) on the trimidazolic scaffold.
Organic substituents are expected to modify the emissive properties at both molecular and, through different
packing arrangement, solid-state levels[11–15]. These effects were not predictable, so that any new member of
the TT-family represents a building block worth studying to get information on this new and very intriguing
class of emitters.
The halo-derivatization of the TT scaffold open up to a greater reactivity towards coupling reaction giving the
opportunity to introduce others organic fragment.
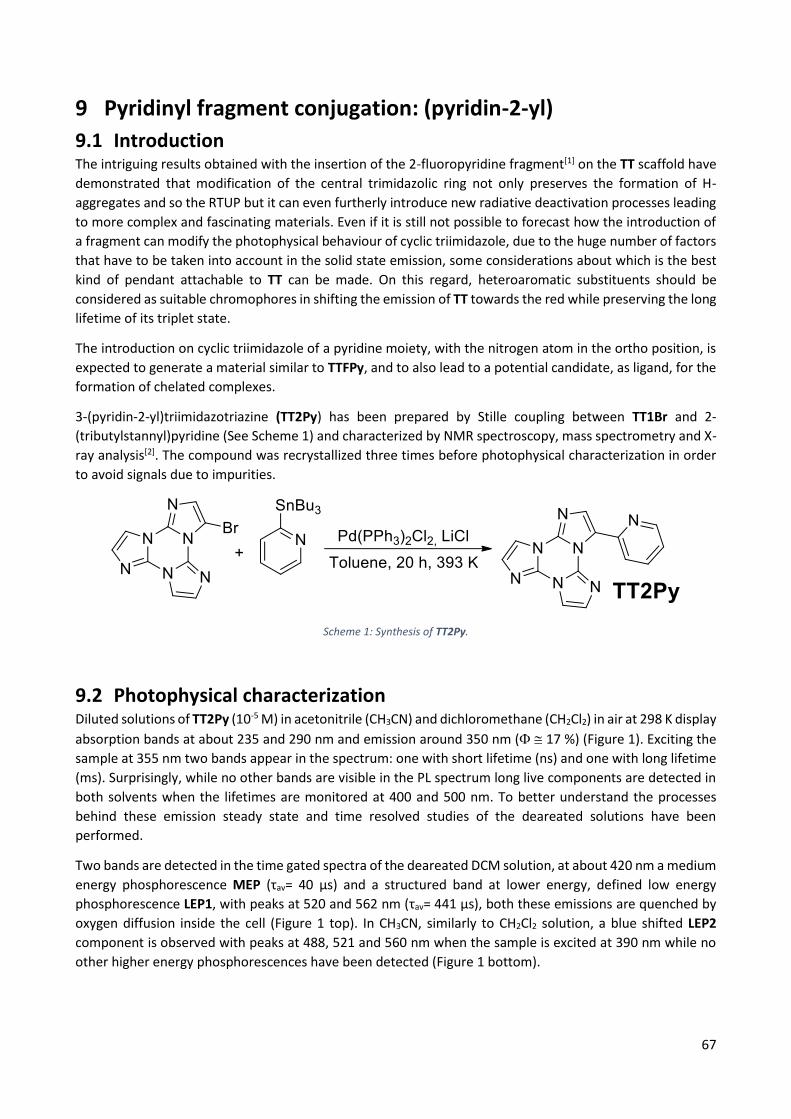
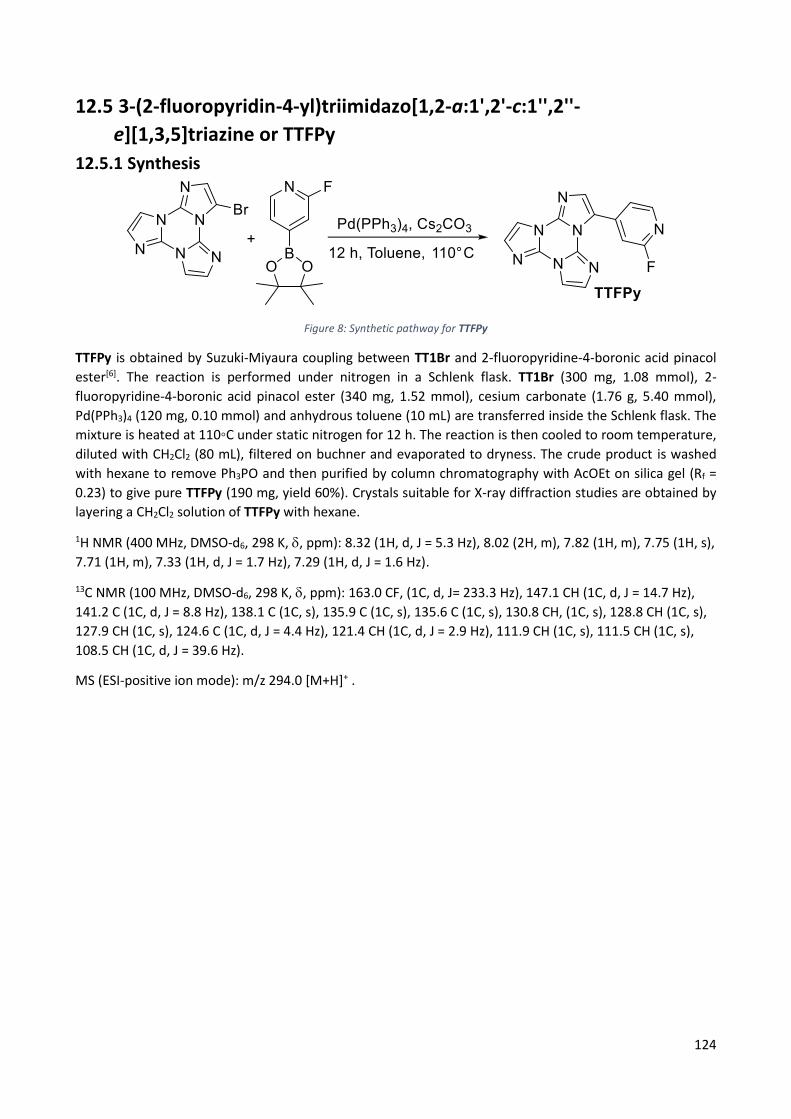
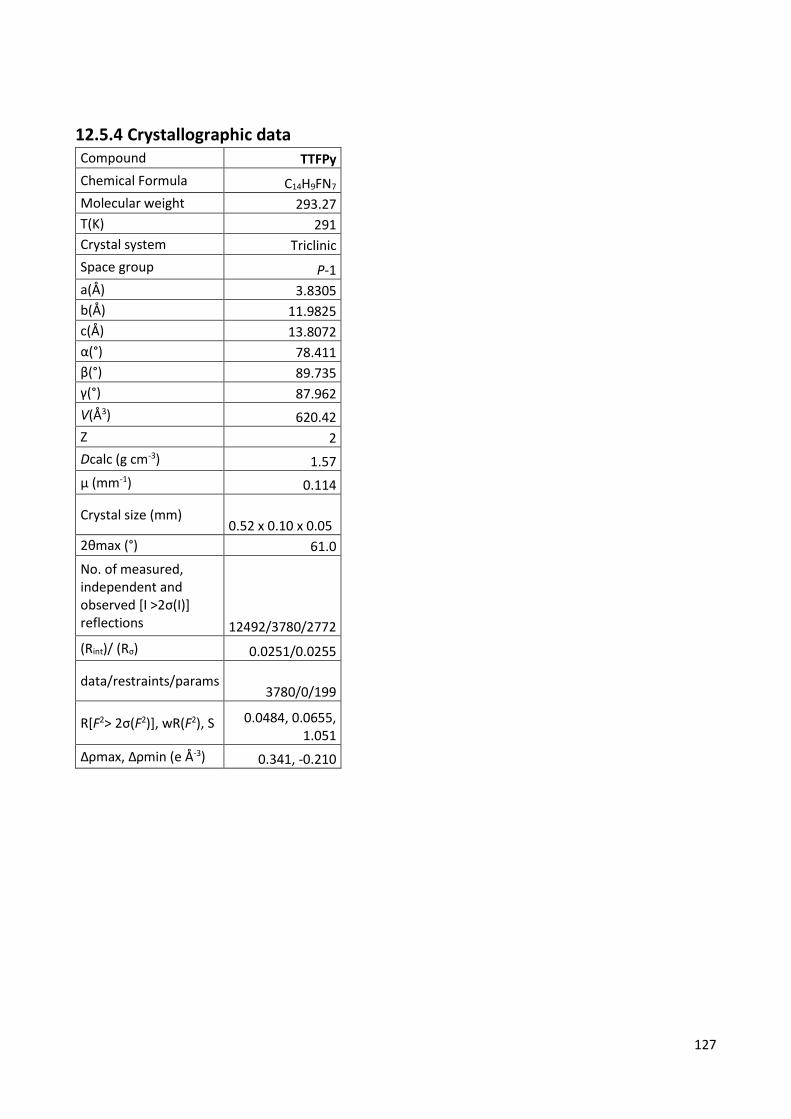
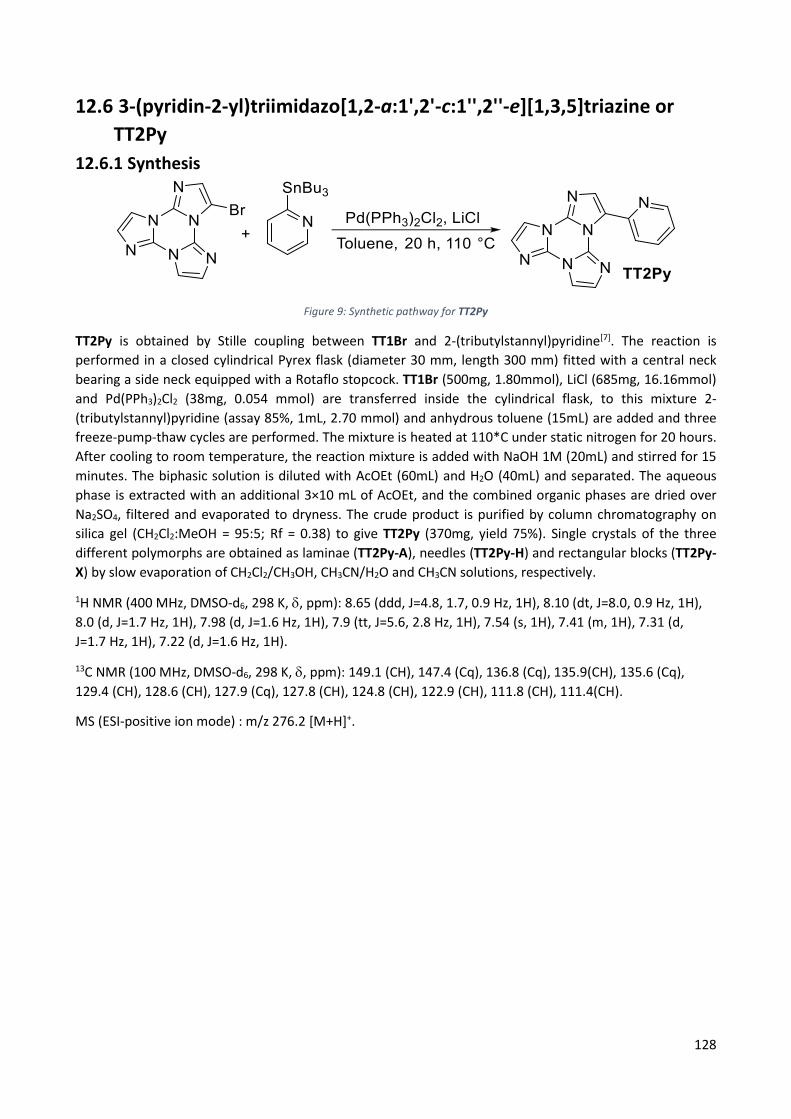
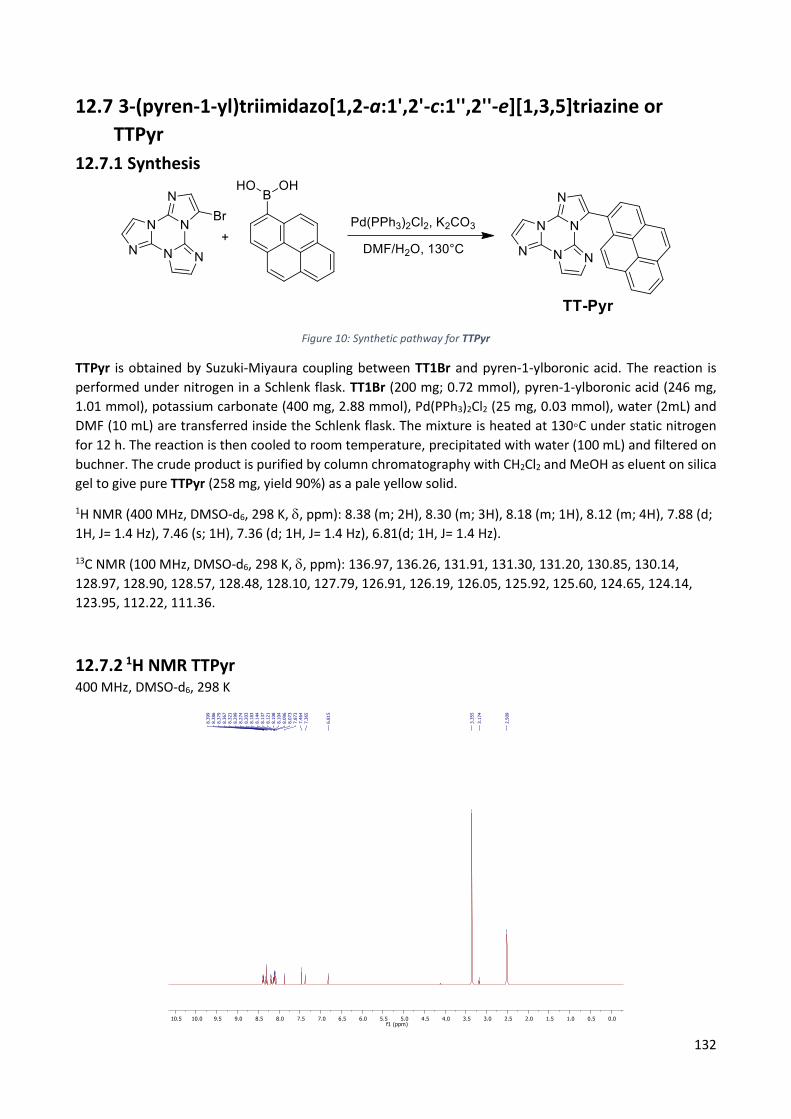
3-(2-fluoropyridin-4-yl)triimidazo[1,2-a:1′,2′-c:1″,2″-e][1,3,5]triazine, TTFPy, containing the 2-fluoropyridine
moiety, has been synthetized by Suzuki-Miyaura coupling between TT1Br and 2-fluoropyridine-4-boronic
acid pinacol ester (See Scheme 1) [16].
Scheme 1: Synthesis of TTFPy.
The compound’s photophysical behavior is markedly different from that of parent TT being, already as a
molecule, quite fluorescent at room temperature and showing additional molecular phosphorescence at 77
K.
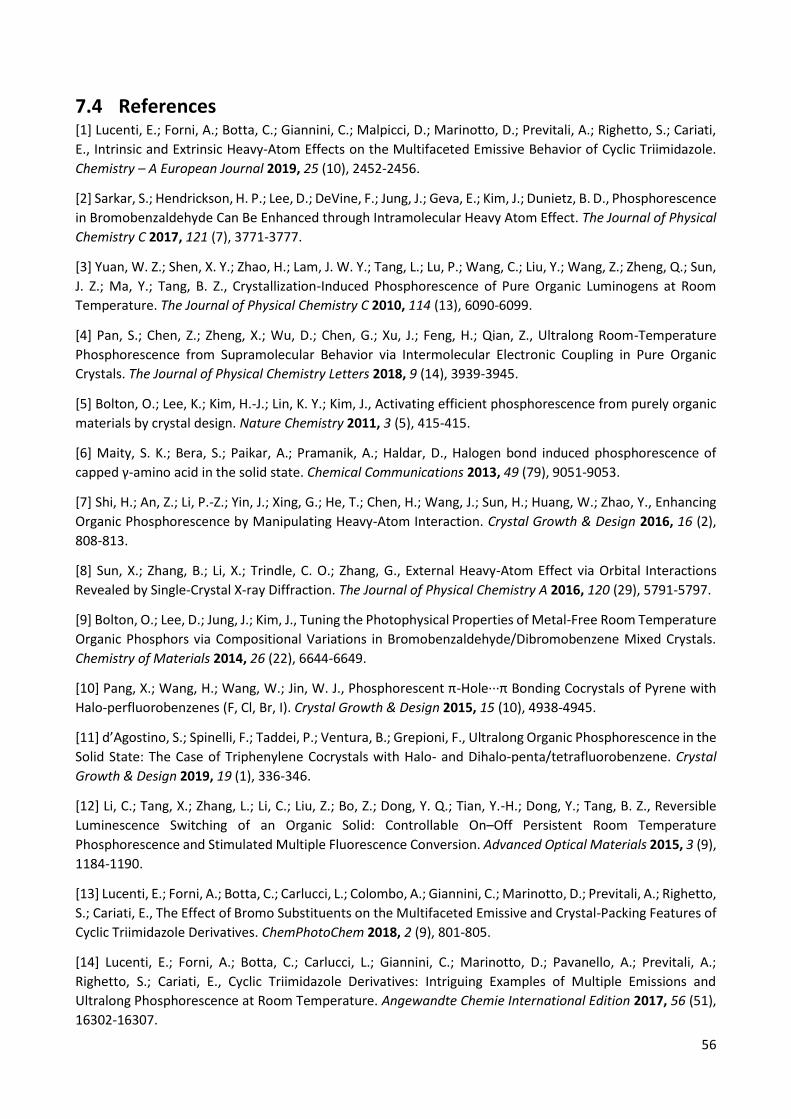
8.2 Photophysical characterization Solutions of TTFPy in CH3CN (10-5 M) display at 298 K absorption maxima at 227 and 291 nm, and an emission
band at 358 nm (Ф = 50 %), corresponding to radiative S1-S0 deactivation (τ = 4.26 ns) (See Figure 1).
Absorption and emission spectra in solvents of different polarity reveal a weak positive solvatochromism for
the low energy band and a negative one for the high energy band (λ = 3 and 17 nm, respectively, from CHCl3
to CH3CN).
59
200 300 400 500 600 700
Em
issio
n In
ten
sity
Abso
rba
nce
Wavelength (nm)
Figure 1: Solution of TTFPy in CH3CN (10−5 M) at 298 K: normalized absorption (black line), emission (λexc = 300 nm, red line) and excitation spectra (λem = 358 nm, blue line). Reproduced from ref.[16] free of charge; https://www.mdpi.com.
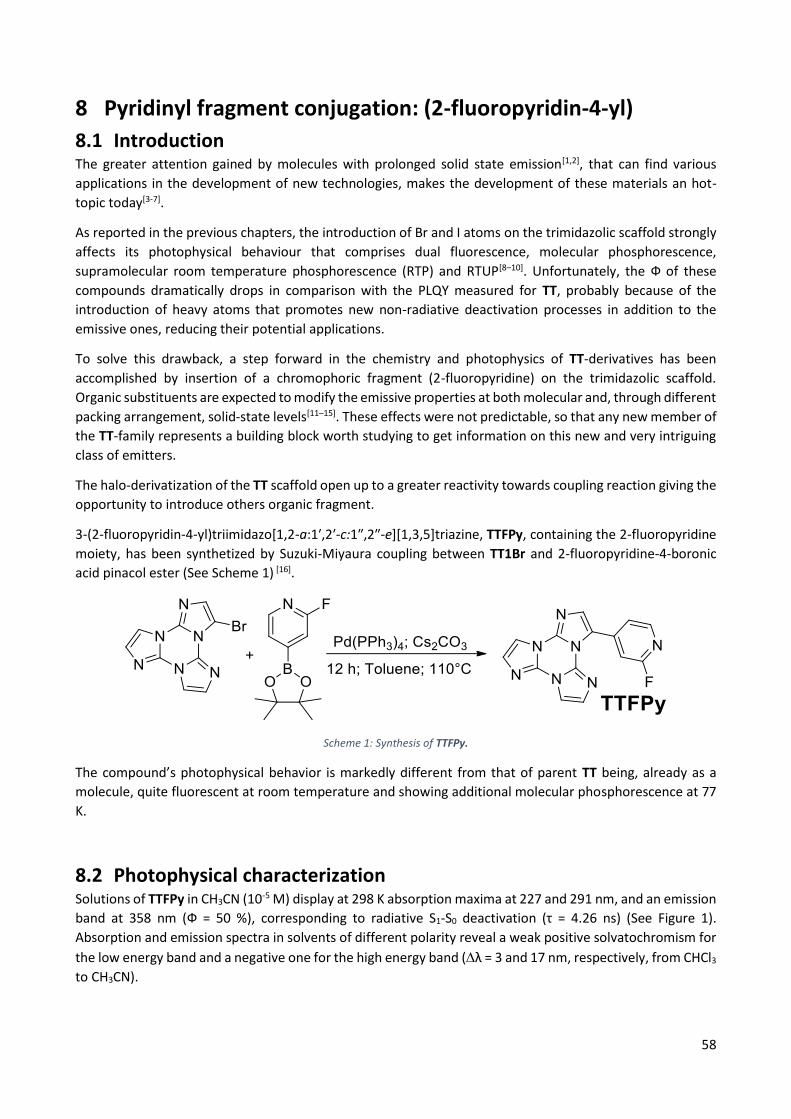
At 77 K, a slight blue shift (344 nm, τav = 4.05 ns) of the fluorescent emission is observed by exciting at 300
nm. Interestingly, at this low temperature, a weak phosphorescent low energy tail appears in the PL spectrum
and can be isolated (454 nm, τav = 1.63 s) from the fluorescent component by selectively populating the T1
level (λexc = 350 nm) (See Figure 2). In this regard, the importance of direct S0-T1 excitation of organic
phosphorescent compounds has been highlighted by Huang and coworkers[17].
300 400 500 600 700 800
Em
issio
n in
ten
sity
Wavelength (nm)
Figure 2: Solution of TTFPy in CH3CN (10−5 M) at 77 K: normalized emission (λexc = 300 nm, black line; λexc = 350 nm, red line) and excitation (λem = 343 nm, black dashed line; λem = 450 nm, red dashed line) spectra. Reproduced from ref.[16] free of charge;
https://www.mdpi.com.
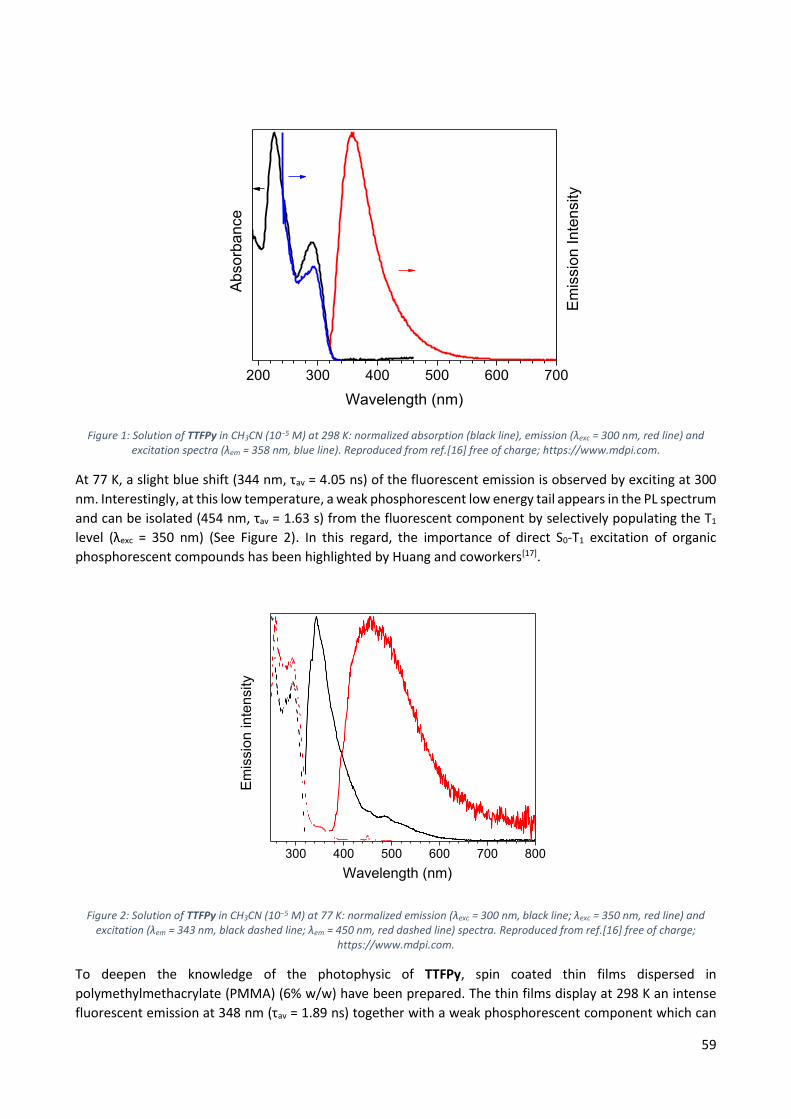
To deepen the knowledge of the photophysic of TTFPy, spin coated thin films dispersed in
polymethylmethacrylate (PMMA) (6% w/w) have been prepared. The thin films display at 298 K an intense
fluorescent emission at 348 nm (τav = 1.89 ns) together with a weak phosphorescent component which can
60
be isolated (415, 436 nm, τav = 3.09 ms) from the fast emission by exciting at low energy (λexc = 360 nm) (See
Figure 3).
250 300 350 400 450 500 550 600
Em
issio
n Inte
nsity
wavelength (nm)
Figure 3: TTFPy:PMMA film (6% w/w loading) at 298 K: normalized emission (λexc = 300 nm, black line; λexc = 360 nm, blue line) and excitation (λem = 348nm, black dashed line; λem = 436 nm, blue dashed line) spectra. Reproduced from ref.[16] free of charge;
https://www.mdpi.com.
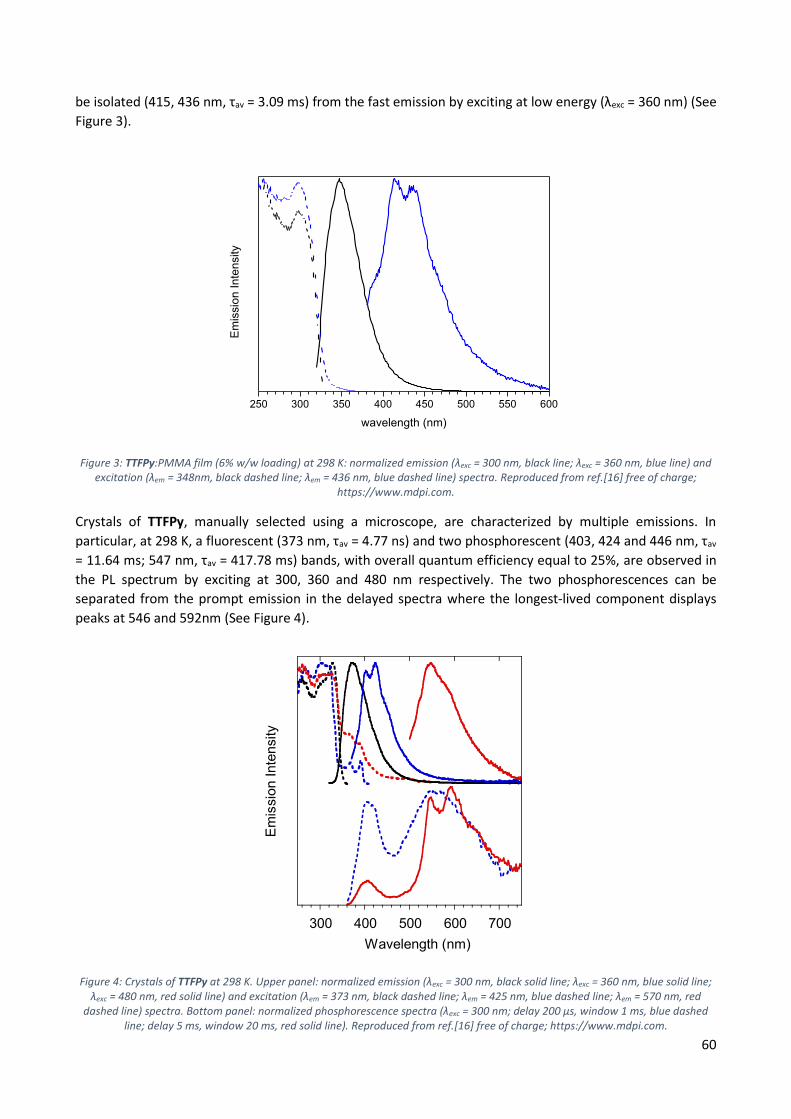
Crystals of TTFPy, manually selected using a microscope, are characterized by multiple emissions. In
particular, at 298 K, a fluorescent (373 nm, τav = 4.77 ns) and two phosphorescent (403, 424 and 446 nm, τav
= 11.64 ms; 547 nm, τav = 417.78 ms) bands, with overall quantum efficiency equal to 25%, are observed in
the PL spectrum by exciting at 300, 360 and 480 nm respectively. The two phosphorescences can be
separated from the prompt emission in the delayed spectra where the longest-lived component displays
peaks at 546 and 592nm (See Figure 4).
Figure 4: Crystals of TTFPy at 298 K. Upper panel: normalized emission (λexc = 300 nm, black solid line; λexc = 360 nm, blue solid line; λexc = 480 nm, red solid line) and excitation (λem = 373 nm, black dashed line; λem = 425 nm, blue dashed line; λem = 570 nm, red
dashed line) spectra. Bottom panel: normalized phosphorescence spectra (λexc = 300 nm; delay 200 μs, window 1 ms, blue dashed line; delay 5 ms, window 20 ms, red solid line). Reproduced from ref.[16] free of charge; https://www.mdpi.com.
300 400 500 600 700
Em
issio
n Inte
nsity
Wavelength (nm)
61
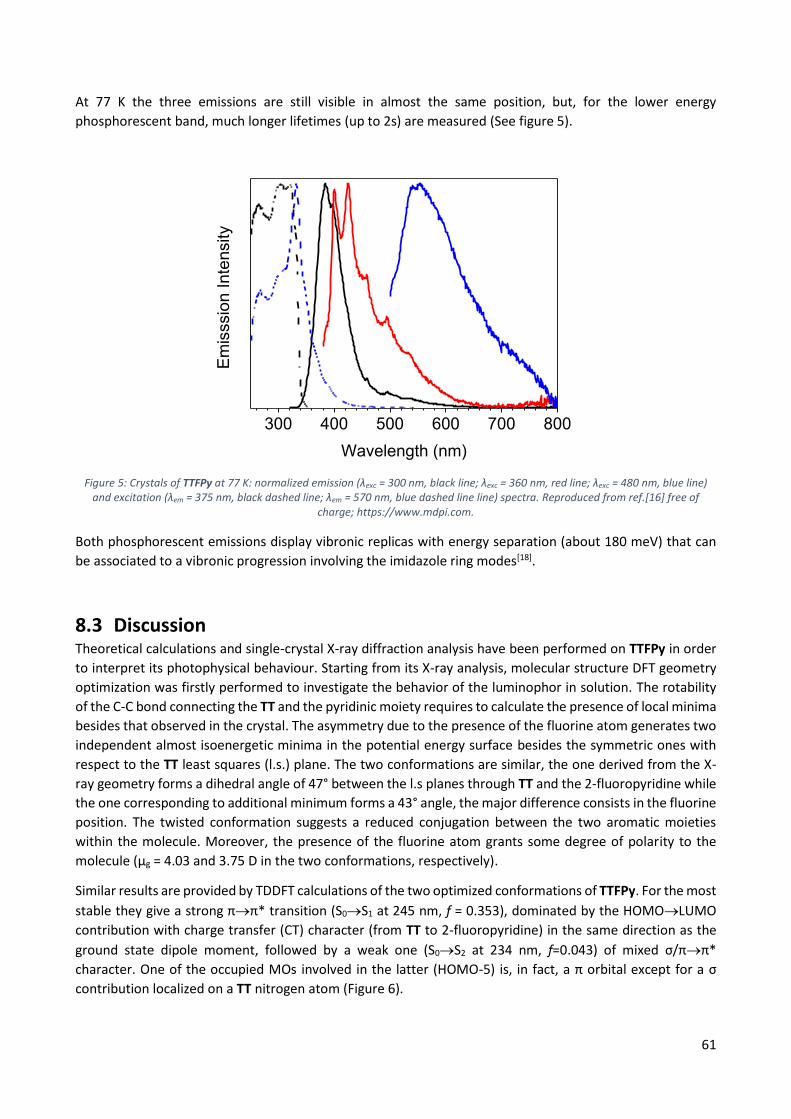
At 77 K the three emissions are still visible in almost the same position, but, for the lower energy
phosphorescent band, much longer lifetimes (up to 2s) are measured (See figure 5).
300 400 500 600 700 800
Em
isssio
n I
nte
nsity
Wavelength (nm)
Figure 5: Crystals of TTFPy at 77 K: normalized emission (λexc = 300 nm, black line; λexc = 360 nm, red line; λexc = 480 nm, blue line) and excitation (λem = 375 nm, black dashed line; λem = 570 nm, blue dashed line line) spectra. Reproduced from ref.[16] free of
charge; https://www.mdpi.com.
Both phosphorescent emissions display vibronic replicas with energy separation (about 180 meV) that can
be associated to a vibronic progression involving the imidazole ring modes[18].
8.3 Discussion Theoretical calculations and single-crystal X-ray diffraction analysis have been performed on TTFPy in order
to interpret its photophysical behaviour. Starting from its X-ray analysis, molecular structure DFT geometry
optimization was firstly performed to investigate the behavior of the luminophor in solution. The rotability
of the C-C bond connecting the TT and the pyridinic moiety requires to calculate the presence of local minima
besides that observed in the crystal. The asymmetry due to the presence of the fluorine atom generates two
independent almost isoenergetic minima in the potential energy surface besides the symmetric ones with
respect to the TT least squares (l.s.) plane. The two conformations are similar, the one derived from the X-
ray geometry forms a dihedral angle of 47° between the l.s planes through TT and the 2-fluoropyridine while
the one corresponding to additional minimum forms a 43° angle, the major difference consists in the fluorine
position. The twisted conformation suggests a reduced conjugation between the two aromatic moieties
within the molecule. Moreover, the presence of the fluorine atom grants some degree of polarity to the
molecule (μg = 4.03 and 3.75 D in the two conformations, respectively).
Similar results are provided by TDDFT calculations of the two optimized conformations of TTFPy. For the most
stable they give a strong π→π* transition (S0→S1 at 245 nm, f = 0.353), dominated by the HOMO→LUMO
contribution with charge transfer (CT) character (from TT to 2-fluoropyridine) in the same direction as the
ground state dipole moment, followed by a weak one (S0→S2 at 234 nm, f=0.043) of mixed σ/π→π*
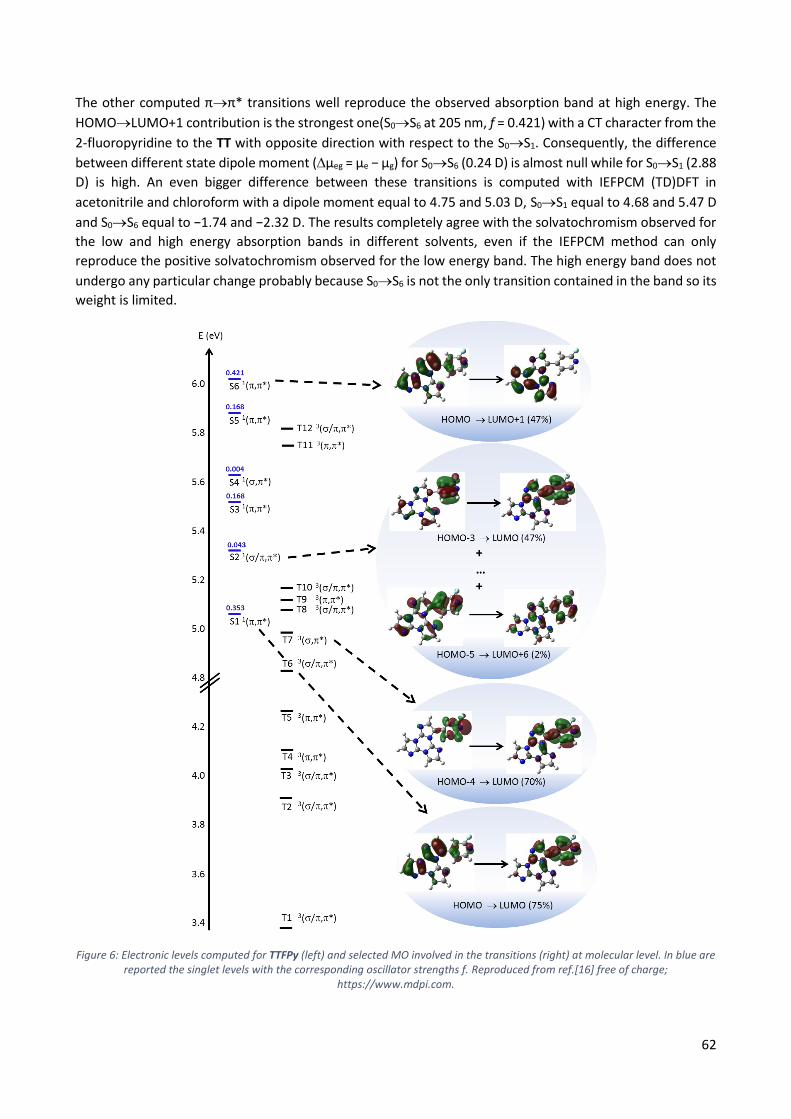
character. One of the occupied MOs involved in the latter (HOMO-5) is, in fact, a π orbital except for a σ
contribution localized on a TT nitrogen atom (Figure 6).
62
The other computed π→π* transitions well reproduce the observed absorption band at high energy. The
HOMO→LUMO+1 contribution is the strongest one(S0→S6 at 205 nm, f = 0.421) with a CT character from the
2-fluoropyridine to the TT with opposite direction with respect to the S0→S1. Consequently, the difference
between different state dipole moment (μeg = μe − μg) for S0→S6 (0.24 D) is almost null while for S0→S1 (2.88
D) is high. An even bigger difference between these transitions is computed with IEFPCM (TD)DFT in
acetonitrile and chloroform with a dipole moment equal to 4.75 and 5.03 D, S0→S1 equal to 4.68 and 5.47 D
and S0→S6 equal to −1.74 and −2.32 D. The results completely agree with the solvatochromism observed for
the low and high energy absorption bands in different solvents, even if the IEFPCM method can only
reproduce the positive solvatochromism observed for the low energy band. The high energy band does not
undergo any particular change probably because S0→S6 is not the only transition contained in the band so its
weight is limited.
Figure 6: Electronic levels computed for TTFPy (left) and selected MO involved in the transitions (right) at molecular level. In blue are reported the singlet levels with the corresponding oscillator strengths f. Reproduced from ref.[16] free of charge;
https://www.mdpi.com.
63
Regarding the emission at 450 nm observed in solution at 77 K, the calculation computed a Tn level (T7 at 250
nm) with (σ,π*) symmetry that can be responsible for a fast ISC from the close S1 (π,π*) level (computed at
245 nm) and the consequent relaxation through IC to T1 from where the phosphorescence is observed. This
explanation is furtherly confirmed by the presence of a similar component at 430 nm in the PMMA film at
RT.
In opposition to the fluorescent emission and the high energy phosphorescence, which can be assigned to
radiative deactivation from molecular S1 and T1 even in the crystal, the nature of the additional
phosphorescence is not clear and cannot be associated with a simple molecular contribution. To disclose the
origin of this radiative process, single-crystal structure must be analysed.
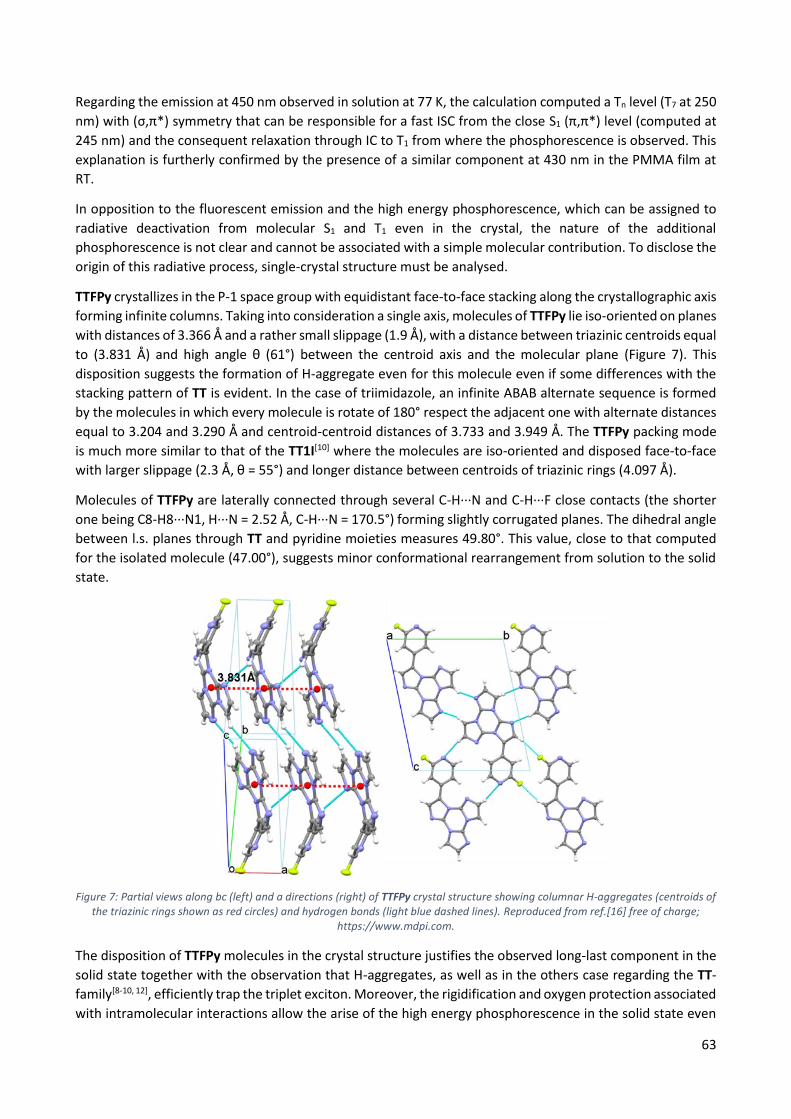
TTFPy crystallizes in the P-1 space group with equidistant face-to-face stacking along the crystallographic axis
forming infinite columns. Taking into consideration a single axis, molecules of TTFPy lie iso-oriented on planes
with distances of 3.366 Å and a rather small slippage (1.9 Å), with a distance between triazinic centroids equal
to (3.831 Å) and high angle θ (61°) between the centroid axis and the molecular plane (Figure 7). This
disposition suggests the formation of H-aggregate even for this molecule even if some differences with the
stacking pattern of TT is evident. In the case of triimidazole, an infinite ABAB alternate sequence is formed
by the molecules in which every molecule is rotate of 180° respect the adjacent one with alternate distances
equal to 3.204 and 3.290 Å and centroid-centroid distances of 3.733 and 3.949 Å. The TTFPy packing mode
is much more similar to that of the TT1I[10] where the molecules are iso-oriented and disposed face-to-face
with larger slippage (2.3 Å, θ = 55°) and longer distance between centroids of triazinic rings (4.097 Å).
Molecules of TTFPy are laterally connected through several C-H···N and C-H···F close contacts (the shorter
one being C8-H8···N1, H···N = 2.52 Å, C-H···N = 170.5°) forming slightly corrugated planes. The dihedral angle
between l.s. planes through TT and pyridine moieties measures 49.80°. This value, close to that computed
for the isolated molecule (47.00°), suggests minor conformational rearrangement from solution to the solid
state.
Figure 7: Partial views along bc (left) and a directions (right) of TTFPy crystal structure showing columnar H-aggregates (centroids of the triazinic rings shown as red circles) and hydrogen bonds (light blue dashed lines). Reproduced from ref.[16] free of charge;
https://www.mdpi.com.
The disposition of TTFPy molecules in the crystal structure justifies the observed long-last component in the
solid state together with the observation that H-aggregates, as well as in the others case regarding the TT-
family[8-10, 12], efficiently trap the triplet exciton. Moreover, the rigidification and oxygen protection associated
with intramolecular interactions allow the arise of the high energy phosphorescence in the solid state even
64
at RT. In perfect agreement, the same effect is observed in the PMMA blend where the rigidification provided
by the polymeric matric allows the arise of the high energy component, while the low energy one is absent
due to the lack of H-aggregates.
8.4 Conclusion The TTFPy derivative represents the first attempt to conjugate TT with another aromatic structure in order
to tune its photophysical behaviour. Despite the presence of an additional 2-fluoropyridinic fragment the
formation of H-aggregates motifs is not prevented but the strength of the interchromophoric π-π interactions
is decreased and consequently the associated phosphorescence decay time becomes shorter. However, the
presence of the fluoropyridinyl moiety strongly enhances the solution emissive properties and contributes in
the arise of an additional molecular phosphorescence. These promising results obtained with this first
conjugation attempt open up to further modification with different fragments.
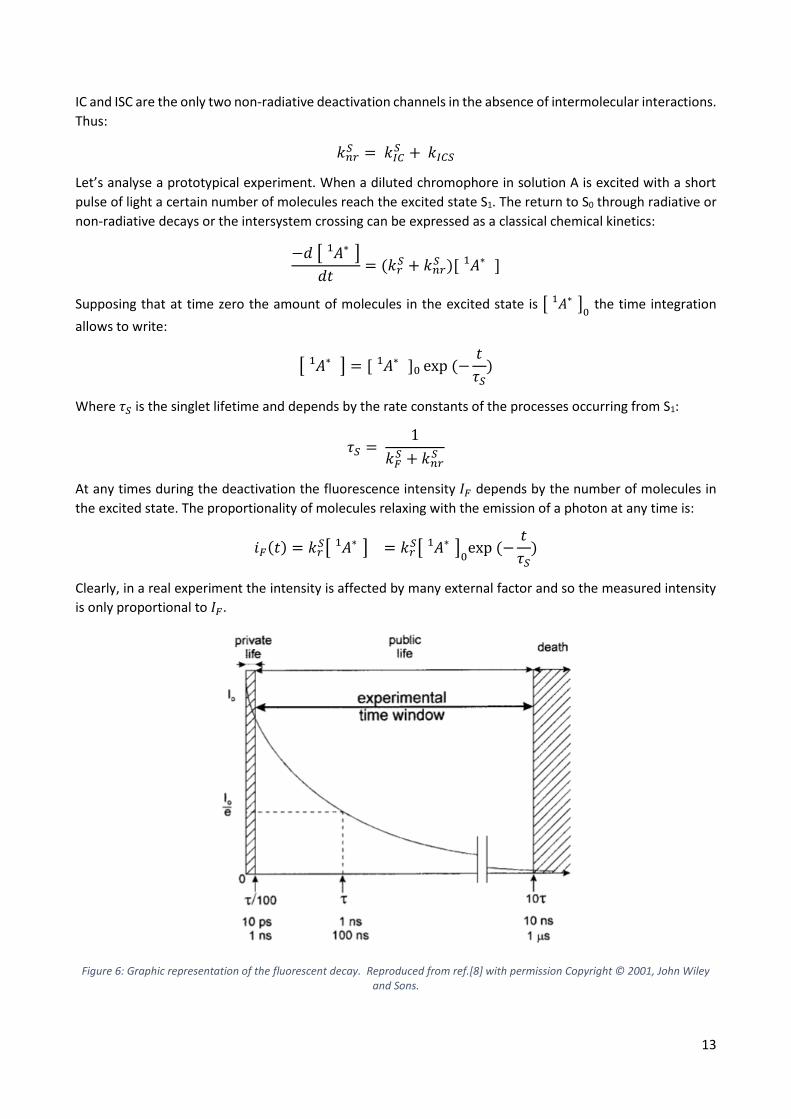
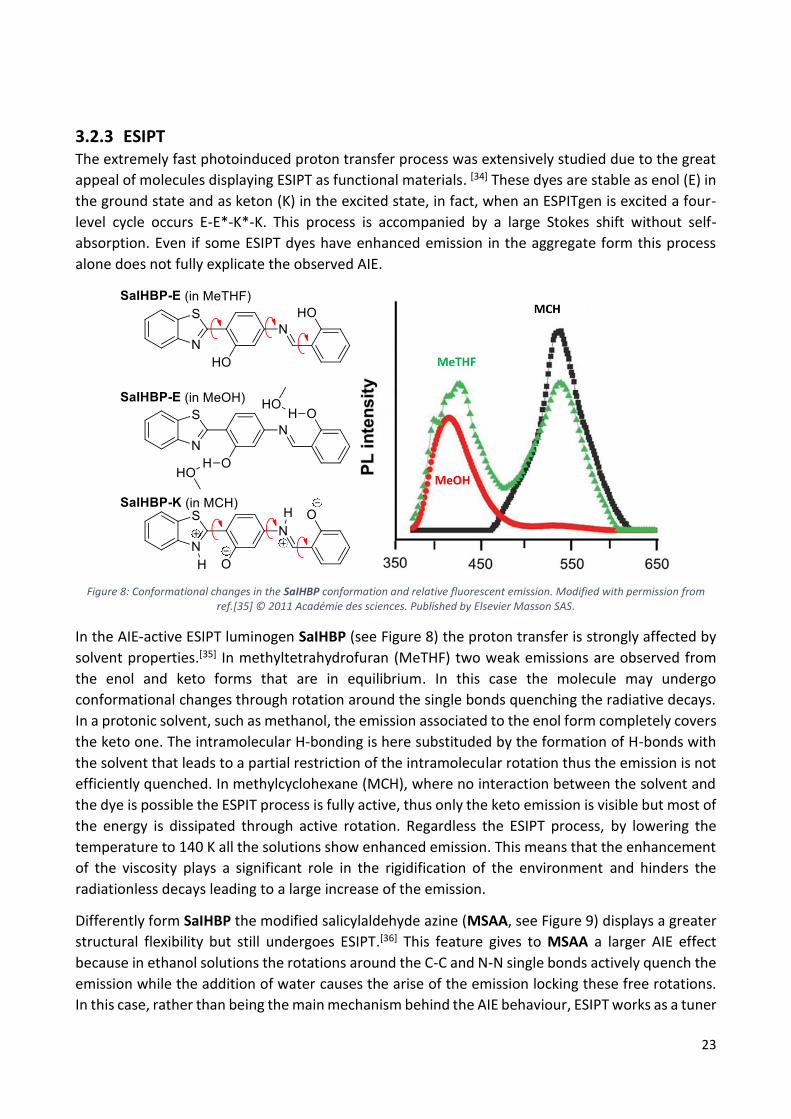
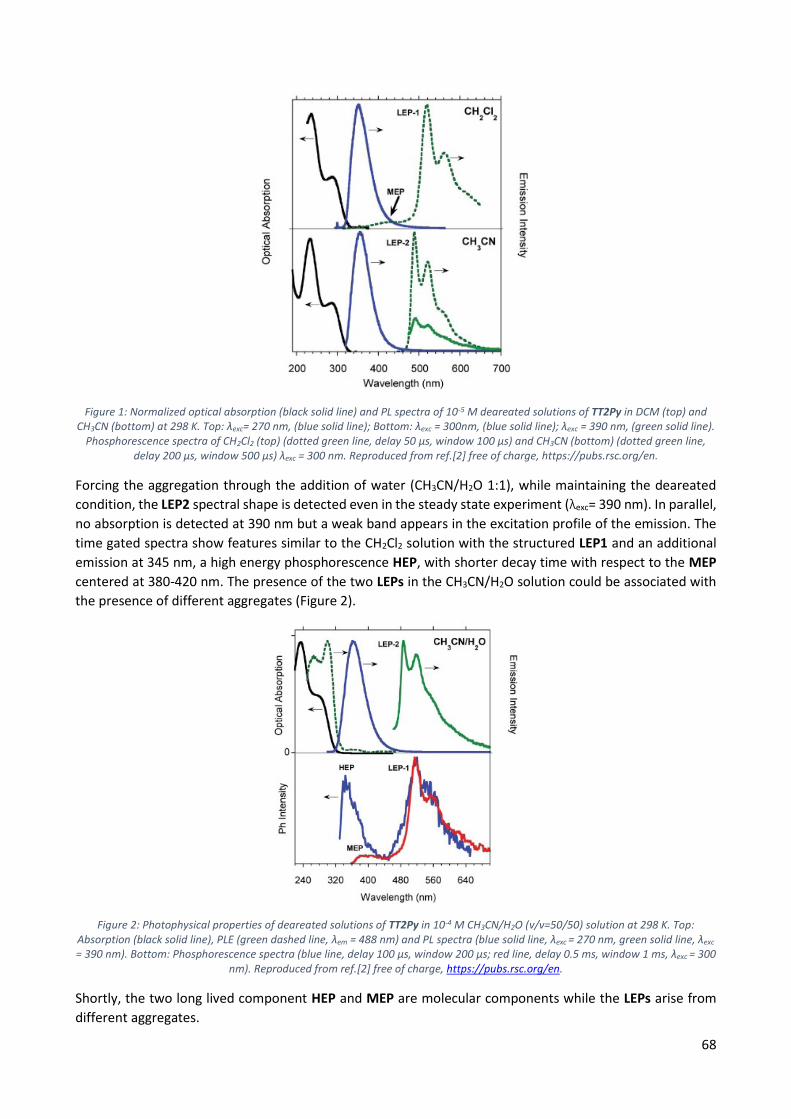
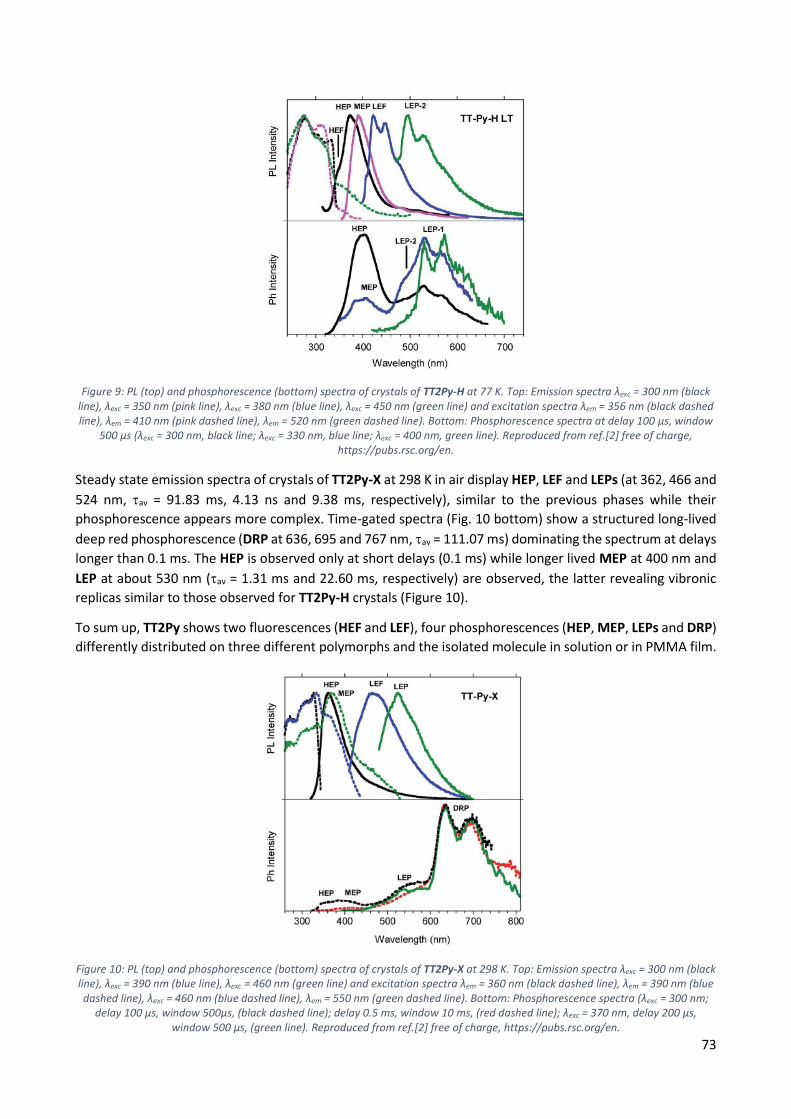
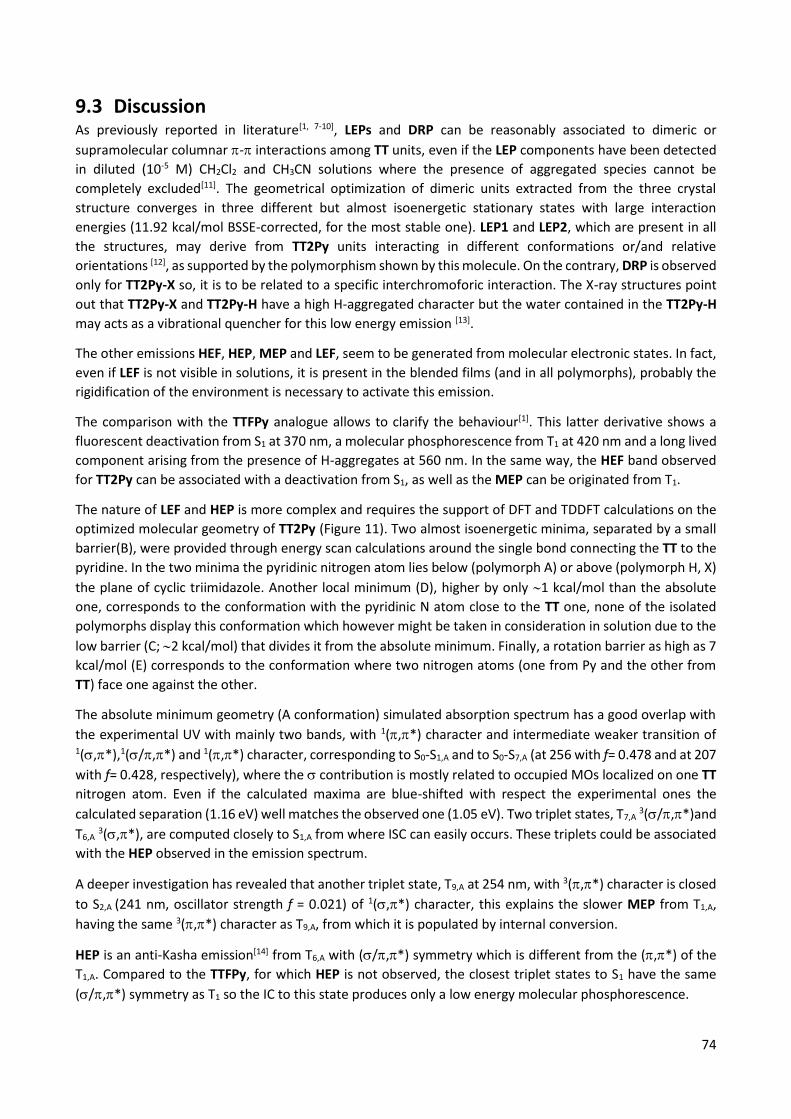
λexc = 390 nm, green line, 45 min; λem = 527 nm, green dotted line, 45 min). Reproduced from ref.[2] free of charge, https://pubs.rsc.org/en.
70
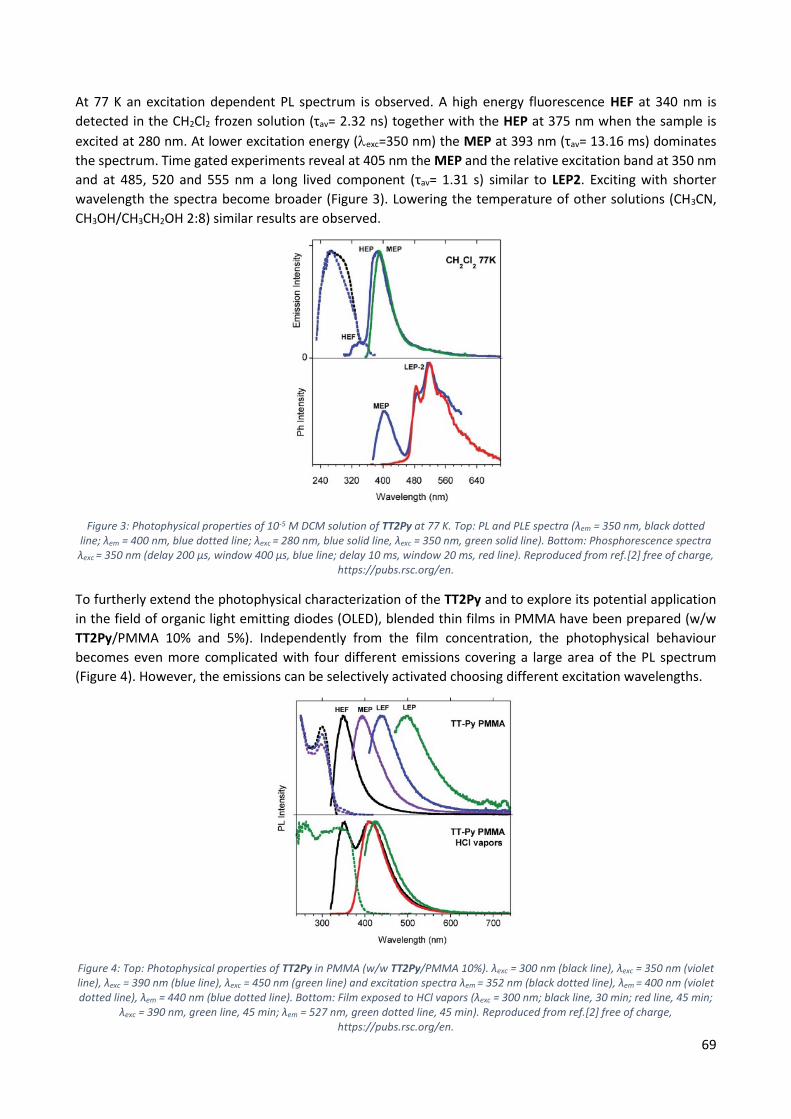
With high energy excitations (below 300 nm) the spectrum is dominated by an intense fluorescence HEF ( =
1.18 ns) at 350 nm. The MEP is observed at 395 nm (av = 13.73 ms) when the sample is excited at 350 nm
while, at 390 nm, a second fluorescence band appears at 440 nm (av = 3.47 ns, low energy fluorescence,
LEF). Unresolved LEPs at 530 nm, already observed in solution, are activated by exciting at 450 nm (Figure 4).
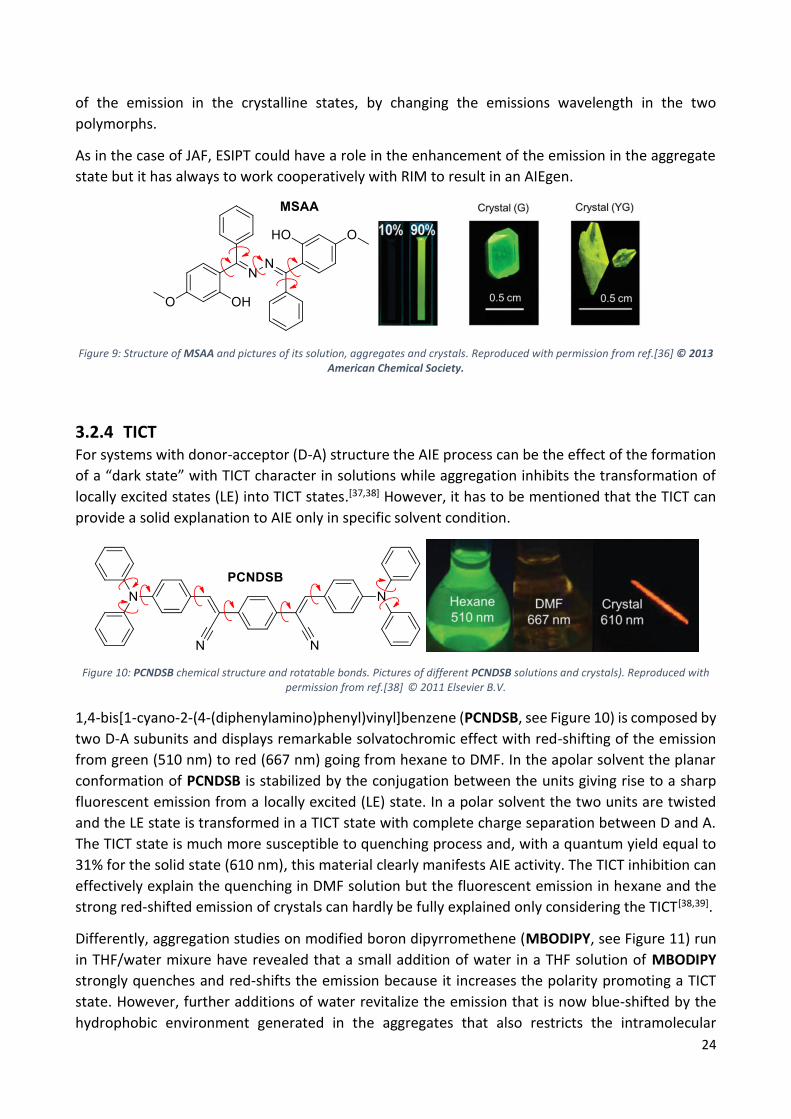
To better understand the articulated behaviour of TT2Py (w/w TT2Py/PMMA 10%) films, ultrafast pump-
probe experiments have been performed.
The measured signal is:
Δ𝑇(𝜆𝑃𝑅 , 𝜏)
𝑇=
𝑇𝑂𝑁(𝜆𝑃𝑅, 𝜏) − 𝑇𝑂𝐹𝐹(𝜆𝑃𝑅 , 𝜏)
𝑇𝑂𝐹𝐹(𝜆𝑃𝑅 , 𝜏)
where TON and TOFF are the probe transmission intensities with and without pump excitation at a given λPR
and τ probe delay. A positive ΔT/T signal corresponds to the bleaching of the ground state or stimulated
emission (SE) from excited states, while a negative signal indicates the presence of a photoinduced
absorption (PIA) band [3].
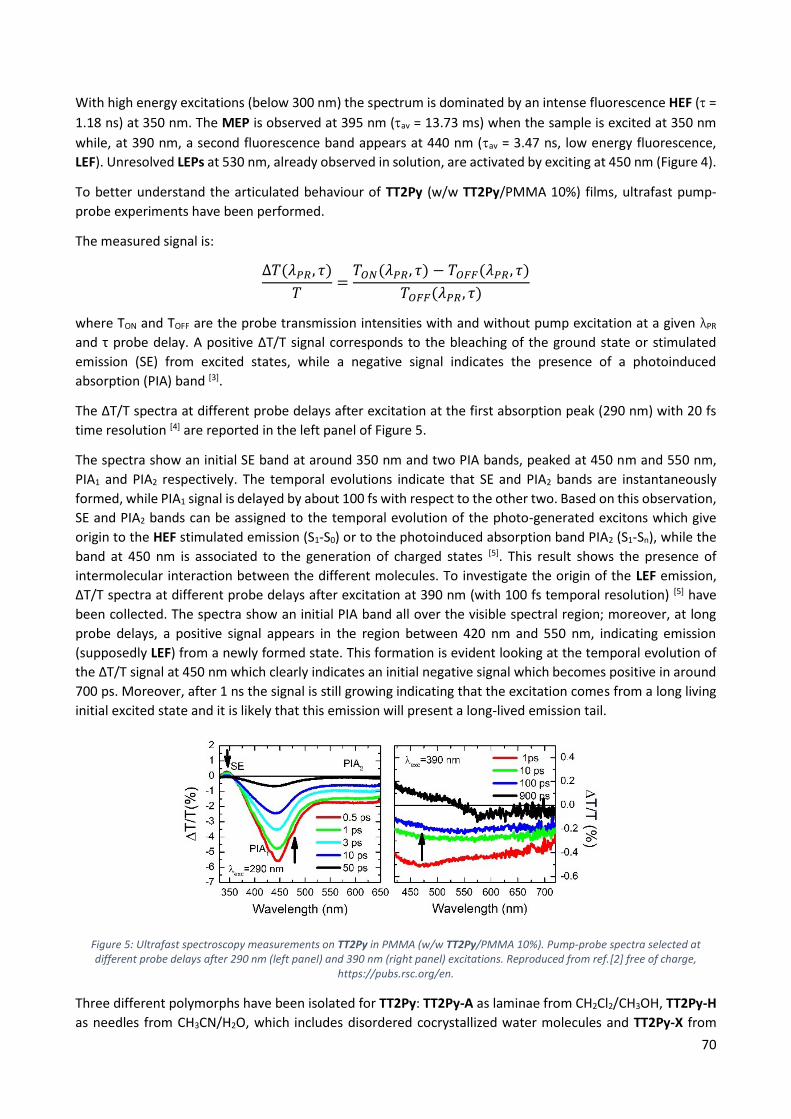
The ΔT/T spectra at different probe delays after excitation at the first absorption peak (290 nm) with 20 fs
time resolution [4] are reported in the left panel of Figure 5.
The spectra show an initial SE band at around 350 nm and two PIA bands, peaked at 450 nm and 550 nm,
PIA1 and PIA2 respectively. The temporal evolutions indicate that SE and PIA2 bands are instantaneously
formed, while PIA1 signal is delayed by about 100 fs with respect to the other two. Based on this observation,
SE and PIA2 bands can be assigned to the temporal evolution of the photo-generated excitons which give
origin to the HEF stimulated emission (S1-S0) or to the photoinduced absorption band PIA2 (S1-Sn), while the
band at 450 nm is associated to the generation of charged states [5]. This result shows the presence of
intermolecular interaction between the different molecules. To investigate the origin of the LEF emission,
ΔT/T spectra at different probe delays after excitation at 390 nm (with 100 fs temporal resolution) [5] have
been collected. The spectra show an initial PIA band all over the visible spectral region; moreover, at long
probe delays, a positive signal appears in the region between 420 nm and 550 nm, indicating emission
(supposedly LEF) from a newly formed state. This formation is evident looking at the temporal evolution of
the ΔT/T signal at 450 nm which clearly indicates an initial negative signal which becomes positive in around
700 ps. Moreover, after 1 ns the signal is still growing indicating that the excitation comes from a long living
initial excited state and it is likely that this emission will present a long-lived emission tail.
Figure 5: Ultrafast spectroscopy measurements on TT2Py in PMMA (w/w TT2Py/PMMA 10%). Pump-probe spectra selected at different probe delays after 290 nm (left panel) and 390 nm (right panel) excitations. Reproduced from ref.[2] free of charge,
https://pubs.rsc.org/en.
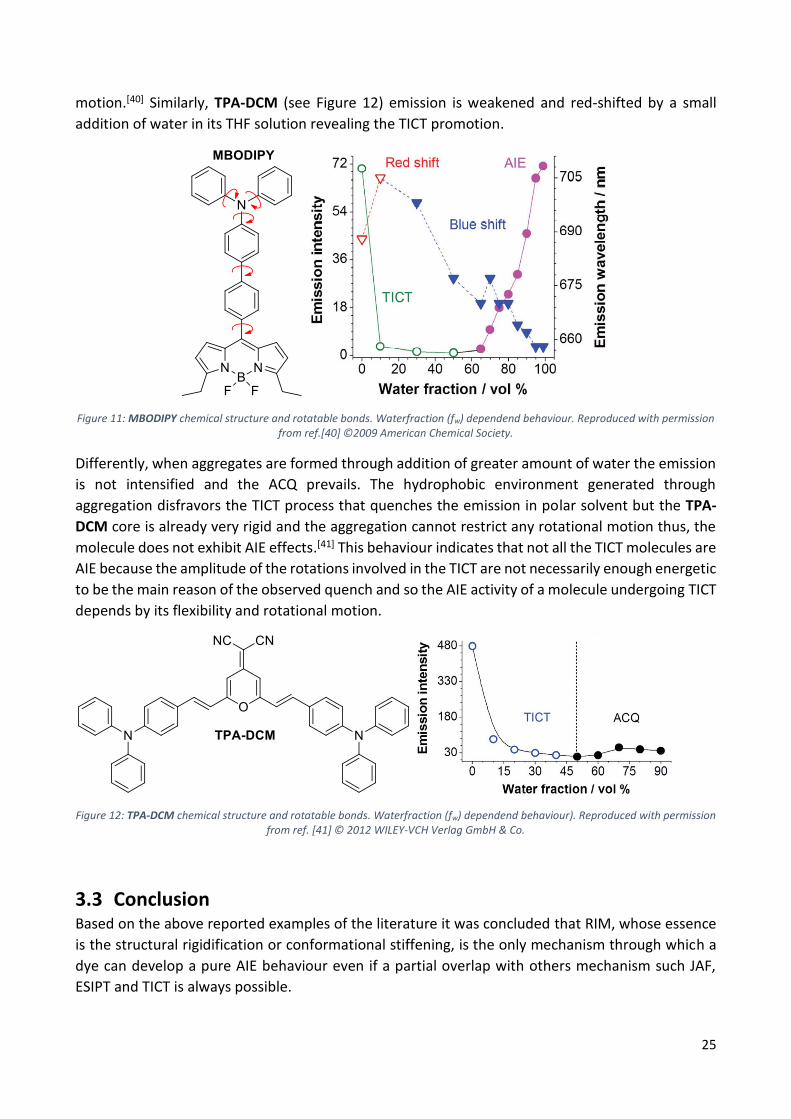
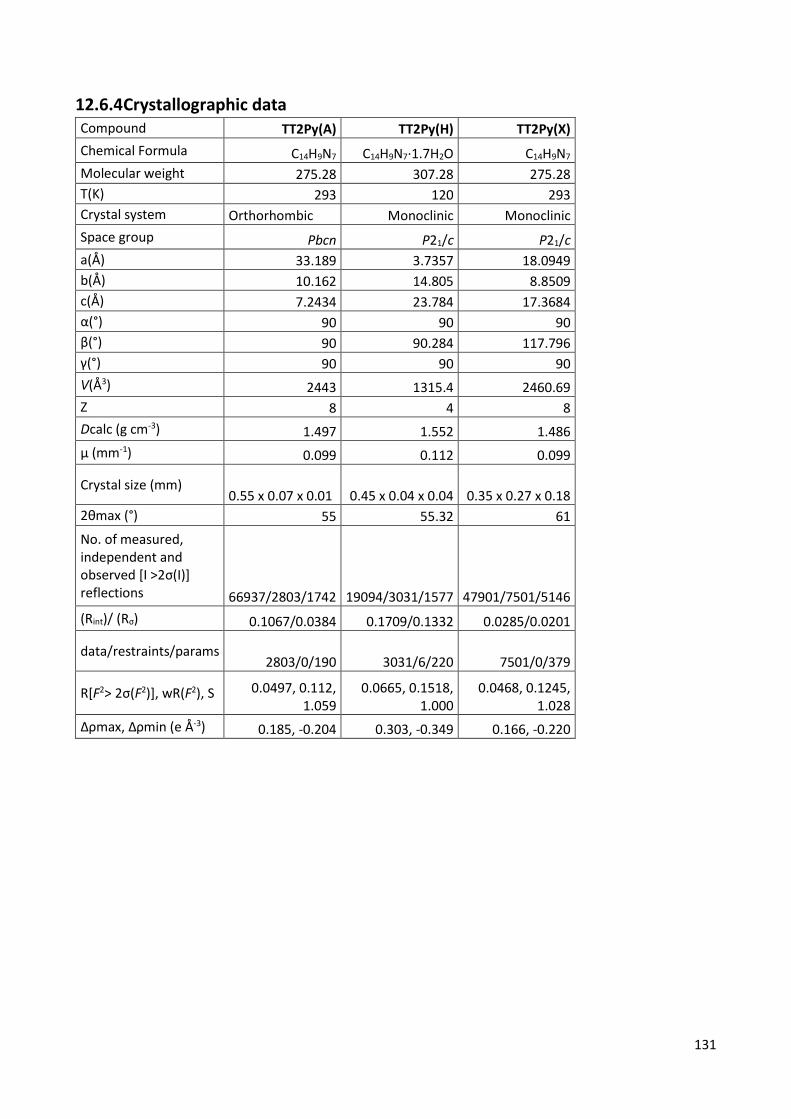
Three different polymorphs have been isolated for TT2Py: TT2Py-A as laminae from CH2Cl2/CH3OH, TT2Py-H
as needles from CH3CN/H2O, which includes disordered cocrystallized water molecules and TT2Py-X from
71
CH3CN. All the three polymorphs show the typical stacking already observed in cyclic triimidazole and
its already investigated derivatives[1, 7-10] (Figure 6). Before any photophysical measurements crystals of each
phase were manually selected using a microscope in order to avoid the presence of more than one phase.
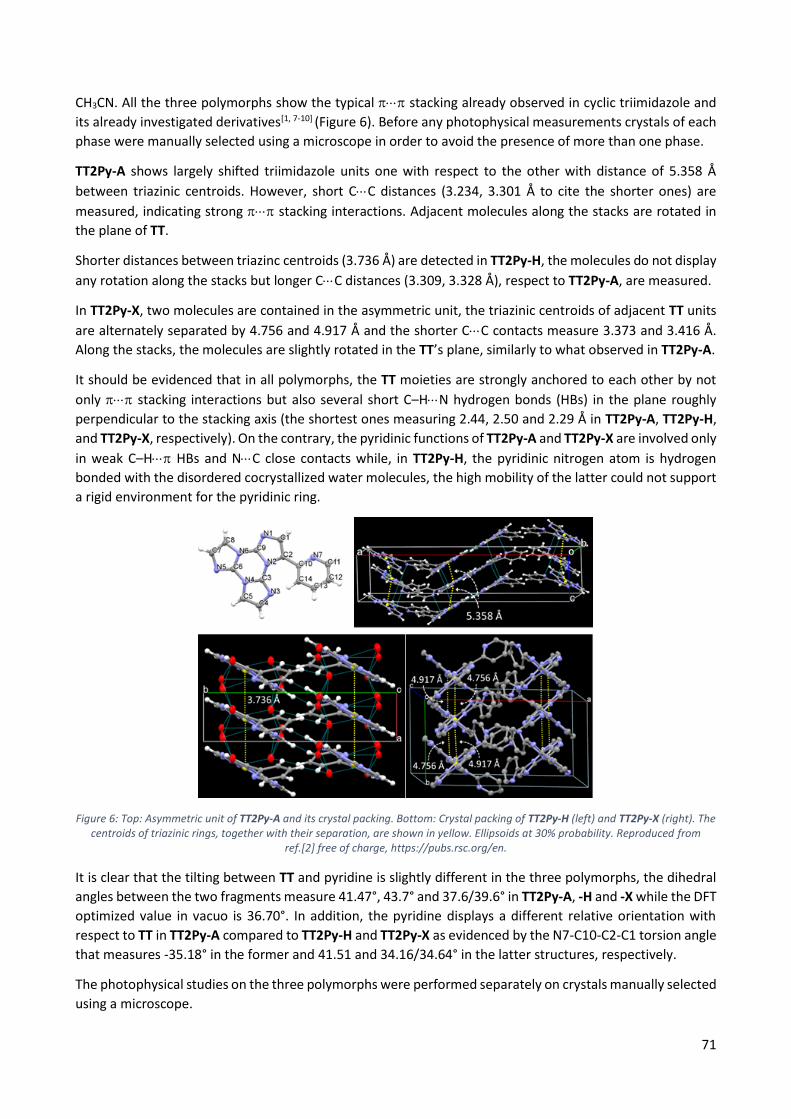
TT2Py-A shows largely shifted triimidazole units one with respect to the other with distance of 5.358 Å
between triazinic centroids. However, short CC distances (3.234, 3.301 Å to cite the shorter ones) are
measured, indicating strong stacking interactions. Adjacent molecules along the stacks are rotated in
the plane of TT.
Shorter distances between triazinc centroids (3.736 Å) are detected in TT2Py-H, the molecules do not display
any rotation along the stacks but longer CC distances (3.309, 3.328 Å), respect to TT2Py-A, are measured.
In TT2Py-X, two molecules are contained in the asymmetric unit, the triazinic centroids of adjacent TT units
are alternately separated by 4.756 and 4.917 Å and the shorter CC contacts measure 3.373 and 3.416 Å.
Along the stacks, the molecules are slightly rotated in the TT’s plane, similarly to what observed in TT2Py-A.
It should be evidenced that in all polymorphs, the TT moieties are strongly anchored to each other by not
only stacking interactions but also several short C–HN hydrogen bonds (HBs) in the plane roughly
perpendicular to the stacking axis (the shortest ones measuring 2.44, 2.50 and 2.29 Å in TT2Py-A, TT2Py-H,
and TT2Py-X, respectively). On the contrary, the pyridinic functions of TT2Py-A and TT2Py-X are involved only
in weak C–H HBs and NC close contacts while, in TT2Py-H, the pyridinic nitrogen atom is hydrogen
bonded with the disordered cocrystallized water molecules, the high mobility of the latter could not support
a rigid environment for the pyridinic ring.
Figure 6: Top: Asymmetric unit of TT2Py-A and its crystal packing. Bottom: Crystal packing of TT2Py-H (left) and TT2Py-X (right). The centroids of triazinic rings, together with their separation, are shown in yellow. Ellipsoids at 30% probability. Reproduced from
ref.[2] free of charge, https://pubs.rsc.org/en.
It is clear that the tilting between TT and pyridine is slightly different in the three polymorphs, the dihedral
angles between the two fragments measure 41.47°, 43.7° and 37.6/39.6° in TT2Py-A, -H and -X while the DFT
optimized value in vacuo is 36.70°. In addition, the pyridine displays a different relative orientation with
respect to TT in TT2Py-A compared to TT2Py-H and TT2Py-X as evidenced by the N7-C10-C2-C1 torsion angle
that measures -35.18° in the former and 41.51 and 34.16/34.64° in the latter structures, respectively.
The photophysical studies on the three polymorphs were performed separately on crystals manually selected
using a microscope.
72
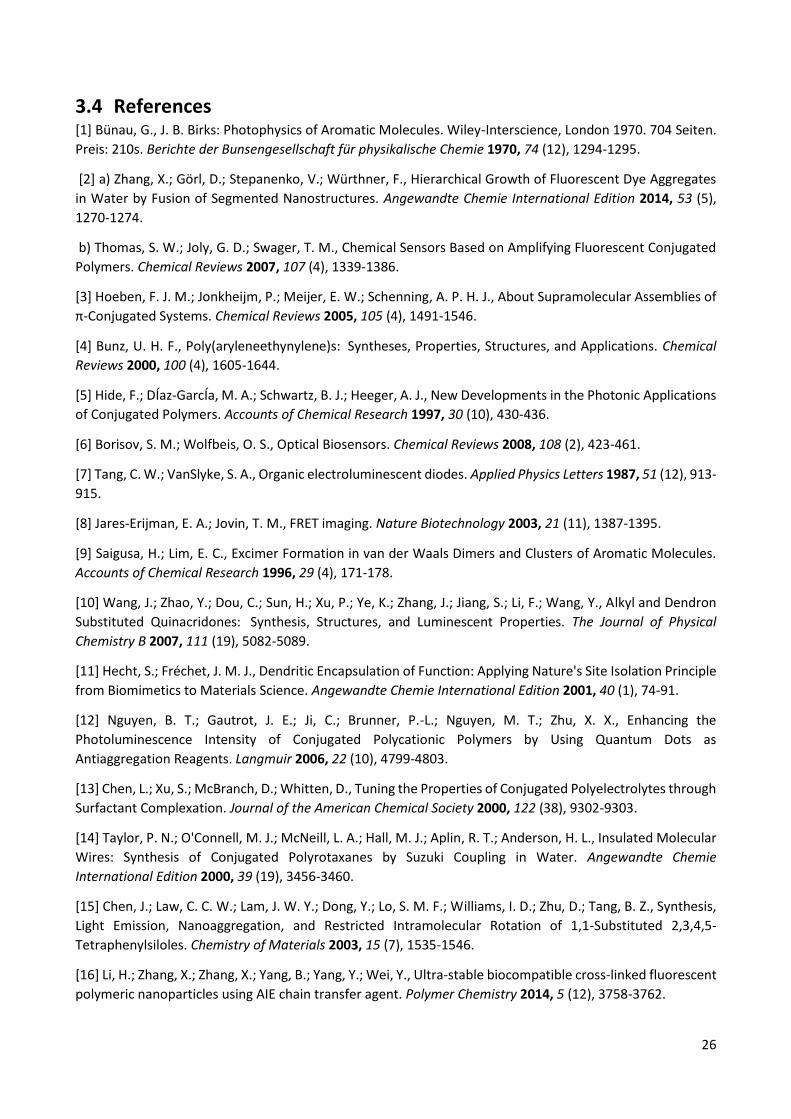
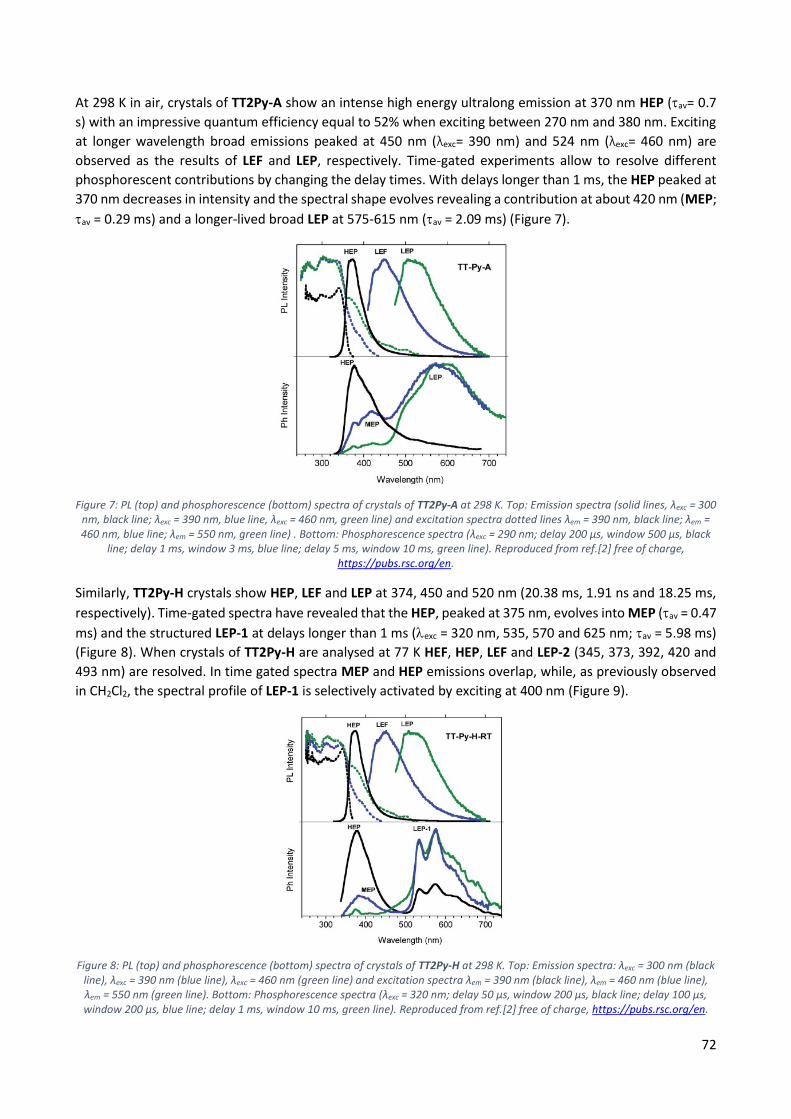
At 298 K in air, crystals of TT2Py-A show an intense high energy ultralong emission at 370 nm HEP (av= 0.7
s) with an impressive quantum efficiency equal to 52% when exciting between 270 nm and 380 nm. Exciting
at longer wavelength broad emissions peaked at 450 nm (λexc= 390 nm) and 524 nm (λexc= 460 nm) are
observed as the results of LEF and LEP, respectively. Time-gated experiments allow to resolve different
phosphorescent contributions by changing the delay times. With delays longer than 1 ms, the HEP peaked at
370 nm decreases in intensity and the spectral shape evolves revealing a contribution at about 420 nm (MEP;
av = 0.29 ms) and a longer-lived broad LEP at 575-615 nm (av = 2.09 ms) (Figure 7).
Figure 7: PL (top) and phosphorescence (bottom) spectra of crystals of TT2Py-A at 298 K. Top: Emission spectra (solid lines, λexc = 300 nm, black line; λexc = 390 nm, blue line, λexc = 460 nm, green line) and excitation spectra dotted lines λem = 390 nm, black line; λem = 460 nm, blue line; λem = 550 nm, green line) . Bottom: Phosphorescence spectra (λexc = 290 nm; delay 200 μs, window 500 μs, black
line; delay 1 ms, window 3 ms, blue line; delay 5 ms, window 10 ms, green line). Reproduced from ref.[2] free of charge, https://pubs.rsc.org/en.
Similarly, TT2Py-H crystals show HEP, LEF and LEP at 374, 450 and 520 nm (20.38 ms, 1.91 ns and 18.25 ms,
respectively). Time-gated spectra have revealed that the HEP, peaked at 375 nm, evolves into MEP (av = 0.47
ms) and the structured LEP-1 at delays longer than 1 ms (exc = 320 nm, 535, 570 and 625 nm; av = 5.98 ms)
(Figure 8). When crystals of TT2Py-H are analysed at 77 K HEF, HEP, LEF and LEP-2 (345, 373, 392, 420 and
493 nm) are resolved. In time gated spectra MEP and HEP emissions overlap, while, as previously observed
in CH2Cl2, the spectral profile of LEP-1 is selectively activated by exciting at 400 nm (Figure 9).
Figure 8: PL (top) and phosphorescence (bottom) spectra of crystals of TT2Py-H at 298 K. Top: Emission spectra: λexc = 300 nm (black line), λexc = 390 nm (blue line), λexc = 460 nm (green line) and excitation spectra λem = 390 nm (black line), λem = 460 nm (blue line), λem = 550 nm (green line). Bottom: Phosphorescence spectra (λexc = 320 nm; delay 50 μs, window 200 μs, black line; delay 100 μs, window 200 μs, blue line; delay 1 ms, window 10 ms, green line). Reproduced from ref.[2] free of charge, https://pubs.rsc.org/en.
9.3 Discussion As previously reported in literature[1, 7-10], LEPs and DRP can be reasonably associated to dimeric or
supramolecular columnar - interactions among TT units, even if the LEP components have been detected
in diluted (10-5 M) CH2Cl2 and CH3CN solutions where the presence of aggregated species cannot be
completely excluded[11]. The geometrical optimization of dimeric units extracted from the three crystal
structure converges in three different but almost isoenergetic stationary states with large interaction
energies (11.92 kcal/mol BSSE-corrected, for the most stable one). LEP1 and LEP2, which are present in all
the structures, may derive from TT2Py units interacting in different conformations or/and relative
orientations [12], as supported by the polymorphism shown by this molecule. On the contrary, DRP is observed
only for TT2Py-X so, it is to be related to a specific interchromoforic interaction. The X-ray structures point
out that TT2Py-X and TT2Py-H have a high H-aggregated character but the water contained in the TT2Py-H
may acts as a vibrational quencher for this low energy emission [13].
The other emissions HEF, HEP, MEP and LEF, seem to be generated from molecular electronic states. In fact,
even if LEF is not visible in solutions, it is present in the blended films (and in all polymorphs), probably the
rigidification of the environment is necessary to activate this emission.
The comparison with the TTFPy analogue allows to clarify the behaviour[1]. This latter derivative shows a
fluorescent deactivation from S1 at 370 nm, a molecular phosphorescence from T1 at 420 nm and a long lived
component arising from the presence of H-aggregates at 560 nm. In the same way, the HEF band observed
for TT2Py can be associated with a deactivation from S1, as well as the MEP can be originated from T1.
The nature of LEF and HEP is more complex and requires the support of DFT and TDDFT calculations on the
optimized molecular geometry of TT2Py (Figure 11). Two almost isoenergetic minima, separated by a small
barrier(B), were provided through energy scan calculations around the single bond connecting the TT to the
pyridine. In the two minima the pyridinic nitrogen atom lies below (polymorph A) or above (polymorph H, X)
the plane of cyclic triimidazole. Another local minimum (D), higher by only 1 kcal/mol than the absolute
one, corresponds to the conformation with the pyridinic N atom close to the TT one, none of the isolated
polymorphs display this conformation which however might be taken in consideration in solution due to the
low barrier (C; 2 kcal/mol) that divides it from the absolute minimum. Finally, a rotation barrier as high as 7
kcal/mol (E) corresponds to the conformation where two nitrogen atoms (one from Py and the other from
TT) face one against the other.
The absolute minimum geometry (A conformation) simulated absorption spectrum has a good overlap with
the experimental UV with mainly two bands, with 1(,*) character and intermediate weaker transition of 1(,*),1(/,*) and 1(,*) character, corresponding to S0-S1,A and to S0-S7,A (at 256 with f= 0.478 and at 207
with f= 0.428, respectively), where the contribution is mostly related to occupied MOs localized on one TT
nitrogen atom. Even if the calculated maxima are blue-shifted with respect the experimental ones the
calculated separation (1.16 eV) well matches the observed one (1.05 eV). Two triplet states, T7,A 3(/,*)and
T6,A 3(,*), are computed closely to S1,A from where ISC can easily occurs. These triplets could be associated
with the HEP observed in the emission spectrum.
A deeper investigation has revealed that another triplet state, T9,A at 254 nm, with 3(,*) character is closed
to S2,A (241 nm, oscillator strength f = 0.021) of 1(,*) character, this explains the slower MEP from T1,A,
having the same 3(,*) character as T9,A, from which it is populated by internal conversion.
HEP is an anti-Kasha emission[14] from T6,A with (/,*) symmetry which is different from the (,*) of the
T1,A. Compared to the TTFPy, for which HEP is not observed, the closest triplet states to S1 have the same
(/,*) symmetry as T1 so the IC to this state produces only a low energy molecular phosphorescence.
75
Figure 11: Scan of the relaxed potential energy surface of the S1 and S0 states of TT2Py along the N7-C10-C2-C1 torsion angle, , at
the (TD)-B97X/6-311++G(d,p) level of theory. Energies are relative to the S0 state equilibrium geometry. A, H and X refer to the optimized molecular structures of TT2Py-A, -H, and -X, respectively. B, C, D and E denote the other stationary states. Reproduced
from ref.[2] free of charge, https://pubs.rsc.org/en.
The geometrical optimization of S1,A of (,*) with (,*) leads to a planar conformation which corresponds
to the B geometry of the ground state at only slightly lower energy with respect to the Franck-Condon one.
The HEF observed in solution, films and solid state at 350-370 nm when excited at 3700-300 nm can occur
from this state. The excitation energies calculated in the local minimum’s geometry D provide a S0,D-S1,D
transition, with mixed (/,*) character, at higher energy with respect to that computed for A,
consequently, a molecule in this conformation cannot reach the S1,D using the same excitation energies (270-
300nm). However, geometry optimization of S1,D leads to the planar conformation corresponding to the
ground state’s E geometry and associated with much lower energy than the Franck-Condon one. The LEF
observed in films and in the solid state at 450 nm when exciting at 390 nm can be associated to this new S1,E.
The low excitation energy allows for population of a triplet state with proper (,*) symmetry which crosses
S1,E and finally decays on the ground state. Such a complicated mechanism, S0,D→Tm,D→S1,E→S0,E , has to be
invoked since no singlet states are computed at such low (390 nm) energy neither for the molecule nor for
its dimeric aggregates (Figure 12). The pump-probe results support these conclusions. Upon pumping directly
the Tm,D triplet state (recognizable in the spectrum from the negative PIA band Tm,D→Tn,D) the S1,E state
responsible for the LEF emission is populated by intersystem crossing [4]. The same process could occur even
from S1,D but it cannot be observed because obscured by the efficient HEF. Moreover, LEF can be observed
only in a rigid environment, as films or crystals, but in the latter case, it arises from crystal defects
where a portion of molecules, inside the crystals as well as on the surface, should be found in the D
conformation. To completely understand the intricate behaviour of the TT2PyH+, the PMMA film was
exposed to acidic vapour in order to protonate the pyridinic nitrogen and consequently block the free
rotation around the bond connecting the triimidazole and the pyridine. After 30 minutes of exposition the
film is not fully protonated, in fact, steady state experiment revealed the high energy fluorescence of the
TT2Py together with the additional red shifted fluorescence of the TT2PyH+ (412 nm, τav= 3.56 ns). After 45
minutes only the 412 nm fluorescence is visible. Exciting at 390 the protonated film, a phosphorescence at
425 nm (τav= 13.94 ms) is observed, while the 450 nm LEF is missing. The original spectrum is restored by
exposing the film of TT2PyH+ to NH3 vapors (Figure 4).
76
Figure 12: Schematic photophysical processes of TT2Py (fluorescences and phosphorescences shown as blue and red arrows, respectively). Reproduced from ref.[2] free of charge, https://pubs.rsc.org/en.
As revealed by the geometrical optimization, the simple addition of a proton on the basic nitrogen atom of
the TT2Py generate a metastable conformation (Figure 13). The relaxed energy scan for TT2PyH+shows a
more stable conformation (>10 kcal/mol) where the pyridinic protonated nitrogen and one nitrogen of the
triimidazole are facing each other, according to a geometry reminiscent of the proton sponges’ one [15]. The
small barrier (2 kcal/mol) between these two states allows the quantitative transformation from the higher
to the lower energy minimum at RT. In agreement, the TDDFT calculation has confirmed the origin of the red-
shifted fluorescence observed and the stable conformation calculated. Importantly, the absence of the low
energy fluorescence at 450 nm is predicted by the rigidity of the TT2PyH+ scaffold.
Figure 13: Scan of the relaxed potential energy surface of TT2PyH+ along the N7-C10-C2-C1 torsion angle, , at the (TD)-B97X/6-
311++G(d,p) level of theory. Energies are relative to the minimum energy geometry. Reproduced from ref.[2] free of charge,
https://pubs.rsc.org/en.
9.4 Conclusions In conclusion we can claim that TT2Py displays excitation-dependent emissions and in particular HEF, HEP,
MEP and LEF emissions of molecular origin, together with LEPs and DRP aggregated RTPs. The tunable
properties and the complex photophysic shown by this dye make TT2PY an elegible candidate for industrial
application in the anticounterfieding area, in the displays fabrication and in sensoristic field.
[15] Llamas-Saiz, A. L.; Foces-Foces, C.; Elguero, J., Proton sponges. Journal of Molecular Structure 1994, 328,
297-323.
79
10 TT-Pyrene derivative
10.1 Introduction The appealing of purely organic dyes has suffered from their well-known Aggregation Caused Quenching
(ACQ) behaviour especially in those fields requiring water as the main media since most of the more attractive
organic luminophores are nonpolar polycyclic aromatic hydrocarbons[1]. However, the ever growing
discovery of new, Aggregation Induced organic Emitters (AIE) with high quantum yields, has open up to the
possibility of using very unsoluble molecules in the biological area as markers for specific organelles or as
photodynamic therapy agents[2][3][4]. In this regard, the recently reported CIE (crystallization Induced
emission) and RTUP (room temperature ultralong phosphorescent) properties of triimidazo[1,2-a:1',2'-
c:1'',2''-e][1,3,5]triazine, TT[5][6], seem particularly intriguing from a biological point of view in which
autofluorescence and background interference problems cannot be completely overcome in direct
microscopy[7][8][9]. Experimentally, when using a strong intensity excitation source, dye photobleaching,
background interference and autofluorescence, are important concerns[10]. In particular, autofluorescence is
due to the fact that biological environment normally contains a large number of different chemicals some of
which emissive themselves (NAD, FAD, riboflavin, porphyrins). Luckily, most of them show a low intensity
signal which, however, becomes relevant with high intensity source. These interferences can be overcome
either by using a low intensity source with a very highly efficient emitter or, even more interestingly, a stable
phosphorescent dye whose signal is freed from prompt autofluorescence.
Unfortunately, being the emission intensity of TT strictly related to its crystallinity grade, the preparation of
small aggregate dispersion through the direct addition of the dye in a non-solvent results in a very weak
fluorescent signal due to the amorphous nature of the aggregates[11].
In order to solve this problem and obtain highly emissive aggregates we have decided, to couple TT with
pyrene (Pyr), a traditional ACQ emitter suffering from excimer whose formation could be inhibited by the
presence of the TT fragment[12][13].
10.2 Synthesis and Crystal Structure Analysis TTPyr can be synthetized in high yields by Suzuki coupling reaction between mono-brominated TT1Br [14] and
the corresponding boronic acid derivative (Scheme 1) and further purified by standard chromatography
techniques and crystallization.
Scheme 1: Syntethetic pathway for the preparation of TTPyr.
TTPyr forms long needled shaped crystals suitable for single crystal X-ray diffraction analysis by slow diffusion
of a non-solvent, such as HEX (TTPyr(H)), EtOH (TTPyr(Et)) or MeOH (TTPyr(Me)), in a DCM solution of the
chromophore.
80
Figure 1: X-ray structure of TTPyr(H) single crystal obtained from DCM/HEX.
TTPyr(H), obtained from a DCM/HEX solution, crystallizes in the monoclinic P21/c space group with the
asymmetric unit containing one molecule with Z=4. Molecules of TTPyr are characterized by a dihedral angle
() between Pyr and TT mean planes of 49.3°. The bond connecting the TT and Pyr units measures 1.470 Å.
The triimidazole unit of one molecule stacks in between two Pyr units of neighbour molecules with distances
of 3.78 and 4.04 Å between the TT and pyrene centroids forming infinite columns of H-aggregates. This
arrangement is unusual for the reported members of the TT-family, all having stacking interactions between
TT-units of adjacent molecules and represents an interesting case of study for the photophysical behaviour
associated with the presence of H aggregates (Figure 1)[15][16].
Figure 2: X-ray structure of TTPyr(Et) single crystal obtained from DCM/EtOH.
The ethanol solvated from, TTPyr(Et), has been isolated from DCM solution with EtOH. This solvate derivative
crystallize in the C2/c monoclic space group with the asymmetric unit containing one TTPyr molecule and
half molecule of ethanol which is disordered over two positions (Figure 2). The dihedral angle between the
mean planes of TT and pyrene fragments within a molecule is 46.8°. The ethanol molecule is disordered on
two positions allowing it to interact one by one via hydrogen bond with two TTPyr molecules (O-H···N = 3.261
Å) (Figure 2). The packing show that TTPyr molecules align in antiparallel fashion along the crystallographic
b direction giving rise to columns similar to that found in the crystal structure of TTPyr(H). Along this columns
TT and pyrene fragments are parallel disposed with alternating distances of 3.78 and 3.98 Å between their
respective centroids.
Intriguingly, another conformationally stable structure was obtain. In fact, trying to prepare better shaped
crystals we have thermally treated a semi-crystalline TTPyr(Me) sample few grades below its melting point
(m.p.= 232°C). By slowly cooling (0.2 °/min) the sample to RT, crystals of a new phase, TTPyr(HT), were
formed.
81
Figure 3: X-ray structure of TTPyr(HT) single crystal obtained after thermal treatment of a crystalline sample obtained from DCM/MeOH.
The anhydrous form obtained at high temperature, TTPyr(HT), crystallizes in the orthorhombic Pna21 space
group, the asymmetric unit contain one molecule with Z = 4. The dihedral angle between mean planes of TT
and pyrene in a molecule is 52.8°, slightly larger with respect to that found for the low temperature
polymorph (Figure 3). The packing here is completely different from that found for the LT form. The molecules
form columns along the crystallographic a direction and only the TT fragments are facing each other while
the pyrene units of adjacent molecules orient in opposite directions. Along the columns the mean planes of
two adjacent TT units are not parallel showing a dihedral angle of 8.2°. The distance between centroids of
adjacent TT fragments along the crystallographic a direction is 4.15 Å.
Thermal treatments have then been performed in order to prepare all the different phase/polymorphs
starting from TTPyr(Et). In particular, we have acquired the X-ray powders diffraction spectra of:
• Starting crystals
5,0 7,5 10,0 12,5
0,0
0,2
0,4
0,6
0,8
1,0
Inte
nsity
2
DCM/EtOH Experimental
DCM/EtOH Simulated
Figure 4: XRPD of TTPyr(Et) (Black line) and its simulated pattern (Red line).
TTPyr(Et) simulated spectra and the experimental one are identical except for a small shift, probably due to
instrumental factors, and the relative intensity of the peaks that is distorted by the preferential orientation
of the crystalline powders analysed (These considerations about the small discrepancy between simulated
and experimental spectra are valid even for the following experiments) (Figure 4).
82
• Crystals after 1h at 110°C
5,0 7,5 10,0 12,5 15,0
0,0
0,2
0,4
0,6
0,8
1,0
Inte
nsity
2
DCM/EtOH 110°C Experimental
DCM/EtOH Experimental
DCM/HEX Simulated
Figure 5: XRPD of TTPyr(Et) before (Red line) and after(Black line) thermal treatment at 110°C and TTPyr(H) simulated pattern.
The powders diffraction spectrum after the thermal treatment at 110°C perfectly matches with that of the
starting material indicating that the solvent is strongly bonded in the structure and higher temperatures are
needed for its removal (Figure 5).
• Crystals after 1h at 180°C
5,0 7,5 10,0 12,5
0,0
0,2
0,4
0,6
0,8
1,0
Inte
nsity
2
DCM/EtOH 180°C Experimental
DCM/EtOH Experimental
DCM/HEX Simulated
Figure 6: XRPD of TTPyr(Et) before (Red line) and after(Black line) thermal treatment at 180°C and TTPyr(H) simulated pattern.
The ethanol is efficiently removed when the sample is heated at 180°C resulting in the formation of TTPyr(H)
(Figure 6) which is the same phase obtained from DCM/HEX.
83
• Crystals after 2h at 220°C and slowly cooled to RT
5,0 7,5 10,0 12,5 15,0
0,0
0,2
0,4
0,6
0,8
1,0
Inte
nsity
2
DCM/EtOH 220°C Experimental
DCM/EtOH 180°C Experimental
HT Simulated
Figure 7: XRPD of TTPyr(Et) after thermal treatment at 180°C (Red line) and after thermal treatment at 220°C (Black line), and TTPyr(HT) simulated pattern.
Finally, the thermal treatment at 220°C allows to obtain the third phase TTPyr(HT) (Figure 7).
10.3 Photophysical characterization
10.3.1 DMSO Solutions Diluted DMSO solutions of TT-Pyr (10-5 M) show two absorptions with replicas at 257, 268, 279 nm and 332,
347 nm respectively; only slightly red-shifted with respect to those of pyrene itself in the same condition
(with peaks at 254, 264, 274 nm and 309, 322, 338 nm). At 298 K, the solution displays an intense fluorescent
emission peaked at 420 nm (Ф = 92%, τav= 2.76 ns) ascribable to deactivation from an excited state (S1) with
main pyrene character as suggested by the similarity of the corresponding excitation spectrum (displaying
components at 275 nm and 346 nm) with the absorption spectrum of pyrene itself (Figure 8).
400 500
10-5 M DMSO
exc = 280 nm
10-5 M DMSO
exc = 346 nm
PL
Inte
nsity
Wavelength (nm)
A
300 400 500
DMSO exc
= 420 nm
DMSO absorption
Op
tica
l A
bso
rban
ce
PL
Inte
nsity
Wavelength (nm)
B
Figure 8: A) Normalized emission spectra of TTPyr in DMSO 10-5M. λexc= 280 nm (Black line); λexc= 346 nm (Red line); B) Normalized excitation spectra of TTPyr. DMSO 10-5M. λem= 420 nm (Black line); DMSO 10-5 M Normalized absorbance (Red line).
84
The nature of the low energy transition has been explored by DFT/TDDFT calculations, providing two close
singlet states (S1 at 304 nm with oscillator strength f=0.06 and S2 at 302 nm, f=0.50), both involving molecular
orbitals (HOMO-1, HOMO, LUMO and LUMO+1) localized on the pyrene moiety with only a small contribution
(coming from HOMO-1) on TT. Optimization of the S1 state converges on a less twisted conformation with
respect to the ground state ( varying from 67 to 31°) and shortening of the bond connecting the TT and Pyr
units (from 1.478 to 1.425 Å), implying a greater conjugation between them. Emission from the relaxed S1
state is computed at 384 nm (f=0.89) and involves HOMO and LUMO both delocalized on pyrene with a large
tail on TT.
10.3.2 Nano-Aggreggates Nano aggregation experiments performed through rapid injection of different water volumes to solutions of
TTPyr in DMSO (keeping the concentration equal to 10-5 M; Figure 9), have revealed an aggregation and
excitation dependent behaviour. In fact, by irradiation at 340 nm, a gradual increase and a concomitant blue
shift of the emission at 420 nm is observed by increasing the water fraction up to 70%. Further water addition
results in an attenuation of this emission. Moreover, the appearance of an additional low energy component
at about 480 nm is observed for the 90 and 99% (water content in volume) suspension. At 405 nm excitation
wavelength, the intensification of the low energy component can be monitored since freed from the more
intense high energy one. It is thus evident that the 480 nm emission is already visible and actually more
intense at 80% water content.
400 500
PL
Inte
nsity (
AU
)
Wavelength (nm)
fwater
%
0
30
40
50
60
70
80
90
99
A
500 600
PL
Inte
nsity (
AU
)
Wavelength (nm)
fwater
%
0
30
40
50
60
70
80
90
99
B
Figure 9: PL spectra of TTPyr in DMSO/H2O mixtures with different water fractions (fw) 10−5 M. A) λexc= 340 nm. B) λexc= 405 nm
A detailed analysis of the 90% water containing suspension has been performed (Figure 10). By exciting at
346 nm, a low energy band at about 480 nm (τav = 25.66 ns) is visible together with a stronger one at about
400 nm (τav = 12.32 ns). On the other side, by exciting at 405 nm, only the broad emission at 480 nm is
observed. The excitation profiles are strictly related to the emission taken into account. When monitored at
400 nm emission, the excitation spectrum is superimposable to that of the diluted DMSO solution with two
structured intense absorptions centred at about 280 nm and 346 nm. While at 480 nm, the excitation profile
becomes broader with a tail in the visible range in agreement with the absorption spectrum of the
solvent/non solvent suspension. It is thus conceivable that the low energy emission is associated to
aggregated species with red shifted absorption component. The 400 nm emission, on the other side, is to be
associated to the monomeric species still visible at 90% non-solvent volume due to its high quantum
efficiency, much stronger than that of the aggregates. The formation of excimers in the nanoaggregated
suspensions could be expected from pyrene containing species[17]. In the case of TTPyr, however, it seems
that the TT moiety prevents excimers formation and favors ground state aggregates as indicated by the
85
excitation dependent emission and the presence of an aggregate fingerprint absorption in the excitation
spectrum[18].
400 500 600
10-5 M agg
exc = 346 nm
10-5 M agg
exc = 405 nm
No
rma
lize
d P
L I
nte
nsity
Wavelength (nm)
A
300 400
10-5 M agg
em = 398 nm
10-5 M agg
em = 480 nm
PL
Inte
nsity
Wavelength (nm)
B
Figure 10: A) Normalized Emission spectra of TTPyr aggregates in DMSO/H2O (10/90 v/v) 10-5 M at 298 K λexc= 346 nm (Red line); λexc= 405 nm (Black line); B) Normalized Excitation spectra of TTPyr aggregates in DMSO/H2O (10/90 v/v) 10-5 M at 298 K λem= 398
nm (Red line); λem= 480 nm (Black line).
10.3.3 Crystals
10.3.3.1 TTPyr(Et) Crystals of TTPyr(Et) at RT display an intense fluorescence at 493 nm (Ф = 53.2%, τav= 2.97 ns) when excited
in the 300-400 nm range. Through selective excitation at 495 nm a phosphorescent component appears at
555 nm (τav= 4.90 ms) (Figure 11). The excitation spectrum monitored at 610 nm clearly shows the presence
of a direct triplet population at 525 nm which is furtherly intensify by lowering the temperature at 77K. At
low temperature, the two emissions become more vibronically resolved as shown by the structure shoulder
at 595 nm for the phosphorescence (τav= 5.37 ms) and at 460 and 520 nm for the fluorescence (τav= 4.17 ns)
10.3.4 Amorphous films Amorphous films, prepared by melting (at 250°C) TTPyr powders and rapidly quenching the melt with liquid
nitrogen, display an intense fluorescence at 465 nm (τav = 9.13 ns) resembling the 90/10 H2O/DMSO one. The
89
excitation spectrum at 470 nm is characterized by peaks at 265, 310 and 390 nm which are ascribable to the
pyrene moiety similarly to what observed for solutions and nano-aggregates (Figure 17).
250 300 350 400 450 500 550 600 650 700 750 800
exc
= 340 nm
em
= 470 nmP
L I
nte
nsity (
au
)
Wavelength (nm)
TTPyr Amorphous film RT
Figure 17: Normalized PL spectra of TTPyr amorphous film at 298K. λexc= 340 nm (Black line); λem= 470 nm (Red line).
10.3.5 Discussion All TTPyr phases display both short and long-lived components whose origin is still under investigation since
the isolation of all pure phases has revealed to be very time consuming. In particular, the effect of the
different packing arrangements (TTPyr(Et), TTPyr(Me) and TTPyr(H) display dual-component TT/pyrene H-
aggregation while in TTPyr(HT) only the triimidazolic fragments are involved in the H-aggregates) on the
emissive behavior of the different polymorphs require to be better and fully analyzed. From a preliminary
analysis, it seems that fluorescent emission in the solid state is significantly red-shifted (by about 60 and 30
nm) with respect to what observed in solution. Such red shift could be explained by the effect of packing
forces that impose a lower twisting of the two molecular moieties resulting in a higher conjugation. In fact,
a prototype dimeric DFT model has shown that the dihedral angle decreases from 67 (isolated monomer)
to 53°, approaching the X-ray value (46.8° for TTPyr(H) and 52.8 for TTPyr(HT)). The smaller red shift
measured for aggregates and amorphous film may be due to the formation of small dimers or small
aggregates that, as demonstrated by DFT calculations, can only partially force the planarization.
TTPyr(Et), TTPyr(Me) and TTPyr(H) share the same crystalline structure apart for the presence of disordered
methanol or ethanol molecules and small differences in the intermolecular distances. These differences seem
to have low impact on TTPyr photophysic, whose emissions appears only more vibronically structured when
O-H···N bonds are formed with solvents molecules. In the same direction, the structural rigidification
provided by the H-bonds formation seems to increase Ф, in particular ФTTPyr(Et) > ФTTPyr(Me) > ФTTPyr(H) [19;20]. Such
trend could be justified by the formation of better shaped crystals with EtOH with respect to MeOH for which
no crystals suitable for X-diffraction analysis have been obtained.
Reasonably, the phosphorescence observed for every polymorph may be associated to the H-aggregates
formation as for the previous cases described [11]. The high energy fluorescence detected at 420 nm for
90
TTPyr(HT) may be associated to an anti-Kasha emission form an S2 level, which was already observed for
pyrene and its derivatives [21][22].
10.4 Biological evaluation Based on the observation that triazinic functionalities are frequently used in the biological field due to their
ability to work as central scaffold for further modification or as mimetic of purine moieties, we assumed that
the insertion of the TT moiety on pyrene dyes could, not only modify its photophysical properties, but also
enhance the biological value acting as a carrier through the cell membrane. For this reason, we performed a
detailed investigation of the performances of TTPyr in a biological context [23][24].
10.4.1 Bacteria imaging TTPyr is a good candidate for bacterial imaging because of its balance of hydrophilicity and hydrophobicity.
To verify the bacterial imaging ability of TTPyr, S. aureus and E. coli were chosen as bacterial models, which
represent Gram-positive and Gram-negative bacteria respectively. As shown in Figure 18, TTPyr can stain
both S. aureus and E. coli effectively within 60 min by entering the bacterial cells. In addition, TTPyr showed
very high staining efficiency towards both Gram-positive and Gran-negative bacteria. A few E. coli cells
showed weak emission compared to S. aureus, which is due to the outer membrane of E. coli that hampers
the dyes penetration.
Figure 18: Confocal Laser Scanning Microscope (CLSM) images of bacteria stained with 100 μM TTPyr for 60 min. (A-C) S. aureus. (D-
F) E. coli. Scale bar: 5 µm.
10.4.2 Cell imaging Confocal microscope images indicate that TTPyr aggregates are detectable inside cells at concentration as
low as 10 μM when they are added to the culture media of HeLa, HLF and cell lines.
From an accurate observation of the co-staining experiment pictures on HeLa (Figure 19-20) and HLF (Figure
21-22) it is evident a good overlap between the TTPyr aggregates signal and those of the Lysotracker, and
91
BODIPY 493/503, in particular in HLF cells. Only a partial overlap between TTPyr and Mitotracker signals is
detected.
Figure 19: HeLa cells co-staining experiment. A) MitoTracker Deep Red. B) LysoTracker Green DND 26. C) TTPyr 10 uM. D) Bright field. E) On screen axial fluorescent intensity of TTPyr, MitoTracker and LysoTracker. F) The fluorescence intensities of MTDR, LTG,
TTPyr along the axis.
Figure 20: HeLa cell co-staining experiment. A) Bright field. B) TTPyr 10 μM. C) BODIPY 493/503. D) Merged image of A-C. E) On screen axial fluorescent intensity of TTPyr and BODIPY 493/503. F) The fluorescence intensities of TTPyr and BODIPY 493/503 along
the axis.
Curiously, this means that the cells accumulate TTPyr aggregates in lysosomes and lipid droplets as if they
were trying to degrade or at list contain the chromophore that, however, seems to be widespread throughout
the cytoplasm. This attempt to eliminate the dye from the cells is a clear indication of TTPyr toxicity. In fact,
after sufficiently long staining time, TTPyr seems to be not well metabolized by the cells as revealed by their
round shape and the high number of vesicles which are indicative of a general unhealthy condition.
92
Figure 21: HLF cell co-staining experiment. A) MitoTracker Deep Red. B) LysoTracker Green DND 26. C) TTPyr 10 uM. D) Bright field. E) On screen axial fluorescent intensity of TTPyr, MitoTracker and LysoTracker. F) Fluorescence intensities of MTDR, LTG, TTPyr
along the axis.
Figure 22: HLF cell co-staining experiment. A) Bright field. B) TTPyr 10 μM. C) BODIPY 493/503. D) Merged image of A-C. E) On screen axial fluorescent intensity of TTPyr and BODIPY 493/503. F) The fluorescence intensities of TTPyr and BODIPY 493/503 along
the axis.
To certify the presence of TTPyr inside the cells, we have acquired the in-situ steady state spectra. As clearly
visible in Figure 23, there is a perfect match between the in-situ spectra and the one obtained with the 90%
non-solvent aggregate previously described.
93
400 450 500 550 600 650 700
TTPyr
Flu
ore
sc
en
ce
In
ten
sit
y
Emission Wavelength (nm)
Figure 23: In-situ emission spectra of 10 μM TTPyr (right) in HeLa cells obtained on CLSM. λexc = 405 nm.
In agreement with staining experiments, the MTT test (Figure 24) points out a major cytotoxicity of TTPyr. It
is expected, in fact, that the binding of TTPyr with the Mitocondria, as highlighted by the staining
experiments, could lead to the invalidation of the ATP production process causing the death of the cells.
Moreover, TTPyr showed more toxicity towards HeLa cells, which could attributed to the stronger metabolism
of HeLa cells compared to HLF cells.
0
20
40
60
80
100
120
Ce
ll V
iab
ilit
y (
%)
HeLa
HLF
0 0.3 0.6 1.2 5 102.5 20
Concentration (M)
40
Figure 24: Cell viability of HeLa cells and HLF cells treated with different concentrations of TTPyr.
10.5 Conclusions In conclusion, the high quantum efficiency shown by TTPyr solutions, aggregates and crystalline powders
makes this material an appealing resource in view of further application. In addition to the great staining
ability of this dye, its use as sensing fluorophore for the detection of explosives is ongoing and the preliminary
data are promising. A detailed analysis of TTPyr behavior is still to be completed but from the results obtained
so far some statements can be made. In particular, the conjugation of TT with pyrene does not prevent the
H-aggregates formation and the arise of the associated phosphorescence. Moreover, the flat structure of
pyrene allows to form mixed pyrene/TT H-aggregates in TTPyr(H), -(Me) and -(Et) which, from a comparison
94
with the TTPyr(HT) one, seems to be as efficient as the “pure” TT/TT H-aggregates in the generation and
stabilization of triplet excitons.
In view of the good results obtained with pyrene, triimidazole could be introduced as substituent on other
flat scaffolds in order to switch on or to enhance phosphorescent emissions.
95
10.6 References [1] Bandyopadhyay, D.; Sanchez, J. L.; Guerrero, A. M.; Chang, F.-M.; Granados, J. C.; Short, J. D.; Banik, B. K.,
Design, synthesis and biological evaluation of novel pyrenyl derivatives as anticancer agents. European
Journal of Medicinal Chemistry 2015, 89, 851-862.
[2] Islam, M. M.; Hu, Z.; Wang, Q.; Redshaw, C.; Feng, X., Pyrene-based aggregation-induced emission
luminogens and their applications. Materials Chemistry Frontiers 2019, 3 (5), 762-781 .
[3] Schnermann, M. J., Organic dyes for deep bioimaging. Nature 2017, 551 (7679), 176-177 .
The similarity of LEP detected for 1-Cu, 1-Ag, TTI and TTCo, supports its ligand’s H-aggregation origin (TH-S0)
also for the copper derivative. From the comparison between the isostructural 1-Cu and 1-Ag, it is clear that
the metal plays on LEP a secondary role and can be therefore referred to as an “external” perturber[13]. The
same observation can be made for MEP of the two compounds, in agreement with its IC intermolecular
electronic coupling origin. The metal secondary effect results in shorter emission lifetimes for MEP and LEP
of 1-Cu having a lower atomic number.
In the emission spectra collected at 77 K (see Figure 7) the broad band at 568 nm with MLCT character excited
at high energy (300-340 nm) is still present together with the structured LEP and MEP (better isolated when
exciting between 390-420 nm) (upper panel figure 7). Time delayed experiments have revealed the overlap
between the MEP and the LEP, with the latter displaying narrow peaks whose relative intensity varies with
300 400 500 600 700
Em
issio
n Inte
nsity
Wavelength (nm)
LEP
MEP
RTT
M-S
0
300 400 500 600 700
Em
issio
n I
nte
nsity
Wavelength (nm)
LEPMEP
TM-S
0 LT
102
the delay time (lower panel figure 7). The perfect agreement between Ag and Cu LEP and MEP supports their
common origins.
Figure 7: Normalized emission and excitation spectra of crystals of 1-Cu at 77 K. Top: PL spectra (solid line) at λexc = 340 nm (green line), λexc = 390 nm (black line), λexc = 420 nm (blue line) and PLE spectra at λem = 460 nm (black line), λem = 530 nm (green dashed
line) and λem = 633 nm (red dashed line). Bottom: phosphorescence spectra (λexc = 420 nm; blue line, delay 100 s, window 500 s; black line, delay 1 ms, window 5ms; red line, delay 5 ms, window 10ms).
DFT and TDDFT calculations have been performed on the [M(TT)I]4 model compounds (M=Ag, Cu) in order to
furtherly confirm the intramolecular origin of the emission bands in 1-Ag and 1-Cu. It is important to highlight
that the geometry optimization of discrete models causes the loss of the symmetry characterizing the
[M(TT)I]n polymeric structure owing to major boundary effects. This could generate an artificial splitting of
the electronic excitation levels disallowing a close one-to-one correspondence between computed and
observed states. The first singlet level (S1, Figure 8) computed at 274 (Ag) and 307 nm (Cu), has 1XMCT
character with some 1XMLCT contribution, much greater for the Cu compound with respect to the Ag one
(Figure 8). According to this, the QTAIM analysis shows a higher covalence degree for the Cu–N bond with
respect to the Ag–N one. This result perfectly agrees with the suppression of fluorescence through easy ISC
to close triplets, the shorter lifetimes and the importance of the MLCT emission detected for 1-Cu and that
are symptoms of the greater metal contribution on the intramolecular emissive behavior respect to 1-Ag.
DFT/TDDFT calculations also provide the first triplet levels (T1T4 and T1T3 for 1-Ag and 1-Cu compounds,
respectively) at 324 (Ag) and 329 nm (Cu), with mixed 3LC/3XMLCT character. In addition, a low energy 3XMCT/3XMLCT triplet state (T4, at about 0.01 eV from T1T3) is calculated for Cu but it is absent in the Ag
model compound. For this latter, pure 3XMCT triplet states are computed at higher energy (T9, T14), where
accessible singlet states are not present preventing the efficient triplets population by ISC.
Accordingly, the observed 1-Ag HEP emission requires an alternative mechanism to be populated. In
particular, it may be either the triplet direct population at low energy or the ISC from S1. This latter process
is facilitated by the presence of triplet states (T15 and T16) close to S1 and having partial character deriving
from the coordinating nitrogen atoms.
300 400 500 600 700
Em
issio
n Inte
nsity
Wavelength (nm)
LEP
MEP
RTT
M-S
0
300 400 500 600 700
Em
issio
n I
nte
nsity
Wavelength (nm)
LEPMEP
TM-S
0 LT
103
Concerning the broad low energy phosphorescence observed at 568 nm for 1-Cu when exciting at high energy
(about 300 nm), it may be assigned to emission from T4, which could relax to lower energy than that of T1T3
states. T4 can be populated either by IC from higher triplet states having the same character, that are
populated by ISC from close high energy singlet states, or by ISC from S1.
11.3 Conclusions The detailed photophysical comparative study of 1-Ag and 1-Cu has revealed some interesting aspects. The
two compounds display excitation dependent photoluminescence. For the Ag(I) derivative the decay paths,
all of ligand-centered nature, are simultaneously activated but varied in intensity by changing the excitation
energy. On the contrary, 1-Cu shows non-thermally equilibrated XMLCT and Ligand-centered emissive states.
Kabacinski, P.; Ganzer, L.; Giovanella, U.; Botta, C.; Cariati, E., Unravelling the intricate photophysical
behavior of 3-(pyridin-2-yl)triimidazotriazine AIE and RTP polymorphs. Chemical Science 2020, 11 (29),
7599-7608
[16] Forni, A.; Lucenti, E.; Botta, C.; Cariati, E., Metal free room temperature phosphorescence from
molecular self-interactions in the solid state. Journal of Materials Chemistry C 2018, 6 (17), 4603-4626.
[17] Majoube, M.; Henry, M.; Chinsky, L.; Turpin, P. Y., Preresonance Raman spectra for imidazole and
imidazolium ion: interpretation of the intensity enhancement from a precise assignment of normal modes.
Chemical Physics 1993, 169 (2), 231-241.
106
12 Procedures and methods.
12.1 General information All reagents and model molecules were purchased from chemical suppliers and used without further
purification unless otherwise stated.
1H, 13C and 15N NMR spectra were recorded on a Bruker AVANCE-400 instrument (400 MHz). Chemical shifts
are reported in parts per million (ppm) and are referenced to the residual solvent peak (DMSO, 1H 2.50 ppm, 13C 39.50 ppm) and to the NH3 for 15N resonances. Coupling constants (J) are given in hertz (Hz) and are
quoted to the nearest 0.5 Hz. Peak multiplicities are described in the following way: s, singlet; d, doublet; t.
triplet; m, multiplet.
Mass spectra were recorded on a Thermo Fisher LCQ Fleet Ion Trap Mass Spectrometer equipped with
UltiMate™ 3000 HPLC system.
UV-Visible spectra were collected by a Shimadzu UV3600 spectrophotometer.
Photoluminescence quantum yields were measured using a C11347 Quantaurus–Absolute
Photoluminescence Quantum Yield Spectrometer (Hamamatsu Photonics K.K), equipped with a 150 W Xenon
lamp, an integrating sphere and a multichannel detector.
Steady state emission and excitation spectra and photoluminescence lifetimes were obtained using both a
FLS 980 (Edinburg Instrument Ltd) and a Nanolog (Horiba Scientific) spectrofluorimeter composed of an
iH320 spectrograph equipped with a Synapse QExtra charge-coupled device. The steady state measurements
were recorded by excitation with a monochromated 450 W Xenon arc lamp and the spectra are corrected
for the instrument response. Phosphorescence spectra are obtained with a PPD-850 single photon detector
module with time-gated separation by exciting with a pulsed Xe lamp. Photoluminescence lifetime
measurements were performed using: Edinburgh Picosecond Pulsed Diode Laser EPL-375, EPLED-300,
(Edinburg Instrument Ltd) and microsecond flash Xe-lamp (60W, 0.1÷100 Hz) with data acquisition devices
time correlated single-photon counting (TCSPC) and multi-channel scaling (MCS) methods, respectively.
Nanolog TCSPC measurements are performed using DeltaTime series DD-300 DeltaDiode and a DD-405L
DeltaDiode Laser, with a PPD-850 single photon detector module and are analysed with the instrument
software DAS6. Average lifetimes are obtained as τav =∑𝑨𝒊𝝉𝒊
𝟐
𝑨𝒊𝝉𝒊 from bi-exponential or three-exponential fits.
Low temperature measurements are performed by immersion of the sample in a LN2 quartz dewar or with a
variable temperature liquid nitrogen cryostat Oxford DN1704.
Microscopy fluorescence images were collected with a Nikon Eclipse TE2000-U inverted confocal microscope
by exciting with a 100 W Hg lamp with a 330–380 nm band-pass excitation filter.
X-ray data were collected on a Bruker Apex II diffractometer using MoKα radiation. The structures were
solved using direct methods and refined using a full-matrix least squares procedure based on F2 using all data.
Hydrogen atoms were placed at geometrically estimated positions.
DFT and TDDFT calculations were performed with Gaussian 16 program (Revision A.03) using the 6-
311++G(d,p) basis set. The geometries have been optimized starting from the experimental structures as
derived from X-ray studies.
Ultrafast pump-probe measurements exciting at 290 nm were carried out on a pump-probe setup fed by a
Ti:sapphire laser (780-nm central wavelength, 100-fs pulses, 1-kHz repetition rate; Libra, Coherent). A
fraction of the fundamental wavelength (FW) pulse was used to seed a home-built visible non-collinear
optical parametric amplifier (NOPA). The broadband output centered at 580 nm was up-converted by second-
harmonic generation in a 20-μm-thick BBO crystal, providing sub-20-fs pump pulses in the UV range (290
107
nm). The fluence used was of ∼ 0.7 mJ/cm2 on the sample. The probe pulses were obtained by focusing a
~1μJ fraction of the FW onto a 3-mm-thick calcium fluoride plate. Through white-light continuum generation
we obtained a broadband probe pulse in the range between 320 and 650 nm. The transmitted probe beam
was dispersed in a spectrometer (SP2300 Acton, Princeton Instruments) and detected using a linear image
sensor driven and read out by a custom-built board (Stresing Entwicklungsbüro, Berlin, Germany).
Ultrafast pump-probe measurements exciting at 390 nm were carried out on a pump-probe setup fed by a