Clayton Elwood, Research Analyst Matt North, Director, Institutional Research and Planning Email: [email protected]The following is a preview of what will be provided in the complete edition of the Duquesne University Fact Book, available August 2014. We hope the preview will assist you with commonly used facts. Should you need additional information, please contact us at the number below. http://www.duq.edu/about/departments-and-offices/management-and-business/planning-budgeting-and-institutional-research Angela Chirumbolo, Senior Research Analyst Kori Szelong, Research Analyst, Editor 2014 Duquesne University Fact Book Office of Institutional Research and Planning 305 Administration Building 600 Forbes Ave. Pittsburgh, PA 15282 Tel: 412-396-4400 Fact Book 2014 Preview Duquesne University
Transcript
Clayton Elwood, Research Analyst
Matt North, Director, Institutional Research and Planning
The following is a preview of what will be provided in the complete edition of the Duquesne University Fact Book, available August 2014. We hope the preview will
assist you with commonly used facts. Should you need additional information, please contact us at the number below.
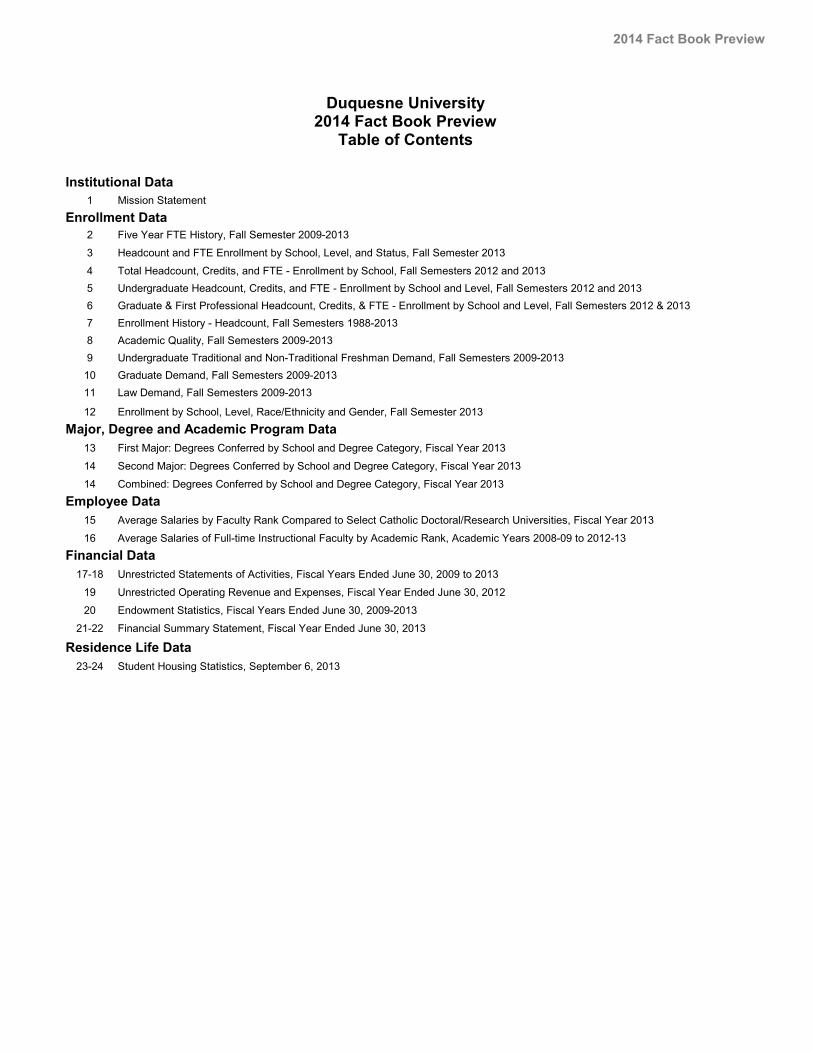
Enrollment Data2 Five Year FTE History, Fall Semester 2009-2013
3 Headcount and FTE Enrollment by School, Level, and Status, Fall Semester 2013
4 Total Headcount, Credits, and FTE - Enrollment by School, Fall Semesters 2012 and 20135 Undergraduate Headcount, Credits, and FTE - Enrollment by School and Level, Fall Semesters 2012 and 20136 Graduate & First Professional Headcount, Credits, & FTE - Enrollment by School and Level, Fall Semesters 2012 & 20137 Enrollment History - Headcount, Fall Semesters 1988-20138 Academic Quality, Fall Semesters 2009-20139 Undergraduate Traditional and Non-Traditional Freshman Demand, Fall Semesters 2009-2013
10 Graduate Demand, Fall Semesters 2009-201311 Law Demand, Fall Semesters 2009-2013
12 Enrollment by School, Level, Race/Ethnicity and Gender, Fall Semester 2013
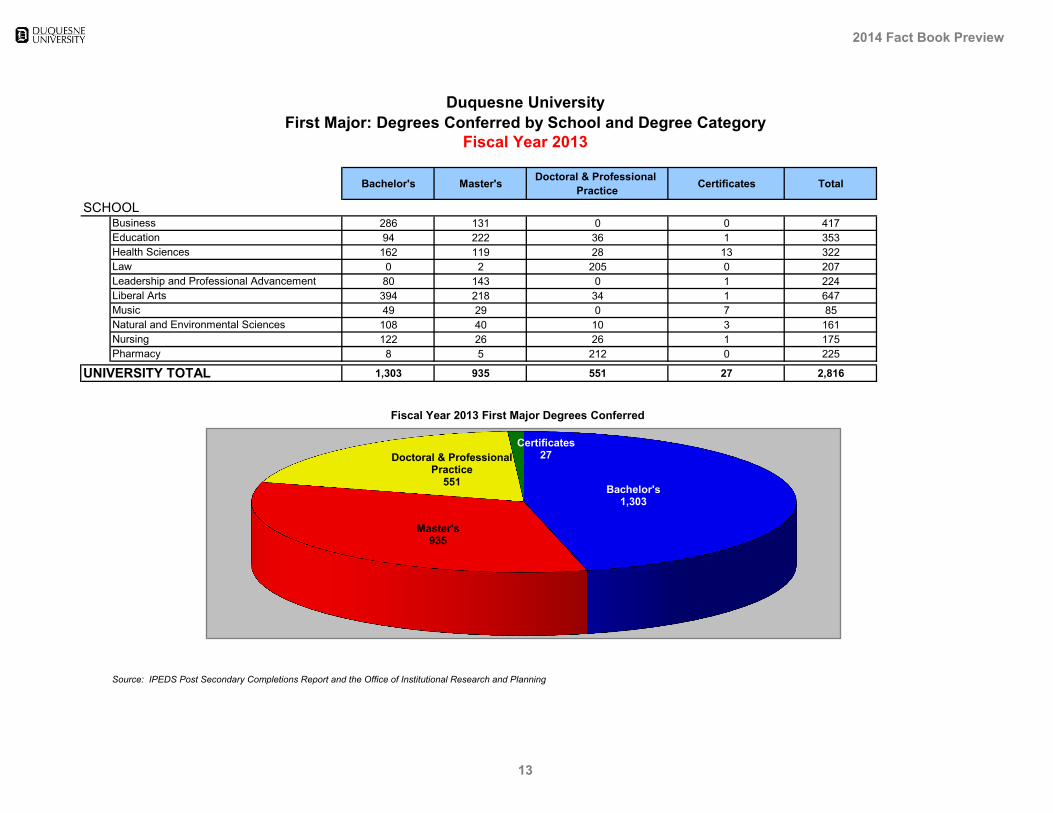
Major, Degree and Academic Program Data13 First Major: Degrees Conferred by School and Degree Category, Fiscal Year 2013
14 Second Major: Degrees Conferred by School and Degree Category, Fiscal Year 2013
14 Combined: Degrees Conferred by School and Degree Category, Fiscal Year 2013
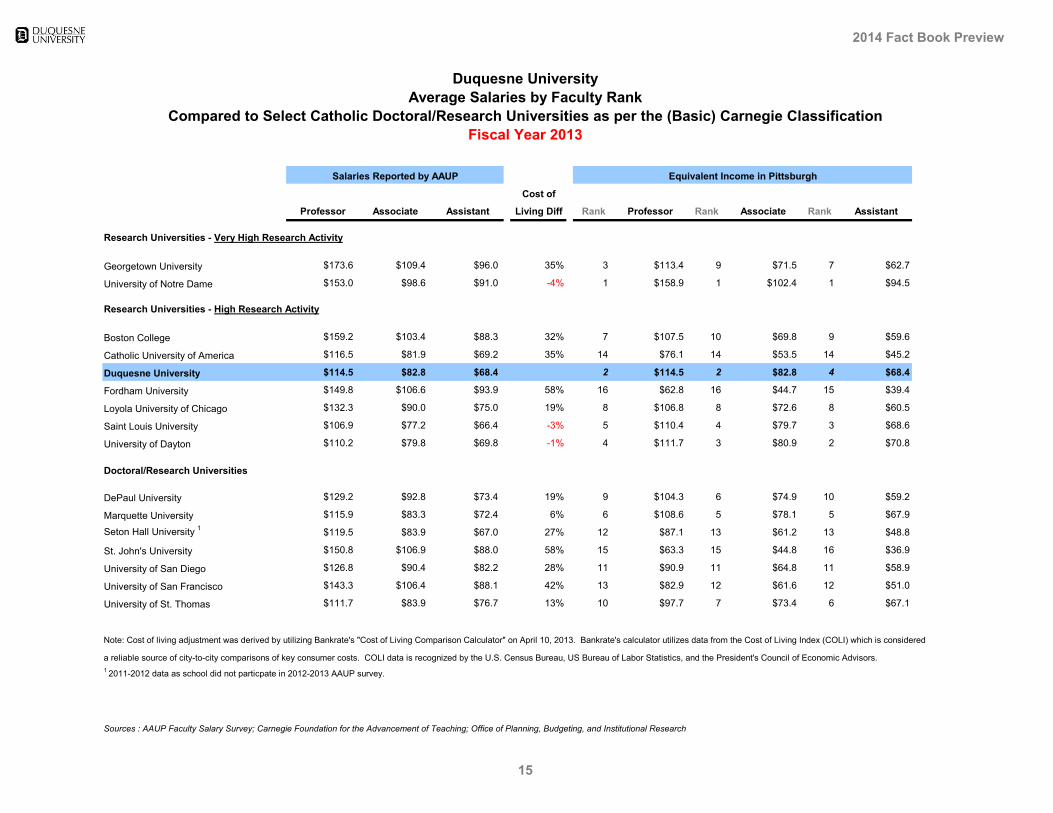
Employee Data15 Average Salaries by Faculty Rank Compared to Select Catholic Doctoral/Research Universities, Fiscal Year 2013
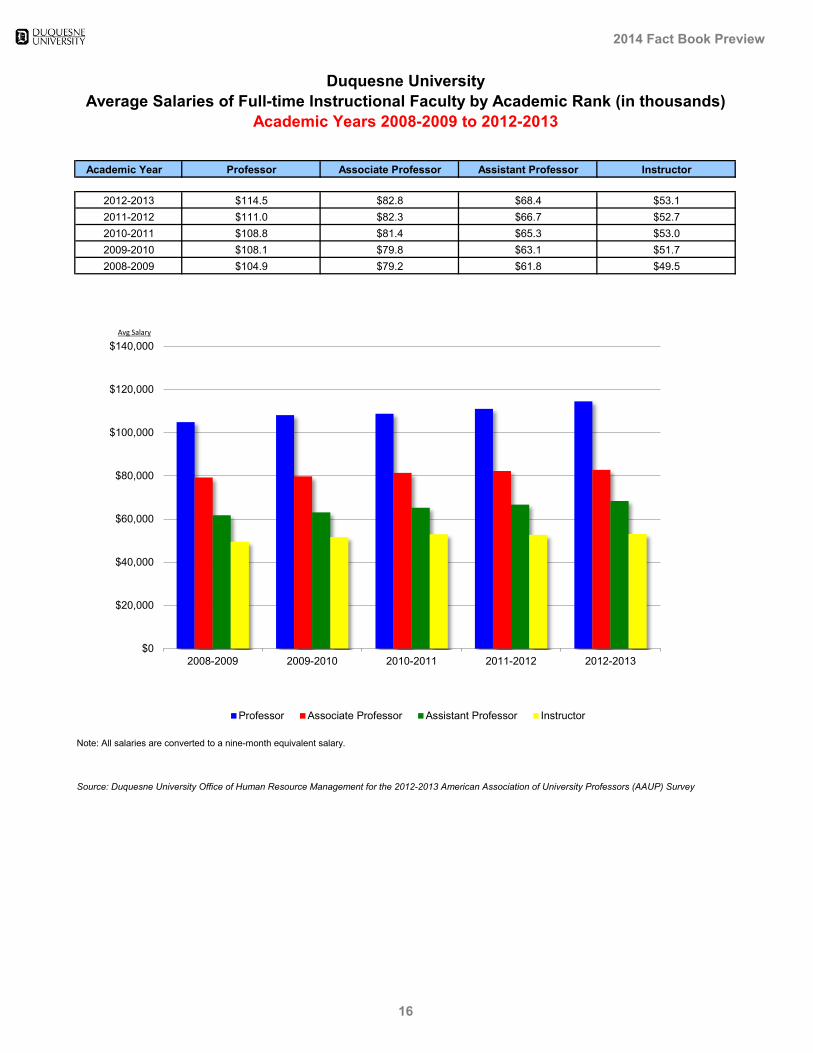
16 Average Salaries of Full-time Instructional Faculty by Academic Rank, Academic Years 2008-09 to 2012-13
Financial Data17-18 Unrestricted Statements of Activities, Fiscal Years Ended June 30, 2009 to 2013
19 Unrestricted Operating Revenue and Expenses, Fiscal Year Ended June 30, 2012
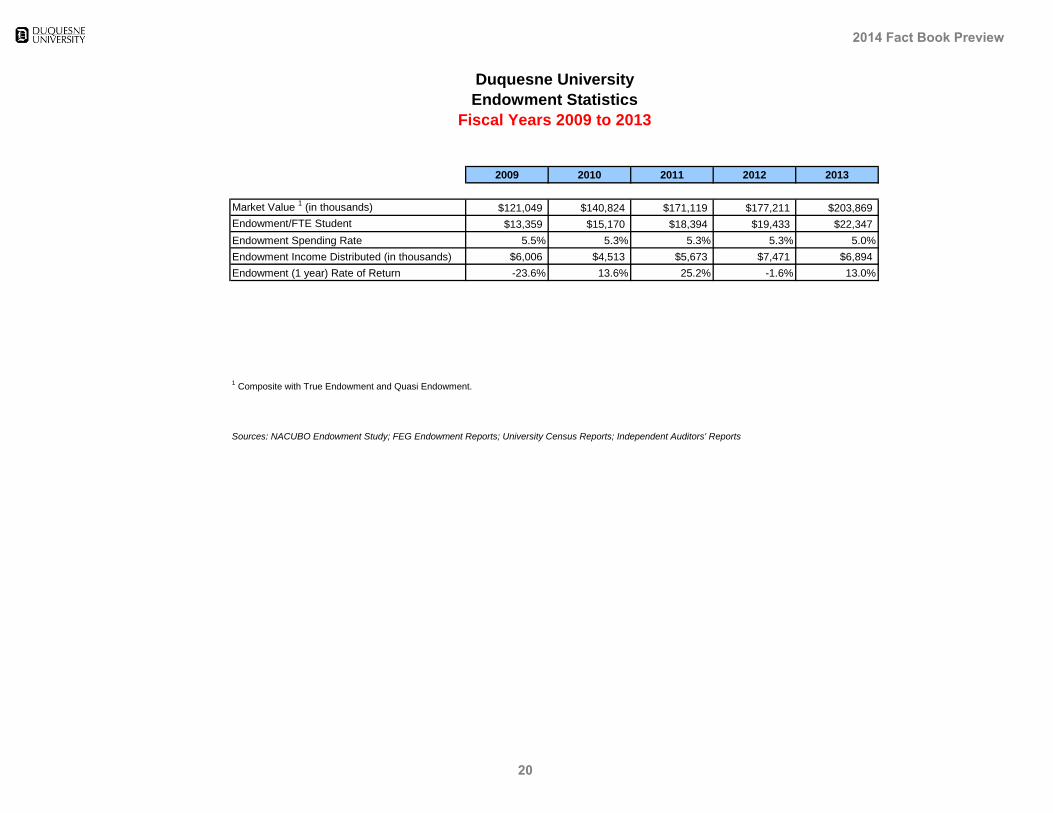
20 Endowment Statistics, Fiscal Years Ended June 30, 2009-2013
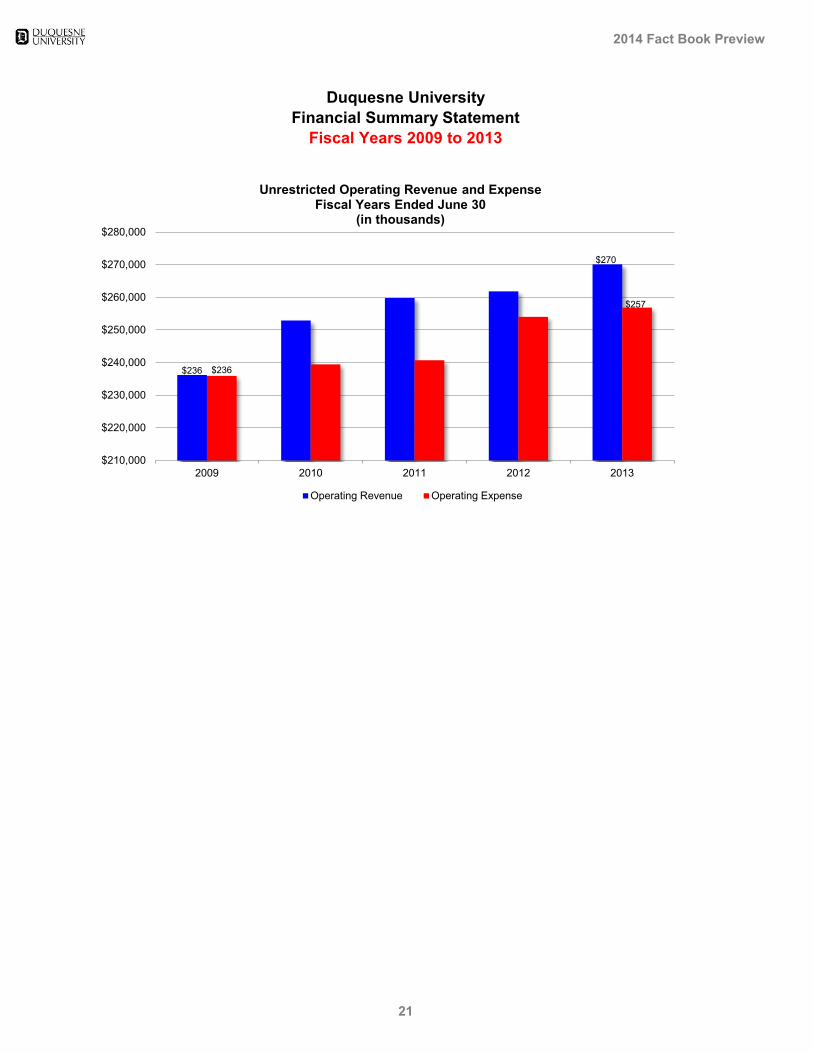
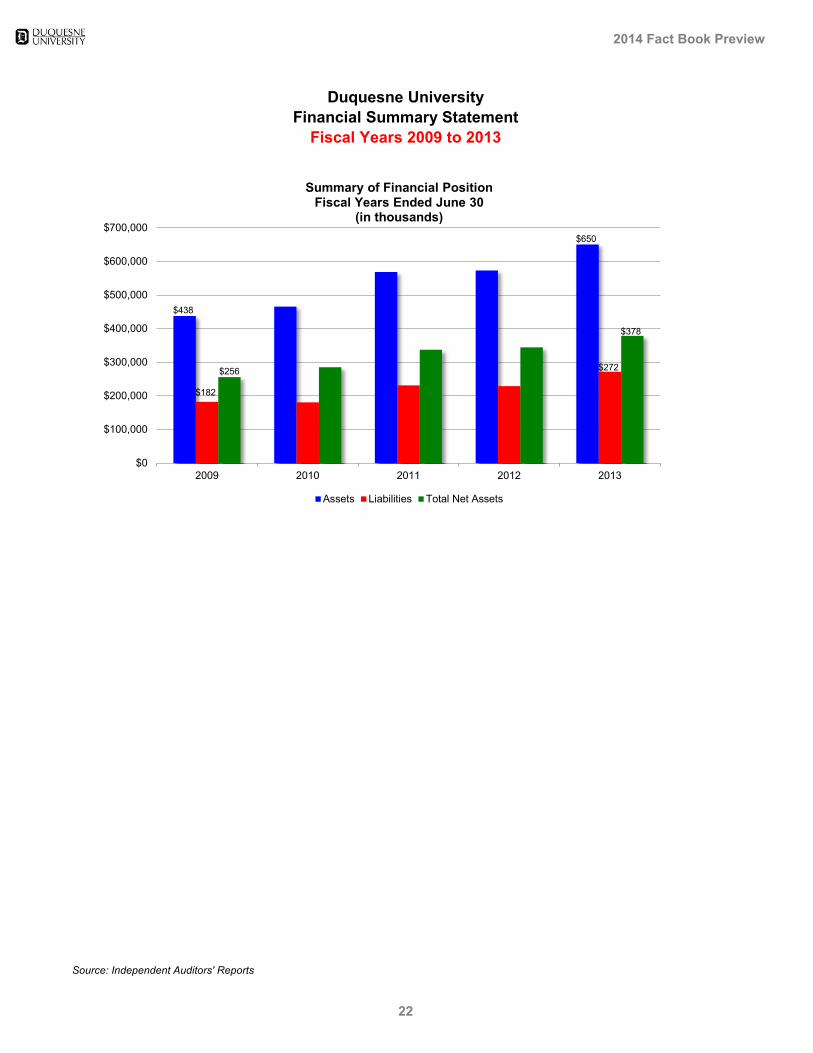
21-22 Financial Summary Statement, Fiscal Year Ended June 30, 2013
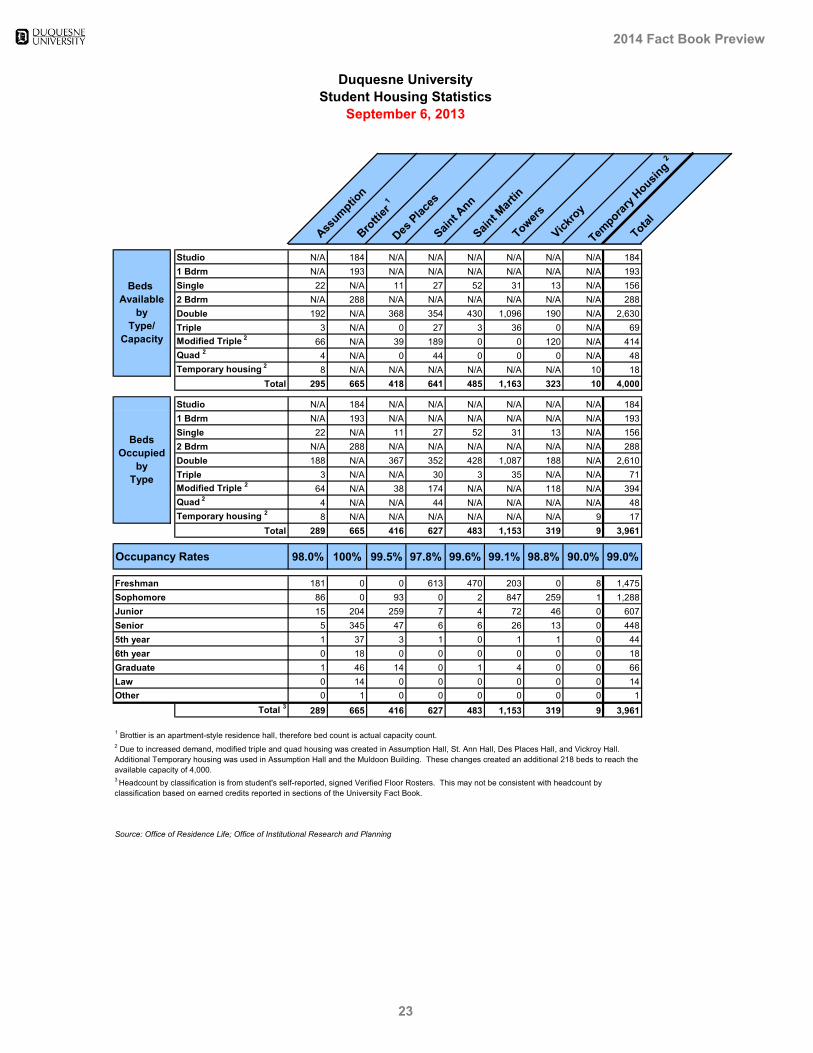
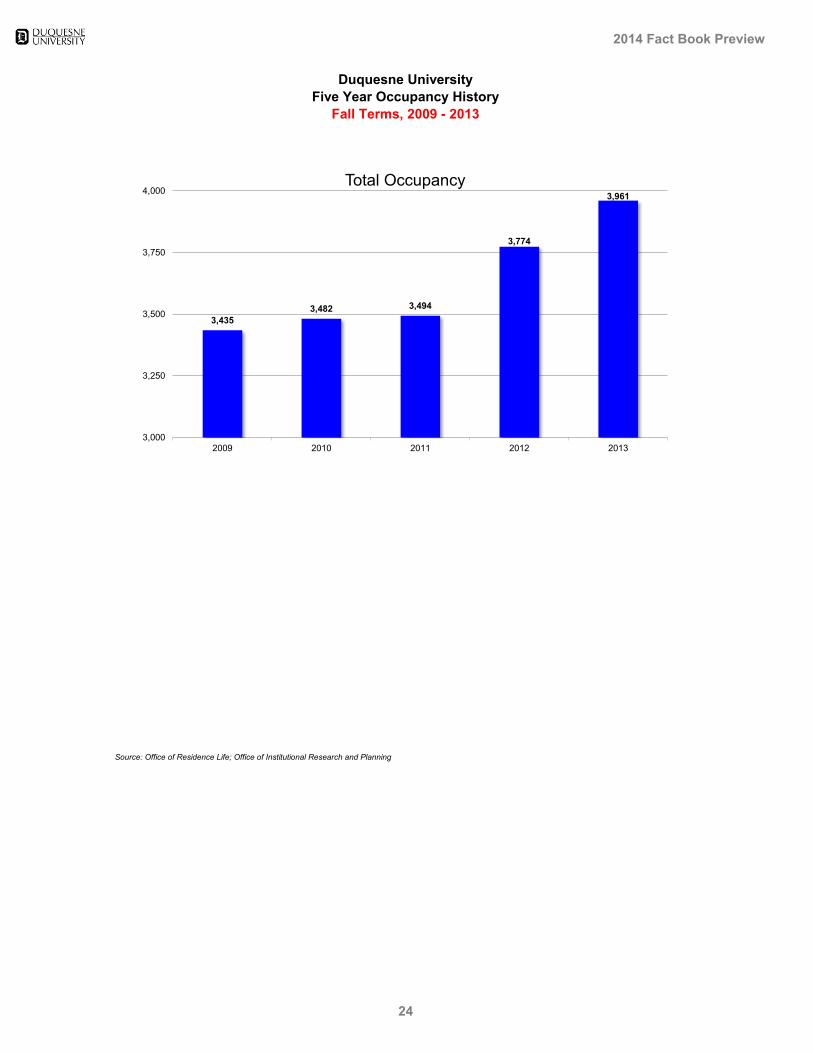
Residence Life Data23-24 Student Housing Statistics, September 6, 2013
Duquesne University2014 Fact Book Preview
Table of Contents
Institutional Data
2014 Fact Book Preview
professional education, through profound concern for moral
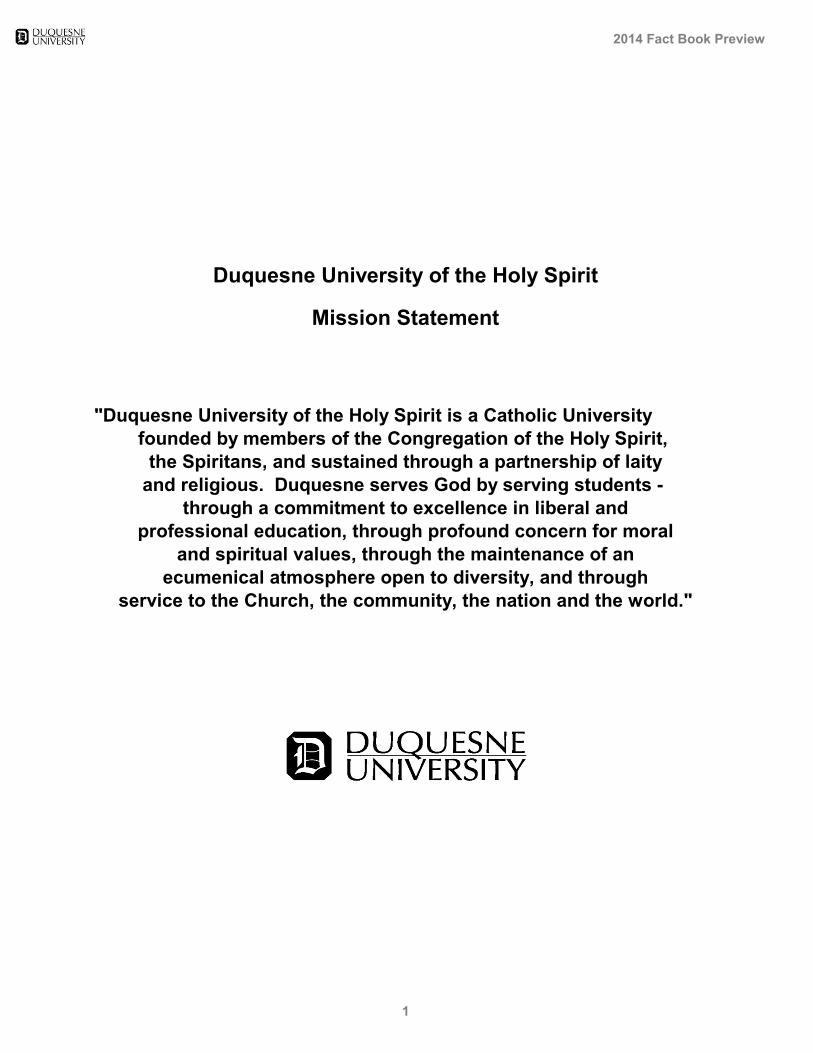
Duquesne University of the Holy Spirit
Mission Statement
"Duquesne University of the Holy Spirit is a Catholic Universityfounded by members of the Congregation of the Holy Spirit,
the Spiritans, and sustained through a partnership of laityand religious. Duquesne serves God by serving students -
through a commitment to excellence in liberal and
and spiritual values, through the maintenance of anecumenical atmosphere open to diversity, and through
service to the Church, the community, the nation and the world."
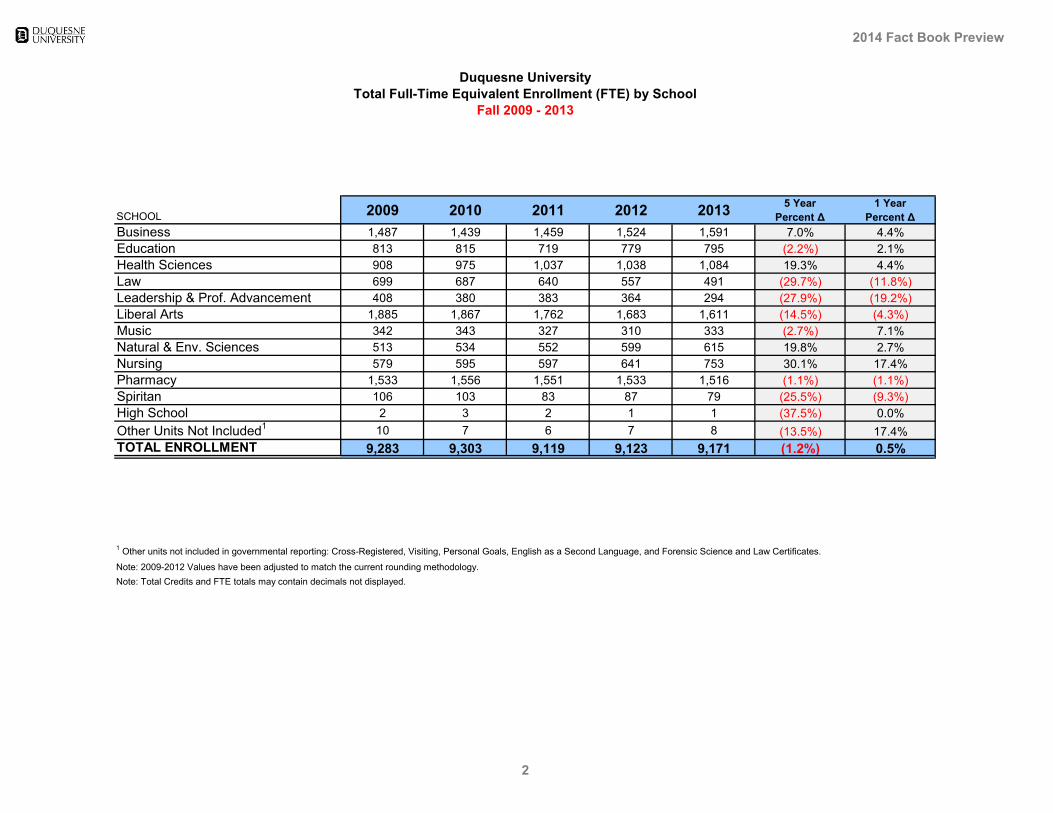
1 Other units not included in governmental reporting: Cross-Registered, Visiting, Personal Goals, English as a Second Language, and Forensic Science and Law Certificates.
Note: 2009-2012 Values have been adjusted to match the current rounding methodology.Note: Total Credits and FTE totals may contain decimals not displayed.
Duquesne UniversityTotal Full-Time Equivalent Enrollment (FTE) by School
Fall 2009 - 2013
2014 Fact Book Preview
2
Full-Time Part-Time Total FTE1 Full-Time Part-Time Total FTE1 Full-Time Part-Time Total FTE1
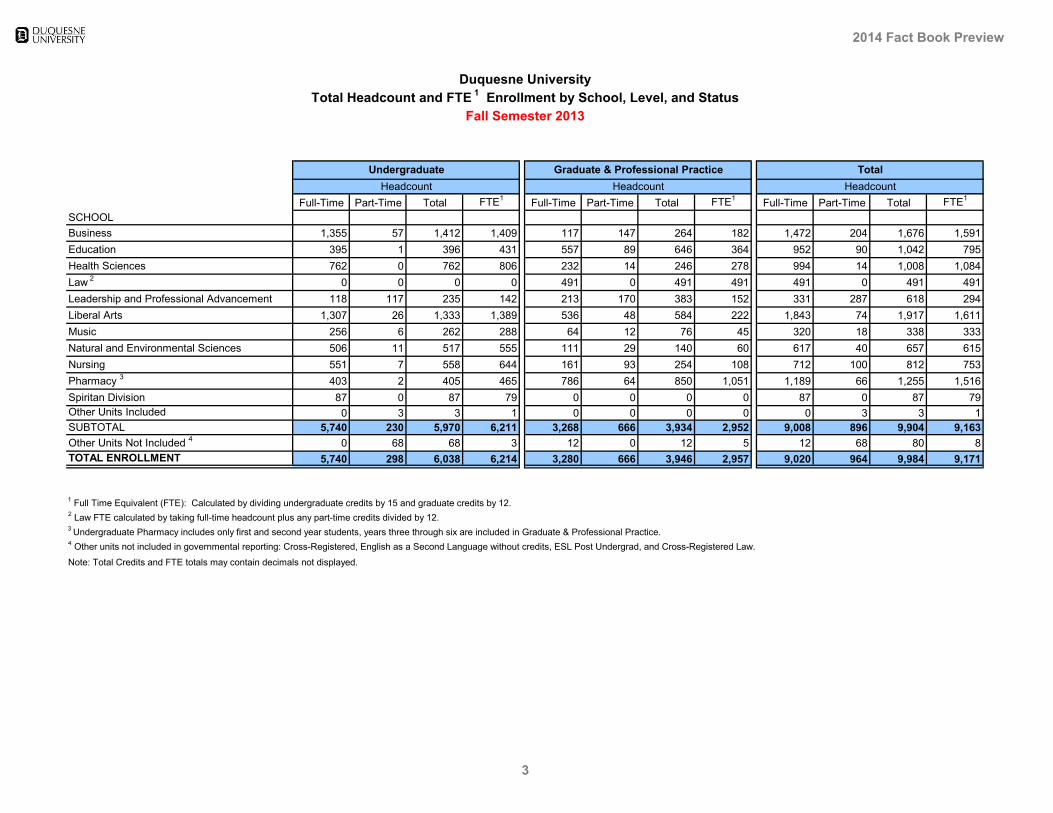
1 Full Time Equivalent (FTE): Calculated by dividing undergraduate credits by 15 and graduate credits by 12.2 Law FTE calculated by taking full-time headcount plus any part-time credits divided by 12.3 Undergraduate Pharmacy includes only first and second year students, years three through six are included in Graduate & Professional Practice.4 Other units not included in governmental reporting: Cross-Registered, English as a Second Language without credits, ESL Post Undergrad, and Cross-Registered Law.
Note: Total Credits and FTE totals may contain decimals not displayed.
Headcount Headcount Headcount
Duquesne UniversityTotal Headcount and FTE 1 Enrollment by School, Level, and Status
Fall Semester 2013
Undergraduate Graduate & Professional Practice Total
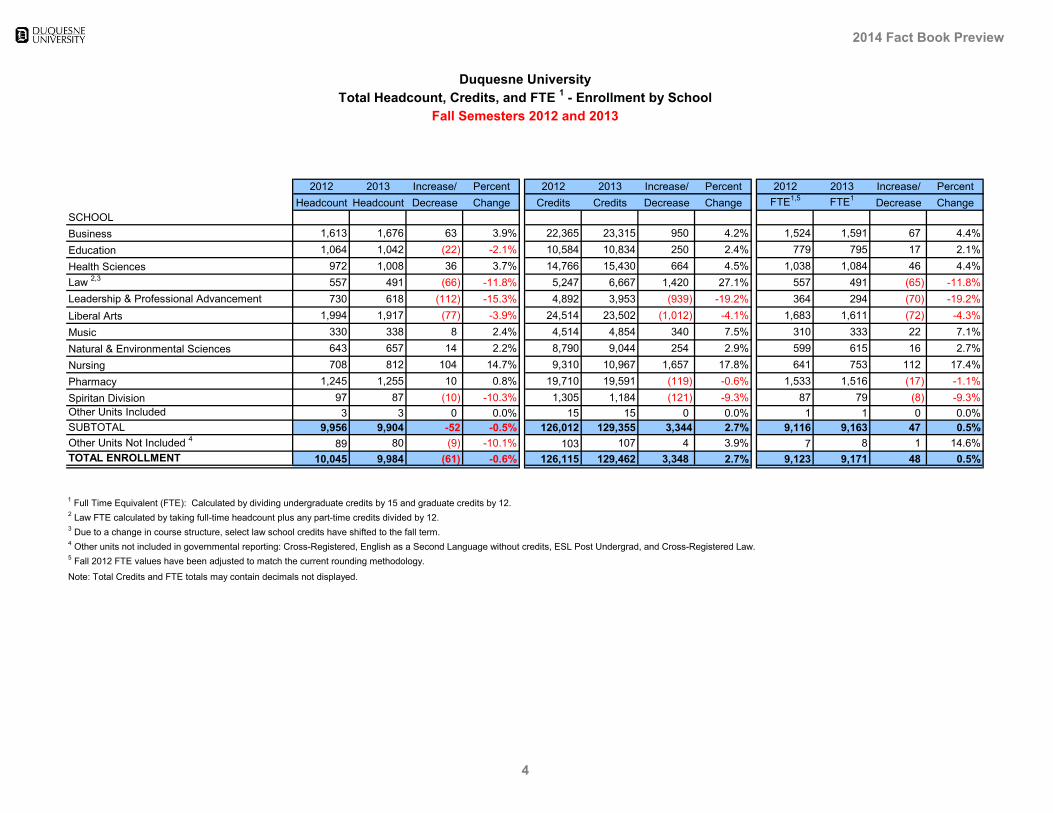
1 Full Time Equivalent (FTE): Calculated by dividing undergraduate credits by 15 and graduate credits by 12.2 Law FTE calculated by taking full-time headcount plus any part-time credits divided by 12.3 Due to a change in course structure, select law school credits have shifted to the fall term.4 Other units not included in governmental reporting: Cross-Registered, English as a Second Language without credits, ESL Post Undergrad, and Cross-Registered Law.5 Fall 2012 FTE values have been adjusted to match the current rounding methodology.
Note: Total Credits and FTE totals may contain decimals not displayed.
Duquesne UniversityTotal Headcount, Credits, and FTE 1 - Enrollment by School
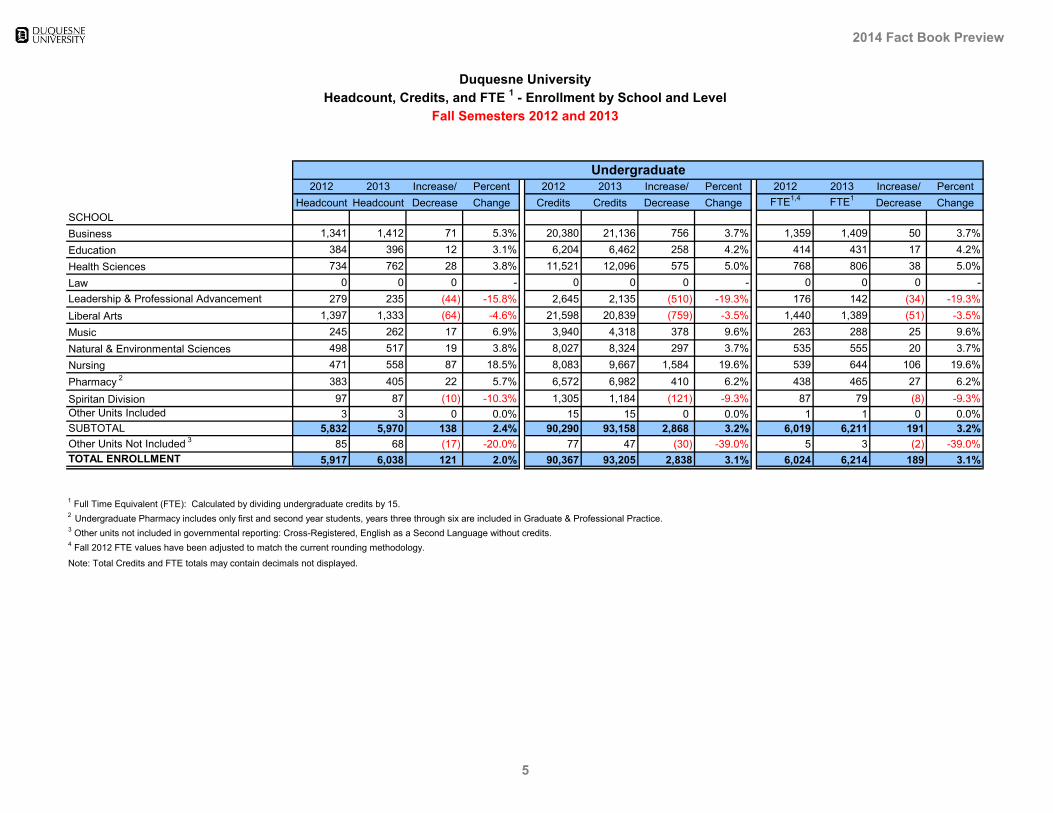
1 Full Time Equivalent (FTE): Calculated by dividing undergraduate credits by 15.2 Undergraduate Pharmacy includes only first and second year students, years three through six are included in Graduate & Professional Practice.3 Other units not included in governmental reporting: Cross-Registered, English as a Second Language without credits.4 Fall 2012 FTE values have been adjusted to match the current rounding methodology.
Note: Total Credits and FTE totals may contain decimals not displayed.
Duquesne UniversityHeadcount, Credits, and FTE 1 - Enrollment by School and Level
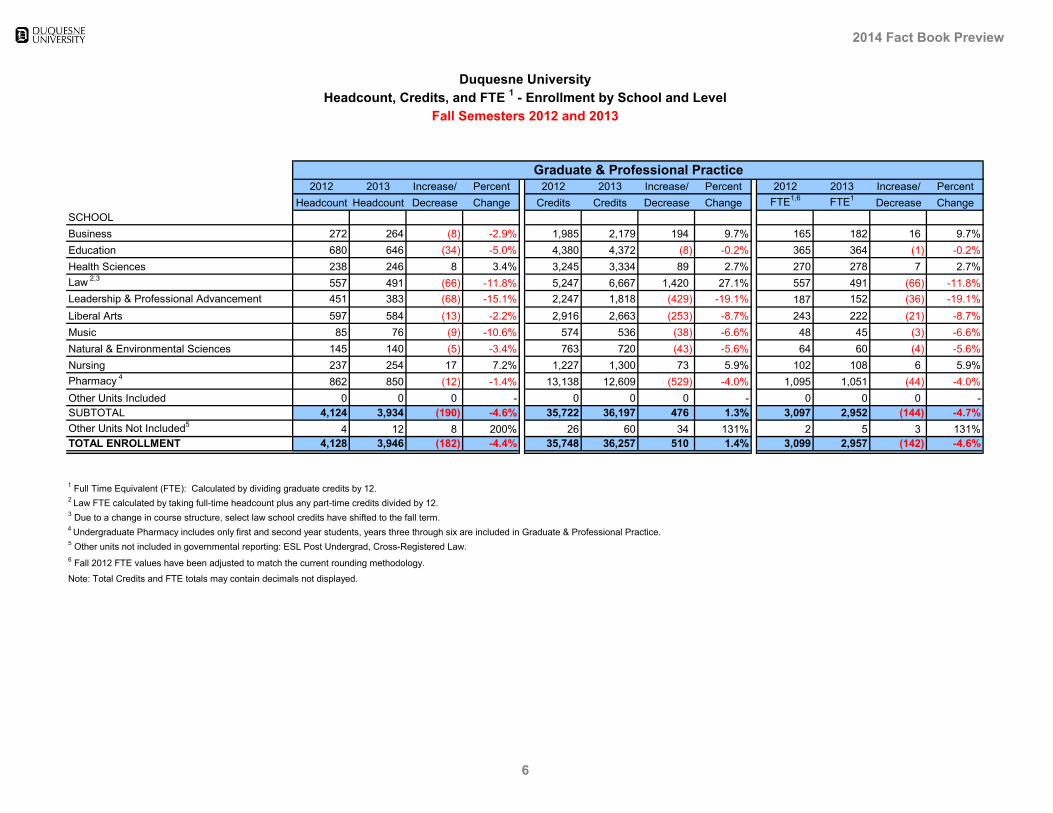
1 Full Time Equivalent (FTE): Calculated by dividing graduate credits by 12.2 Law FTE calculated by taking full-time headcount plus any part-time credits divided by 12.3 Due to a change in course structure, select law school credits have shifted to the fall term.4 Undergraduate Pharmacy includes only first and second year students, years three through six are included in Graduate & Professional Practice.5 Other units not included in governmental reporting: ESL Post Undergrad, Cross-Registered Law.6 Fall 2012 FTE values have been adjusted to match the current rounding methodology.
Note: Total Credits and FTE totals may contain decimals not displayed.
Duquesne UniversityHeadcount, Credits, and FTE 1 - Enrollment by School and Level
Fall Semesters 2012 and 2013
Graduate & Professional Practice
2014 Fact Book Preview
6
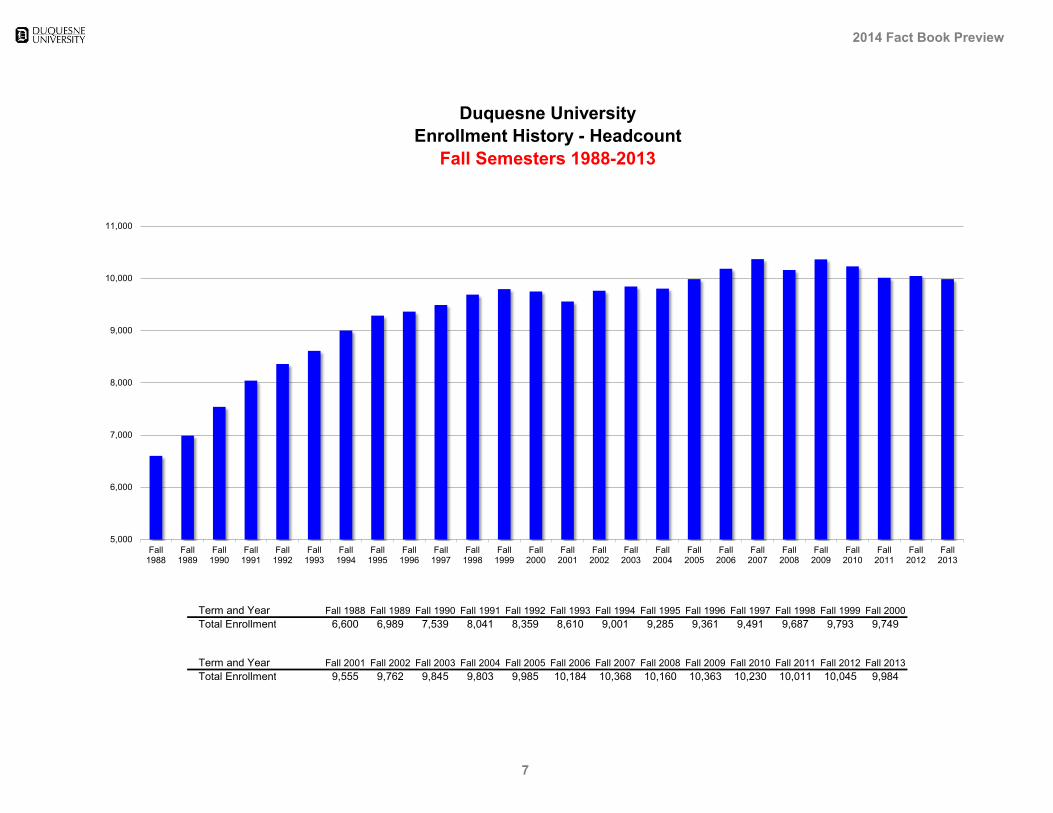
Term and Year Fall 1988 Fall 1989 Fall 1990 Fall 1991 Fall 1992 Fall 1993 Fall 1994 Fall 1995 Fall 1996 Fall 1997 Fall 1998 Fall 1999 Fall 2000 Total Enrollment 6,600 6,989 7,539 8,041 8,359 8,610 9,001 9,285 9,361 9,491 9,687 9,793 9,749
Term and Year Fall 2001 Fall 2002 Fall 2003 Fall 2004 Fall 2005 Fall 2006 Fall 2007 Fall 2008 Fall 2009 Fall 2010 Fall 2011 Fall 2012 Fall 2013 Total Enrollment 9,555 9,762 9,845 9,803 9,985 10,184 10,368 10,160 10,363 10,230 10,011 10,045 9,984
Duquesne UniversityEnrollment History - Headcount
Fall Semesters 1988-2013
5,000
6,000
7,000
8,000
9,000
10,000
11,000
Fall1988
Fall1989
Fall1990
Fall1991
Fall1992
Fall1993
Fall1994
Fall1995
Fall1996
Fall1997
Fall1998
Fall1999
Fall2000
Fall2001
Fall2002
Fall2003
Fall2004
Fall2005
Fall2006
Fall2007
Fall2008
Fall2009
Fall2010
Fall2011
Fall2012
Fall2013
2014 Fact Book Preview
7
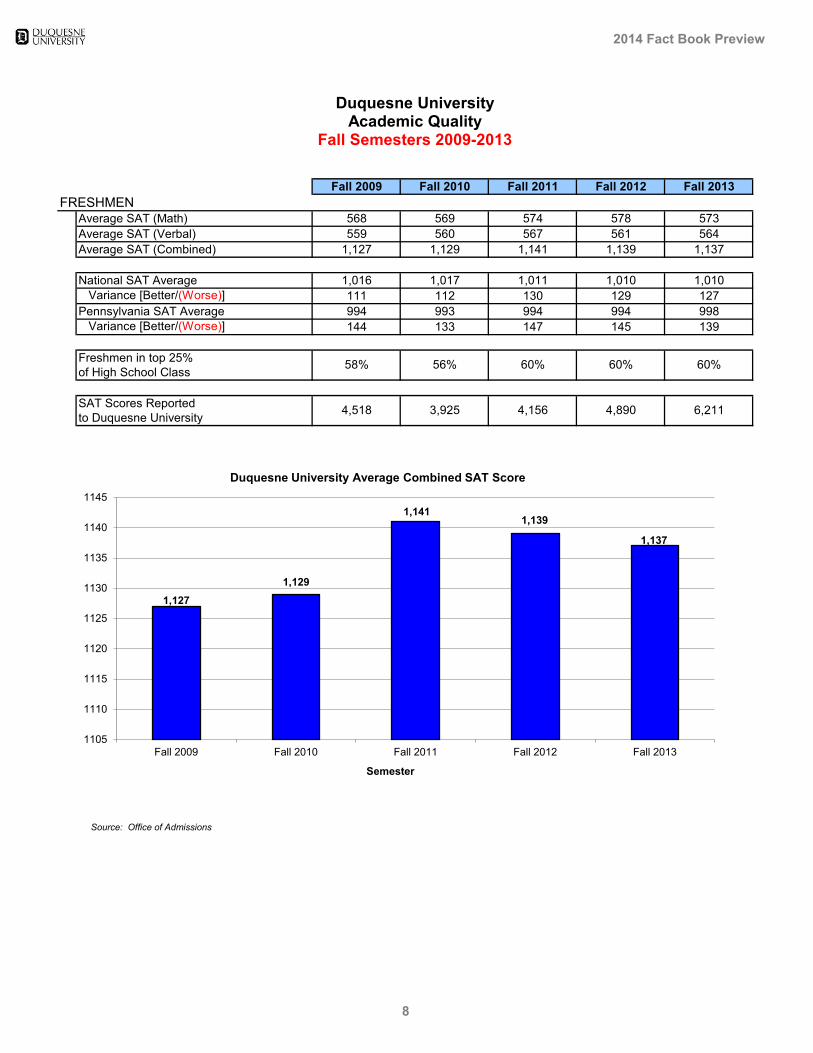
Fall 2009 Fall 2010 Fall 2011 Fall 2012 Fall 2013FRESHMEN
Average SAT (Math) 568 569 574 578 573Average SAT (Verbal) 559 560 567 561 564Average SAT (Combined) 1,127 1,129 1,141 1,139 1,137
National SAT Average 1,016 1,017 1,011 1,010 1,010 Variance [Better/(Worse)] 111 112 130 129 127Pennsylvania SAT Average 994 993 994 994 998 Variance [Better/(Worse)] 144 133 147 145 139
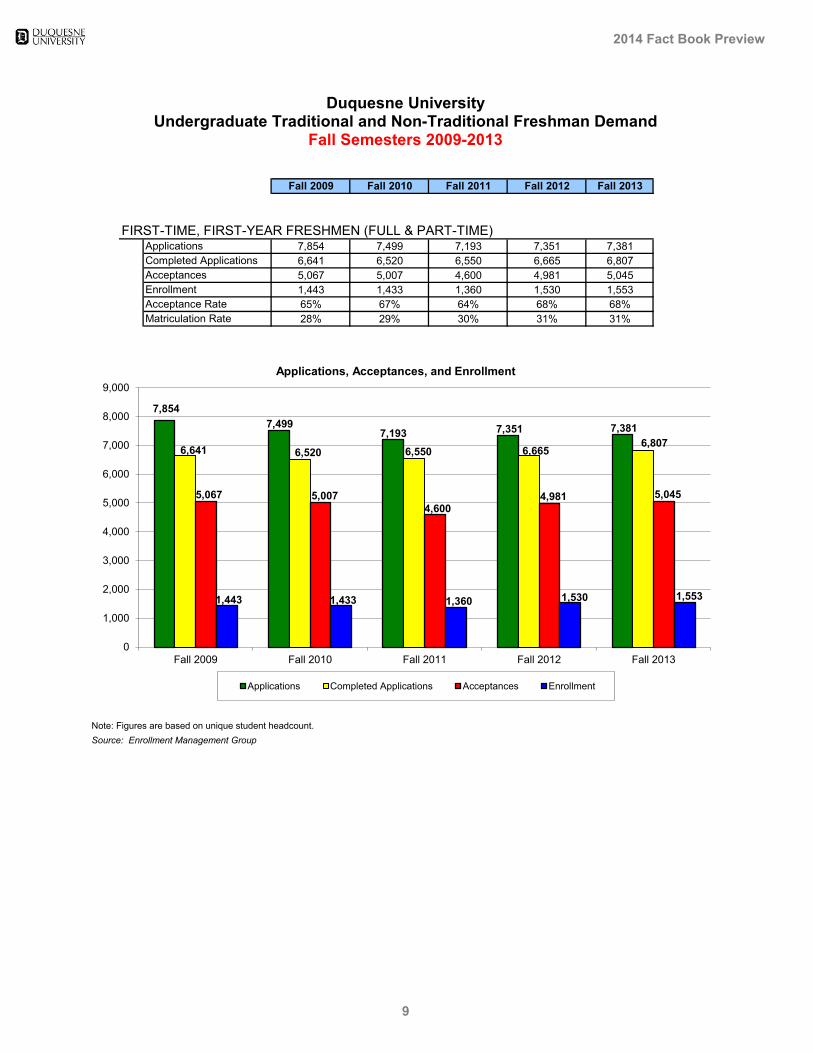
Note: Figures are based on unique student headcount. Due to the nature of program start dates, summer and fall figures are combined above.Source: Enrollment Management Group
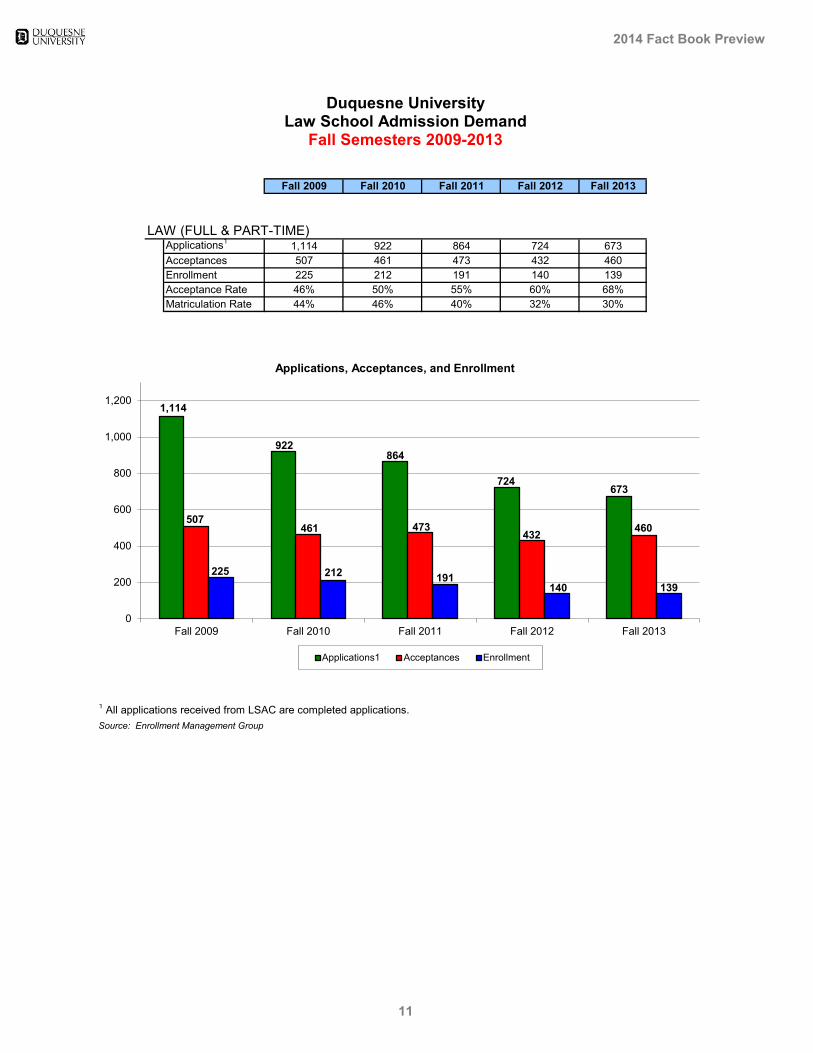
1 All applications received from LSAC are completed applications.Source: Enrollment Management Group
Duquesne UniversityLaw School Admission Demand
Fall Semesters 2009-2013
1,114
922 864
724 673
507 461 473
432 460
225 212 191 140 139
0
200
400
600
800
1,000
1,200
Fall 2009 Fall 2010 Fall 2011 Fall 2012 Fall 2013
Applications, Acceptances, and Enrollment
Applications1 Acceptances Enrollment
2014 Fact Book Preview
11
Non-R Non-Re Y Y Black Black WhiteWhiteAmeric Americ Asian Asian Native H Native Hawaiian or Oth Non-Re Non-Resident AlienM F M F M F M F M F M F M F M F M F M F
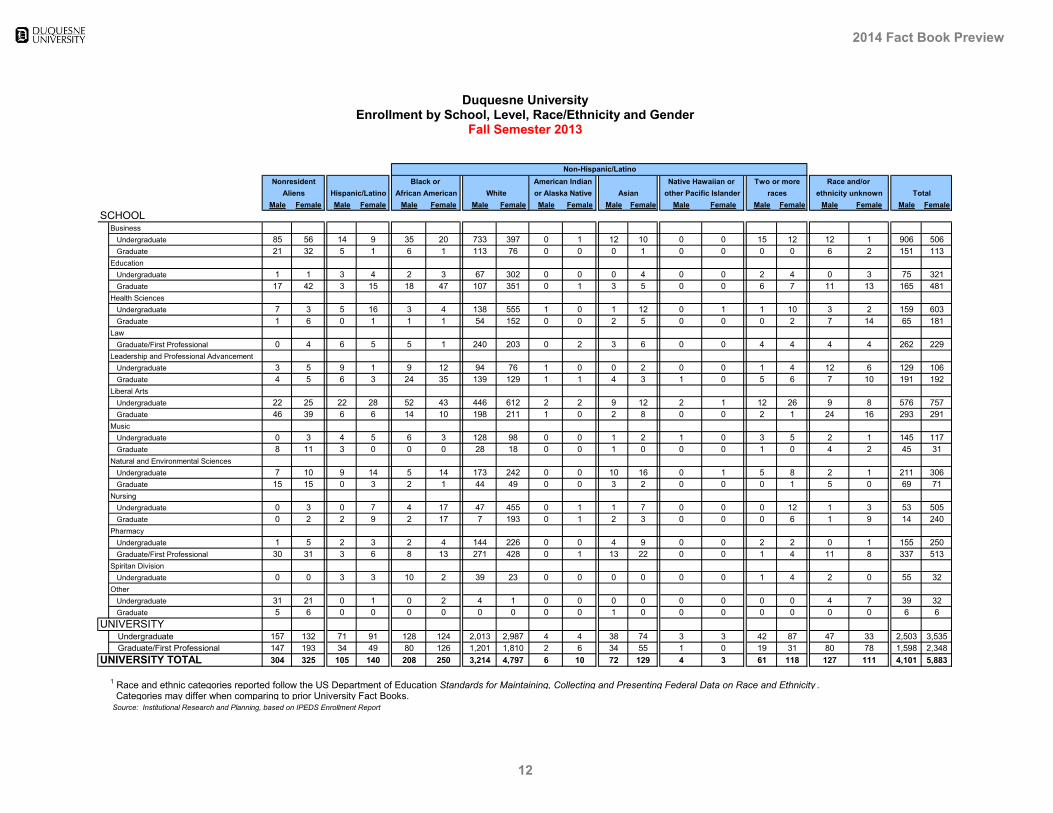
1 Race and ethnic categories reported follow the US Department of Education Standards for Maintaining, Collecting and Presenting Federal Data on Race and Ethnicity . Categories may differ when comparing to prior University Fact Books. Source: Institutional Research and Planning, based on IPEDS Enrollment Report
Aliens Hispanic/Latino African American White
Duquesne UniversityEnrollment by School, Level, Race/Ethnicity and Gender
Fall Semester 2013
Non-Hispanic/LatinoNonresident Black or American Indian
or Alaska Native racesAsian other Pacific Islander ethnicity unknown TotalNative Hawaiian or Two or more Race and/or
2014 Fact Book Preview
12
Bachelor's Master's Doctoral & Professional Practice Certificates Total
Seton Hall University 1 $119.5 $83.9 $67.0 27% 12 $87.1 13 $61.2 13 $48.8
St. John's University $150.8 $106.9 $88.0 58% 15 $63.3 15 $44.8 16 $36.9
University of San Diego $126.8 $90.4 $82.2 28% 11 $90.9 11 $64.8 11 $58.9
University of San Francisco $143.3 $106.4 $88.1 42% 13 $82.9 12 $61.6 12 $51.0
University of St. Thomas $111.7 $83.9 $76.7 13% 10 $97.7 7 $73.4 6 $67.1
Note: Cost of living adjustment was derived by utilizing Bankrate's "Cost of Living Comparison Calculator" on April 10, 2013. Bankrate's calculator utilizes data from the Cost of Living Index (COLI) which is considered
a reliable source of city-to-city comparisons of key consumer costs. COLI data is recognized by the U.S. Census Bureau, US Bureau of Labor Statistics, and the President's Council of Economic Advisors. 1 2011-2012 data as school did not particpate in 2012-2013 AAUP survey.
Sources : AAUP Faculty Salary Survey; Carnegie Foundation for the Advancement of Teaching; Office of Planning, Budgeting, and Institutional Research
Salaries Reported by AAUP Equivalent Income in Pittsburgh
2014 Fact Book Preview
15
Academic Year Professor Associate Professor Assistant Professor Instructor
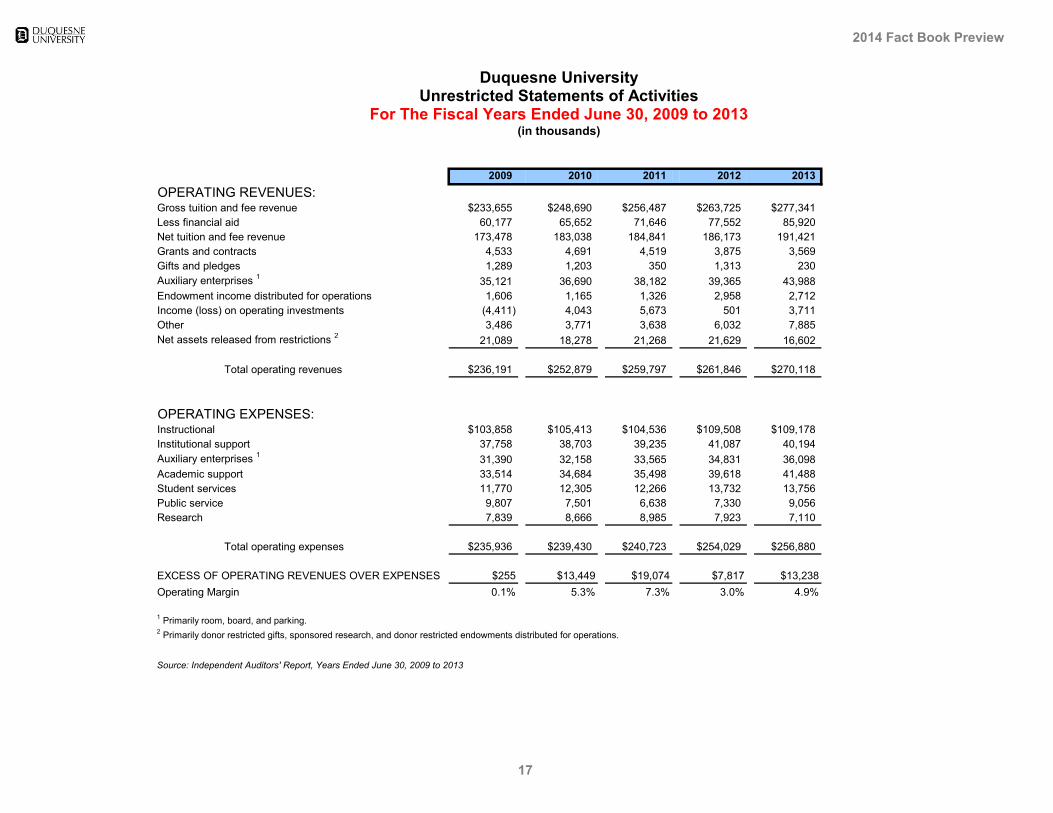
Total operating expenses $235,936 $239,430 $240,723 $254,029 $256,880
EXCESS OF OPERATING REVENUES OVER EXPENSES $255 $13,449 $19,074 $7,817 $13,238Operating Margin 0.1% 5.3% 7.3% 3.0% 4.9%
1 Primarily room, board, and parking.2 Primarily donor restricted gifts, sponsored research, and donor restricted endowments distributed for operations.
Source: Independent Auditors' Report, Years Ended June 30, 2009 to 2013
Duquesne UniversityUnrestricted Statements of Activities
For The Fiscal Years Ended June 30, 2009 to 2013(in thousands)
2014 Fact Book Preview
17
2009 2010 2011 2012 2013
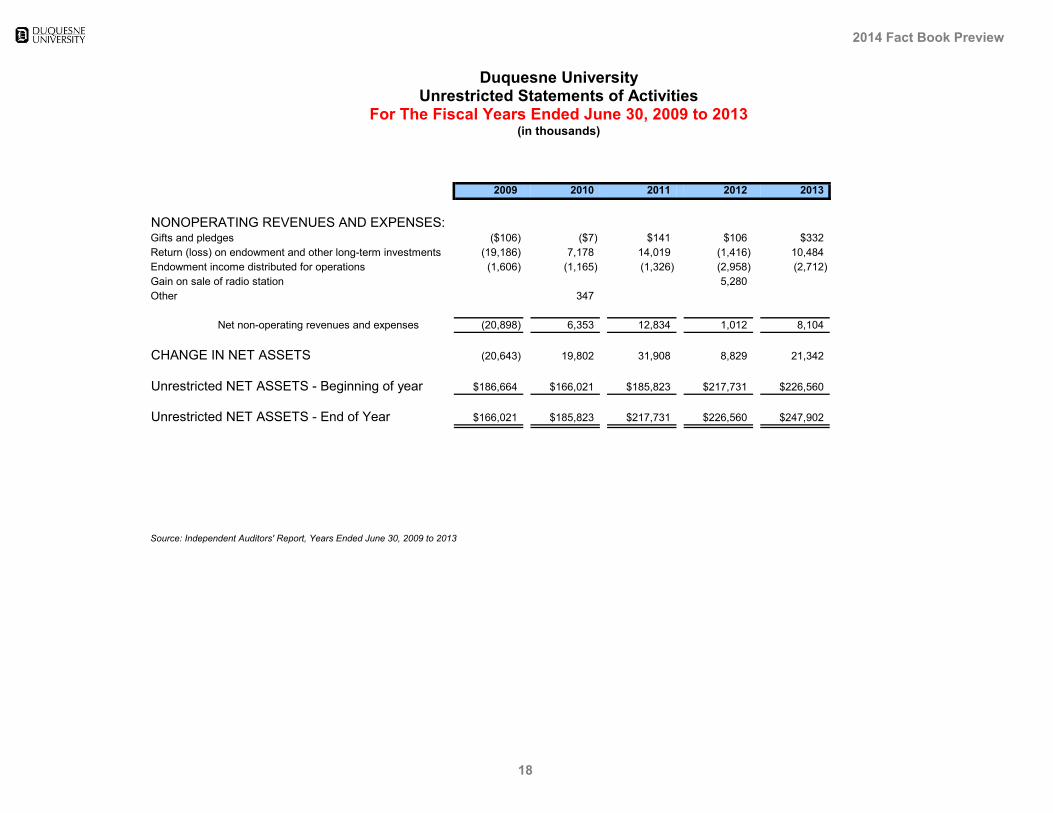
NONOPERATING REVENUES AND EXPENSES:Gifts and pledges ($106) ($7) $141 $106 $332Return (loss) on endowment and other long-term investments (19,186) 7,178 14,019 (1,416) 10,484Endowment income distributed for operations (1,606) (1,165) (1,326) (2,958) (2,712)Gain on sale of radio station 5,280Other 347
Net non-operating revenues and expenses (20,898) 6,353 12,834 1,012 8,104
CHANGE IN NET ASSETS (20,643) 19,802 31,908 8,829 21,342
Unrestricted NET ASSETS - Beginning of year $186,664 $166,021 $185,823 $217,731 $226,560
Unrestricted NET ASSETS - End of Year $166,021 $185,823 $217,731 $226,560 $247,902
Source: Independent Auditors' Report, Years Ended June 30, 2009 to 2013
Duquesne UniversityUnrestricted Statements of Activities
For The Fiscal Years Ended June 30, 2009 to 2013(in thousands)
2014 Fact Book Preview
18
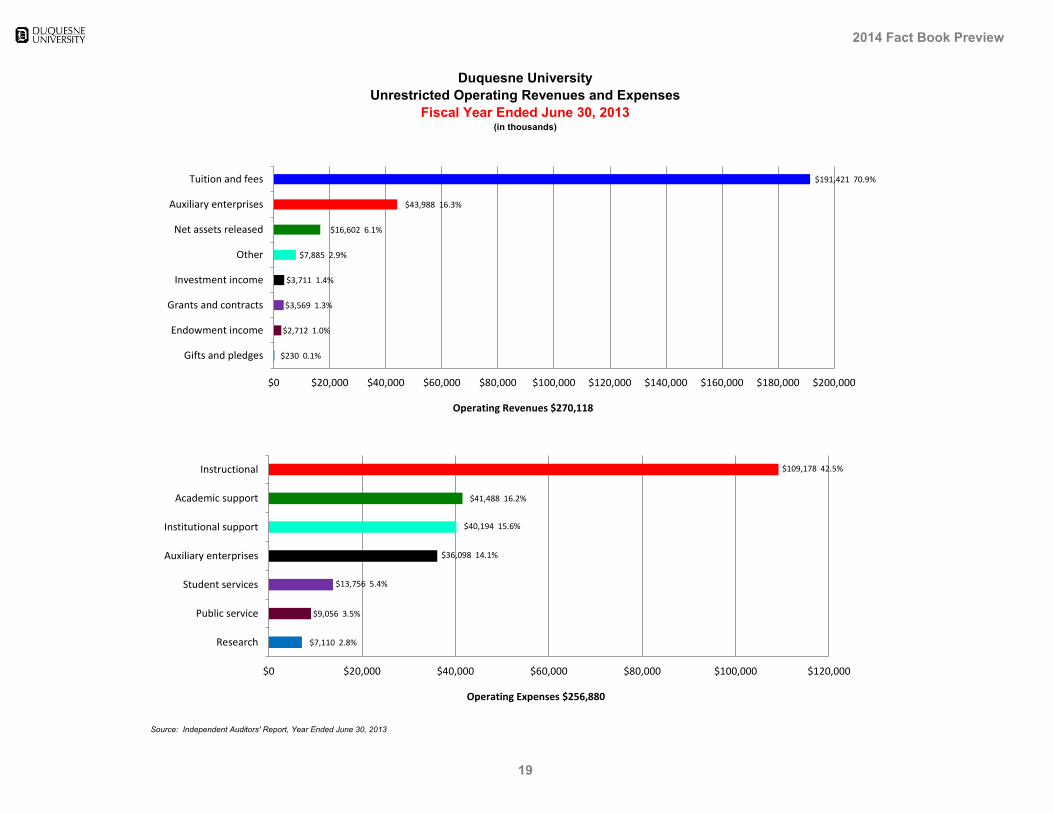
Duquesne UniversityUnrestricted Operating Revenues and Expenses
Fiscal Year Ended June 30, 2013(in thousands)
Source: Independent Auditors' Report, Year Ended June 30, 2013
1 Brottier is an apartment-style residence hall, therefore bed count is actual capacity count.
Source: Office of Residence Life; Office of Institutional Research and Planning
Beds Available
byType/
Capacity
BedsOccupied
byType
2 Due to increased demand, modified triple and quad housing was created in Assumption Hall, St. Ann Hall, Des Places Hall, and Vickroy Hall. Additional Temporary housing was used in Assumption Hall and the Muldoon Building. These changes created an additional 218 beds to reach the available capacity of 4,000. 3 Headcount by classification is from student's self-reported, signed Verified Floor Rosters. This may not be consistent with headcount by classification based on earned credits reported in sections of the University Fact Book.