FACT: The Earth is getting warmer. - Weather is the set of all extant phenomena in a given atmosphere at a given time. - Climate is the average and variations of weather in a region over long periods of time.
Transcript
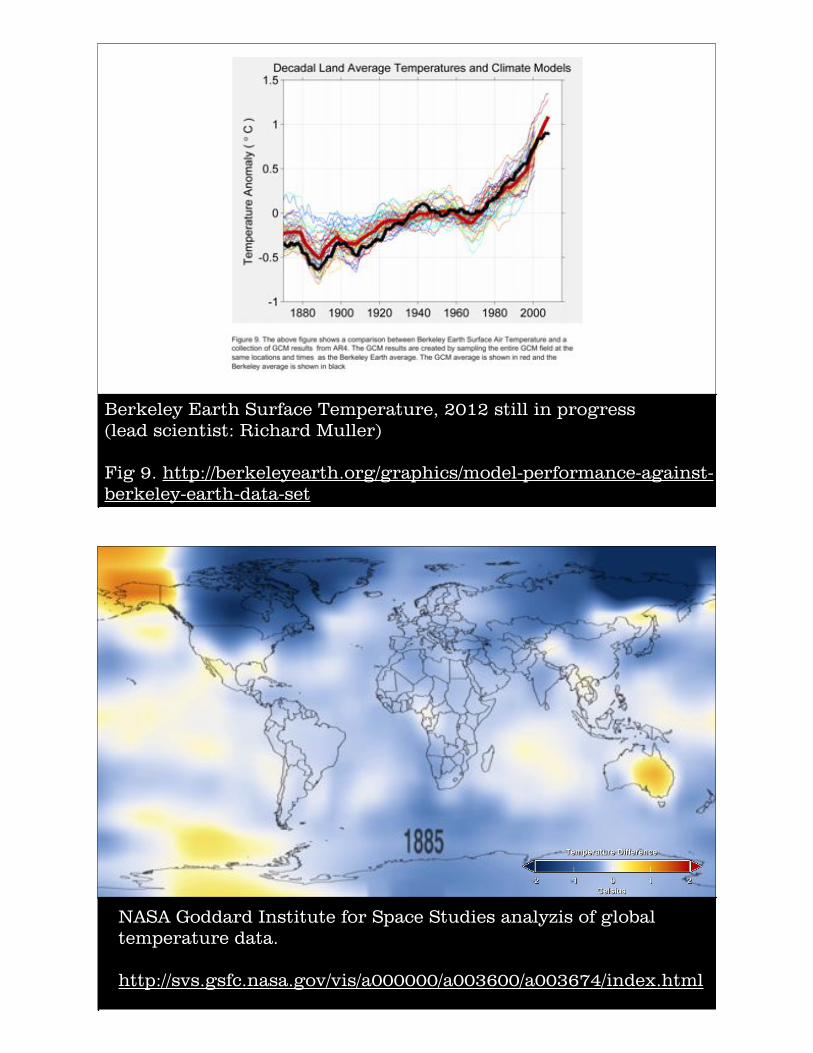
FACT: The Earth is getting warmer.
- Weather is the set of all extant phenomena in a given atmosphere at a given time.
- Climate is the average and variations of weather in a region over long periods of time.
Instrumental records: 1st example (1659) Quasi-global (~1850s)International Meterorological Organization (1873) World Meteorological Organization (1950)
FACT: There is more CO2 in the Earth’s atmosphere. Much of this is due to human activity.
CO2 historical trends
Ice Cores as example of Proxy Datahttp://www.climatedata.info/Proxy/Proxy/icecores.html
Carbon Cycle logistics.
Can track C from fossil fuel burning to see how much (or how quick) the cycle operates.
FAQ6.1. Fig 1, AR5 FAQ6.2. Fig 1, AR5
FACT: The Earth is getting warmer.
FACT: There is more CO2 in the Earth’s atmosphere. Much of this is due to human activity.
FACT: CO2 is a greenhouse gas.
It all starts with the Sun
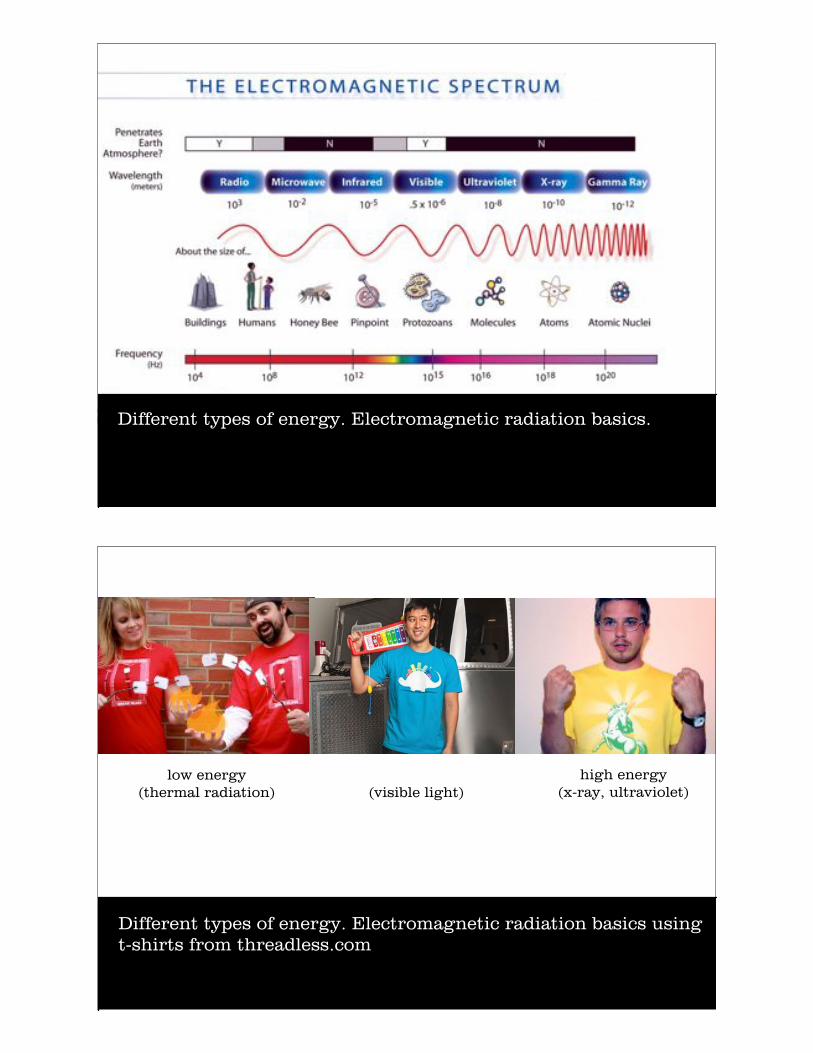
Different types of energy. Electromagnetic radiation basics.
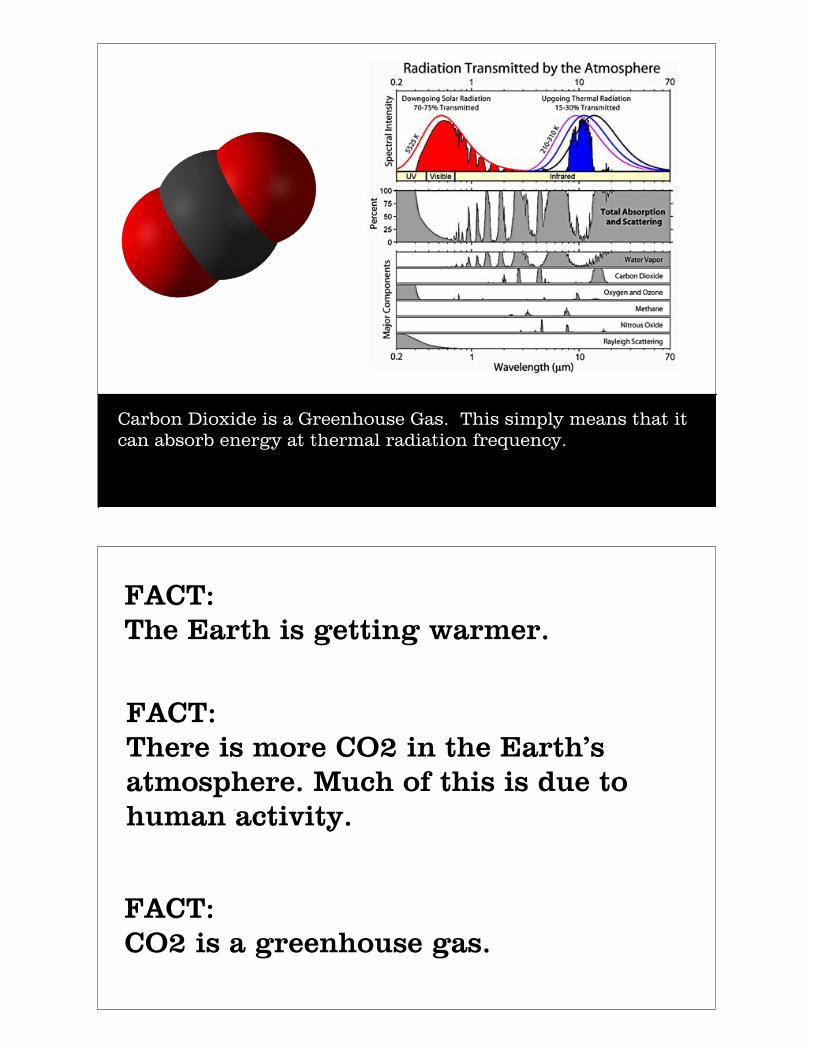
Different types of energy. Electromagnetic radiation basics using t-shirts from threadless.com
high energy(x-ray, ultraviolet)(visible light)
low energy(thermal radiation)
A little quantum stuff thrown in.
Key thing is that energy can be absorbed and re-emitted
Different types of energy. Electromagnetic radiation basics using t-shirts from threadless.com
Key thing is that energy can be absorbed and re-emitted
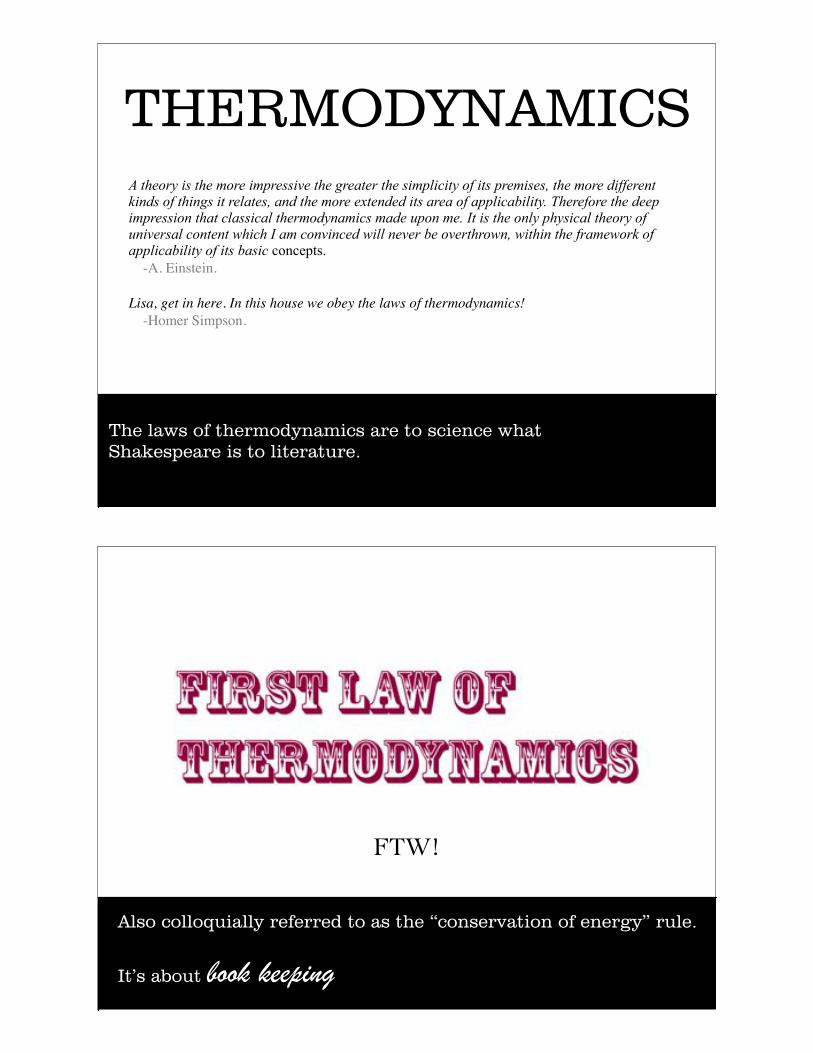
Carbon Dioxide is a Greenhouse Gas. This simply means that it can absorb energy at thermal radiation frequency.
FACT: The Earth is getting warmer.
FACT: There is more CO2 in the Earth’s atmosphere. Much of this is due to human activity.
FACT: CO2 is a greenhouse gas.
HOW TO GET YOUR OWN SCIENTIFIC EPONYM
“Human nature is complex, fickle and strange. But there is one constant in people’s mercurial ways: people like to have things named after themselves.”
HYPOTHESIS: The increase in temperature is largely due to the anthropogenic production of CO2.
FACTS: The Earth is getting warmer.
There is more CO2 in the Earth’s atmosphere. Much of this is due to human activity.
CO2 is a greenhouse gas.
HYPOTHESIS: The increase in temperature is largely due to the anthropogenic production of CO2.
HYPOTHESIS: The increase in temperature is largely due to the anthropogenic production of CO2.
Ask your phone (or google): What is the answer to life, the universe, and everything?
A theory is the more impressive the greater the simplicity of its premises, the more different kinds of things it relates, and the more extended its area of applicability. Therefore the deep impression that classical thermodynamics made upon me. It is the only physical theory of universal content which I am convinced will never be overthrown, within the framework of applicability of its basic concepts. -A. Einstein.
Lisa, get in here. In this house we obey the laws of thermodynamics! -Homer Simpson.
The laws of thermodynamics are to science what Shakespeare is to literature.
THERMODYNAMICS
FTW!
Also colloquially referred to as the “conservation of energy” rule.
It’s about �����������
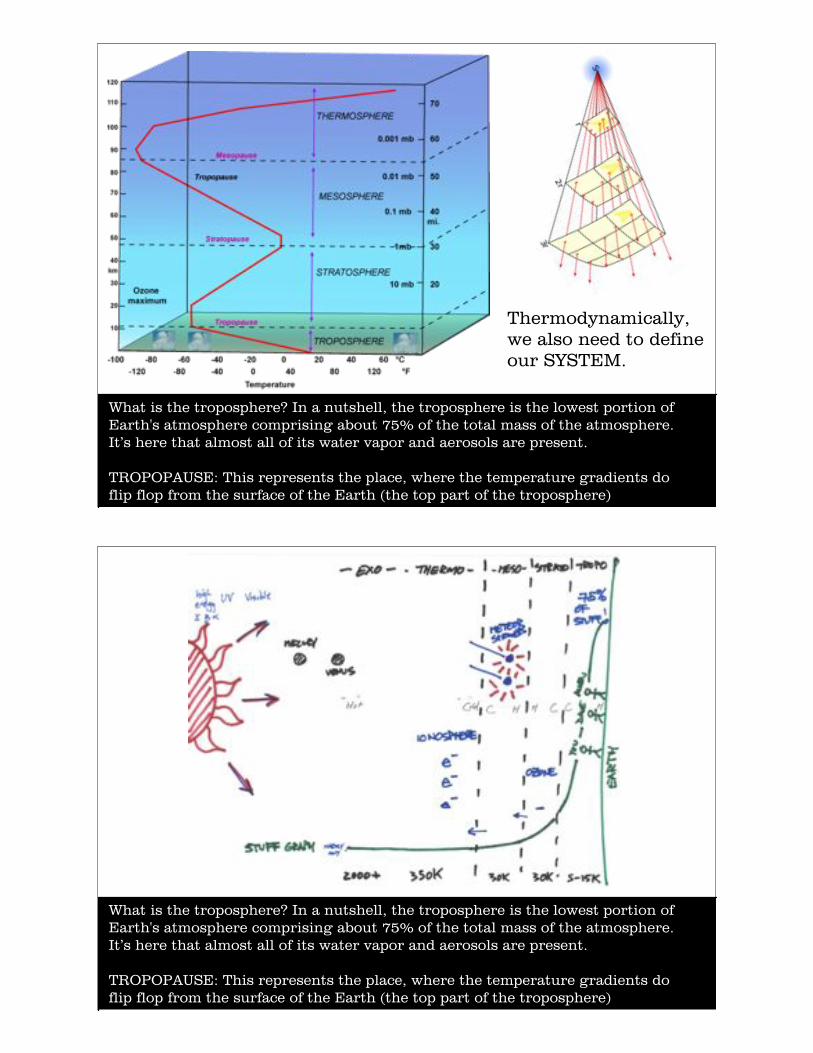
What is the troposphere? In a nutshell, the troposphere is the lowest portion of Earth's atmosphere comprising about 75% of the total mass of the atmosphere. It’s here that almost all of its water vapor and aerosols are present.
TROPOPAUSE: This represents the place, where the temperature gradients do flip flop from the surface of the Earth (the top part of the troposphere)
Thermodynamically, we also need to define our SYSTEM.
What is the troposphere? In a nutshell, the troposphere is the lowest portion of Earth's atmosphere comprising about 75% of the total mass of the atmosphere. It’s here that almost all of its water vapor and aerosols are present.
TROPOPAUSE: This represents the place, where the temperature gradients do flip flop from the surface of the Earth (the top part of the troposphere)
TIME FOR CHARADES!
I NEED TWO TEAMS OF 5 TO GO HEAD TO HEAD.
VOLUNTEERS?
Some units of note:
m = distance in metress = time in secondskg = mass in kilograms
Velocity = v = m/s
2Acceleration = a = v/s = m/s
Work = W = F d = kg m m/s2.. = kg m /s2 2.. (Joule - unit of Energy)
Power = P = W/s = kg m /s s = kg m /s. . .2 2 2 3 (Watt)
Force = F = ma = kg m/s. 2 (Newton)
Being able to book-keep energy infers being able to track and measure it too.
The flowchart...(Fig 2.11 AR5, Chapter 2)
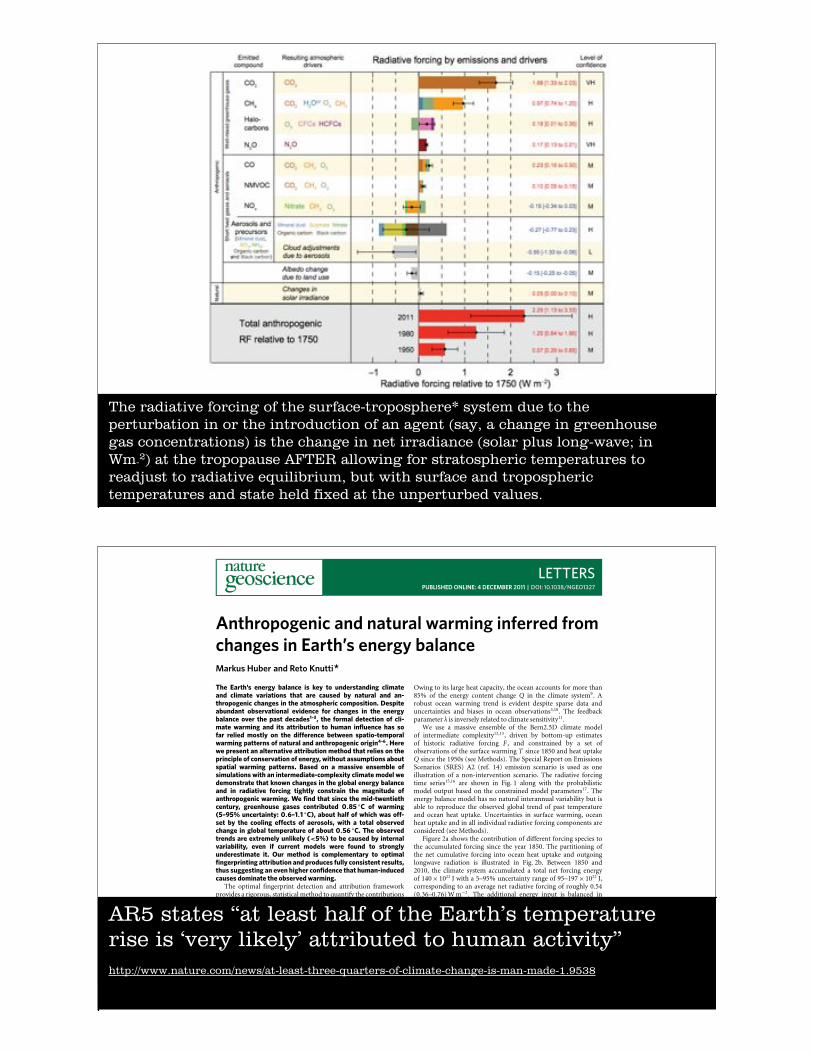
The radiative forcing of the surface-troposphere* system due to the perturbation in or the introduction of an agent (say, a change in greenhouse gas concentrations) is the change in net irradiance (solar plus long-wave; in Wm-2) at the tropopause AFTER allowing for stratospheric temperatures to readjust to radiative equilibrium, but with surface and tropospheric temperatures and state held fixed at the unperturbed values.
LETTERSPUBLISHED ONLINE: 4 DECEMBER 2011 | DOI: 10.1038/NGEO1327
Anthropogenic and natural warming inferred fromchanges in Earth’s energy balanceMarkus Huber and Reto Knutti*The Earth’s energy balance is key to understanding climateand climate variations that are caused by natural and an-thropogenic changes in the atmospheric composition. Despiteabundant observational evidence for changes in the energybalance over the past decades1–3, the formal detection of cli-mate warming and its attribution to human influence has sofar relied mostly on the difference between spatio-temporalwarming patterns of natural and anthropogenic origin4–6. Herewe present an alternative attribution method that relies on theprinciple of conservation of energy, without assumptions aboutspatial warming patterns. Based on a massive ensemble ofsimulations with an intermediate-complexity climate model wedemonstrate that known changes in the global energy balanceand in radiative forcing tightly constrain the magnitude ofanthropogenic warming. We find that since the mid-twentiethcentury, greenhouse gases contributed 0.85 �C of warming(5–95% uncertainty: 0.6–1.1 �C), about half of which was off-set by the cooling effects of aerosols, with a total observedchange in global temperature of about 0.56 �C. The observedtrends are extremely unlikely (<5%) to be caused by internalvariability, even if current models were found to stronglyunderestimate it. Our method is complementary to optimalfingerprinting attribution and produces fully consistent results,thus suggesting an even higher confidence that human-inducedcauses dominate the observedwarming.
The optimal fingerprint detection and attribution frameworkprovides a rigorous, statistical method to quantify the contributionsof different external forcings and internal variability to the observedclimate changes7. In essence, it is based on a regression of theobservations onto model simulated patterns and relies on thespatio-temporal response patterns from different forcings beingclearly distinct. The assumptions are that climate models simulatethe spatial patterns reasonably well and that regional responsesfrom different forcings can be scaled and combined linearly. Theglobal energy budget is not necessarily conserved and observedchanges in the energy budget are not considered. Previous studiesshowed that observed patterns of surface air temperature provide aconstraint on the human contribution to the observed warming4.Here we demonstrate that the global energy balance provides afurther strong, comprehensive andphysicallymotivated constraint.
In equilibrium, the Earth emits as much energy by outgoinglongwave radiation at the top of the atmosphere as it receivesnet shortwave radiation from the sun. Robust evidence forrecent deviations from that equilibrium comes from a variety ofobservations and model simulations1,8. The most likely value ofthe current net radiative forcing F is estimated at 1.6Wm�2,compensated by further outgoing longwave radiation ⌦T and energyuptake of the planet Q:
F =Q+⌦T (1)
Institute for Atmospheric and Climate Science, ETH Zurich, Universitätstrasse 16, 8092 Zurich, Switzerland. *e-mail: [email protected].
Owing to its large heat capacity, the ocean accounts for more than85% of the energy content change Q in the climate system9. Arobust ocean warming trend is evident despite sparse data anduncertainties and biases in ocean observations3,10. The feedbackparameter ⌦ is inversely related to climate sensitivity11.
We use a massive ensemble of the Bern2.5D climate modelof intermediate complexity12,13, driven by bottom-up estimatesof historic radiative forcing F , and constrained by a set ofobservations of the surface warming T since 1850 and heat uptakeQ since the 1950s (see Methods). The Special Report on EmissionsScenarios (SRES) A2 (ref. 14) emission scenario is used as oneillustration of a non-intervention scenario. The radiative forcingtime series15,16 are shown in Fig. 1 along with the probabilisticmodel output based on the constrained model parameters17. Theenergy balance model has no natural interannual variability but isable to reproduce the observed global trend of past temperatureand ocean heat uptake. Uncertainties in surface warming, oceanheat uptake and in all individual radiative forcing components areconsidered (see Methods).
Figure 2a shows the contribution of different forcing species tothe accumulated forcing since the year 1850. The partitioning ofthe net cumulative forcing into ocean heat uptake and outgoinglongwave radiation is illustrated in Fig. 2b. Between 1850 and2010, the climate system accumulated a total net forcing energyof 140⇥1022 J with a 5–95% uncertainty range of 95–197⇥1022 J,corresponding to an average net radiative forcing of roughly 0.54(0.36–0.76)Wm�2. The additional energy input is balanced innearly equal parts by ocean heat uptake and outgoing longwaveradiation. About 83% of the accumulated energy from carbondioxide forcing alone of 164 (151–178) ⇥ 1022 J is offset bythe combined negative direct and indirect effect of aerosols.However, there are large uncertainties for the radiative forcingof aerosols, in particular for the indirect effect. The negativeforcings of stratospheric ozone, black and organic carbon, as wellas the positive forcings of stratospheric water vapour and nitrousoxide, play only a minor role in the cumulative forcing budget.The positive and negative non-CO2 forcings are also of similarmagnitude. For an A2 scenario, the historic cumulative forcingwould be doubled in the next 33 (28–38) years and tripled in52 (45–60) years.
The model results for 1950–2004 are shown in Fig. 2c,d andcompare very well with recent observational estimates2, partly asa result of calibrating the model to the observed total ocean andsurface warming. Although the estimates for most forcing agentsare similar, we infer a larger energy flux from variations in solarirradiance as a result of the particular forcing reconstruction used.If anything our estimate of the solar contribution is likely tobe overestimated (see Methods). Ocean heat uptake for 3,000mdepth is also larger, but the model is only constrained usingdata to 700m depth. Furthermore, uncertainties in ocean heat
AR5 states “at least half of the Earth’s temperature rise is ‘very likely’ attributed to human activity”http://www.nature.com/news/at-least-three-quarters-of-climate-change-is-man-made-1.9538
HYPOTHESES: The increase in temperature is largely due to the anthropogenic production of CO2.
These greenhouse gas amounts and increases in temperature will lead to predictable (and bad) effects to the planet and its inhabitants.
FACTS: The Earth is getting warmer.
There is more CO2 in the Earth’s atmosphere. Much of this is due to human activity.
CO2 is a greenhouse gas.
HYPOTHESIS: These greenhouse gas amounts and increases in temperature will lead to predictable (and bad) effects to the planet and its inhabitants.
HYPOTHESIS: These greenhouse gas amounts and increases in temperature will lead to predictable (and bad) effects to the planet and its inhabitants.
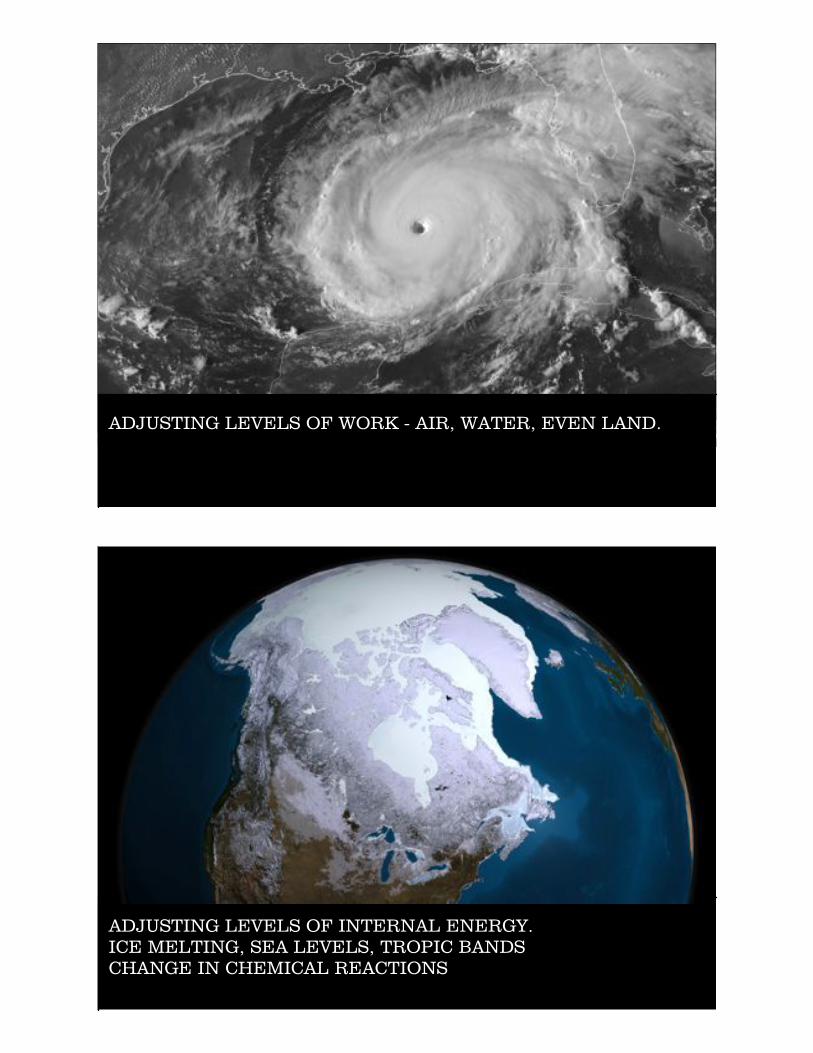
In short: dU = internal energy dQ = heat dW = work
ADJUSTING LEVELS OF WORK - AIR, WATER, EVEN LAND.
ADJUSTING LEVELS OF INTERNAL ENERGY.ICE MELTING, SEA LEVELS, TROPIC BANDSCHANGE IN CHEMICAL REACTIONS
Boyles Law:P = Pressure, V = Volume, N = number of molecules of gasR = a constant to tie it all together (8.314472 m3 . Pa . K-1 . mol-1)T = Temperature
demo
Boyles Law:P = Pressure, V = Volume, N = number of molecules of gasR = a constant to tie it all together (8.314472 m3 . Pa . K-1 . mol-1)T = Temperature
This is what you get when you combine the First Law of Thermodynamics with Boyles Law. This is often referred to as a formal rendition of the the 1st Law for atmospheric considerations.
dq = cv,m dT + Pa dV Ma
.
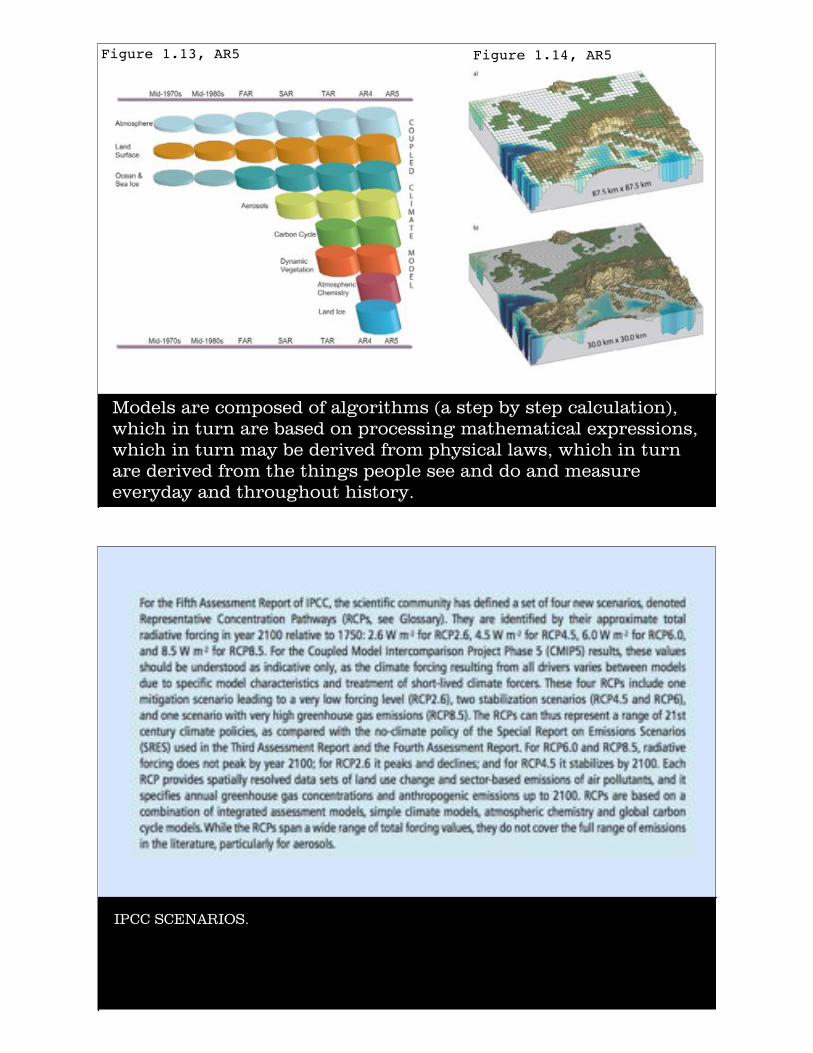
Models are composed of algorithms (a step by step calculation), which in turn are based on processing mathematical expressions, which in turn may be derived from physical laws, which in turn are derived from the things people see and do and measure everyday and throughout history.
“The models used in climate research range from simple energy balance models to complex Earth System Models (ESMs) requiring state of the art high-performance computing. The choice of model depends directly on the scientific question being addressed (Held, 2005; Collins et al., 2006d). Applications include simulating palaeo or historical climate, sensitivity and process studies for attribution and physical understanding, predicting near-term climate variability and change on seasonal to decadal time scales, making projections of future climate change over the coming century or more, and downscaling such projections to provide more detail at the regional and local scale. “
AR5, Chapter 9.
Models are composed of algorithms (a step by step calculation), which in turn are based on processing mathematical expressions, which in turn may be derived from physical laws, which in turn are derived from the things people see and do and measure everyday and throughout history.
Figure 1.13, AR5 Figure 1.14, AR5
IPCC SCENARIOS.
VALIDATING MODELS. (I.E. HOW DO YOU TRUST MODELS?)
SIMPLE VERSUS COMPLEX. BEST MODELS ARE THE ONES THAT FIT REALITY.
“Firstly, it can be run for a number of years over simulated time and the climate generated by the model compared in detail to the current climate.”Here, a valid model is one where average distribution and season variations of appropriate parameters such as surface pressure, temperature and rainfall compare well. As well, noted variability in the model should coincide well with variability in the observed situation as well.
“Secondly, models can be compared against simulations of past climates when distribution of key variables was substantially different than at present.”An example would be about 9000 years ago, where the Earth’s orbit in relation to the sun was slightly different. The axis of rotation was basically tilted 24o rather than the current 23.5o. Enough, however, to obviously affect the distribution of solar energy to the surface of the planet. Now meteorological data is obviously weaker for those type of timescales but there is data that (ice core data, vegetation fossilization patterns, etc).
“Thirdly, a model can be validated by usage in predicting the effect of large perturbations on the climate.” i.e. El Nino, large volcanic eruptions... (like mount Pinatubo 1991 / second largest eruption in 20th century).
SO WHAT DOES THE FUTURE HOLD?
ANYWAY...
FACTS: The Earth is getting warmer.
There is more CO2 in the Earth’s atmosphere. Much of this is due to human activity.
CO2 is a greenhouse gas.
HYPOTHESES: The increase in temperature is largely due to the anthropogenic production of CO2.
These greenhouse gas amounts and increases in temperature will lead to predictable (and bad) effects to the planet and its inhabitants.
CONSEQUENCES:Read the IPCC report AR5 (Summary for Policy Makers)