52
FACTBOOK 2020 columbus.gov/econdev

FACTBOOK 2020
columbus.gov/econdev


Regional Overview • 3
Industry & Workforce Overview • 5
Science and Technology • 9
Logistics • 12
Manufacturing • 15
Headquarters & Business Services • 18
International Business • 21
Population • 23
Workforce • 24
Education and Research • 25
Cost of Doing Business • 30
Real Estate and Utilities • 33
Transportation & Communications Network • 34
Quality of Life • 40
Affordability • 45
TABLE OF CONTENTS
columbus.gov/econdev
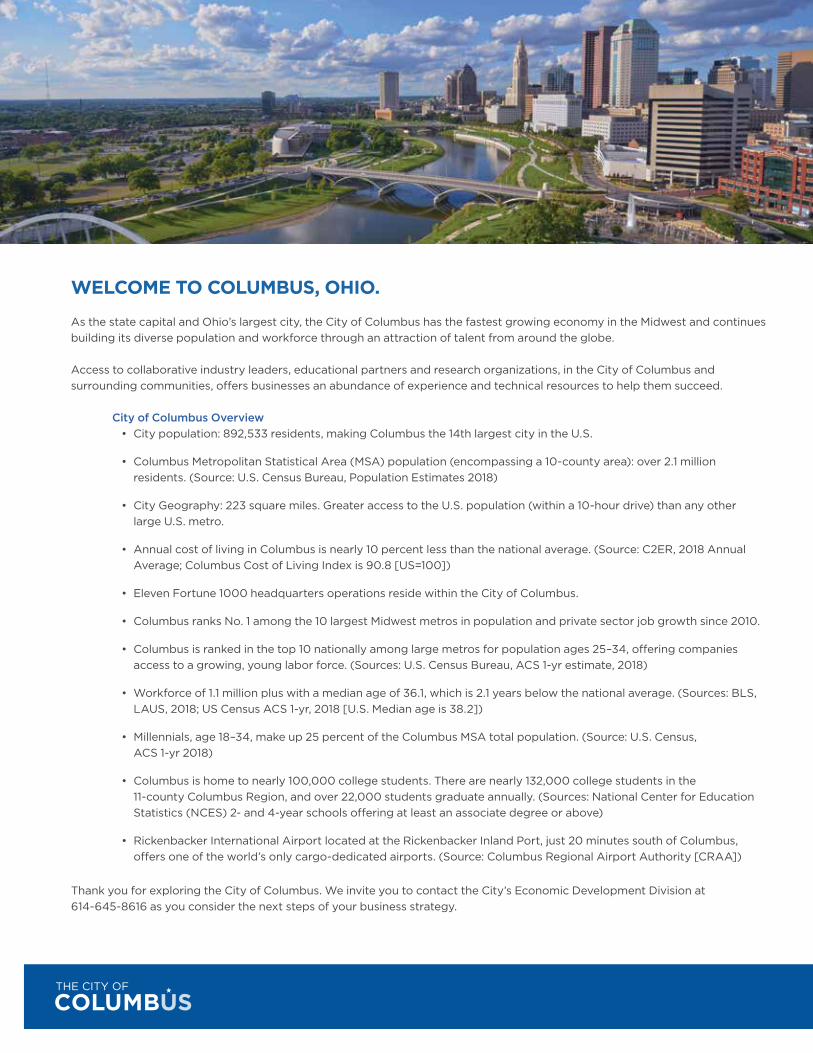
WELCOME TO COLUMBUS, OHIO.
As the state capital and Ohio’s largest city, the City of Columbus has the fastest growing economy in the Midwest and continues building its diverse population and workforce through an attraction of talent from around the globe.
Access to collaborative industry leaders, educational partners and research organizations, in the City of Columbus and surrounding communities, offers businesses an abundance of experience and technical resources to help them succeed.
City of Columbus Overview • City population: 892,533 residents, making Columbus the 14th largest city in the U.S.
• Columbus Metropolitan Statistical Area (MSA) population (encompassing a 10-county area): over 2.1 million residents. (Source: U.S. Census Bureau, Population Estimates 2018)
• City Geography: 223 square miles. Greater access to the U.S. population (within a 10-hour drive) than any other large U.S. metro.
• Annual cost of living in Columbus is nearly 10 percent less than the national average. (Source: C2ER, 2018 Annual Average; Columbus Cost of Living Index is 90.8 [US=100])
• Eleven Fortune 1000 headquarters operations reside within the City of Columbus.
• Columbus ranks No. 1 among the 10 largest Midwest metros in population and private sector job growth since 2010.
• Columbus is ranked in the top 10 nationally among large metros for population ages 25–34, offering companies access to a growing, young labor force. (Sources: U.S. Census Bureau, ACS 1-yr estimate, 2018)
• Workforce of 1.1 million plus with a median age of 36.1, which is 2.1 years below the national average. (Sources: BLS, LAUS, 2018; US Census ACS 1-yr, 2018 [U.S. Median age is 38.2])
• Millennials, age 18–34, make up 25 percent of the Columbus MSA total population. (Source: U.S. Census, ACS 1-yr 2018)
• Columbus is home to nearly 100,000 college students. There are nearly 132,000 college students in the 11-county Columbus Region, and over 22,000 students graduate annually. (Sources: National Center for Education Statistics (NCES) 2- and 4-year schools offering at least an associate degree or above)
• Rickenbacker International Airport located at the Rickenbacker Inland Port, just 20 minutes south of Columbus, offers one of the world’s only cargo-dedicated airports. (Source: Columbus Regional Airport Authority [CRAA])
Thank you for exploring the City of Columbus. We invite you to contact the City’s Economic Development Division at 614-645-8616 as you consider the next steps of your business strategy.
3FACTBOOK
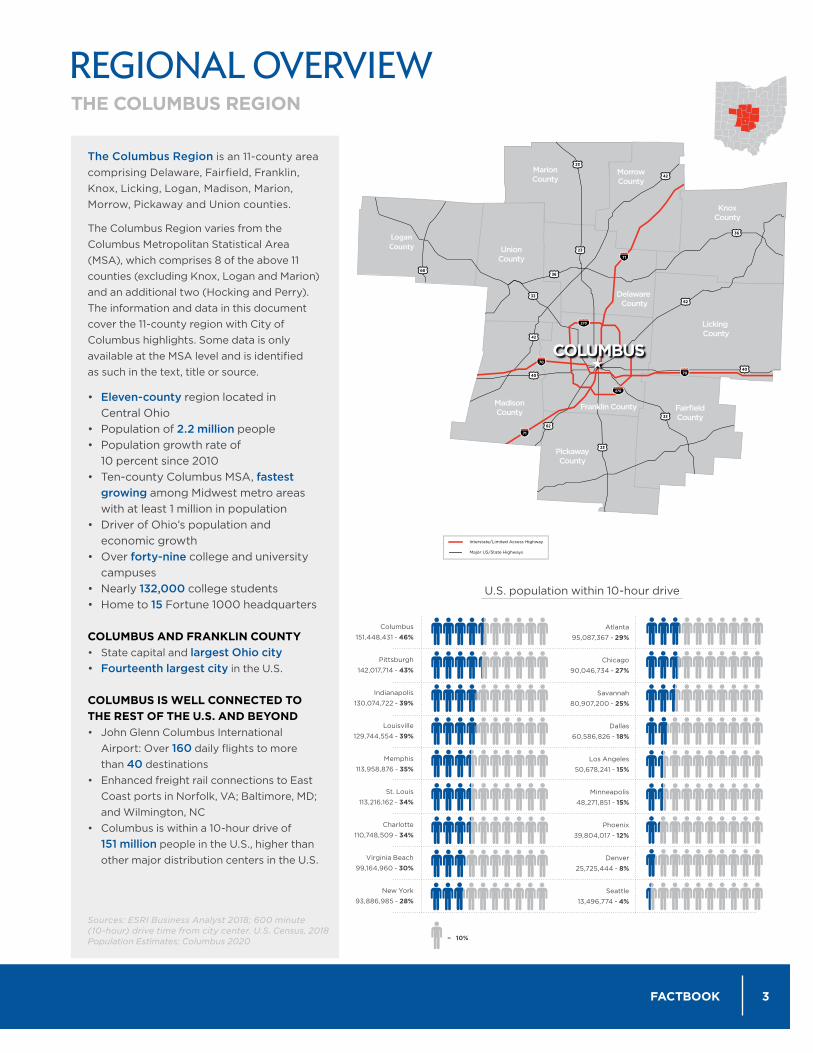
The Columbus Region is an 11-county area comprising Delaware, Fairfield, Franklin, Knox, Licking, Logan, Madison, Marion, Morrow, Pickaway and Union counties.
The Columbus Region varies from the Columbus Metropolitan Statistical Area (MSA), which comprises 8 of the above 11 counties (excluding Knox, Logan and Marion) and an additional two (Hocking and Perry). The information and data in this document cover the 11-county region with City of Columbus highlights. Some data is only available at the MSA level and is identified as such in the text, title or source.
• Eleven-county region located in Central Ohio
• Population of 2.2 million people• Population growth rate of
10 percent since 2010• Ten-county Columbus MSA, fastest
growing among Midwest metro areas with at least 1 million in population
• Driver of Ohio’s population and economic growth
• Over forty-nine college and university campuses • Nearly 132,000 college students• Home to 15 Fortune 1000 headquarters
COLUMBUS AND FRANKLIN COUNTY• State capital and largest Ohio city • Fourteenth largest city in the U.S.
COLUMBUS IS WELL CONNECTED TO THE REST OF THE U.S. AND BEYOND • John Glenn Columbus International
Airport: Over 160 daily flights to more than 40 destinations
• Enhanced freight rail connections to East Coast ports in Norfolk, VA; Baltimore, MD; and Wilmington, NC
• Columbus is within a 10-hour drive of 151 million people in the U.S., higher than other major distribution centers in the U.S.
REGIONAL OVERVIEWTHE COLUMBUS REGION
MarionCounty
KnoxCounty
LoganCounty
68
COLUMBUS ECONOMIC MARKET
U.S. population within 10-hour drive
= 10%
Columbus
151,448,431 - 46%
Pittsburgh
142,017,714 - 43%
Indianapolis
130,074,722 - 39%
Louisville
129,744,554 - 39%
Memphis
113,958,876 - 35%
St. Louis
113,216,162 - 34%
Charlotte
110,748,509 - 34%
Virginia Beach
99,164,960 - 30%
New York
93,886,985 - 28%
Sources: ESRI Business Analyst 2018; 600 minute (10-hour) drive time from city center. U.S. Census, 2018 Population Estimates; Columbus 2020
Atlanta
95,087,367 - 29%
Chicago
90,046,734 - 27%
Savannah
80,907,200 - 25%
Dallas
60,586,826 - 18%
Los Angeles
50,678,241 - 15%
Minneapolis
48,271,851 - 15%
Phoenix
39,804,017 - 12%
Denver
25,725,444 - 8%
Seattle
13,496,774 - 4%

15%GOVERNMENT
CONSTRUCTION AND MINING
MANUFACTURING
WHOLESALE TRADE
TRANSPORTATION AND UTILITIES
FINANCIAL ACTIVITIES
OTHER SERVICES
EDUCATION AND HEALTH
RETAIL TRADELEISURE AND HOSPITALITY
10%
3%4%
4%
15%
PROFESSIONALAND BUSINESS SERVICES
18%
7%
6%
10%
8%
THE COLUMBUS ECONOMY
The Columbus Region has a diversified economy where no single major industry represents more than 18 percent of employment. Finance and insurance, advanced manufacturing, health, logistics and other industries are complemented by the presence of The Ohio State University and the state capital.
FIGURE 1A. REGIONAL EMPLOYMENT BY SECTOR
Source: EMSI, 2019
McGraw-Hill EducationHOMAGE
5FACTBOOK
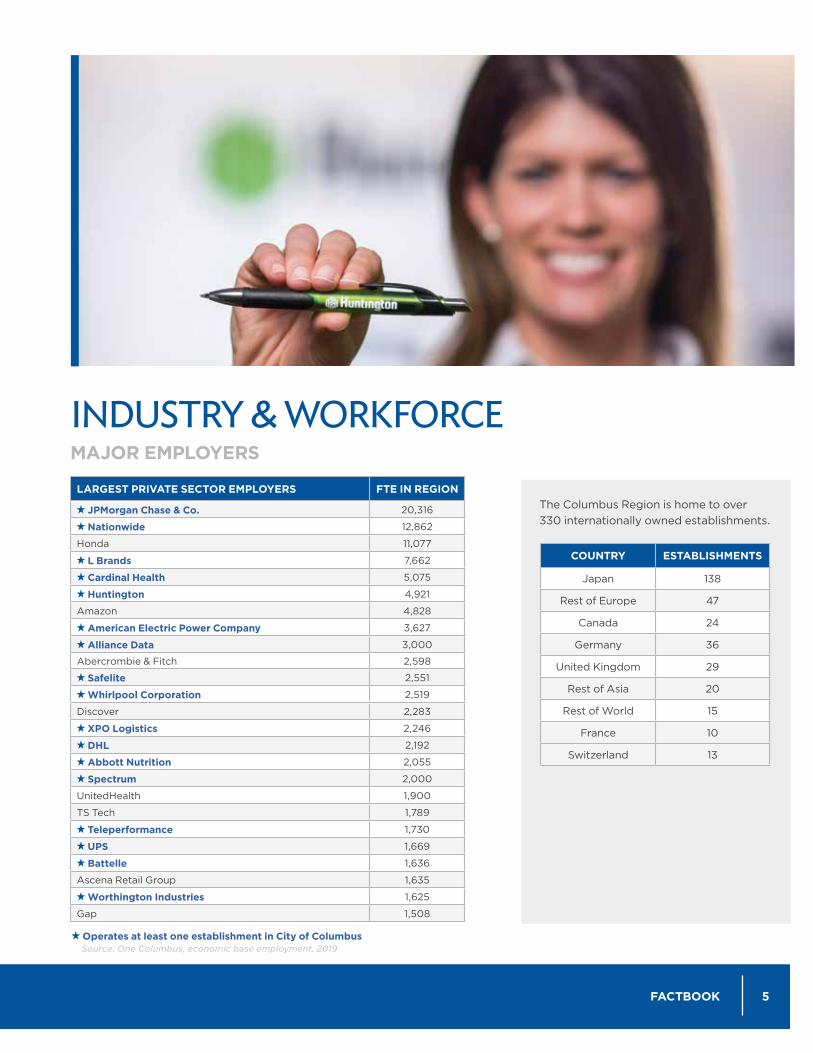
INDUSTRY & WORKFORCEMAJOR EMPLOYERS
LARGEST PRIVATE SECTOR EMPLOYERS FTE IN REGION
JPMorgan Chase & Co. 20,316
Nationwide 12,862
Honda 11,077
L Brands 7,662
Cardinal Health 5,075
Huntington 4,921
Amazon 4,828
American Electric Power Company 3,627
Alliance Data 3,000
Abercrombie & Fitch 2,598
Safelite 2,551
Whirlpool Corporation 2,519
Discover 2,283
XPO Logistics 2,246
DHL 2,192
Abbott Nutrition 2,055
Spectrum 2,000
UnitedHealth 1,900
TS Tech 1,789
Teleperformance 1,730
UPS 1,669
Battelle 1,636
Ascena Retail Group 1,635
Worthington Industries 1,625
Gap 1,508
Operates at least one establishment in City of Columbus Source: One Columbus, economic base employment, 2019
The Columbus Region is home to over 330 internationally owned establishments.
COUNTRY ESTABLISHMENTS
Japan 138
Rest of Europe 47
Canada 24
Germany 36
United Kingdom 29
Rest of Asia 20
Rest of World 15
France 10
Switzerland 13
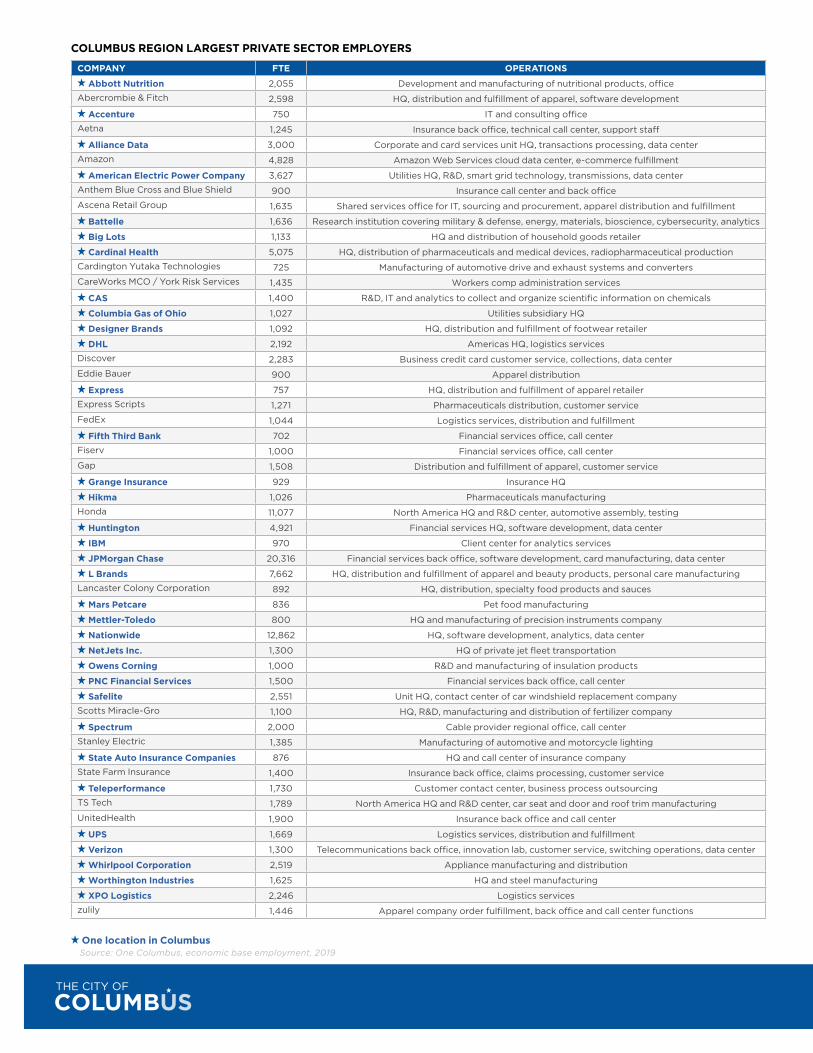
COMPANY FTE OPERATIONS
Abbott Nutrition 2,055 Development and manufacturing of nutritional products, office
Abercrombie & Fitch 2,598 HQ, distribution and fulfillment of apparel, software development
Accenture 750 IT and consulting office
Aetna 1,245 Insurance back office, technical call center, support staff
Alliance Data 3,000 Corporate and card services unit HQ, transactions processing, data center
Amazon 4,828 Amazon Web Services cloud data center, e-commerce fulfillment
American Electric Power Company 3,627 Utilities HQ, R&D, smart grid technology, transmissions, data center
Anthem Blue Cross and Blue Shield 900 Insurance call center and back office
Ascena Retail Group 1,635 Shared services office for IT, sourcing and procurement, apparel distribution and fulfillment
Battelle 1,636 Research institution covering military & defense, energy, materials, bioscience, cybersecurity, analytics
Big Lots 1,133 HQ and distribution of household goods retailer
Cardinal Health 5,075 HQ, distribution of pharmaceuticals and medical devices, radiopharmaceutical production
Cardington Yutaka Technologies 725 Manufacturing of automotive drive and exhaust systems and converters
CareWorks MCO / York Risk Services 1,435 Workers comp administration services
CAS 1,400 R&D, IT and analytics to collect and organize scientific information on chemicals
Columbia Gas of Ohio 1,027 Utilities subsidiary HQ
Designer Brands 1,092 HQ, distribution and fulfillment of footwear retailer
DHL 2,192 Americas HQ, logistics services
Discover 2,283 Business credit card customer service, collections, data center
Eddie Bauer 900 Apparel distribution
Express 757 HQ, distribution and fulfillment of apparel retailer
Express Scripts 1,271 Pharmaceuticals distribution, customer service
FedEx 1,044 Logistics services, distribution and fulfillment
Fifth Third Bank 702 Financial services office, call center
Fiserv 1,000 Financial services office, call center
Gap 1,508 Distribution and fulfillment of apparel, customer service
Grange Insurance 929 Insurance HQ
Hikma 1,026 Pharmaceuticals manufacturing
Honda 11,077 North America HQ and R&D center, automotive assembly, testing
Huntington 4,921 Financial services HQ, software development, data center
IBM 970 Client center for analytics services
JPMorgan Chase 20,316 Financial services back office, software development, card manufacturing, data center
L Brands 7,662 HQ, distribution and fulfillment of apparel and beauty products, personal care manufacturing
Lancaster Colony Corporation 892 HQ, distribution, specialty food products and sauces
Mars Petcare 836 Pet food manufacturing
Mettler-Toledo 800 HQ and manufacturing of precision instruments company
Nationwide 12,862 HQ, software development, analytics, data center
NetJets Inc. 1,300 HQ of private jet fleet transportation
Owens Corning 1,000 R&D and manufacturing of insulation products
PNC Financial Services 1,500 Financial services back office, call center
Safelite 2,551 Unit HQ, contact center of car windshield replacement company
Scotts Miracle-Gro 1,100 HQ, R&D, manufacturing and distribution of fertilizer company
Spectrum 2,000 Cable provider regional office, call center
Stanley Electric 1,385 Manufacturing of automotive and motorcycle lighting
State Auto Insurance Companies 876 HQ and call center of insurance company
State Farm Insurance 1,400 Insurance back office, claims processing, customer service
Teleperformance 1,730 Customer contact center, business process outsourcing
TS Tech 1,789 North America HQ and R&D center, car seat and door and roof trim manufacturing
UnitedHealth 1,900 Insurance back office and call center
UPS 1,669 Logistics services, distribution and fulfillment
Verizon 1,300 Telecommunications back office, innovation lab, customer service, switching operations, data center
Whirlpool Corporation 2,519 Appliance manufacturing and distribution
Worthington Industries 1,625 HQ and steel manufacturing
XPO Logistics 2,246 Logistics services
zulily 1,446 Apparel company order fulfillment, back office and call center functions
COLUMBUS REGION LARGEST PRIVATE SECTOR EMPLOYERS
One location in Columbus Source: One Columbus, economic base employment, 2019
7FACTBOOK
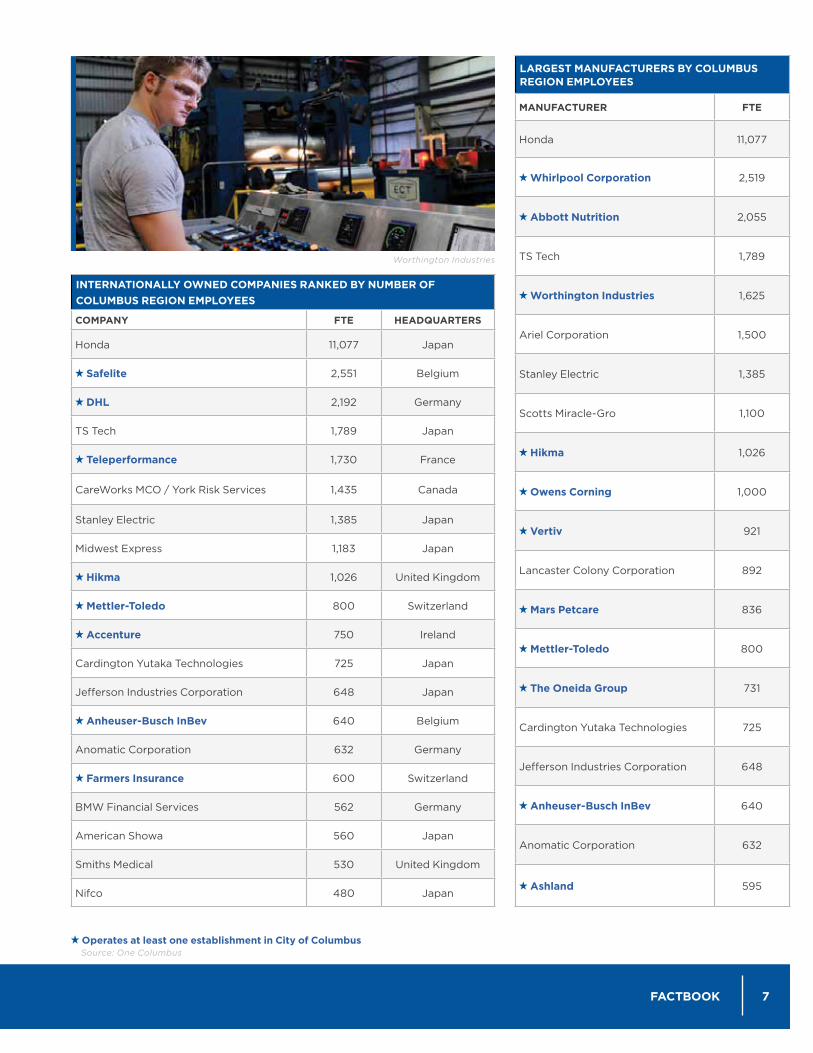
INTERNATIONALLY OWNED COMPANIES RANKED BY NUMBER OFCOLUMBUS REGION EMPLOYEES
COMPANY FTE HEADQUARTERS
Honda 11,077 Japan
Safelite 2,551 Belgium
DHL 2,192 Germany
TS Tech 1,789 Japan
Teleperformance 1,730 France
CareWorks MCO / York Risk Services 1,435 Canada
Stanley Electric 1,385 Japan
Midwest Express 1,183 Japan
Hikma 1,026 United Kingdom
Mettler-Toledo 800 Switzerland
Accenture 750 Ireland
Cardington Yutaka Technologies 725 Japan
Jefferson Industries Corporation 648 Japan
Anheuser-Busch InBev 640 Belgium
Anomatic Corporation 632 Germany
Farmers Insurance 600 Switzerland
BMW Financial Services 562 Germany
American Showa 560 Japan
Smiths Medical 530 United Kingdom
Nifco 480 Japan
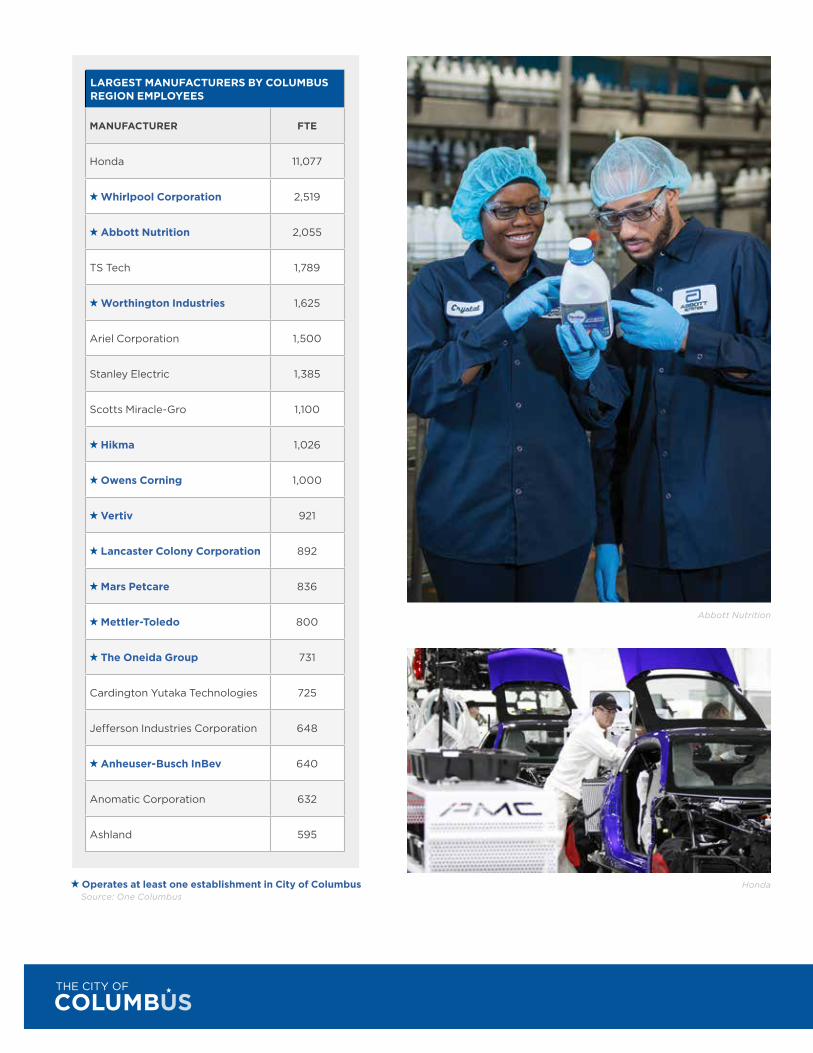
LARGEST MANUFACTURERS BY COLUMBUS REGION EMPLOYEES
MANUFACTURER FTE
Honda 11,077
Whirlpool Corporation 2,519
Abbott Nutrition 2,055
TS Tech 1,789
Worthington Industries 1,625
Ariel Corporation 1,500
Stanley Electric 1,385
Scotts Miracle-Gro 1,100
Hikma 1,026
Owens Corning 1,000
Vertiv 921
Lancaster Colony Corporation 892
Mars Petcare 836
Mettler-Toledo 800
The Oneida Group 731
Cardington Yutaka Technologies 725
Jefferson Industries Corporation 648
Anheuser-Busch InBev 640
Anomatic Corporation 632
Ashland 595
Operates at least one establishment in City of Columbus Source: One Columbus
Worthington Industries
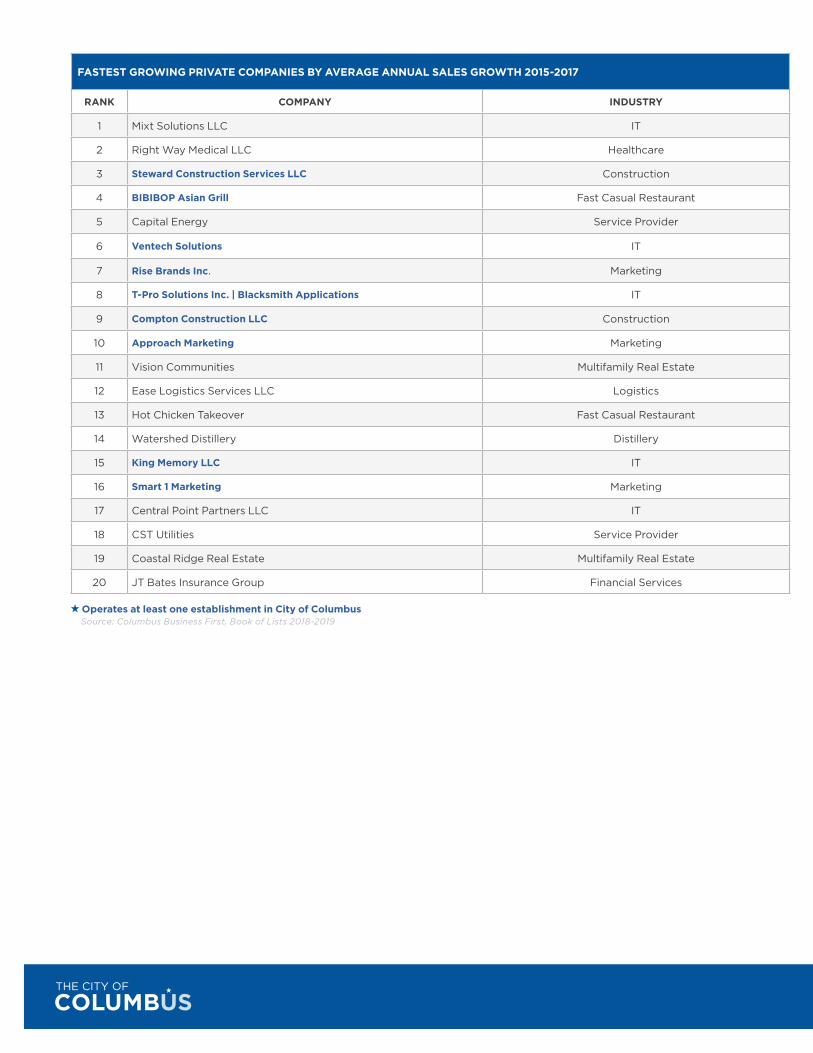
FASTEST GROWING PRIVATE COMPANIES BY AVERAGE ANNUAL SALES GROWTH 2015-2017
RANK COMPANY INDUSTRY
1 Mixt Solutions LLC IT
2 Right Way Medical LLC Healthcare
3 Steward Construction Services LLC Construction
4 BIBIBOP Asian Grill Fast Casual Restaurant
5 Capital Energy Service Provider
6 Ventech Solutions IT
7 Rise Brands Inc. Marketing
8 T-Pro Solutions Inc. | Blacksmith Applications IT
9 Compton Construction LLC Construction
10 Approach Marketing Marketing
11 Vision Communities Multifamily Real Estate
12 Ease Logistics Services LLC Logistics
13 Hot Chicken Takeover Fast Casual Restaurant
14 Watershed Distillery Distillery
15 King Memory LLC IT
16 Smart 1 Marketing Marketing
17 Central Point Partners LLC IT
18 CST Utilities Service Provider
19 Coastal Ridge Real Estate Multifamily Real Estate
20 JT Bates Insurance Group Financial Services
Operates at least one establishment in City of Columbus Source: Columbus Business First, Book of Lists 2018-2019
9FACTBOOK
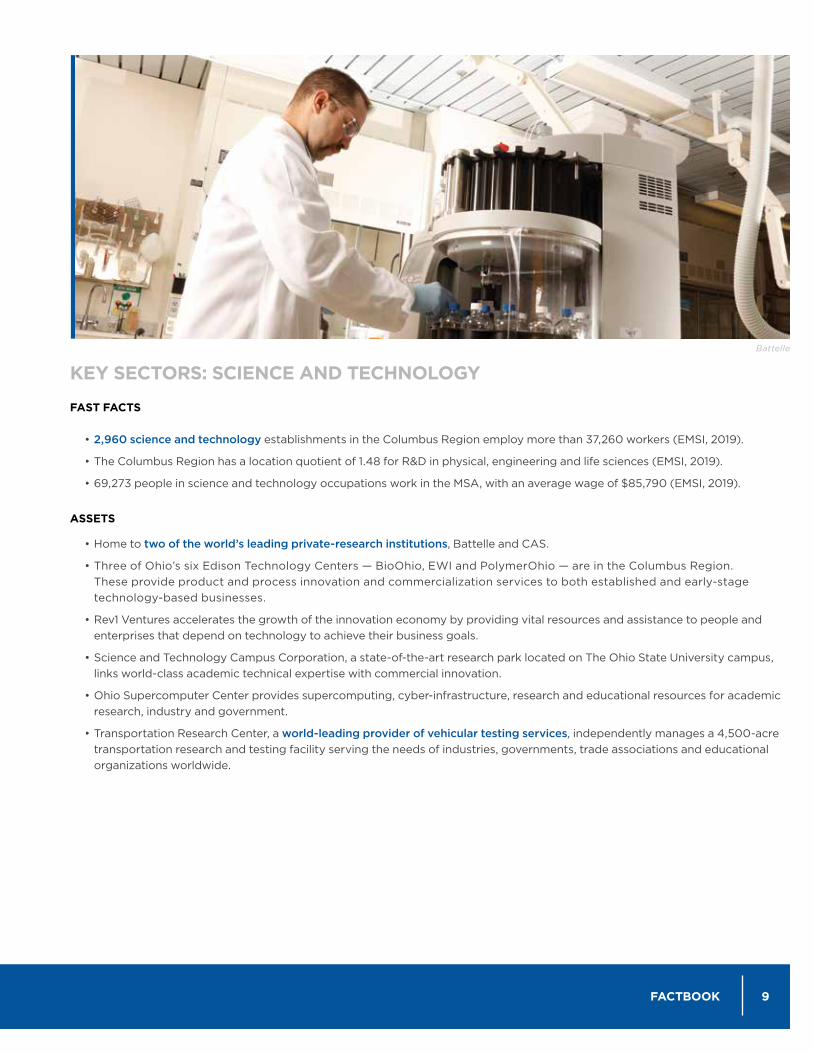
KEY SECTORS: SCIENCE AND TECHNOLOGY
FAST FACTS
• 2,960 science and technology establishments in the Columbus Region employ more than 37,260 workers (EMSI, 2019).
• The Columbus Region has a location quotient of 1.48 for R&D in physical, engineering and life sciences (EMSI, 2019).
• 69,273 people in science and technology occupations work in the MSA, with an average wage of $85,790 (EMSI, 2019).
ASSETS • Home to two of the world’s leading private-research institutions, Battelle and CAS.
• Three of Ohio’s six Edison Technology Centers — BioOhio, EWI and PolymerOhio — are in the Columbus Region. These provide product and process innovation and commercialization services to both established and early-stage technology-based businesses.
• Rev1 Ventures accelerates the growth of the innovation economy by providing vital resources and assistance to people and enterprises that depend on technology to achieve their business goals.
• Science and Technology Campus Corporation, a state-of-the-art research park located on The Ohio State University campus, links world-class academic technical expertise with commercial innovation.
• Ohio Supercomputer Center provides supercomputing, cyber-infrastructure, research and educational resources for academic research, industry and government.
• Transportation Research Center, a world-leading provider of vehicular testing services, independently manages a 4,500-acre transportation research and testing facility serving the needs of industries, governments, trade associations and educational organizations worldwide.
Battelle
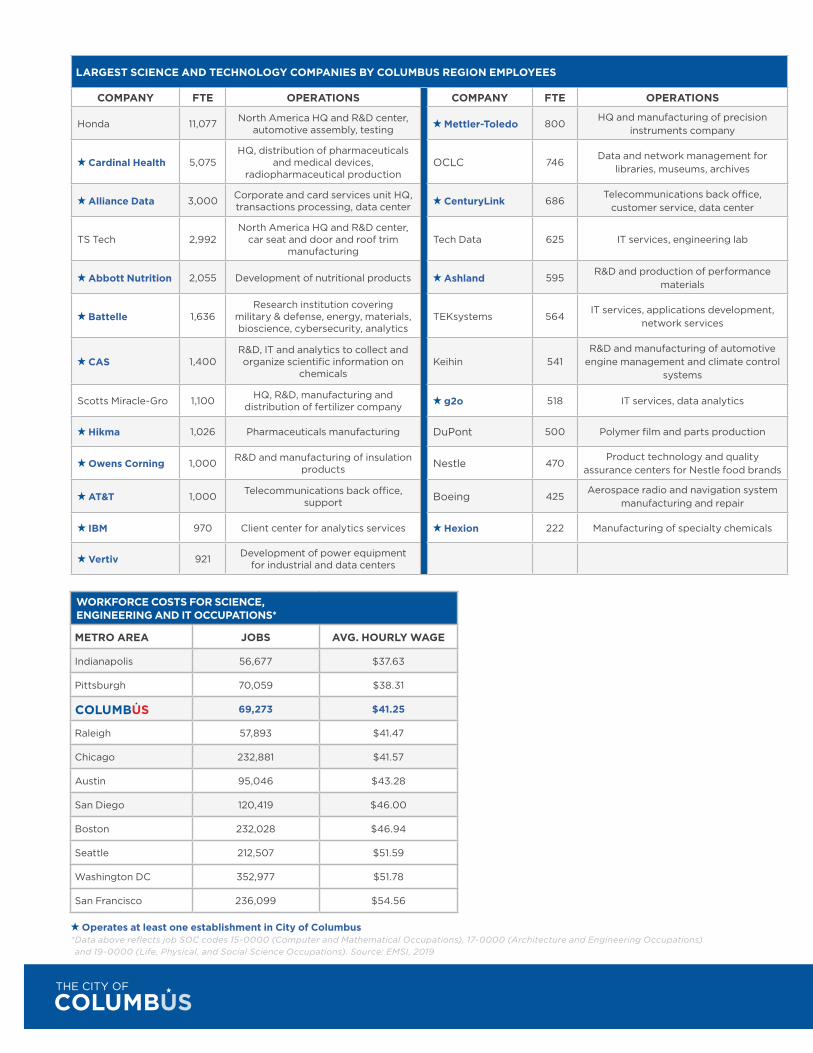
WORKFORCE COSTS FOR SCIENCE, ENGINEERING AND IT OCCUPATIONS*
METRO AREA JOBS AVG. HOURLY WAGE
Indianapolis 56,677 $37.63
Pittsburgh 70,059 $38.31
69,273 $41.25
Raleigh 57,893 $41.47
Chicago 232,881 $41.57
Austin 95,046 $43.28
San Diego 120,419 $46.00
Boston 232,028 $46.94
Seattle 212,507 $51.59
Washington DC 352,977 $51.78
San Francisco 236,099 $54.56
LARGEST SCIENCE AND TECHNOLOGY COMPANIES BY COLUMBUS REGION EMPLOYEES
COMPANY FTE OPERATIONS COMPANY FTE OPERATIONS
Honda 11,077 North America HQ and R&D center, automotive assembly, testing Mettler-Toledo 800
HQ and manufacturing of precision instruments company
Cardinal Health 5,075HQ, distribution of pharmaceuticals
and medical devices, radiopharmaceutical production
OCLC 746Data and network management for
libraries, museums, archives
Alliance Data 3,000 Corporate and card services unit HQ, transactions processing, data center CenturyLink 686
Telecommunications back office, customer service, data center
TS Tech 2,992North America HQ and R&D center,
car seat and door and roof trim manufacturing
Tech Data 625 IT services, engineering lab
Abbott Nutrition 2,055 Development of nutritional products Ashland 595R&D and production of performance
materials
Battelle 1,636Research institution covering
military & defense, energy, materials, bioscience, cybersecurity, analytics
TEKsystems 564IT services, applications development,
network services
CAS 1,400R&D, IT and analytics to collect and organize scientific information on
chemicalsKeihin 541
R&D and manufacturing of automotive engine management and climate control
systems
Scotts Miracle-Gro 1,100 HQ, R&D, manufacturing and distribution of fertilizer company g2o 518 IT services, data analytics
Hikma 1,026 Pharmaceuticals manufacturing DuPont 500 Polymer film and parts production
Owens Corning 1,000 R&D and manufacturing of insulation products Nestle 470
Product technology and quality assurance centers for Nestle food brands
AT&T 1,000 Telecommunications back office, support Boeing 425
Aerospace radio and navigation system manufacturing and repair
IBM 970 Client center for analytics services Hexion 222 Manufacturing of specialty chemicals
Vertiv 921 Development of power equipment for industrial and data centers
Operates at least one establishment in City of Columbus * Data above reflects job SOC codes 15-0000 (Computer and Mathematical Occupations), 17-0000 (Architecture and Engineering Occupations) and 19-0000 (Life, Physical, and Social Science Occupations). Source: EMSI, 2019
11FACTBOOK
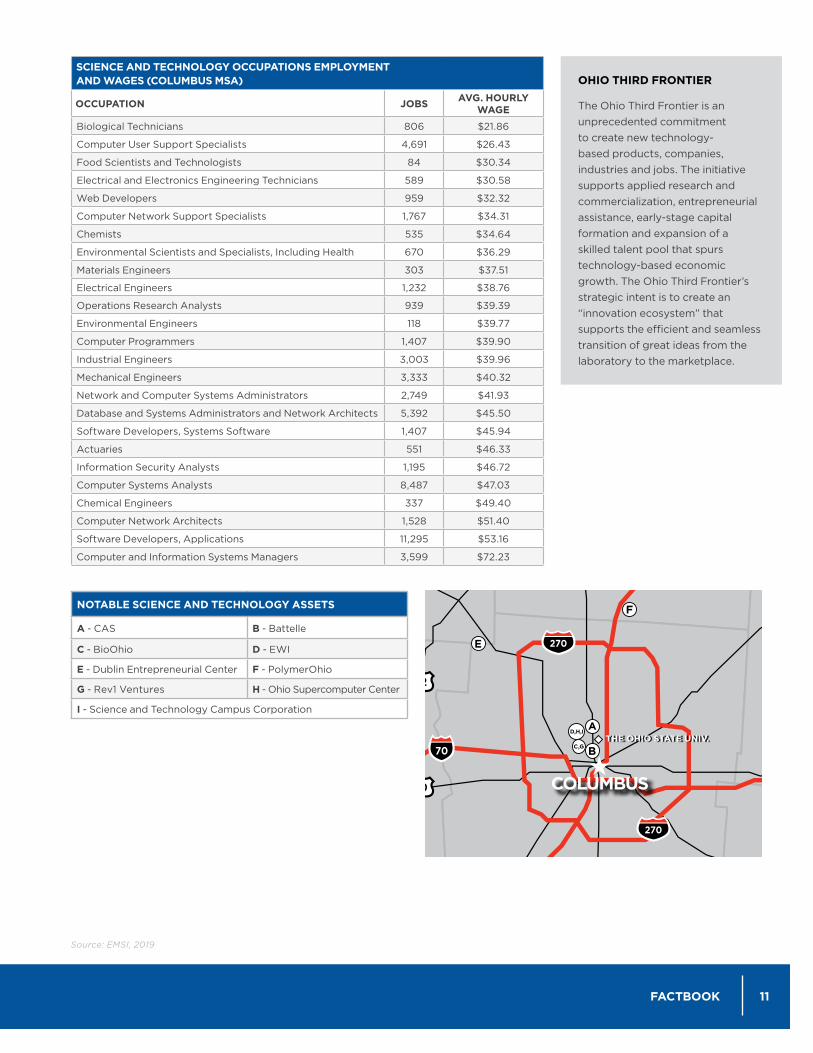
SCIENCE AND TECHNOLOGY OCCUPATIONS EMPLOYMENT AND WAGES (COLUMBUS MSA)
OCCUPATION JOBS AVG. HOURLY WAGE
Biological Technicians 806 $21.86
Computer User Support Specialists 4,691 $26.43
Food Scientists and Technologists 84 $30.34
Electrical and Electronics Engineering Technicians 589 $30.58
Web Developers 959 $32.32
Computer Network Support Specialists 1,767 $34.31
Chemists 535 $34.64
Environmental Scientists and Specialists, Including Health 670 $36.29
Materials Engineers 303 $37.51
Electrical Engineers 1,232 $38.76
Operations Research Analysts 939 $39.39
Environmental Engineers 118 $39.77
Computer Programmers 1,407 $39.90
Industrial Engineers 3,003 $39.96
Mechanical Engineers 3,333 $40.32
Network and Computer Systems Administrators 2,749 $41.93
Database and Systems Administrators and Network Architects 5,392 $45.50
Software Developers, Systems Software 1,407 $45.94
Actuaries 551 $46.33
Information Security Analysts 1,195 $46.72
Computer Systems Analysts 8,487 $47.03
Chemical Engineers 337 $49.40
Computer Network Architects 1,528 $51.40
Software Developers, Applications 11,295 $53.16
Computer and Information Systems Managers 3,599 $72.23
THE OHIO STATE UNIV.
MarionCounty
KnoxCounty
COLUMBUS ECONOMIC MARKETFORTUNE 1000 HEADQUARTERS
MATT McCOLLISTERVice President, Economic Development150 South Front ST, Suite 200Columbus, OH 43215
Phone: (614)225.6953Email: [email protected]
NOTABLE SCIENCE AND TECHNOLOGY ASSETS
A - CAS B - Battelle
C - BioOhio D - EWI
E - Dublin Entrepreneurial Center F - PolymerOhio
G - Rev1 Ventures H - Ohio Supercomputer Center
I - Science and Technology Campus Corporation
Source: EMSI, 2019
OHIO THIRD FRONTIER
The Ohio Third Frontier is an unprecedented commitment to create new technology-based products, companies, industries and jobs. The initiative supports applied research and commercialization, entrepreneurial assistance, early-stage capital formation and expansion of a skilled talent pool that spurs technology-based economic growth. The Ohio Third Frontier’s strategic intent is to create an “innovation ecosystem” that supports the efficient and seamless transition of great ideas from the laboratory to the marketplace.
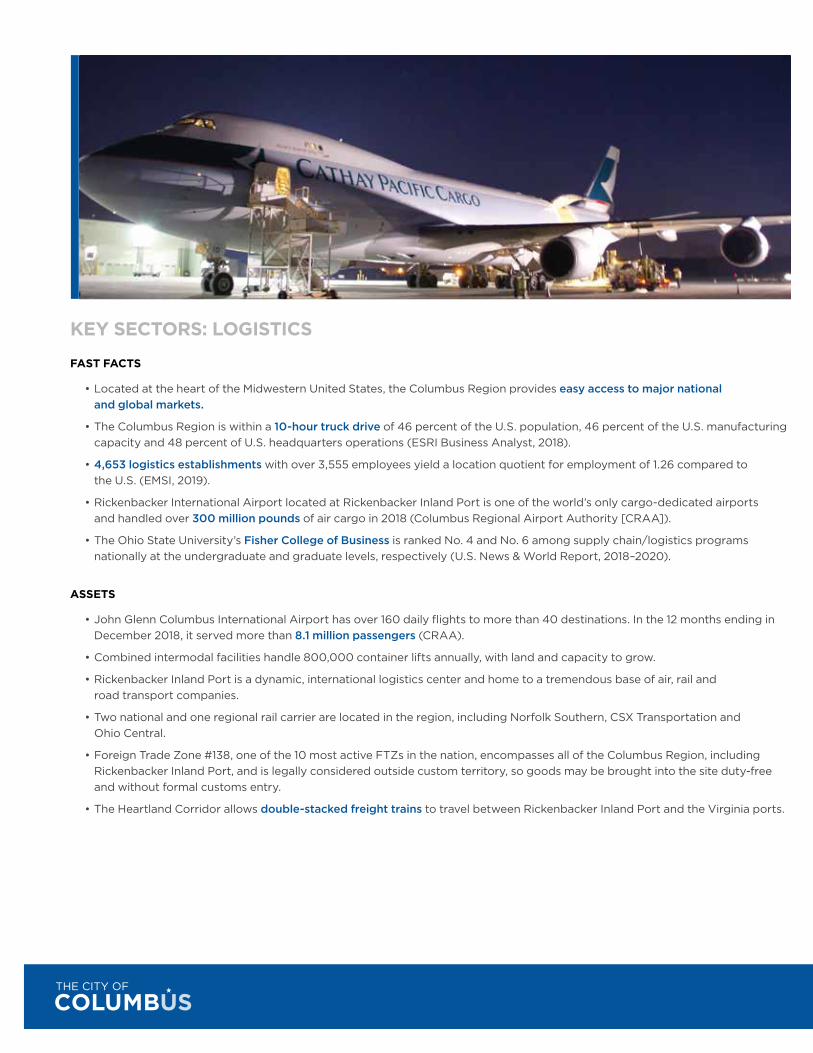
KEY SECTORS: LOGISTICS
FAST FACTS
• Located at the heart of the Midwestern United States, the Columbus Region provides easy access to major national and global markets.
• The Columbus Region is within a 10-hour truck drive of 46 percent of the U.S. population, 46 percent of the U.S. manufacturing capacity and 48 percent of U.S. headquarters operations (ESRI Business Analyst, 2018).
• 4,653 logistics establishments with over 3,555 employees yield a location quotient for employment of 1.26 compared to the U.S. (EMSI, 2019).
• Rickenbacker International Airport located at Rickenbacker Inland Port is one of the world’s only cargo-dedicated airports and handled over 300 million pounds of air cargo in 2018 (Columbus Regional Airport Authority [CRAA]).
• The Ohio State University’s Fisher College of Business is ranked No. 4 and No. 6 among supply chain/logistics programs nationally at the undergraduate and graduate levels, respectively (U.S. News & World Report, 2018–2020).
ASSETS
• John Glenn Columbus International Airport has over 160 daily flights to more than 40 destinations. In the 12 months ending in December 2018, it served more than 8.1 million passengers (CRAA).
• Combined intermodal facilities handle 800,000 container lifts annually, with land and capacity to grow.
• Rickenbacker Inland Port is a dynamic, international logistics center and home to a tremendous base of air, rail and road transport companies.
• Two national and one regional rail carrier are located in the region, including Norfolk Southern, CSX Transportation and Ohio Central.
• Foreign Trade Zone #138, one of the 10 most active FTZs in the nation, encompasses all of the Columbus Region, including Rickenbacker Inland Port, and is legally considered outside custom territory, so goods may be brought into the site duty-free and without formal customs entry.
• The Heartland Corridor allows double-stacked freight trains to travel between Rickenbacker Inland Port and the Virginia ports.
13FACTBOOK
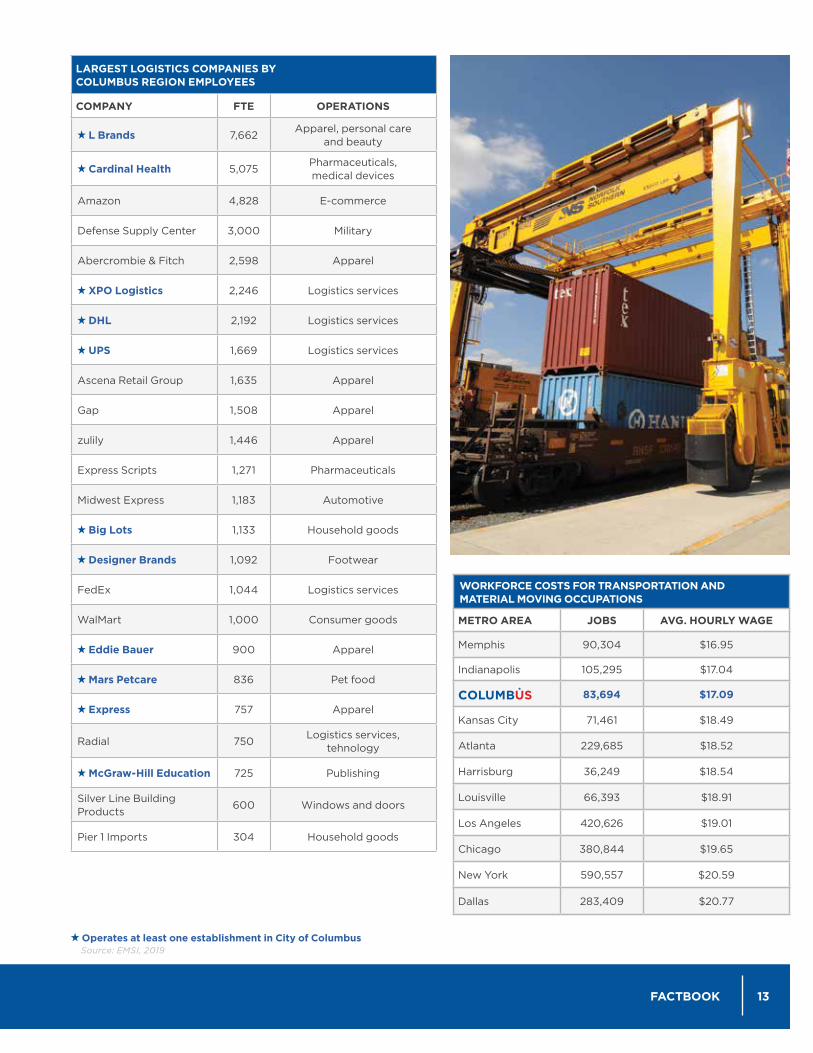
LARGEST LOGISTICS COMPANIES BY COLUMBUS REGION EMPLOYEES
COMPANY FTE OPERATIONS
L Brands 7,662Apparel, personal care
and beauty
Cardinal Health 5,075Pharmaceuticals, medical devices
Amazon 4,828 E-commerce
Defense Supply Center 3,000 Military
Abercrombie & Fitch 2,598 Apparel
XPO Logistics 2,246 Logistics services
DHL 2,192 Logistics services
UPS 1,669 Logistics services
Ascena Retail Group 1,635 Apparel
Gap 1,508 Apparel
zulily 1,446 Apparel
Express Scripts 1,271 Pharmaceuticals
Midwest Express 1,183 Automotive
Big Lots 1,133 Household goods
Designer Brands 1,092 Footwear
FedEx 1,044 Logistics services
WalMart 1,000 Consumer goods
Eddie Bauer 900 Apparel
Mars Petcare 836 Pet food
Express 757 Apparel
Radial 750Logistics services,
tehnology
McGraw-Hill Education 725 Publishing
Silver Line Building Products
600 Windows and doors
Pier 1 Imports 304 Household goods
Operates at least one establishment in City of Columbus Source: EMSI, 2019
WORKFORCE COSTS FOR TRANSPORTATION AND MATERIAL MOVING OCCUPATIONS
METRO AREA JOBS AVG. HOURLY WAGE
Memphis 90,304 $16.95
Indianapolis 105,295 $17.04
83,694 $17.09
Kansas City 71,461 $18.49
Atlanta 229,685 $18.52
Harrisburg 36,249 $18.54
Louisville 66,393 $18.91
Los Angeles 420,626 $19.01
Chicago 380,844 $19.65
New York 590,557 $20.59
Dallas 283,409 $20.77
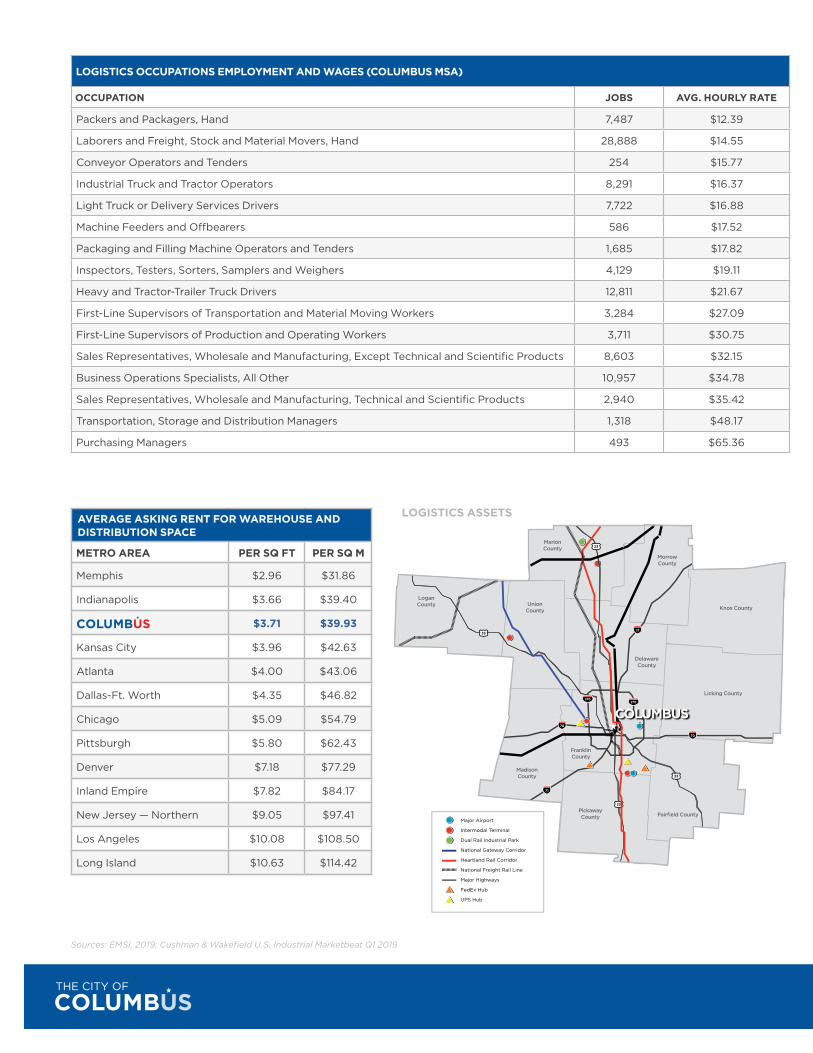
LOGISTICS OCCUPATIONS EMPLOYMENT AND WAGES (COLUMBUS MSA)
OCCUPATION JOBS AVG. HOURLY RATE
Packers and Packagers, Hand 7,487 $12.39
Laborers and Freight, Stock and Material Movers, Hand 28,888 $14.55
Conveyor Operators and Tenders 254 $15.77
Industrial Truck and Tractor Operators 8,291 $16.37
Light Truck or Delivery Services Drivers 7,722 $16.88
Machine Feeders and Offbearers 586 $17.52
Packaging and Filling Machine Operators and Tenders 1,685 $17.82
Inspectors, Testers, Sorters, Samplers and Weighers 4,129 $19.11
Heavy and Tractor-Trailer Truck Drivers 12,811 $21.67
First-Line Supervisors of Transportation and Material Moving Workers 3,284 $27.09
First-Line Supervisors of Production and Operating Workers 3,711 $30.75
Sales Representatives, Wholesale and Manufacturing, Except Technical and Scientific Products 8,603 $32.15
Business Operations Specialists, All Other 10,957 $34.78
Sales Representatives, Wholesale and Manufacturing, Technical and Scientific Products 2,940 $35.42
Transportation, Storage and Distribution Managers 1,318 $48.17
Purchasing Managers 493 $65.36
AVERAGE ASKING RENT FOR WAREHOUSE AND DISTRIBUTION SPACE
METRO AREA PER SQ FT PER SQ M
Memphis $2.96 $31.86
Indianapolis $3.66 $39.40
$3.71 $39.93
Kansas City $3.96 $42.63
Atlanta $4.00 $43.06
Dallas-Ft. Worth $4.35 $46.82
Chicago $5.09 $54.79
Pittsburgh $5.80 $62.43
Denver $7.18 $77.29
Inland Empire $7.82 $84.17
New Jersey — Northern $9.05 $97.41
Los Angeles $10.08 $108.50
Long Island $10.63 $114.42
LOGISTICS ASSETS
Sources: EMSI, 2019; Cushman & Wakefield U.S. Industrial Marketbeat Q1 2019
Knox County
Licking County
FranklinCounty
Fairfield CountyPickawayCounty
MadisonCounty
DelawareCounty
MorrowCounty
MarionCounty
LoganCounty Union
County
Major Airport
Intermodal Terminal
Dual Rail Industrial Park
National Gateway Corridor
Heartland Rail Corridor National Freight Rail Line
Major Highways
FedEx Hub
UPS Hub

15FACTBOOK
FAST FACTS • The 1,751 manufacturing establishments in the Columbus Region employ 87,392 workers. The sector contributed
$15.2 billion to regional output (EMSI, 2019).
• Quality sites and buildings with more than 260 million square feet of industrial space and available property average a direct asking rate of $3.71/SF (Cushman & Wakefield Q1 2019).
• The Columbus Region has high output location quotients for manufacturing of beverages (1.27), transportation equipment (1.56) and nonmetallic mineral products (1.67) (EMSI, 2019).
ASSETS
• Battelle, the world’s largest contract research and development organization, brings a unique blend of science and technology disciplines to solve significant logistics challenges for its clients.
• EWI is North America’s leading organization dedicated to the research and development of welding and materials joining technologies.
• The Ohio State University enrolls more than 68,000 students and ranks No. 4 among universities nationwide in industry-sponsored research (The Ohio State University, 2018 enrollment report).
- Fisher College of Business is ranked No. 9 in the nation among MBA programs in production/operations specialization (U.S. News & World Report, 2020).
• The Ohio State University’s graduate and undergraduate engineering programs are both ranked No. 1 among all Ohio universities and 16th among public universities, according to U.S. News & World Report. The College of Engineering ranks 3rd in the country for industry research and development expenditures, according to the National Science Foundation.
• The Ohio State University ranks 6th in the nation among public universities in private support, which was more than $601 million for fiscal year 2018, when College of Engineering and Knowlton School of Architecture private support exceeded $49 million.
• Columbus State Community College is one of the nation’s largest community colleges, with engineering certificate programs in manufacturing, assembly and computer-aided design.
• The Ohio Manufacturing Extension Partnership (Ohio MEP) supports the diversity and strength of Ohio’s manufacturing industry by providing the products, services and assistance that are dedicated to the productivity, growth and global competitiveness of Ohio manufacturers.
• Ohio Manufacturing Institute (OMI) is a single entry point for making The Ohio State University’s technical resources available to Ohio manufacturers and to facilitate the use of those resources for economic development. OMI collaborates with university faculty, students and scientists in the following technical areas to find solutions for manufacturing challenges:
-Machining, Tribology, Metrology, Forming and Corrosion
-Process, Microstructure and Performance Modeling
-Additive Manufacturing
-Welding and Joining
-Design
KEY SECTORS: MANUFACTURING
Operates at least one establishment in City of Columbus Source: One Columbus
Abbott Nutrition
Honda
LARGEST MANUFACTURERS BY COLUMBUS REGION EMPLOYEES
MANUFACTURER FTE
Honda 11,077
Whirlpool Corporation 2,519
Abbott Nutrition 2,055
TS Tech 1,789
Worthington Industries 1,625
Ariel Corporation 1,500
Stanley Electric 1,385
Scotts Miracle-Gro 1,100
Hikma 1,026
Owens Corning 1,000
Vertiv 921
Lancaster Colony Corporation 892
Mars Petcare 836
Mettler-Toledo 800
The Oneida Group 731
Cardington Yutaka Technologies 725
Jefferson Industries Corporation 648
Anheuser-Busch InBev 640
Anomatic Corporation 632
Ashland 595
17FACTBOOK
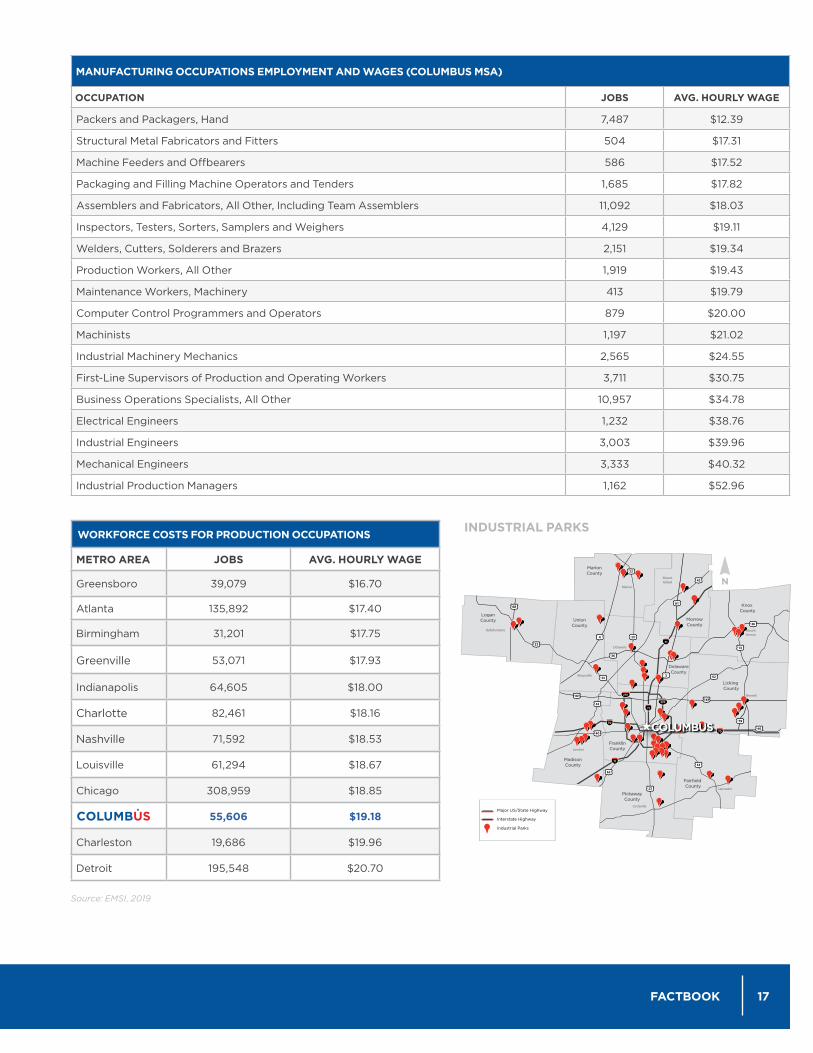
MANUFACTURING OCCUPATIONS EMPLOYMENT AND WAGES (COLUMBUS MSA)
OCCUPATION JOBS AVG. HOURLY WAGE
Packers and Packagers, Hand 7,487 $12.39
Structural Metal Fabricators and Fitters 504 $17.31
Machine Feeders and Offbearers 586 $17.52
Packaging and Filling Machine Operators and Tenders 1,685 $17.82
Assemblers and Fabricators, All Other, Including Team Assemblers 11,092 $18.03
Inspectors, Testers, Sorters, Samplers and Weighers 4,129 $19.11
Welders, Cutters, Solderers and Brazers 2,151 $19.34
Production Workers, All Other 1,919 $19.43
Maintenance Workers, Machinery 413 $19.79
Computer Control Programmers and Operators 879 $20.00
Machinists 1,197 $21.02
Industrial Machinery Mechanics 2,565 $24.55
First-Line Supervisors of Production and Operating Workers 3,711 $30.75
Business Operations Specialists, All Other 10,957 $34.78
Electrical Engineers 1,232 $38.76
Industrial Engineers 3,003 $39.96
Mechanical Engineers 3,333 $40.32
Industrial Production Managers 1,162 $52.96
INDUSTRIAL PARKS
4
68
3
61
79
161161
Marion
MountGilead
MountVernon
Newark
Delaware
Circleville
Marysville
London
Lancaster
Bellefontaine
13
Knox County
Licking County
FranklinCounty
Fairfield County
PickawayCounty
MadisonCounty
DelawareCounty
MorrowCounty
MarionCounty
LoganCounty Union
County
Major US/State Highway Interstate Highway Industrial Parks
Source: EMSI, 2019
WORKFORCE COSTS FOR PRODUCTION OCCUPATIONS
METRO AREA JOBS AVG. HOURLY WAGE
Greensboro 39,079 $16.70
Atlanta 135,892 $17.40
Birmingham 31,201 $17.75
Greenville 53,071 $17.93
Indianapolis 64,605 $18.00
Charlotte 82,461 $18.16
Nashville 71,592 $18.53
Louisville 61,294 $18.67
Chicago 308,959 $18.85
55,606 $19.18
Charleston 19,686 $19.96
Detroit 195,548 $20.70
FORTUNE 1000 COMPANIES HEADQUARTERED IN THE REGION
COMPANY FORTUNE 1000 RANKING
Cardinal Health, Inc. 15
Nationwide Insurance 73
American Electric Power Company, Inc.
192
L Brands Inc. 241
Alliance Data 365
Huntington Bancshares Inc. 524
Big Lots, Inc. 525
GREIF 639
Hexion Inc. 652
Abercrombie & Fitch Co. 675
Worthington Industries, Inc. 677
Designer Brands 732
Mettler-Toledo International Inc.
775
The Scotts Miracle-Gro Company 829
Express, Inc. 954
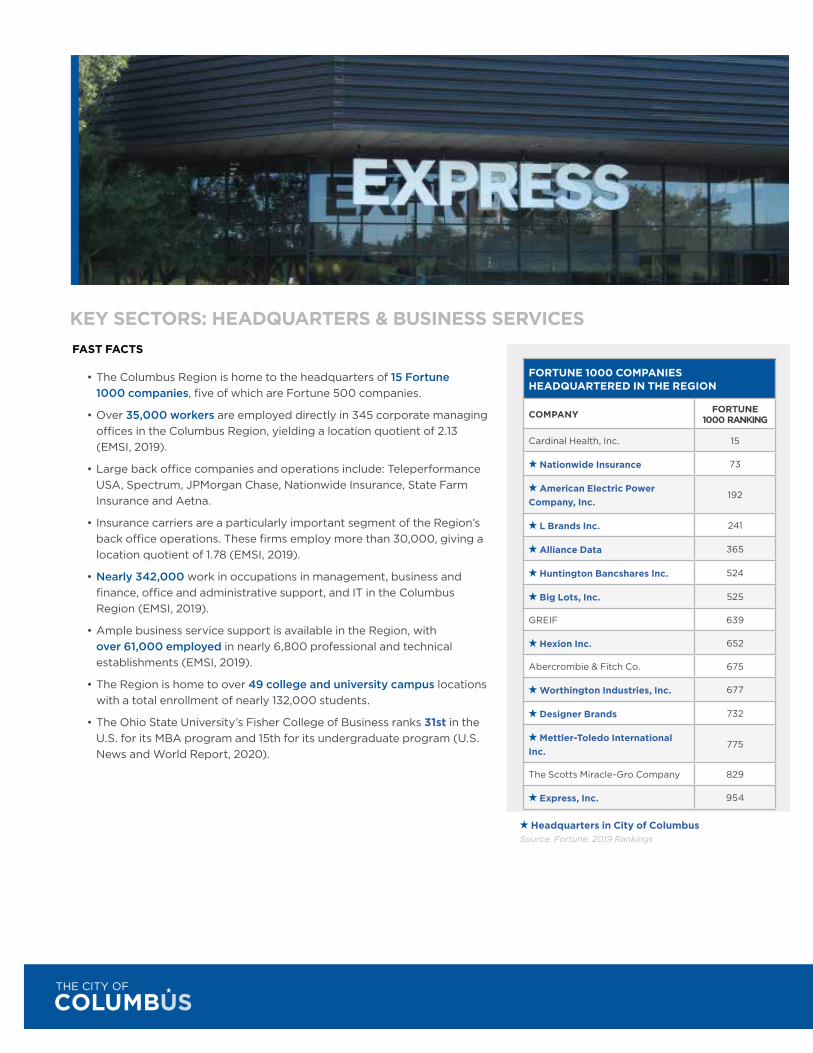
KEY SECTORS: HEADQUARTERS & BUSINESS SERVICESFAST FACTS
• The Columbus Region is home to the headquarters of 15 Fortune 1000 companies, five of which are Fortune 500 companies.
• Over 35,000 workers are employed directly in 345 corporate managing offices in the Columbus Region, yielding a location quotient of 2.13 (EMSI, 2019).
• Large back office companies and operations include: Teleperformance USA, Spectrum, JPMorgan Chase, Nationwide Insurance, State Farm Insurance and Aetna.
• Insurance carriers are a particularly important segment of the Region’s back office operations. These firms employ more than 30,000, giving a location quotient of 1.78 (EMSI, 2019).
• Nearly 342,000 work in occupations in management, business and finance, office and administrative support, and IT in the Columbus Region (EMSI, 2019).
• Ample business service support is available in the Region, with over 61,000 employed in nearly 6,800 professional and technical establishments (EMSI, 2019).
• The Region is home to over 49 college and university campus locations with a total enrollment of nearly 132,000 students.
• The Ohio State University’s Fisher College of Business ranks 31st in the U.S. for its MBA program and 15th for its undergraduate program (U.S. News and World Report, 2020).
Headquarters in City of ColumbusSource: Fortune, 2019 Rankings
19FACTBOOK
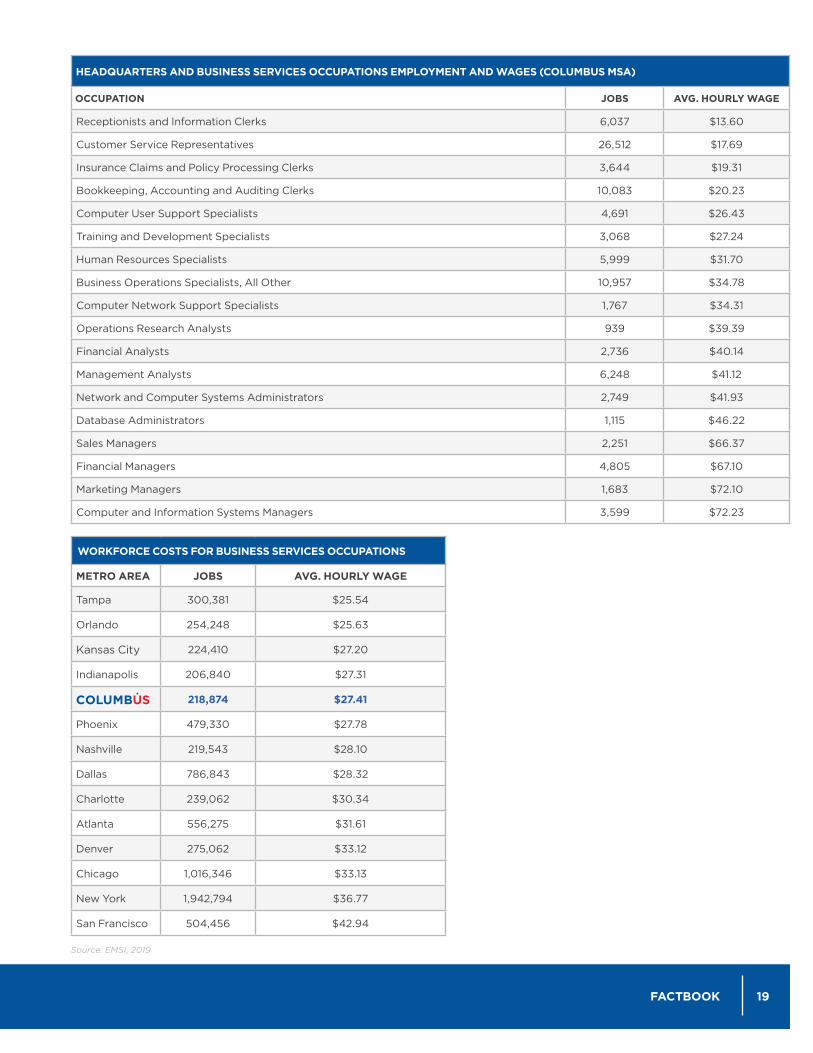
HEADQUARTERS AND BUSINESS SERVICES OCCUPATIONS EMPLOYMENT AND WAGES (COLUMBUS MSA)
OCCUPATION JOBS AVG. HOURLY WAGE
Receptionists and Information Clerks 6,037 $13.60
Customer Service Representatives 26,512 $17.69
Insurance Claims and Policy Processing Clerks 3,644 $19.31
Bookkeeping, Accounting and Auditing Clerks 10,083 $20.23
Computer User Support Specialists 4,691 $26.43
Training and Development Specialists 3,068 $27.24
Human Resources Specialists 5,999 $31.70
Business Operations Specialists, All Other 10,957 $34.78
Computer Network Support Specialists 1,767 $34.31
Operations Research Analysts 939 $39.39
Financial Analysts 2,736 $40.14
Management Analysts 6,248 $41.12
Network and Computer Systems Administrators 2,749 $41.93
Database Administrators 1,115 $46.22
Sales Managers 2,251 $66.37
Financial Managers 4,805 $67.10
Marketing Managers 1,683 $72.10
Computer and Information Systems Managers 3,599 $72.23
Source: EMSI, 2019
WORKFORCE COSTS FOR BUSINESS SERVICES OCCUPATIONS
METRO AREA JOBS AVG. HOURLY WAGE
Tampa 300,381 $25.54
Orlando 254,248 $25.63
Kansas City 224,410 $27.20
Indianapolis 206,840 $27.31
218,874 $27.41
Phoenix 479,330 $27.78
Nashville 219,543 $28.10
Dallas 786,843 $28.32
Charlotte 239,062 $30.34
Atlanta 556,275 $31.61
Denver 275,062 $33.12
Chicago 1,016,346 $33.13
New York 1,942,794 $36.77
San Francisco 504,456 $42.94
MarionCounty
KnoxCounty
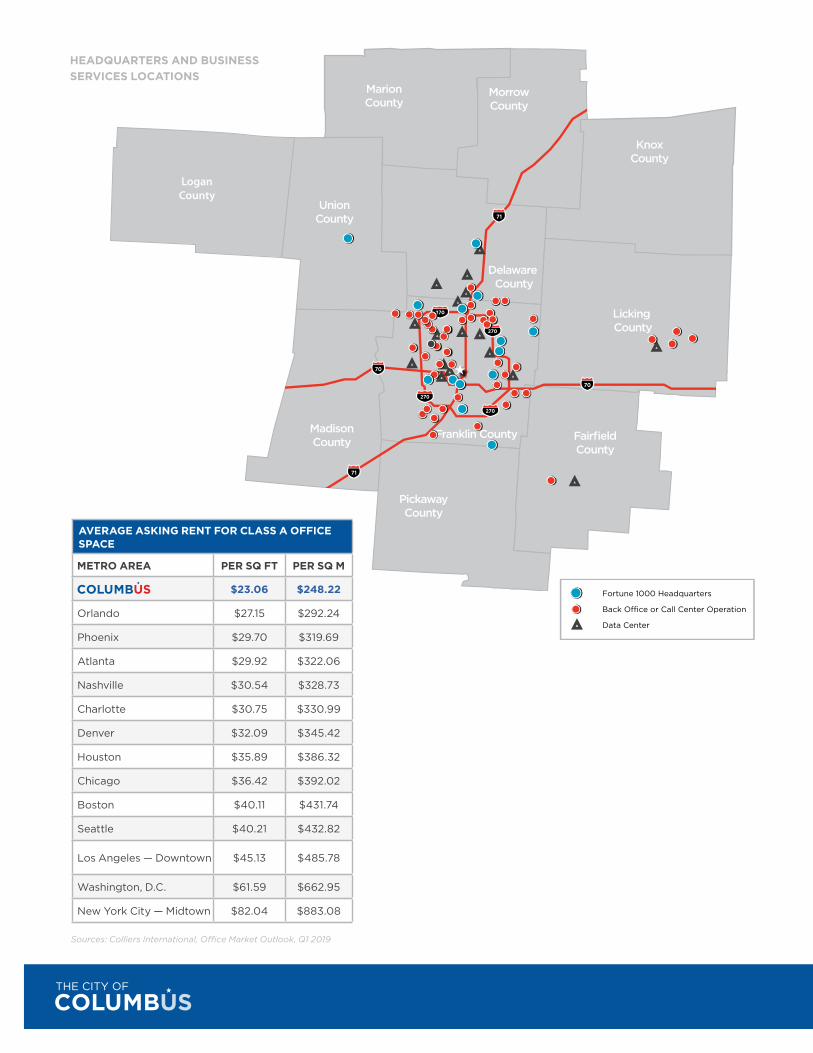
Fortune 1000 Headquarters
Back O�ce or Call Center Operation
Data Center
LoganCounty
MarionCounty
KnoxCounty
Fortune 1000 Headquarters
Back O�ce or Call Center Operation
Data Center
LoganCounty
Sources: Colliers International, Office Market Outlook, Q1 2019
HEADQUARTERS AND BUSINESS SERVICES LOCATIONS
AVERAGE ASKING RENT FOR CLASS A OFFICE SPACE
METRO AREA PER SQ FT PER SQ M
$23.06 $248.22
Orlando $27.15 $292.24
Phoenix $29.70 $319.69
Atlanta $29.92 $322.06
Nashville $30.54 $328.73
Charlotte $30.75 $330.99
Denver $32.09 $345.42
Houston $35.89 $386.32
Chicago $36.42 $392.02
Boston $40.11 $431.74
Seattle $40.21 $432.82
Los Angeles — Downtown $45.13 $485.78
Washington, D.C. $61.59 $662.95
New York City — Midtown $82.04 $883.08
21FACTBOOK
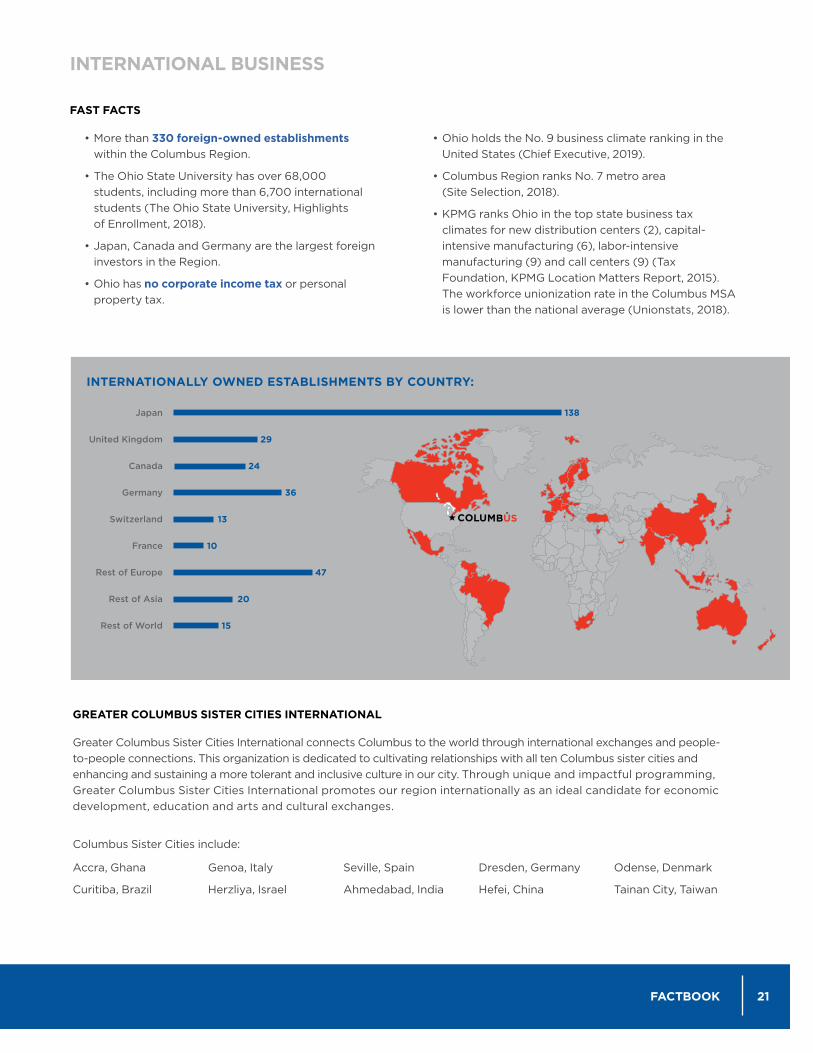
Source: One Columbus
INTERNATIONALLY OWNED ESTABLISHMENTS BY COUNTRY:
Japan
United Kingdom
Canada
Germany
Switzerland
France
Rest of Europe
Rest of Asia
Rest of World
29
24
36
13
47
10
20
15
138
INTERNATIONAL BUSINESS
FAST FACTS
• More than 330 foreign-owned establishments within the Columbus Region.
• The Ohio State University has over 68,000 students, including more than 6,700 international students (The Ohio State University, Highlights of Enrollment, 2018).
• Japan, Canada and Germany are the largest foreign investors in the Region.
• Ohio has no corporate income tax or personal property tax.
• Ohio holds the No. 9 business climate ranking in the United States (Chief Executive, 2019).
• Columbus Region ranks No. 7 metro area (Site Selection, 2018).
• KPMG ranks Ohio in the top state business tax climates for new distribution centers (2), capital- intensive manufacturing (6), labor-intensive manufacturing (9) and call centers (9) (Tax Foundation, KPMG Location Matters Report, 2015). The workforce unionization rate in the Columbus MSA is lower than the national average (Unionstats, 2018).
GREATER COLUMBUS SISTER CITIES INTERNATIONAL
Greater Columbus Sister Cities International connects Columbus to the world through international exchanges and people-to-people connections. This organization is dedicated to cultivating relationships with all ten Columbus sister cities and enhancing and sustaining a more tolerant and inclusive culture in our city. Through unique and impactful programming, Greater Columbus Sister Cities International promotes our region internationally as an ideal candidate for economic development, education and arts and cultural exchanges.
Columbus Sister Cities include:
Accra, Ghana
Curitiba, Brazil
Genoa, Italy
Herzliya, Israel
Seville, Spain
Ahmedabad, India
Dresden, Germany
Hefei, China
Odense, Denmark
Tainan City, Taiwan
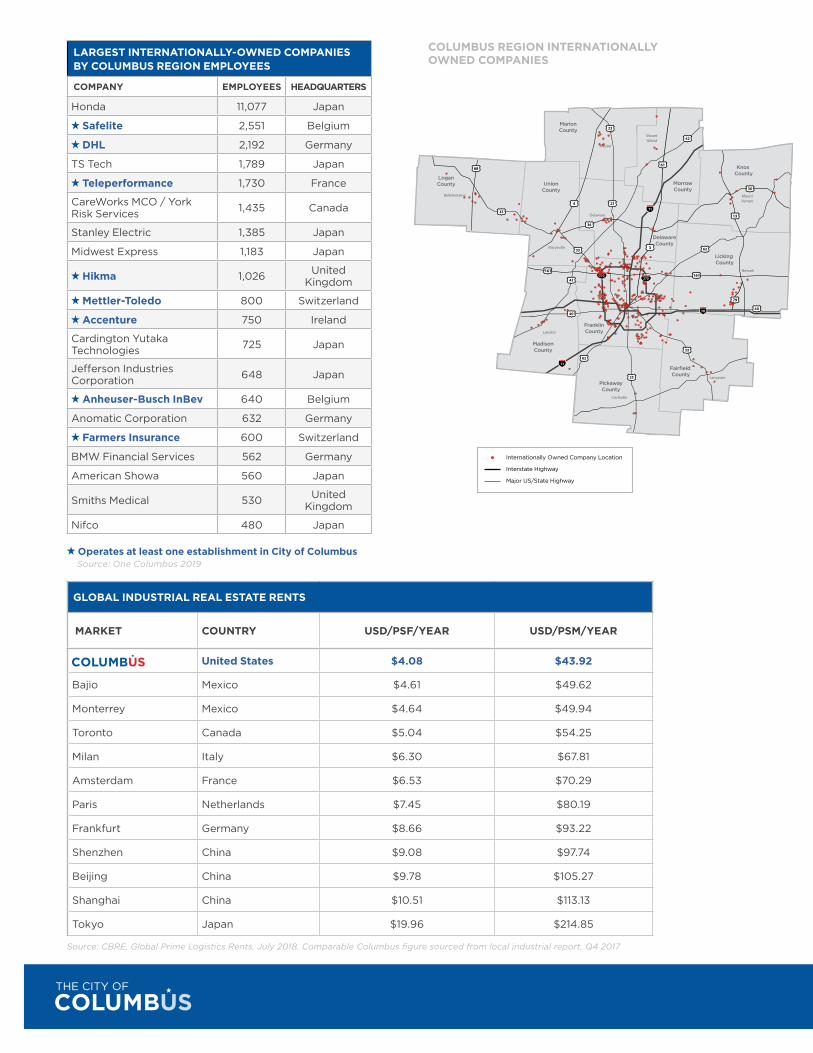
LARGEST INTERNATIONALLY-OWNED COMPANIES BY COLUMBUS REGION EMPLOYEES
COMPANY EMPLOYEES HEADQUARTERS
Honda 11,077 Japan
Safelite 2,551 Belgium
DHL 2,192 Germany
TS Tech 1,789 Japan
Teleperformance 1,730 France
CareWorks MCO / York Risk Services 1,435 Canada
Stanley Electric 1,385 Japan
Midwest Express 1,183 Japan
Hikma 1,026 United Kingdom
Mettler-Toledo 800 Switzerland
Accenture 750 Ireland
Cardington Yutaka Technologies 725 Japan
Jefferson Industries Corporation 648 Japan
Anheuser-Busch InBev 640 Belgium
Anomatic Corporation 632 Germany
Farmers Insurance 600 Switzerland
BMW Financial Services 562 Germany
American Showa 560 Japan
Smiths Medical 530 United Kingdom
Nifco 480 Japan
GLOBAL INDUSTRIAL REAL ESTATE RENTS
MARKET COUNTRY USD/PSF/YEAR USD/PSM/YEAR
United States $4.08 $43.92
Bajio Mexico $4.61 $49.62
Monterrey Mexico $4.64 $49.94
Toronto Canada $5.04 $54.25
Milan Italy $6.30 $67.81
Amsterdam France $6.53 $70.29
Paris Netherlands $7.45 $80.19
Frankfurt Germany $8.66 $93.22
Shenzhen China $9.08 $97.74
Beijing China $9.78 $105.27
Shanghai China $10.51 $113.13
Tokyo Japan $19.96 $214.85
Source: CBRE, Global Prime Logistics Rents, July 2018. Comparable Columbus figure sourced from local industrial report, Q4 2017
Internationally Owned Company Location
Interstate Highway
Major US/State Highway
COLUMBUS REGION INTERNATIONALLY OWNED COMPANIES
4
68
3
61
79
161161
Marion
MountGilead
MountVernon
Newark
Delaware
Circleville
Marysville
London
Lancaster
Bellefontaine
13
Knox County
Licking County
FranklinCounty
Fairfield County
PickawayCounty
MadisonCounty
DelawareCounty
MorrowCounty
MarionCounty
LoganCounty Union
County
Operates at least one establishment in City of Columbus Source: One Columbus 2019
23FACTBOOK
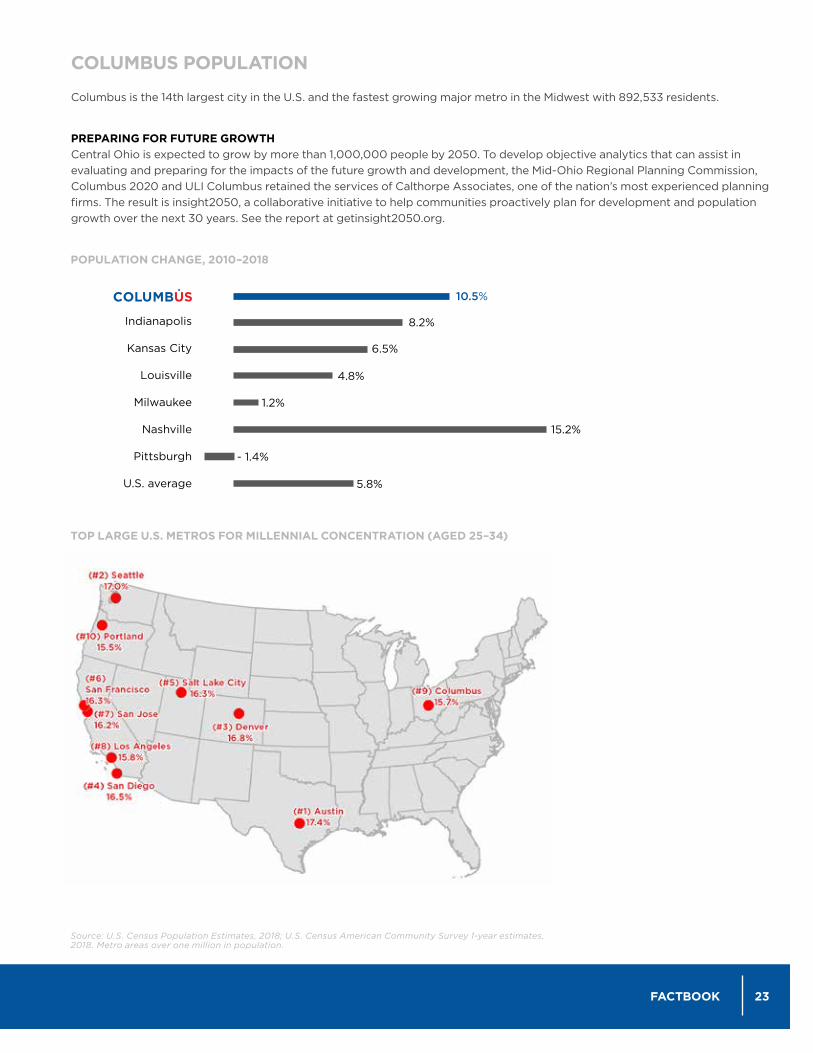
COLUMBUS POPULATION
Columbus is the 14th largest city in the U.S. and the fastest growing major metro in the Midwest with 892,533 residents.
PREPARING FOR FUTURE GROWTHCentral Ohio is expected to grow by more than 1,000,000 people by 2050. To develop objective analytics that can assist in evaluating and preparing for the impacts of the future growth and development, the Mid-Ohio Regional Planning Commission, Columbus 2020 and ULI Columbus retained the services of Calthorpe Associates, one of the nation’s most experienced planning firms. The result is insight2050, a collaborative initiative to help communities proactively plan for development and population growth over the next 30 years. See the report at getinsight2050.org.
Indianapolis
Kansas City
Louisville
Milwaukee
Nashville
Pittsburgh
U.S. average
8.2%
10.5%
6.5%
4.8%
5.8%
1.2%
15.2%
- 1.4%
TOP LARGE U.S. METROS FOR MILLENNIAL CONCENTRATION (AGED 25–34)
POPULATION CHANGE, 2010–2018
Source: U.S. Census Population Estimates, 2018; U.S. Census American Community Survey 1-year estimates,2018. Metro areas over one million in population.

QUALITY WORKFORCE
The Columbus population, well educated and relatively young, is growing at a pace above the national average.
36.1 36.7 37.6 39.237.9 36.5
43.1
38.2
Source: U.S. Census American Community Survey 1-year estimates, 2018.
MEDIAN AGE, METRO AREAS AND U.S., 2018
37.7%35.0% 37.0%
30.2%
36.0% 35.9% 35.5%32.6%
45.1% 44.8%
39.1%
44.8% 43.2%45.8%
41.2%42.9%
Associate Degree
Bachelor’s Degree & Higher
35.1%32.9%
35.8%
28.7%
33.9% 33.6% 32.9%30.6%
42.6% 43.5%
37.2%
42.3% 40.4%42.8%
38.8%40.5%
Associate Degree
Bachelor’s Degree & Higher
PERCENT OF POPULATION AGED 25+ WITH ASSOCIATE OR BACHELOR’S DEGREE AND HIGHER
MEDIAN AGE, METRO AREAS AND U.S., 2018
Source: U.S. Census American Community Survey 1-year estimates, 2018
25FACTBOOK
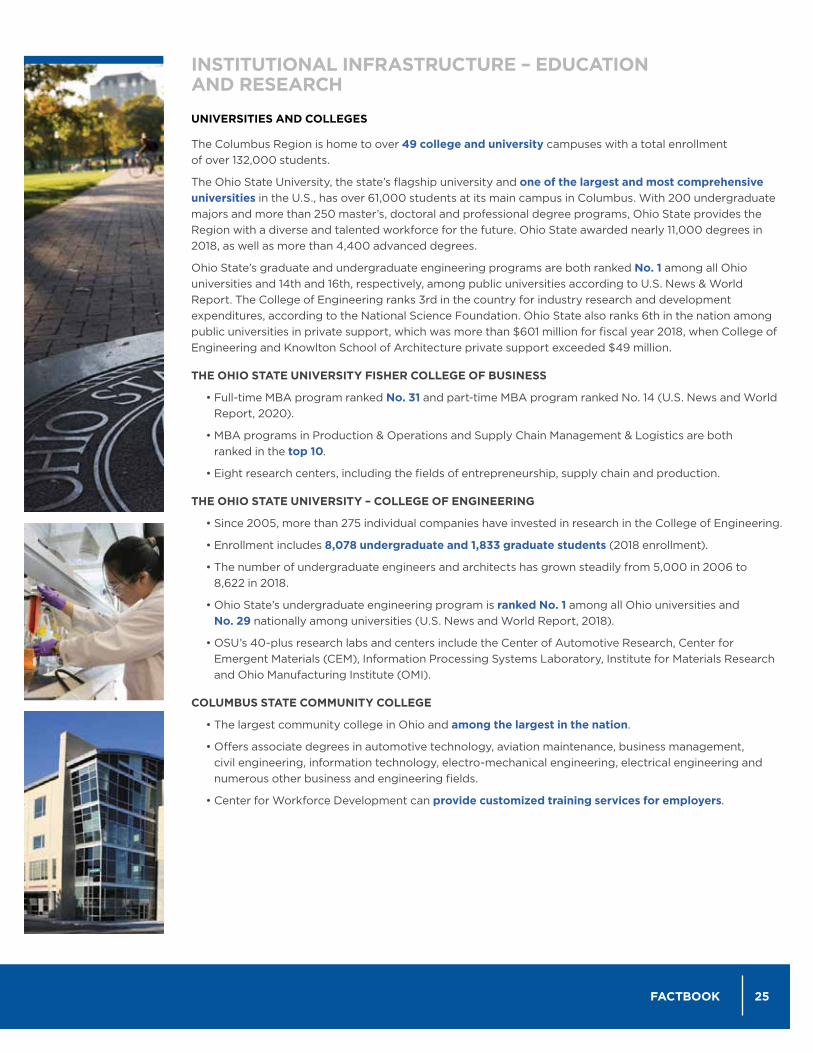
INSTITUTIONAL INFRASTRUCTURE – EDUCATION AND RESEARCH
UNIVERSITIES AND COLLEGES The Columbus Region is home to over 49 college and university campuses with a total enrollment of over 132,000 students.
The Ohio State University, the state’s flagship university and one of the largest and most comprehensive universities in the U.S., has over 61,000 students at its main campus in Columbus. With 200 undergraduate majors and more than 250 master’s, doctoral and professional degree programs, Ohio State provides the Region with a diverse and talented workforce for the future. Ohio State awarded nearly 11,000 degrees in 2018, as well as more than 4,400 advanced degrees.
Ohio State’s graduate and undergraduate engineering programs are both ranked No. 1 among all Ohio universities and 14th and 16th, respectively, among public universities according to U.S. News & World Report. The College of Engineering ranks 3rd in the country for industry research and development expenditures, according to the National Science Foundation. Ohio State also ranks 6th in the nation among public universities in private support, which was more than $601 million for fiscal year 2018, when College of Engineering and Knowlton School of Architecture private support exceeded $49 million.
THE OHIO STATE UNIVERSITY FISHER COLLEGE OF BUSINESS
• Full-time MBA program ranked No. 31 and part-time MBA program ranked No. 14 (U.S. News and World Report, 2020).
• MBA programs in Production & Operations and Supply Chain Management & Logistics are both ranked in the top 10.
• Eight research centers, including the fields of entrepreneurship, supply chain and production.
THE OHIO STATE UNIVERSITY – COLLEGE OF ENGINEERING
• Since 2005, more than 275 individual companies have invested in research in the College of Engineering.
• Enrollment includes 8,078 undergraduate and 1,833 graduate students (2018 enrollment).
• The number of undergraduate engineers and architects has grown steadily from 5,000 in 2006 to 8,622 in 2018.
• Ohio State’s undergraduate engineering program is ranked No. 1 among all Ohio universities and No. 29 nationally among universities (U.S. News and World Report, 2018).
• OSU’s 40-plus research labs and centers include the Center of Automotive Research, Center for Emergent Materials (CEM), Information Processing Systems Laboratory, Institute for Materials Research and Ohio Manufacturing Institute (OMI).
COLUMBUS STATE COMMUNITY COLLEGE
• The largest community college in Ohio and among the largest in the nation.
• Offers associate degrees in automotive technology, aviation maintenance, business management, civil engineering, information technology, electro-mechanical engineering, electrical engineering and numerous other business and engineering fields.
• Center for Workforce Development can provide customized training services for employers.
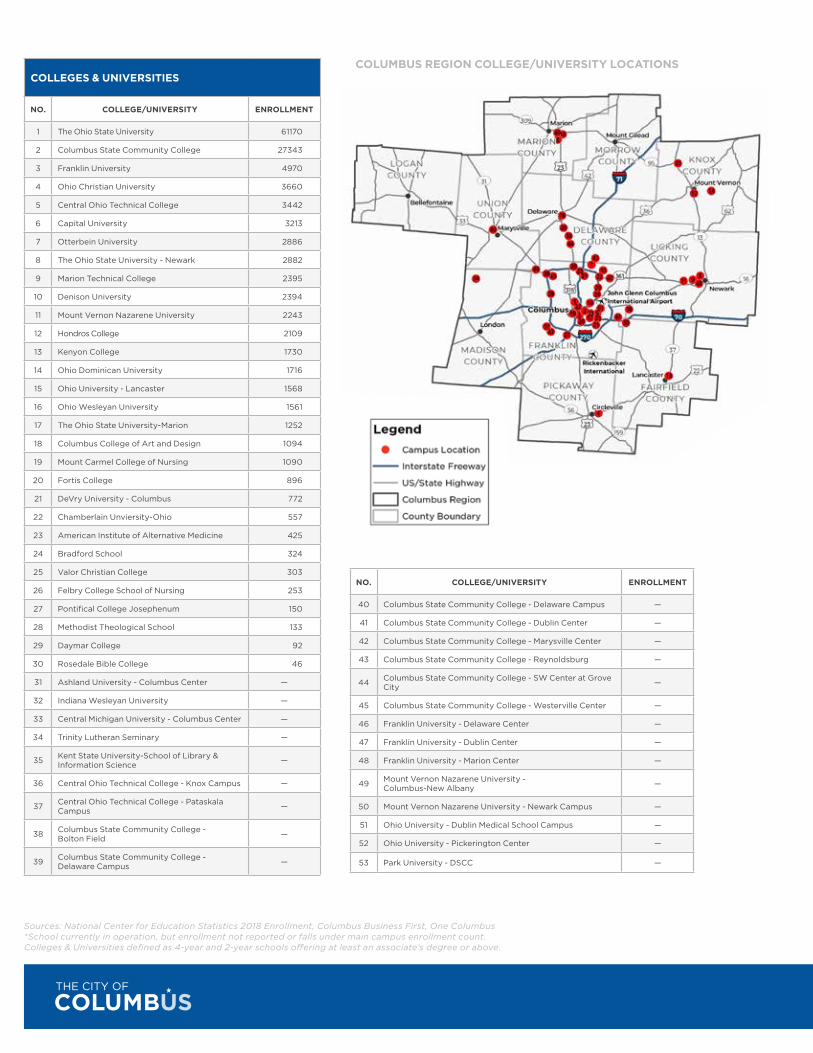
COLUMBUS REGION COLLEGE/UNIVERSITY LOCATIONS
Sources: National Center for Education Statistics 2018 Enrollment, Columbus Business First, One Columbus*School currently in operation, but enrollment not reported or falls under main campus enrollment count.Colleges & Universities defined as 4-year and 2-year schools offering at least an associate’s degree or above.
NO. COLLEGE/UNIVERSITY
40 Columbus State Community College - Delaware Campus
41 Columbus State Community College - Dublin Center
42 Columbus State Community College - Marysville Center
43 Columbus State Community College - Reynoldsburg
44 Columbus State Community College - SW Center at Grove City
45 Columbus State Community College - Westerville Center
46 Franklin University - Delaware Center
47 Franklin University - Dublin Center
48 Franklin University - Marion Center
49 Mount Vernon Nazarene University - Columbus-New Albany
50 Mount Vernon Nazarene University - Newark Campus
51 Ohio University - Dublin Medical School Campus
52 Ohio University - Pickerington Center
53 Park University - DSCC
COLLEGES & UNIVERSITIES
NO. COLLEGE/UNIVERSITY ENROLLMENT
1 The Ohio State University 61170
2 Columbus State Community College 27343
3 Franklin University 4970
4 Ohio Christian University 3660
5 Central Ohio Technical College 3442
6 Capital University 3213
7 Otterbein University 2886
8 The Ohio State University - Newark 2882
9 Marion Technical College 2395
10 Denison University 2394
11 Mount Vernon Nazarene University 2243
12 Hondros College 2109
13 Kenyon College 1730
14 Ohio Dominican University 1716
15 Ohio University - Lancaster 1568
16 Ohio Wesleyan University 1561
17 The Ohio State University-Marion 1252
18 Columbus College of Art and Design 1094
19 Mount Carmel College of Nursing 1090
20 Fortis College 896
21 DeVry University - Columbus 772
22 Chamberlain Unviersity-Ohio 557
23 American Institute of Alternative Medicine 425
24 Bradford School 324
25 Valor Christian College 303
26 Felbry College School of Nursing 253
27 Pontifical College Josephenum 150
28 Methodist Theological School 133
29 Daymar College 92
30 Rosedale Bible College 46
31 Ashland University - Columbus Center —
32 Indiana Wesleyan University —
33 Central Michigan University - Columbus Center —
34 Trinity Lutheran Seminary —
35 Kent State University-School of Library & Information Science —
36 Central Ohio Technical College - Knox Campus —
37 Central Ohio Technical College - Pataskala Campus —
38 Columbus State Community College - Bolton Field —
39 Columbus State Community College - Delaware Campus —
NO. COLLEGE/UNIVERSITY ENROLLMENT
40 Columbus State Community College - Delaware Campus —
41 Columbus State Community College - Dublin Center —
42 Columbus State Community College - Marysville Center —
43 Columbus State Community College - Reynoldsburg —
44 Columbus State Community College - SW Center at Grove City —
45 Columbus State Community College - Westerville Center —
46 Franklin University - Delaware Center —
47 Franklin University - Dublin Center —
48 Franklin University - Marion Center —
49 Mount Vernon Nazarene University - Columbus-New Albany —
50 Mount Vernon Nazarene University - Newark Campus —
51 Ohio University - Dublin Medical School Campus —
52 Ohio University - Pickerington Center —
53 Park University - DSCC —
27FACTBOOK
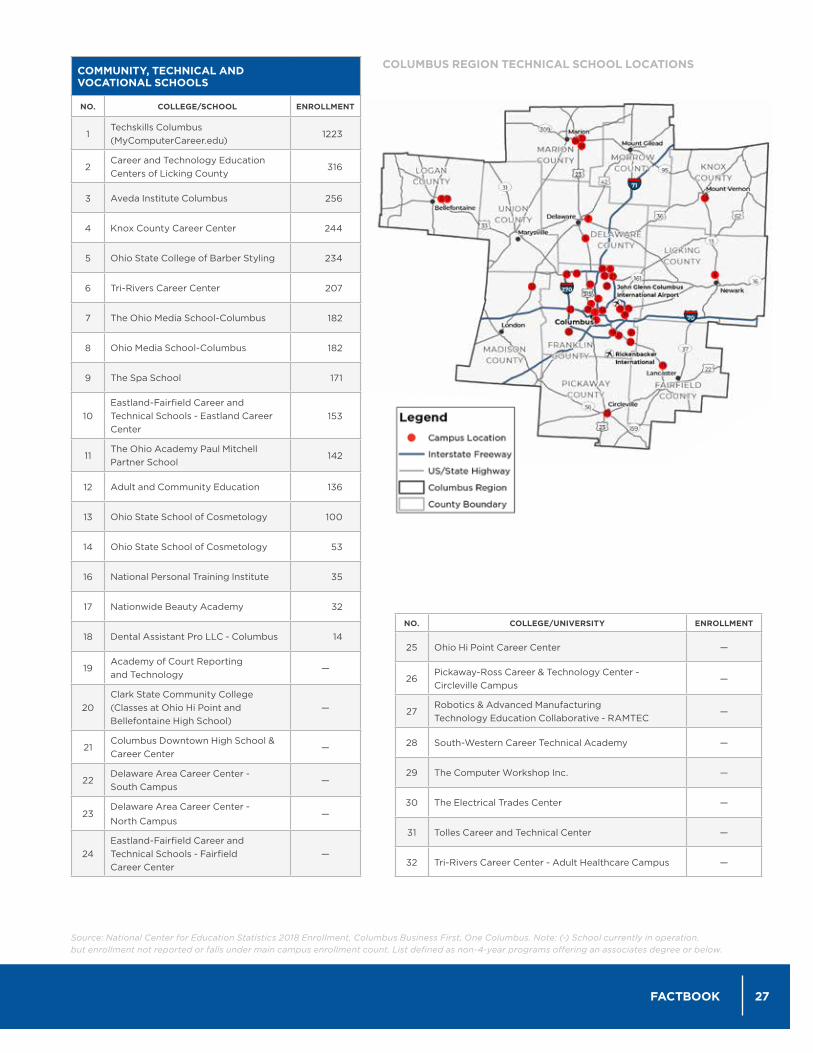
COMMUNITY, TECHNICAL AND VOCATIONAL SCHOOLS
NO. COLLEGE/SCHOOL ENROLLMENT
1Techskills Columbus (MyComputerCareer.edu)
1223
2Career and Technology Education Centers of Licking County
316
3 Aveda Institute Columbus 256
4 Knox County Career Center 244
5 Ohio State College of Barber Styling 234
6 Tri-Rivers Career Center 207
7 The Ohio Media School-Columbus 182
8 Ohio Media School-Columbus 182
9 The Spa School 171
10Eastland-Fairfield Career and Technical Schools - Eastland Career Center
153
11The Ohio Academy Paul Mitchell Partner School
142
12 Adult and Community Education 136
13 Ohio State School of Cosmetology 100
14 Ohio State School of Cosmetology 53
16 National Personal Training Institute 35
17 Nationwide Beauty Academy 32
18 Dental Assistant Pro LLC - Columbus 14
19Academy of Court Reporting and Technology
—
20Clark State Community College (Classes at Ohio Hi Point and Bellefontaine High School)
—
21Columbus Downtown High School & Career Center
—
22Delaware Area Career Center - South Campus
—
23Delaware Area Career Center -
North Campus—
24Eastland-Fairfield Career and Technical Schools - Fairfield Career Center
—
COLUMBUS REGION TECHNICAL SCHOOL LOCATIONS
Source: National Center for Education Statistics 2018 Enrollment, Columbus Business First, One Columbus. Note: (-) School currently in operation, but enrollment not reported or falls under main campus enrollment count. List defined as non-4-year programs offering an associates degree or below.
NO. COLLEGE/UNIVERSITY ENROLLMENT
25 Ohio Hi Point Career Center —
26Pickaway-Ross Career & Technology Center - Circleville Campus
—
27Robotics & Advanced Manufacturing Technology Education Collaborative - RAMTEC
—
28 South-Western Career Technical Academy —
29 The Computer Workshop Inc. —
30 The Electrical Trades Center —
31 Tolles Career and Technical Center —
32 Tri-Rivers Career Center - Adult Healthcare Campus —
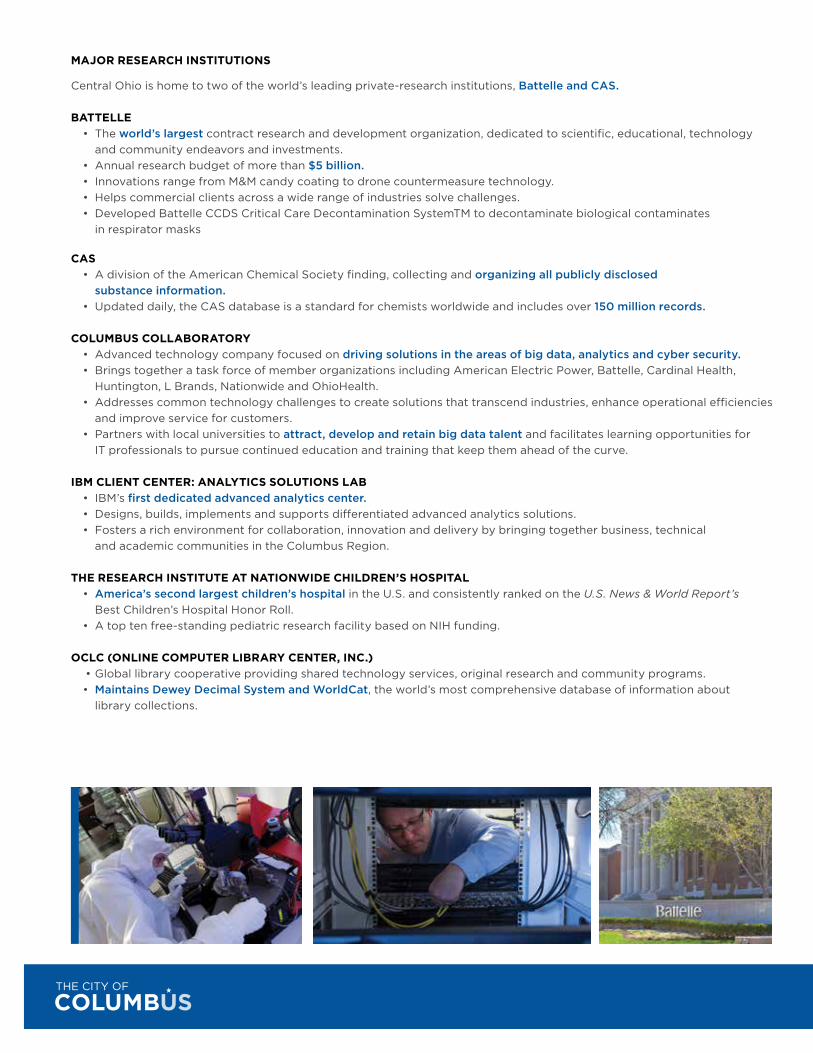
MAJOR RESEARCH INSTITUTIONS
Central Ohio is home to two of the world’s leading private-research institutions, Battelle and CAS.
BATTELLE • The world’s largest contract research and development organization, dedicated to scientific, educational, technology
and community endeavors and investments. • Annual research budget of more than $5 billion. • Innovations range from M&M candy coating to drone countermeasure technology. • Helps commercial clients across a wide range of industries solve challenges. • Developed Battelle CCDS Critical Care Decontamination SystemTM to decontaminate biological contaminates
in respirator masks
CAS • A division of the American Chemical Society finding, collecting and organizing all publicly disclosed substance information. • Updated daily, the CAS database is a standard for chemists worldwide and includes over 150 million records.
COLUMBUS COLLABORATORY • Advanced technology company focused on driving solutions in the areas of big data, analytics and cyber security. • Brings together a task force of member organizations including American Electric Power, Battelle, Cardinal Health,
Huntington, L Brands, Nationwide and OhioHealth. • Addresses common technology challenges to create solutions that transcend industries, enhance operational efficiencies
and improve service for customers. • Partners with local universities to attract, develop and retain big data talent and facilitates learning opportunities for
IT professionals to pursue continued education and training that keep them ahead of the curve.
IBM CLIENT CENTER: ANALYTICS SOLUTIONS LAB • IBM’s first dedicated advanced analytics center. • Designs, builds, implements and supports differentiated advanced analytics solutions. • Fosters a rich environment for collaboration, innovation and delivery by bringing together business, technical
and academic communities in the Columbus Region.
THE RESEARCH INSTITUTE AT NATIONWIDE CHILDREN’S HOSPITAL • America’s second largest children’s hospital in the U.S. and consistently ranked on the U.S. News & World Report’s
Best Children’s Hospital Honor Roll. • A top ten free-standing pediatric research facility based on NIH funding.
OCLC (ONLINE COMPUTER LIBRARY CENTER, INC.) • Global library cooperative providing shared technology services, original research and community programs. • Maintains Dewey Decimal System and WorldCat, the world’s most comprehensive database of information about library collections.
29FACTBOOK
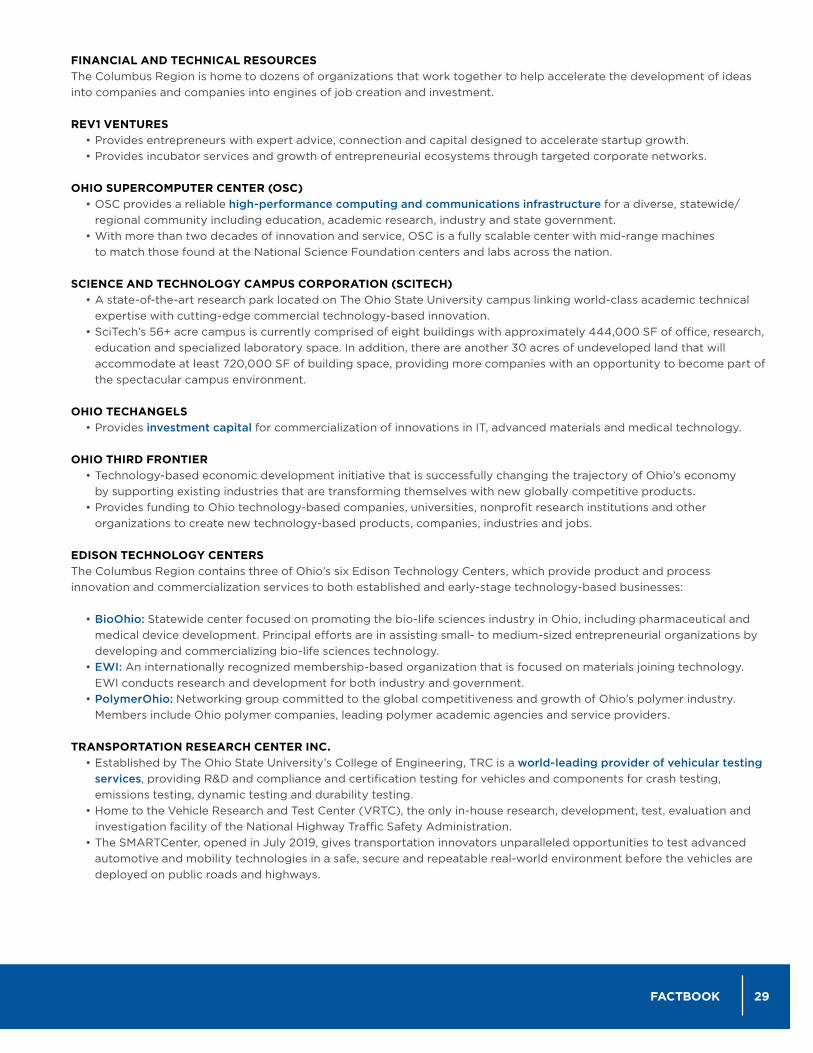
FINANCIAL AND TECHNICAL RESOURCESThe Columbus Region is home to dozens of organizations that work together to help accelerate the development of ideas into companies and companies into engines of job creation and investment.
REV1 VENTURES • Provides entrepreneurs with expert advice, connection and capital designed to accelerate startup growth. • Provides incubator services and growth of entrepreneurial ecosystems through targeted corporate networks.
OHIO SUPERCOMPUTER CENTER (OSC) • OSC provides a reliable high-performance computing and communications infrastructure for a diverse, statewide/
regional community including education, academic research, industry and state government. • With more than two decades of innovation and service, OSC is a fully scalable center with mid-range machines
to match those found at the National Science Foundation centers and labs across the nation.
SCIENCE AND TECHNOLOGY CAMPUS CORPORATION (SCITECH) • A state-of-the-art research park located on The Ohio State University campus linking world-class academic technical
expertise with cutting-edge commercial technology-based innovation. • SciTech’s 56+ acre campus is currently comprised of eight buildings with approximately 444,000 SF of office, research,
education and specialized laboratory space. In addition, there are another 30 acres of undeveloped land that will accommodate at least 720,000 SF of building space, providing more companies with an opportunity to become part of the spectacular campus environment.
OHIO TECHANGELS • Provides investment capital for commercialization of innovations in IT, advanced materials and medical technology.
OHIO THIRD FRONTIER • Technology-based economic development initiative that is successfully changing the trajectory of Ohio’s economy
by supporting existing industries that are transforming themselves with new globally competitive products. • Provides funding to Ohio technology-based companies, universities, nonprofit research institutions and other
organizations to create new technology-based products, companies, industries and jobs.
EDISON TECHNOLOGY CENTERSThe Columbus Region contains three of Ohio’s six Edison Technology Centers, which provide product and process innovation and commercialization services to both established and early-stage technology-based businesses:
• BioOhio: Statewide center focused on promoting the bio-life sciences industry in Ohio, including pharmaceutical and medical device development. Principal efforts are in assisting small- to medium-sized entrepreneurial organizations by developing and commercializing bio-life sciences technology.
• EWI: An internationally recognized membership-based organization that is focused on materials joining technology. EWI conducts research and development for both industry and government.
• PolymerOhio: Networking group committed to the global competitiveness and growth of Ohio’s polymer industry. Members include Ohio polymer companies, leading polymer academic agencies and service providers.
TRANSPORTATION RESEARCH CENTER INC. • Established by The Ohio State University’s College of Engineering, TRC is a world-leading provider of vehicular testing
services, providing R&D and compliance and certification testing for vehicles and components for crash testing, emissions testing, dynamic testing and durability testing.
• Home to the Vehicle Research and Test Center (VRTC), the only in-house research, development, test, evaluation and investigation facility of the National Highway Traffic Safety Administration.
• The SMARTCenter, opened in July 2019, gives transportation innovators unparalleled opportunities to test advanced automotive and mobility technologies in a safe, secure and repeatable real-world environment before the vehicles are deployed on public roads and highways.
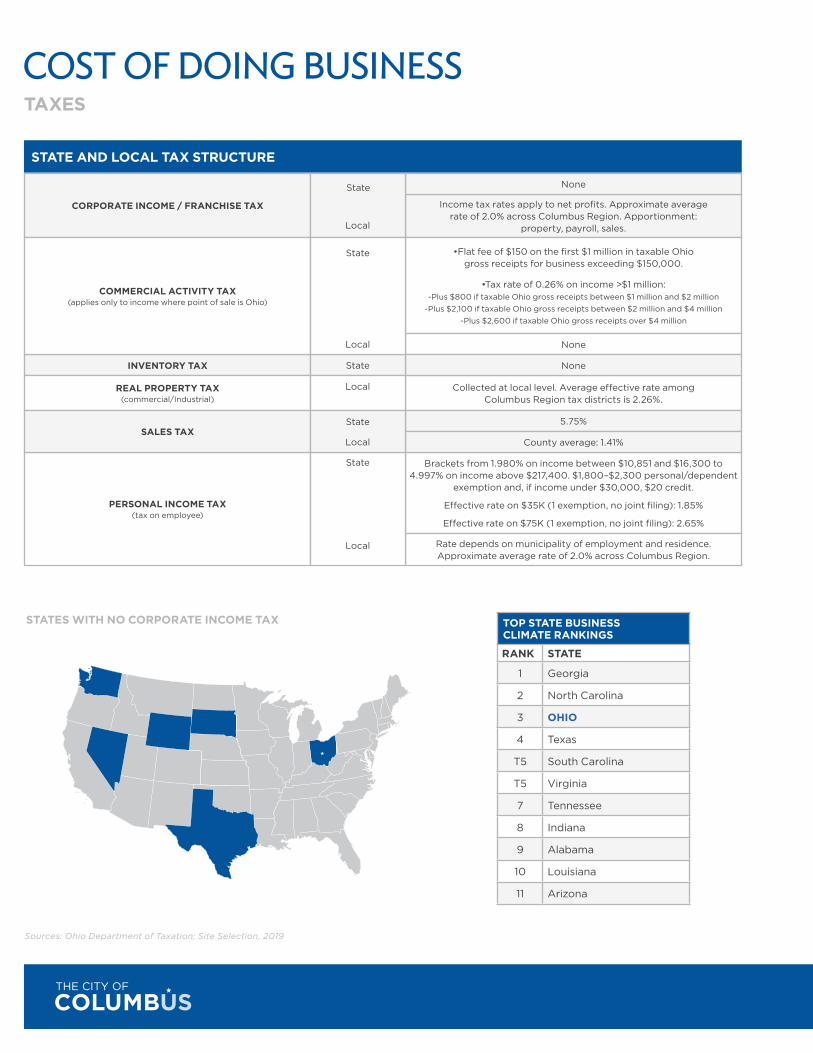
COST OF DOING BUSINESSTAXES
Sources: Ohio Department of Taxation; Site Selection, 2019
TOP STATE BUSINESS CLIMATE RANKINGS
RANK STATE
1 Georgia
2 North Carolina
3 OHIO
4 Texas
T5 South Carolina
T5 Virginia
7 Tennessee
8 Indiana
9 Alabama
10 Louisiana
11 Arizona
STATE AND LOCAL TAX STRUCTURE
CORPORATE INCOME / FRANCHISE TAX
INVENTORY TAX
COMMERCIAL ACTIVITY TAX (applies only to income where point of sale is Ohio)
REAL PROPERTY TAX (commercial/Industrial)
PERSONAL INCOME TAX (tax on employee)
SALES TAX
Income tax rates apply to net profits. Approximate average rate of 2.0% across Columbus Region. Apportionment:
property, payroll, sales.
•Flat fee of $150 on the first $1 million in taxable Ohio gross receipts for business exceeding $150,000.
•Tax rate of 0.26% on income >$1 million:-Plus $800 if taxable Ohio gross receipts between $1 million and $2 million
-Plus $2,100 if taxable Ohio gross receipts between $2 million and $4 million -Plus $2,600 if taxable Ohio gross receipts over $4 million
Collected at local level. Average effective rate among Columbus Region tax districts is 2.26%.
Brackets from 1.980% on income between $10,851 and $16,300 to 4.997% on income above $217,400. $1,800–$2,300 personal/dependent
exemption and, if income under $30,000, $20 credit.
Effective rate on $35K (1 exemption, no joint filing): 1.85%
Effective rate on $75K (1 exemption, no joint filing): 2.65%
Rate depends on municipality of employment and residence. Approximate average rate of 2.0% across Columbus Region.
5.75%
County average: 1.41%
None
None
None
Local
State
Local
State
Local
State
Local
State
Local
State
STATES WITH NO CORPORATE INCOME TAX
31FACTBOOK
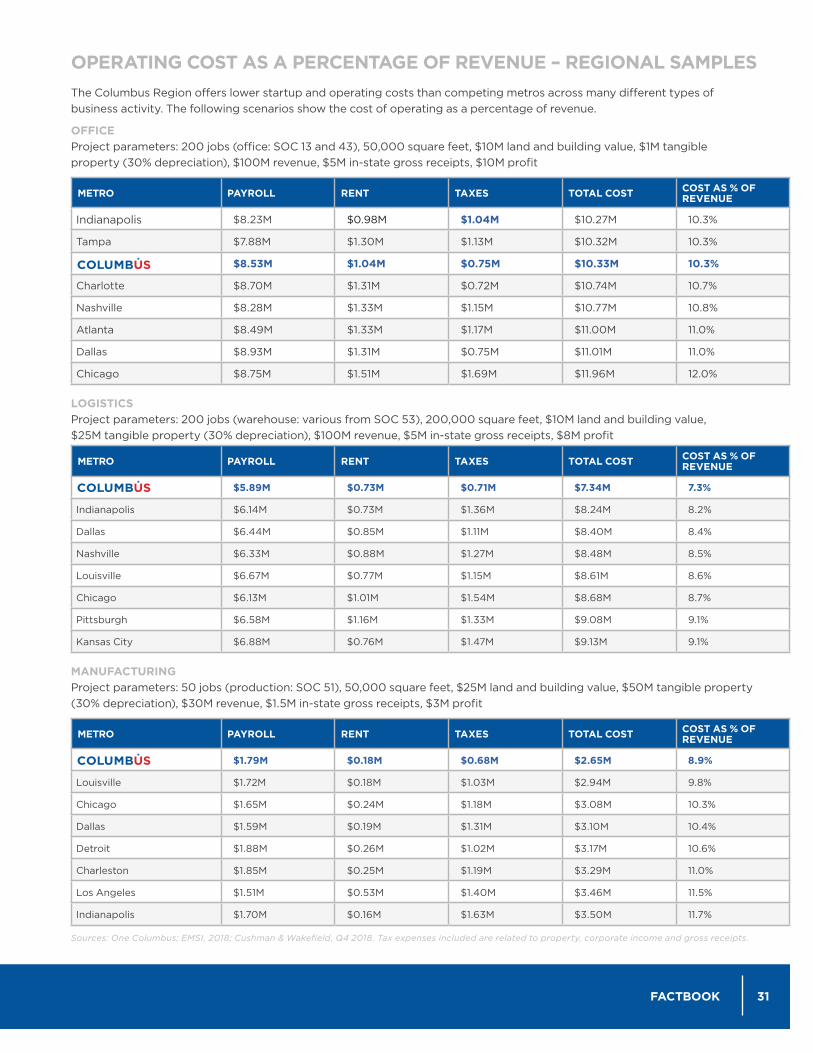
The Columbus Region offers lower startup and operating costs than competing metros across many different types of business activity. The following scenarios show the cost of operating as a percentage of revenue.
OFFICEProject parameters: 200 jobs (office: SOC 13 and 43), 50,000 square feet, $10M land and building value, $1M tangibleproperty (30% depreciation), $100M revenue, $5M in-state gross receipts, $10M profit
METRO PAYROLL RENT TAXES TOTAL COST COST AS % OF REVENUE
Indianapolis $8.23M $0.98M $1.04M $10.27M 10.3%
Tampa $7.88M $1.30M $1.13M $10.32M 10.3%
$8.53M $1.04M $0.75M $10.33M 10.3%
Charlotte $8.70M $1.31M $0.72M $10.74M 10.7%
Nashville $8.28M $1.33M $1.15M $10.77M 10.8%
Atlanta $8.49M $1.33M $1.17M $11.00M 11.0%
Dallas $8.93M $1.31M $0.75M $11.01M 11.0%
Chicago $8.75M $1.51M $1.69M $11.96M 12.0%
LOGISTICSProject parameters: 200 jobs (warehouse: various from SOC 53), 200,000 square feet, $10M land and building value, $25M tangible property (30% depreciation), $100M revenue, $5M in-state gross receipts, $8M profit
METRO PAYROLL RENT TAXES TOTAL COST COST AS % OF REVENUE
$5.89M $0.73M $0.71M $7.34M 7.3%
Indianapolis $6.14M $0.73M $1.36M $8.24M 8.2%
Dallas $6.44M $0.85M $1.11M $8.40M 8.4%
Nashville $6.33M $0.88M $1.27M $8.48M 8.5%
Louisville $6.67M $0.77M $1.15M $8.61M 8.6%
Chicago $6.13M $1.01M $1.54M $8.68M 8.7%
Pittsburgh $6.58M $1.16M $1.33M $9.08M 9.1%
Kansas City $6.88M $0.76M $1.47M $9.13M 9.1%
MANUFACTURINGProject parameters: 50 jobs (production: SOC 51), 50,000 square feet, $25M land and building value, $50M tangible property (30% depreciation), $30M revenue, $1.5M in-state gross receipts, $3M profit
METRO PAYROLL RENT TAXES TOTAL COST COST AS % OF REVENUE
$1.79M $0.18M $0.68M $2.65M 8.9%
Louisville $1.72M $0.18M $1.03M $2.94M 9.8%
Chicago $1.65M $0.24M $1.18M $3.08M 10.3%
Dallas $1.59M $0.19M $1.31M $3.10M 10.4%
Detroit $1.88M $0.26M $1.02M $3.17M 10.6%
Charleston $1.85M $0.25M $1.19M $3.29M 11.0%
Los Angeles $1.51M $0.53M $1.40M $3.46M 11.5%
Indianapolis $1.70M $0.16M $1.63M $3.50M 11.7%
Sources: One Columbus; EMSI, 2018; Cushman & Wakefield, Q4 2018. Tax expenses included are related to property, corporate income and gross receipts.
OPERATING COST AS A PERCENTAGE OF REVENUE – REGIONAL SAMPLES
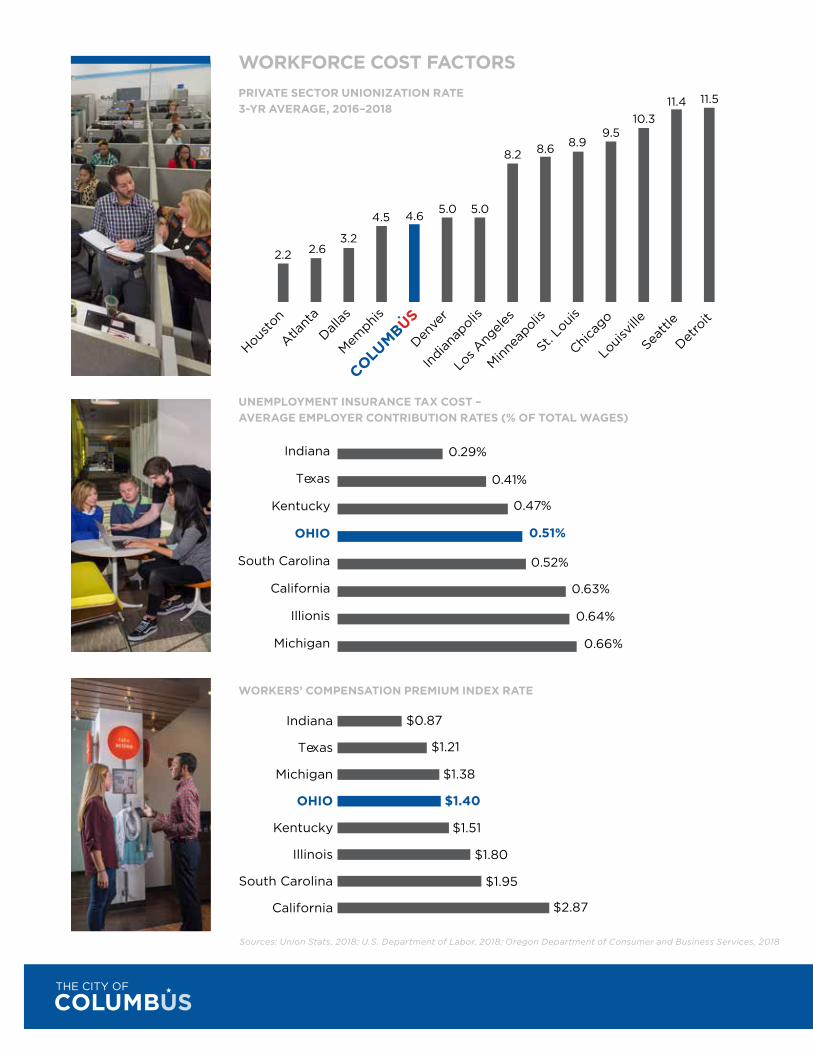
WORKFORCE COST FACTORS
Sources: Union Stats, 2018; U.S. Department of Labor, 2018; Oregon Department of Consumer and Business Services, 2018
PRIVATE SECTOR UNIONIZATION RATE 3-YR AVERAGE, 2016–2018
UNEMPLOYMENT INSURANCE TAX COST – AVERAGE EMPLOYER CONTRIBUTION RATES (% OF TOTAL WAGES)
WORKERS’ COMPENSATION PREMIUM INDEX RATE
Indiana
Texas
Michigan
OHIO
Kentucky
Illinois
South Carolina
California
$0.87
$1.40
$1.38
$1.21
$1.51
$1.80
$1.95
$2.87
Indiana
Texas
Kentucky
OHIO
South Carolina
California
Illionis
Michigan
0.29%
0.41%
0.47%
0.51%
0.52%
0.63%
0.64%
0.66%
2.62.23.2
4.5 4.6 5.0 5.0
8.2 8.6 8.99.5
11.410.3
11.5
Atlant
a
Chica
goDall
as
Denve
r
Detro
it
Housto
n
Indian
apolis
Los A
ngele
s
Loui
sville
Seattl
e
St. Lo
uis
Minne
apolis
Memphi
s
33FACTBOOK
$40.11
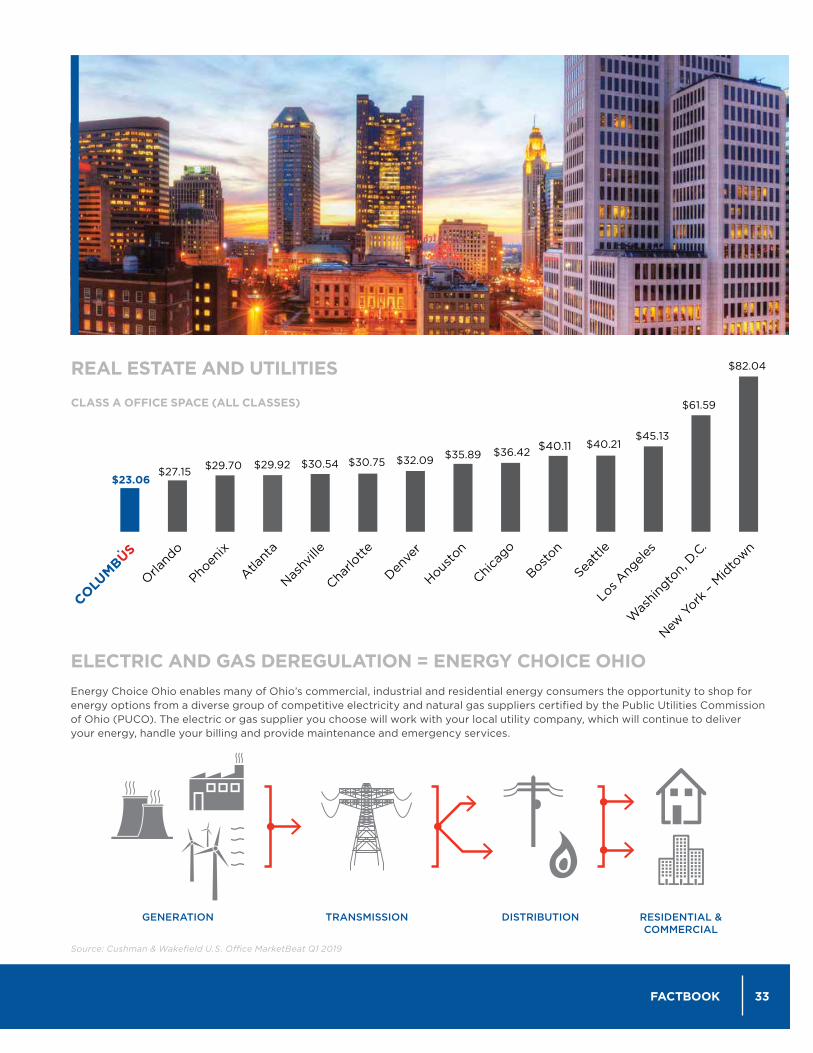
REAL ESTATE AND UTILITIES
CLASS A OFFICE SPACE (ALL CLASSES)
Source: Cushman & Wakefield U.S. Office MarketBeat Q1 2019
Energy Choice Ohio enables many of Ohio’s commercial, industrial and residential energy consumers the opportunity to shop for energy options from a diverse group of competitive electricity and natural gas suppliers certified by the Public Utilities Commission of Ohio (PUCO). The electric or gas supplier you choose will work with your local utility company, which will continue to deliver your energy, handle your billing and provide maintenance and emergency services.
ELECTRIC AND GAS DEREGULATION = ENERGY CHOICE OHIO
Charlo
tte
Atlant
a
Orland
o
Nashv
ille
Phoen
ix
Denve
r
Chica
go
Los A
ngele
s
Seattl
e
Housto
n
Boston
Was
hing
ton,
D.C.
New Y
ork –
Midto
wn
$23.06$27.15 $29.70 $29.92 $30.54 $30.75 $32.09 $35.89 $36.42
$40.21$45.13
$61.59
$82.04
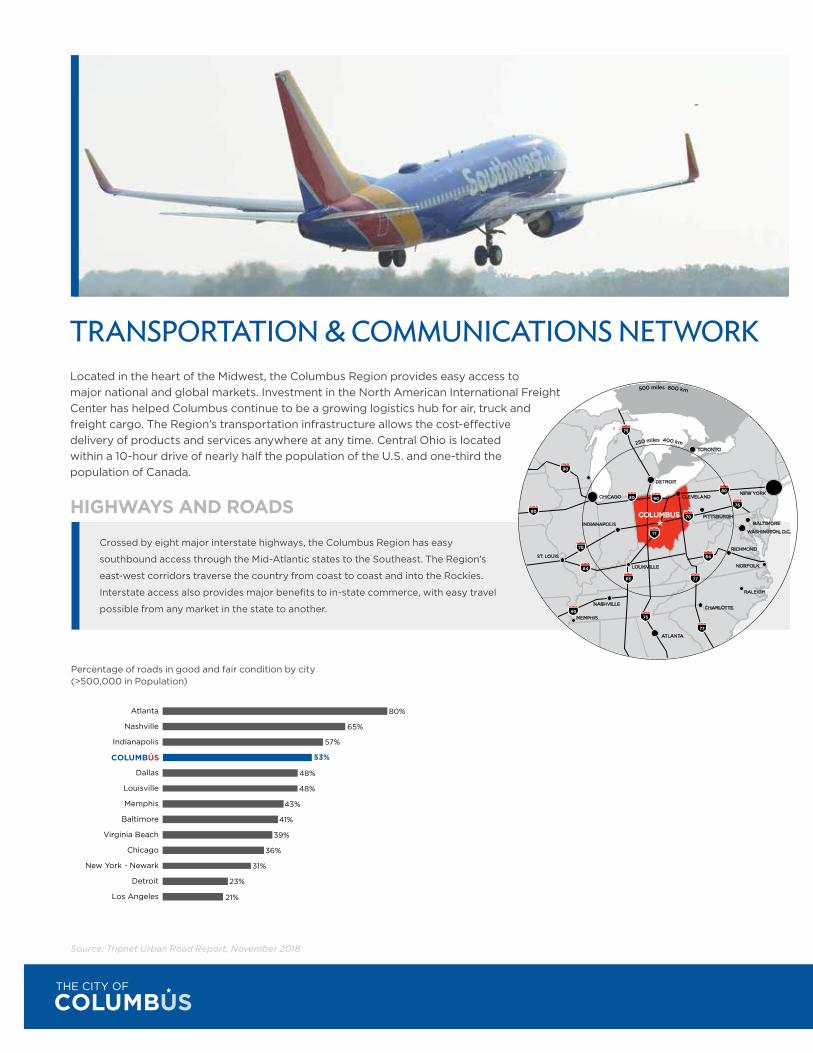
Located in the heart of the Midwest, the Columbus Region provides easy access to major national and global markets. Investment in the North American International Freight Center has helped Columbus continue to be a growing logistics hub for air, truck and freight cargo. The Region’s transportation infrastructure allows the cost-effective delivery of products and services anywhere at any time. Central Ohio is located within a 10-hour drive of nearly half the population of the U.S. and one-third the population of Canada.
HIGHWAYS AND ROADS
TRANSPORTATION & COMMUNICATIONS NETWORK
Crossed by eight major interstate highways, the Columbus Region has easy
southbound access through the Mid-Atlantic states to the Southeast. The Region’s
east-west corridors traverse the country from coast to coast and into the Rockies.
Interstate access also provides major benefits to in-state commerce, with easy travel
possible from any market in the state to another.
Percentage of roads in good and fair condition by city (>500,000 in Population)
Source: Tripnet Urban Road Report, November 2018
Atlanta
Nashville
Indianapolis
Dallas
Louisville
Memphis
Baltimore
Virginia Beach
Chicago
New York - Newark
Detroit
Los Angeles
80%
53%
57%
65%
48%
48%
43%
41%
39%
36%
31%
23%
21%
CLEVELAND
DETROIT
NEW YORK
BALTIMORE
WASHINGTON, D.C.
INDIANAPOLIS
CHICAGO
LOUISVILLE
PITTSBURGH
CHARLOTTE
RALEIGH
ATLANTA
MEMPHIS
NASHVILLE
NORFOLK
RICHMOND
ST. LOUIS
75
9080
90
64
70
80
71
COLUMBUS 70
76
77
77
64
75
65
40
250 miles 400 km
500 miles 800 km
80
TORONTO
35FACTBOOK
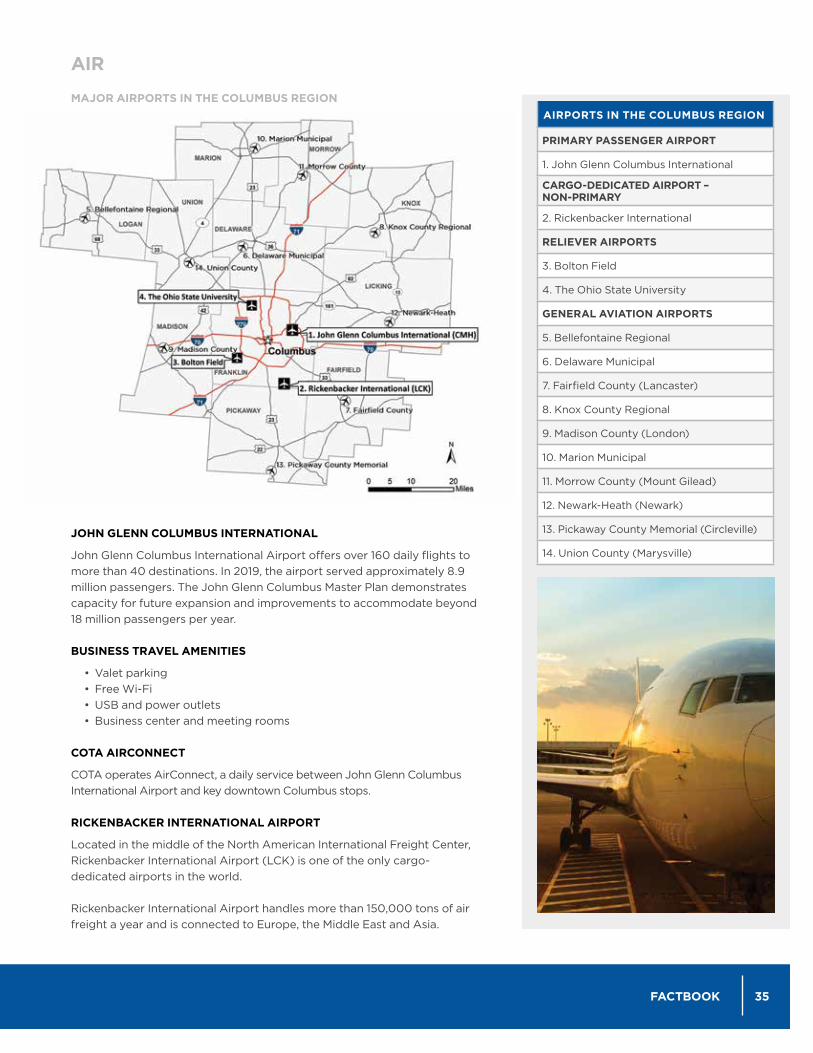
JOHN GLENN COLUMBUS INTERNATIONAL
John Glenn Columbus International Airport offers over 160 daily flights to more than 40 destinations. In 2019, the airport served approximately 8.9 million passengers. The John Glenn Columbus Master Plan demonstrates capacity for future expansion and improvements to accommodate beyond 18 million passengers per year.
BUSINESS TRAVEL AMENITIES
• Valet parking • Free Wi-Fi • USB and power outlets • Business center and meeting rooms
COTA AIRCONNECT
COTA operates AirConnect, a daily service between John Glenn Columbus International Airport and key downtown Columbus stops.
RICKENBACKER INTERNATIONAL AIRPORT
Located in the middle of the North American International Freight Center, Rickenbacker International Airport (LCK) is one of the only cargo-dedicated airports in the world.
Rickenbacker International Airport handles more than 150,000 tons of air freight a year and is connected to Europe, the Middle East and Asia.
AIR
MAJOR AIRPORTS IN THE COLUMBUS REGIONAIRPORTS IN THE COLUMBUS REGION
PRIMARY PASSENGER AIRPORT
1. John Glenn Columbus International
CARGO-DEDICATED AIRPORT – NON-PRIMARY
2. Rickenbacker International
RELIEVER AIRPORTS
3. Bolton Field
4. The Ohio State University
GENERAL AVIATION AIRPORTS
5. Bellefontaine Regional
6. Delaware Municipal
7. Fairfield County (Lancaster)
8. Knox County Regional
9. Madison County (London)
10. Marion Municipal
11. Morrow County (Mount Gilead)
12. Newark-Heath (Newark)
13. Pickaway County Memorial (Circleville)
14. Union County (Marysville)
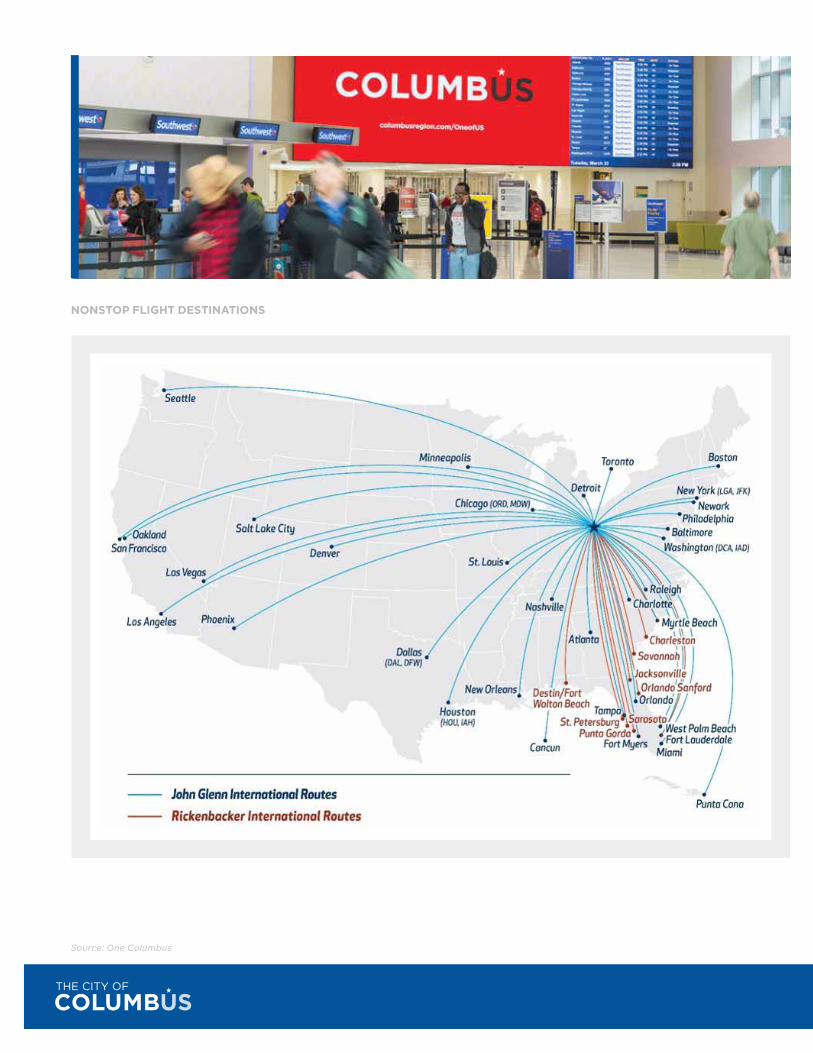
NONSTOP FLIGHT DESTINATIONS
Source: One Columbus
37FACTBOOK
FREIGHT RAIL AND PORT ACCESS
CLEVELAND
DETROIT
INDIANAPOLIS
CHICAGO
LOUISVILLE
PITTSBURGH
NORFOLK
COLUMBUS
CINCINNATI
Rickenbacker Intermodal Terminal
NORFOLK
BALTIMOREWASHINGTON, D.C.
WILMINGTON
CLEVELAND
DETROIT
INDIANAPOLIS
LOUISVILLE
PITTSBURGHCOLUMBUS
CINCINNATI
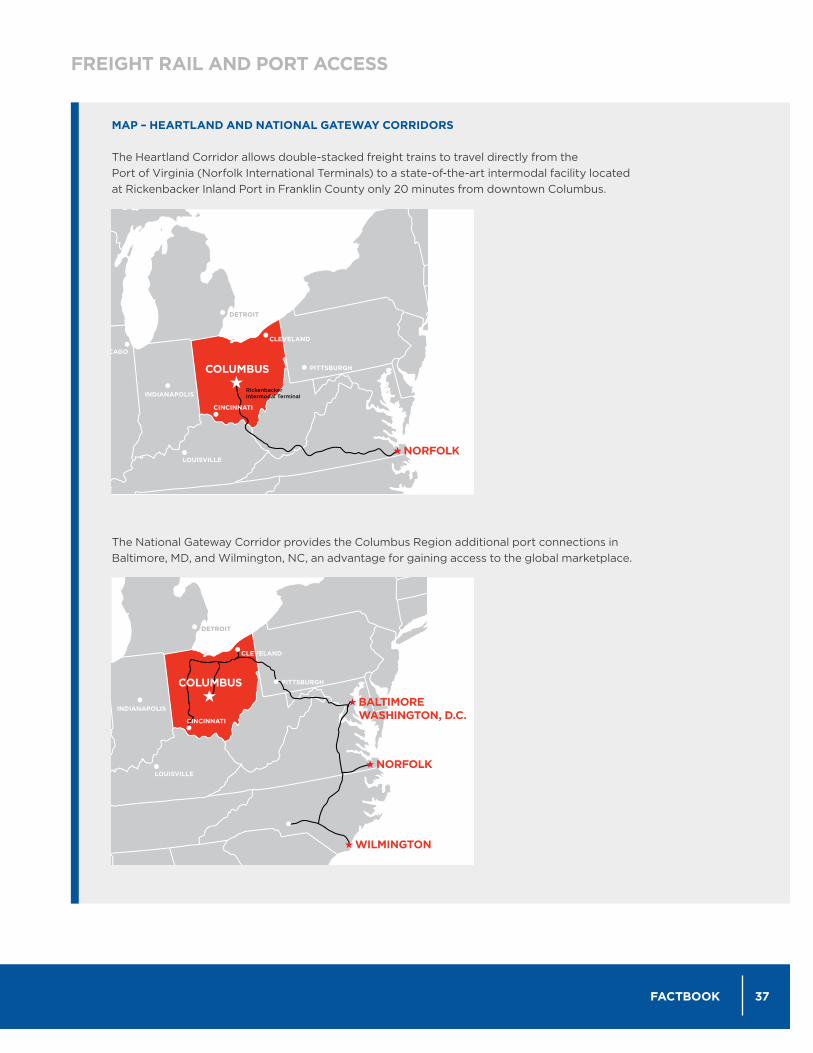
MAP – HEARTLAND AND NATIONAL GATEWAY CORRIDORS
The Heartland Corridor allows double-stacked freight trains to travel directly from the Port of Virginia (Norfolk International Terminals) to a state-of-the-art intermodal facility located at Rickenbacker Inland Port in Franklin County only 20 minutes from downtown Columbus.
The National Gateway Corridor provides the Columbus Region additional port connections in Baltimore, MD, and Wilmington, NC, an advantage for gaining access to the global marketplace.
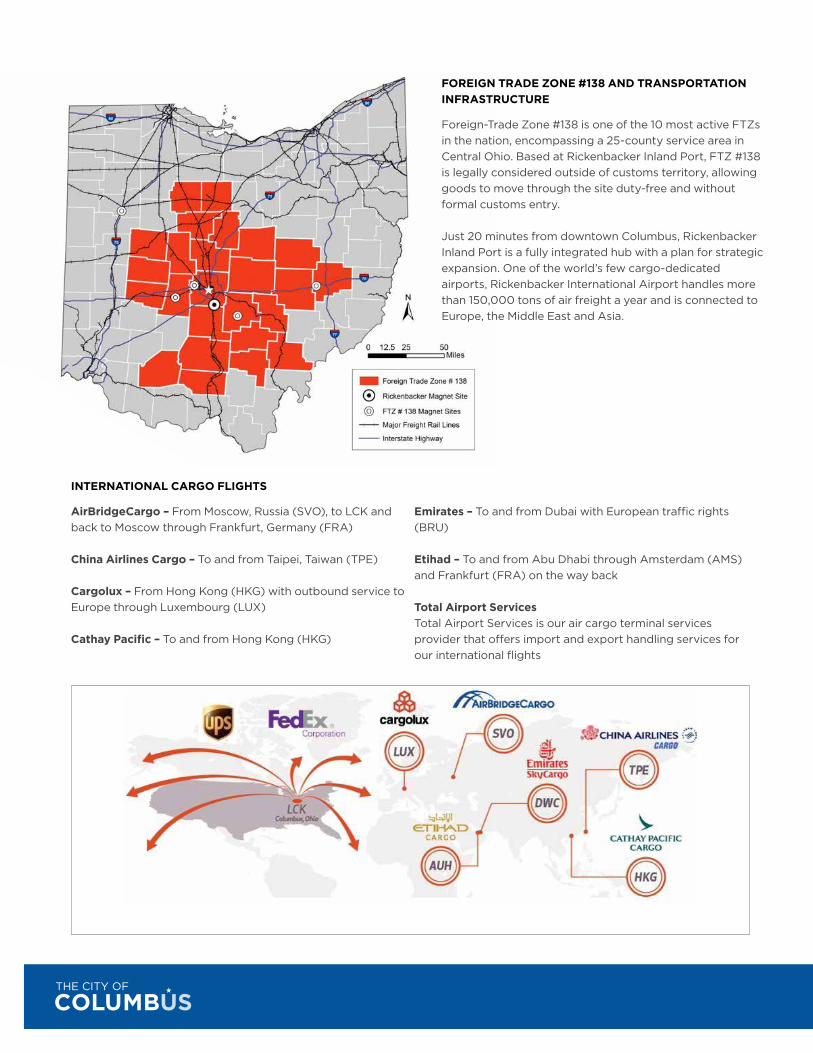
INTERNATIONAL CARGO FLIGHTS
AirBridgeCargo – From Moscow, Russia (SVO), to LCK and back to Moscow through Frankfurt, Germany (FRA)
China Airlines Cargo – To and from Taipei, Taiwan (TPE)
Cargolux – From Hong Kong (HKG) with outbound service to Europe through Luxembourg (LUX)
Cathay Pacific – To and from Hong Kong (HKG)
Emirates – To and from Dubai with European traffic rights (BRU)
Etihad – To and from Abu Dhabi through Amsterdam (AMS) and Frankfurt (FRA) on the way back
Total Airport Services Total Airport Services is our air cargo terminal services provider that offers import and export handling services for our international flights
FOREIGN TRADE ZONE #138 AND TRANSPORTATION INFRASTRUCTURE
Foreign-Trade Zone #138 is one of the 10 most active FTZs in the nation, encompassing a 25-county service area in Central Ohio. Based at Rickenbacker Inland Port, FTZ #138 is legally considered outside of customs territory, allowing goods to move through the site duty-free and without formal customs entry.
Just 20 minutes from downtown Columbus, Rickenbacker Inland Port is a fully integrated hub with a plan for strategic expansion. One of the world’s few cargo-dedicated airports, Rickenbacker International Airport handles more than 150,000 tons of air freight a year and is connected to Europe, the Middle East and Asia.
39FACTBOOK
I-270
104
U.S. 33
I-70
I-70
I-270
161
315
I-71
I-71
317
I-670
POLARIS PRWY.
MORSE RD.BETHEL RD.
N. BROADWAYFISHINGER RD.
LANE AVE.
FIFTH AVE.
DUBLIN RD.
RIVERSIDE DR.
TRABUE RD.
HAYDEN RUN RD.
SULLIVANT AVE.
CLIME RD.FRANK RD.
LIVINGSTON AVE.
NORT
ON R
D.
GROVEPORT RD.LITHOPOLIS RD.
WINCHESTER PIKE
HIGH ST. U.S. 23
REFUGEE RD.
MAIN ST.
BROAD ST.
BROAD ST.
SNOUFFER RD.
SMOKY ROW
RD.
AVERY RD.
CEMETERY RD.SCIOTO DARBY CREEK RD.
HILLIARD ROME RD.
ALTON DARBY CREEK RD.
GEOR
GESV
ILLE
RD.
SUNB
URY
RD.
WES
TERV
ILLE R
D.
U.S. 62
REYNOLDSBURG NEW ALBANY RD.
HARR
ISBUR
G PI
KE
FIFTH AVE.
WORTH
INGTO
N GALENA RD.
COSGRAY RD.
PARK RD.
SAWM
ILL RD.
JACKSON PIKECL
EVEL
AND
AVE.
STEL
ZER
RD.
HAM
ILTO
N RD
.
BRIC
E RD
.
GEND
ER R
D.
ALUM
CRE
EK D
R.
JAM
ES R
D.
LOCK
BOUR
NE R
D.
KARL
RD.
COOKE RD.
HUDSON ST.
WEBER RD.
17TH AVE.PA
RSON
S AV
E.
FAIR
WOO
D AV
E.
HIGH
ST.
U.S
. 23
WILSON RD.
HAGUE AVE.
LONDON-GROVEPORT RD.
OLENTANGYRIVER
RD.
HENDERSON RD.
GROVEPORT
WESTERVILLE
WORTHINGTON
DUBLIN
HILLIARD UPPERARLINGTON
GAHANNA
REYNOLDSBURGWHITEHALLBEXLEY
GROVEPORT
GROVECITY
GRANDVIEWHEIGHTS
NEWALBANY
CANALWINCHESTER
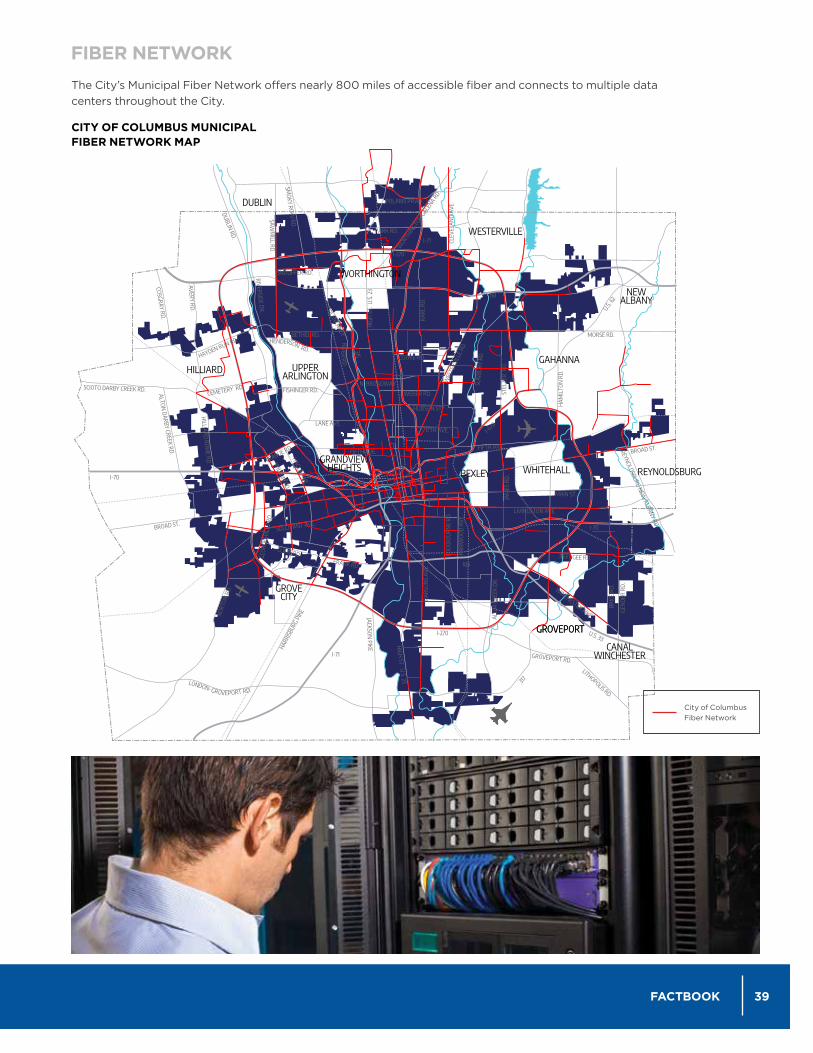
The City’s Municipal Fiber Network offers nearly 800 miles of accessible fiber and connects to multiple data centers throughout the City.
CITY OF COLUMBUS MUNICIPAL FIBER NETWORK MAP
FIBER NETWORK
City of Columbus Fiber Network
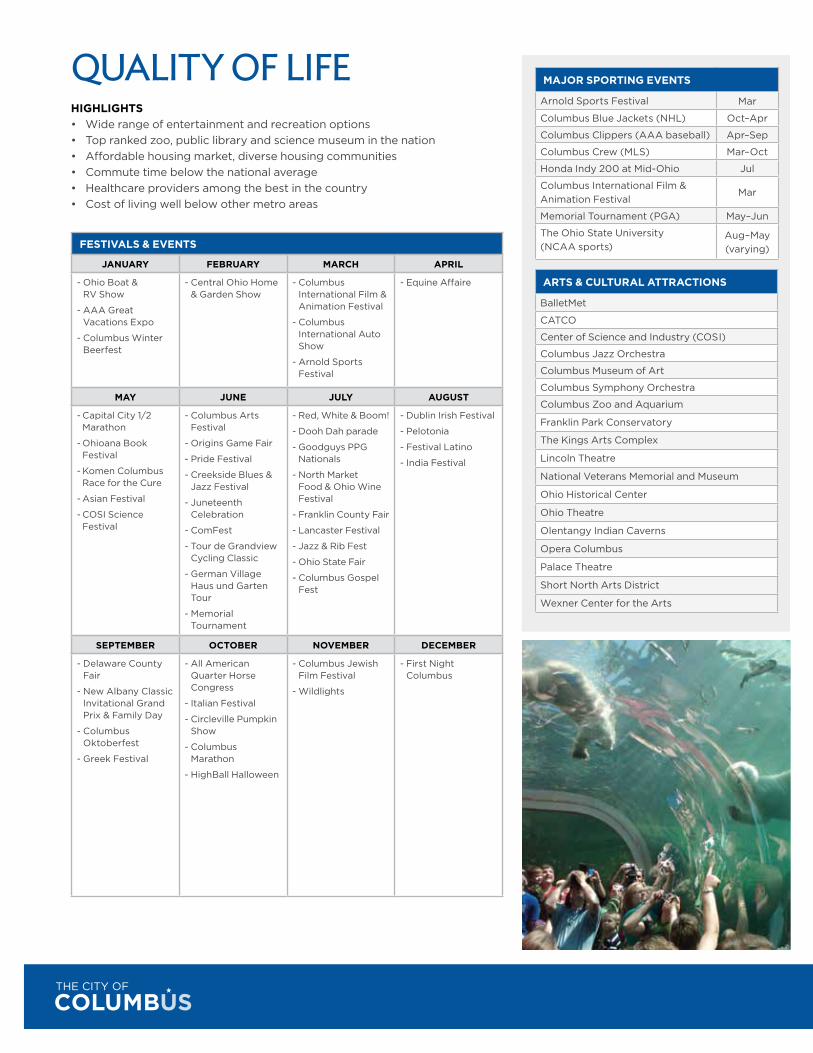
QUALITY OF LIFEHIGHLIGHTS• Wide range of entertainment and recreation options • Top ranked zoo, public library and science museum in the nation • Affordable housing market, diverse housing communities • Commute time below the national average • Healthcare providers among the best in the country • Cost of living well below other metro areas
FESTIVALS & EVENTS
JANUARY FEBRUARY MARCH APRIL
- Ohio Boat & RV Show
- AAA Great Vacations Expo
- Columbus Winter Beerfest
- Central Ohio Home & Garden Show
- Columbus International Film & Animation Festival
- Columbus International Auto Show
- Arnold Sports Festival
- Equine Affaire
MAY JUNE JULY AUGUST
- Capital City 1/2 Marathon
- Ohioana Book Festival
- Komen Columbus Race for the Cure
- Asian Festival
- COSI Science Festival
- Columbus Arts Festival
- Origins Game Fair
- Pride Festival
- Creekside Blues & Jazz Festival
- Juneteenth Celebration
- ComFest
- Tour de Grandview Cycling Classic
- German Village Haus und Garten Tour
- Memorial Tournament
- Red, White & Boom!
- Dooh Dah parade
- Goodguys PPG Nationals
- North Market Food & Ohio Wine Festival
- Franklin County Fair
- Lancaster Festival
- Jazz & Rib Fest
- Ohio State Fair
- Columbus Gospel Fest
- Dublin Irish Festival
- Pelotonia
- Festival Latino
- India Festival
SEPTEMBER OCTOBER NOVEMBER DECEMBER
- Delaware County Fair
- New Albany Classic Invitational Grand Prix & Family Day
- Columbus Oktoberfest
- Greek Festival
- All American Quarter Horse Congress
- Italian Festival
- Circleville Pumpkin Show
- Columbus Marathon
- HighBall Halloween
- Columbus Jewish Film Festival
- Wildlights
- First Night Columbus
MAJOR SPORTING EVENTS
Arnold Sports Festival Mar
Columbus Blue Jackets (NHL) Oct–Apr
Columbus Clippers (AAA baseball) Apr–Sep
Columbus Crew (MLS) Mar–Oct
Honda Indy 200 at Mid-Ohio Jul
Columbus International Film & Animation Festival
Mar
Memorial Tournament (PGA) May–Jun
The Ohio State University (NCAA sports)
Aug–May (varying)
ARTS & CULTURAL ATTRACTIONS
BalletMet
CATCO
Center of Science and Industry (COSI)
Columbus Jazz Orchestra
Columbus Museum of Art
Columbus Symphony Orchestra
Columbus Zoo and Aquarium
Franklin Park Conservatory
The Kings Arts Complex
Lincoln Theatre
National Veterans Memorial and Museum
Ohio Historical Center
Ohio Theatre
Olentangy Indian Caverns
Opera Columbus
Palace Theatre
Short North Arts District
Wexner Center for the Arts

41FACTBOOK
Situated in the middle of Ohio, the Columbus Region has a rich and varied climate. Columbus enjoys seasonal variability with cold winters and warm, humid summers.
WEATHER AND CLIMATE
COLUMBUS MONTHLY CLIMATE SUMMARY
MONTH DAILY MAX TEMP. F° DAILY MIN TEMP. F° MEAN TEMP. F° PRECIP. (INCHES)
January 36.5 22.6 29.6 2.73
February 40.6 25 32.8 2.25
March 51.1 32.7 41.9 3.02
April 63.5 42.6 53.1 3.4
May 72.9 52.2 62.5 4.17
June 81.6 61.5 71.5 4.01
July 84.9 65.5 75.2 4.79
August 83.7 64.1 73.9 3.32
September 77 56.5 66.8 2.84
October 65.1 45 55 2.61
November 52.6 36.1 44.4 3.2
December 40.1 26.8 33.5 2.97
Annual 62.6 44.3 53.4 39.3
Sources: NOAA National Climatic Data Center, 30 Year Averages; NOAA National Climatic Data Center
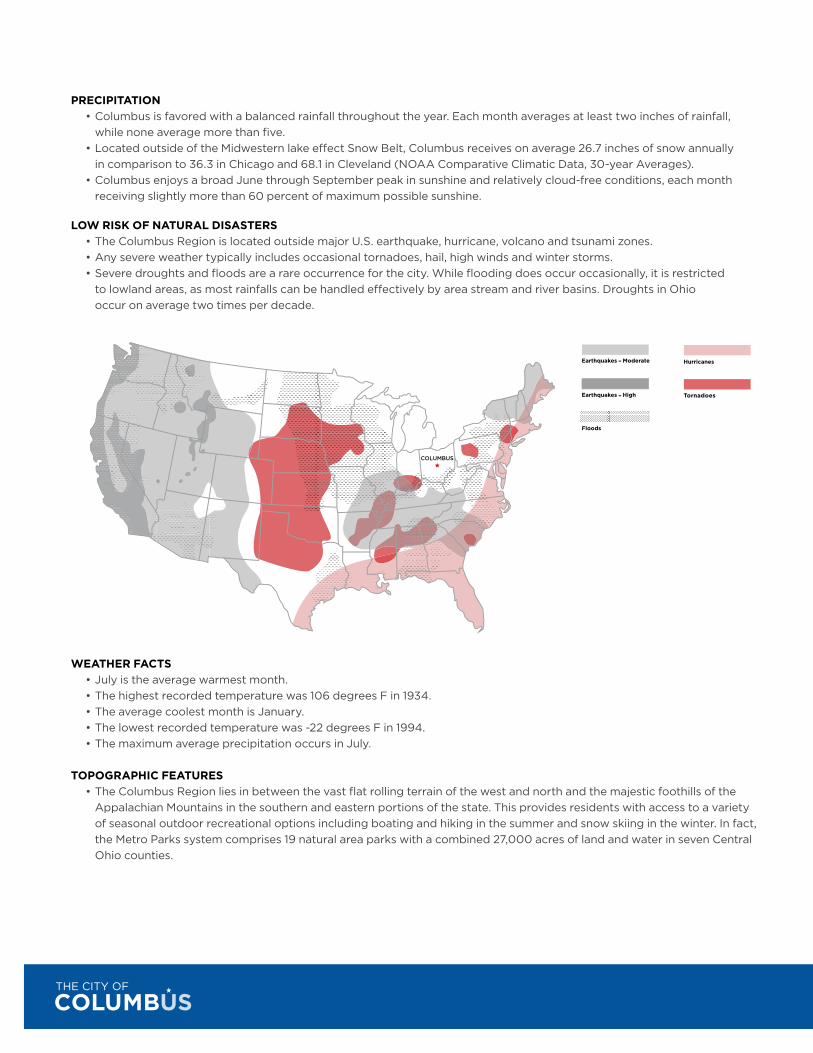
PRECIPITATION • Columbus is favored with a balanced rainfall throughout the year. Each month averages at least two inches of rainfall, while none average more than five. • Located outside of the Midwestern lake effect Snow Belt, Columbus receives on average 26.7 inches of snow annually
in comparison to 36.3 in Chicago and 68.1 in Cleveland (NOAA Comparative Climatic Data, 30-year Averages). • Columbus enjoys a broad June through September peak in sunshine and relatively cloud-free conditions, each month
receiving slightly more than 60 percent of maximum possible sunshine.
LOW RISK OF NATURAL DISASTERS • The Columbus Region is located outside major U.S. earthquake, hurricane, volcano and tsunami zones. • Any severe weather typically includes occasional tornadoes, hail, high winds and winter storms. • Severe droughts and floods are a rare occurrence for the city. While flooding does occur occasionally, it is restricted
to lowland areas, as most rainfalls can be handled effectively by area stream and river basins. Droughts in Ohio occur on average two times per decade.
WEATHER FACTS • July is the average warmest month. • The highest recorded temperature was 106 degrees F in 1934. • The average coolest month is January. • The lowest recorded temperature was -22 degrees F in 1994. • The maximum average precipitation occurs in July.
TOPOGRAPHIC FEATURES • The Columbus Region lies in between the vast flat rolling terrain of the west and north and the majestic foothills of the
Appalachian Mountains in the southern and eastern portions of the state. This provides residents with access to a variety of seasonal outdoor recreational options including boating and hiking in the summer and snow skiing in the winter. In fact, the Metro Parks system comprises 19 natural area parks with a combined 27,000 acres of land and water in seven Central Ohio counties.
Tornados
Hurricanes
Floods
Earthquakes - High
Earthquakes - Moderate
COLUMBUS
Tornados
Hurricanes
Floods
Earthquakes - High
Earthquakes - Moderate
Columbus
Tornadoes
Tornados
Hurricanes
Floods
Earthquakes - High
Earthquakes - Moderate
Columbus–
–
43FACTBOOK
* Degree day data are used to estimate amounts of energy required to maintain comfortable indoor temperature levels. Daily values are computed from each day’s mean temperature (max + min/2). Each degree that a day’s mean temperature is below or above 65 degrees Fahrenheit is counted as one heat-ing or cooling degree day. These measurements can help relate each day’s temperatures to the energy required to heat and cool buildings and can be very helpful in understanding and comparing electric usage.
For example, if the low temperature for a day was 40° and the high temperature was 70° (40° + 70° = 110°), the average was 55° (110°/2 = 55°). This average is 10 degrees colder than 65°, so this day had 10 heating degree days.
Any average daily temperature below 65° would represent a heating degree day, because you would operate the heater to offset the colder weather.
CLIMATE AND THE ECONOMY • Due to its location and atmospheric conditions, Ohio is a water-rich state, providing resources for commerce, agriculture
and recreation. The state boasts 74 state parks, 34 with marinas, and 60,000 miles of streams. Lake Erie lies along 262 miles of its northern border, and the Ohio River spans 436 miles of the southern border. A great beneficiary of Ohio’s water-rich environment is agriculture. Corn and soybeans are the top Ohio crops, followed by dairy products, greenhouse and nursery products. Ohio leads the country in egg and cheese production and ranks among the top state producers of flowers, especially poinsettias. Other crops include: winter wheat, hay, tomatoes for processing, apples, grapes, sweet corn, mushrooms, maple syrup and more. Ohio also harvests and exports a significant amount of its hardwood forests in the southeastern hills.
COLUMBUS HEATING AND COOLING DEGREE DAYS*
MONTH HEATING DEGREE
DAYS
COOLING DEGREE
DAYS
January 1,099 0
February 901 0
March 717 1
April 372 14
May 145 69
June 19 216
July 1 317
August 4 280
September 69 121
October 325 16
November 620 1
December 978 0
Annual 5,250 1,034
MINNEAPOLIS HEATING AND COOLING DEGREE DAYS
MONTH HEATING DEGREE
DAYS
COOLING DEGREE
DAYS
January 1,531 0
February 1,236 0
March 998 0
April 530 5
May 218 37
June 44 158
July 5 276
August 14 205
September 154 66
October 507 6
November 939 0
December 1,404 0
Annual 7,581 752
AUSTIN HEATING AND COOLING DEGREE DAYS
MONTH HEATING DEGREE
DAYS
COOLING DEGREE
DAYS
January 428 9
February 297 18
March 162 61
April 38 164
May 2 361
June 0 516
July 0 620
August 0 645
September 2 450
October 29 221
November 181 61
December 400 13
Annual 1,540 3,140
Other cities for comparison:
Sources: NOAA National Climatic Data Center, 30 Year Averages; NOAA National Climatic Data Center, Climate of Ohio Report
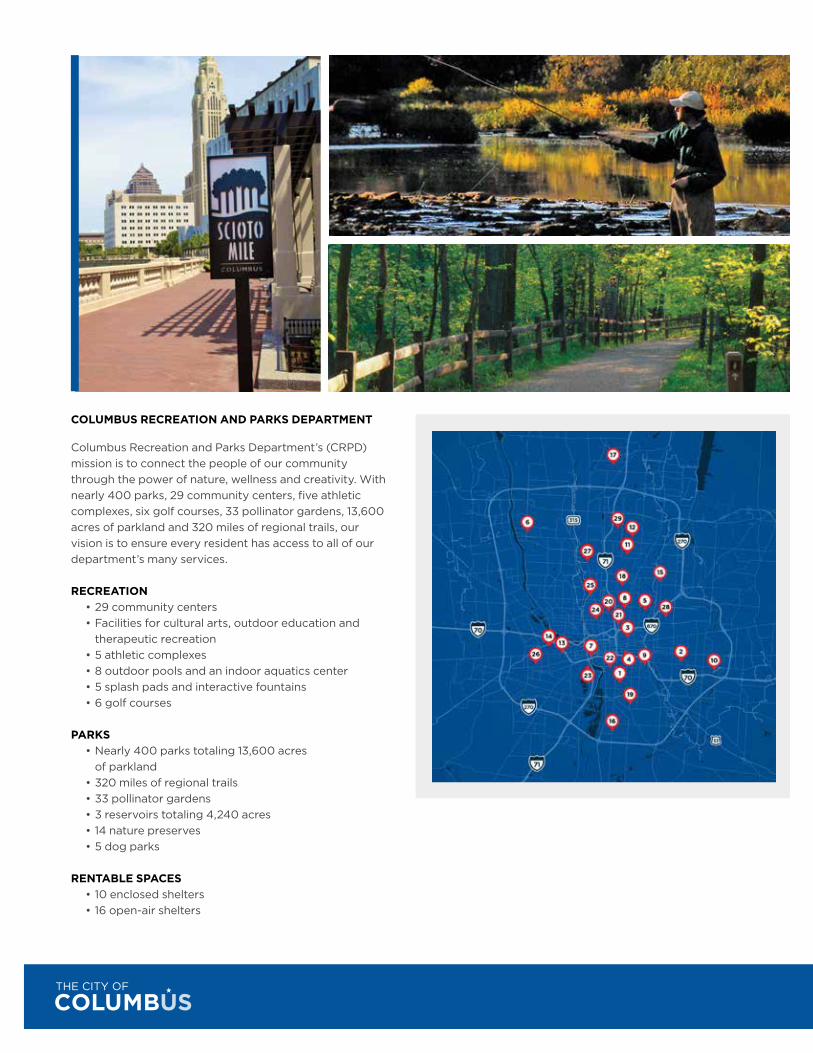
COLUMBUS RECREATION AND PARKS DEPARTMENT
Columbus Recreation and Parks Department’s (CRPD) mission is to connect the people of our community through the power of nature, wellness and creativity. With nearly 400 parks, 29 community centers, five athletic complexes, six golf courses, 33 pollinator gardens, 13,600 acres of parkland and 320 miles of regional trails, our vision is to ensure every resident has access to all of our department’s many services.
RECREATION • 29 community centers • Facilities for cultural arts, outdoor education and
therapeutic recreation • 5 athletic complexes • 8 outdoor pools and an indoor aquatics center • 5 splash pads and interactive fountains • 6 golf courses
PARKS • Nearly 400 parks totaling 13,600 acres
of parkland • 320 miles of regional trails • 33 pollinator gardens • 3 reservoirs totaling 4,240 acres • 14 nature preserves • 5 dog parks
RENTABLE SPACES • 10 enclosed shelters • 16 open-air shelters
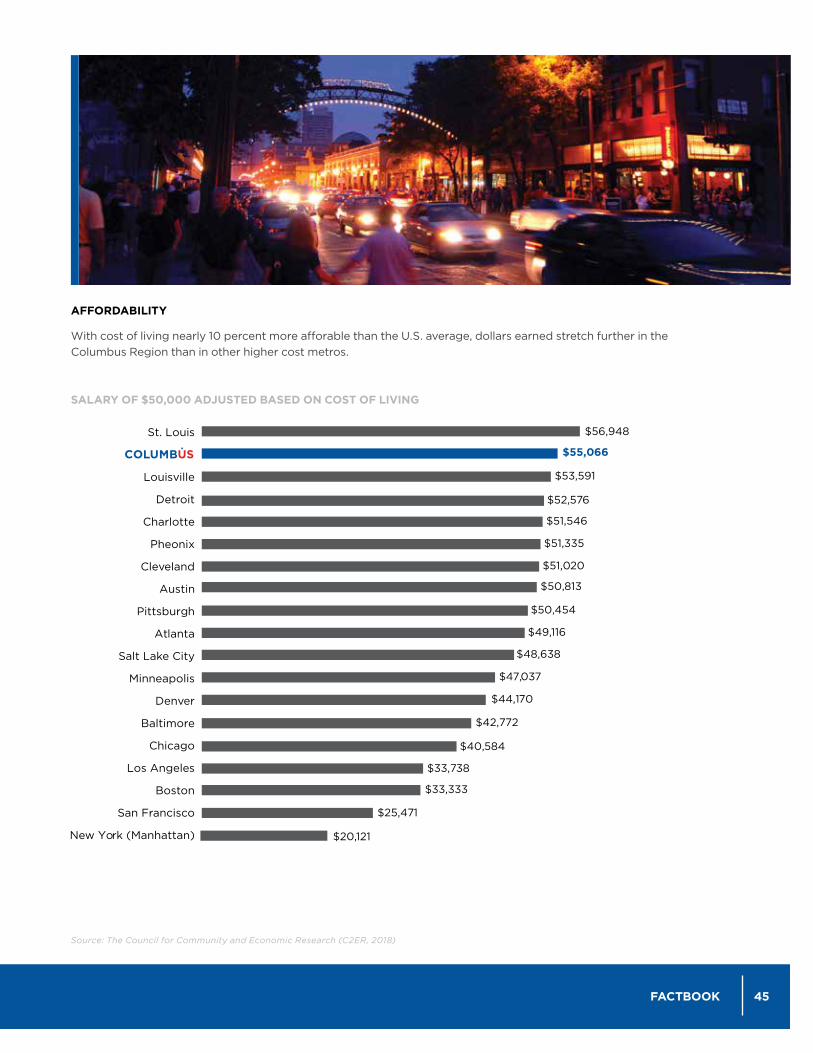
45FACTBOOK
AFFORDABILITY
With cost of living nearly 10 percent more afforable than the U.S. average, dollars earned stretch further in theColumbus Region than in other higher cost metros.
SALARY OF $50,000 ADJUSTED BASED ON COST OF LIVING
Source: The Council for Community and Economic Research (C2ER, 2018)
St. Louis
Louisville
Detroit
Charlotte
Pheonix
Cleveland
Austin
Pittsburgh
Atlanta
Salt Lake City
Minneapolis
Denver
Baltimore
Chicago
Los Angeles
Boston
San Francisco
New York (Manhattan)
$56,948
$55,066
$53,591
$52,576
$51,546
$51,335
$51,020
$50,813
$50,454
$49,116
$48,638
$47,037
$44,170
$42,772
$40,584
$33,738
$33,333
$25,471
$20,121
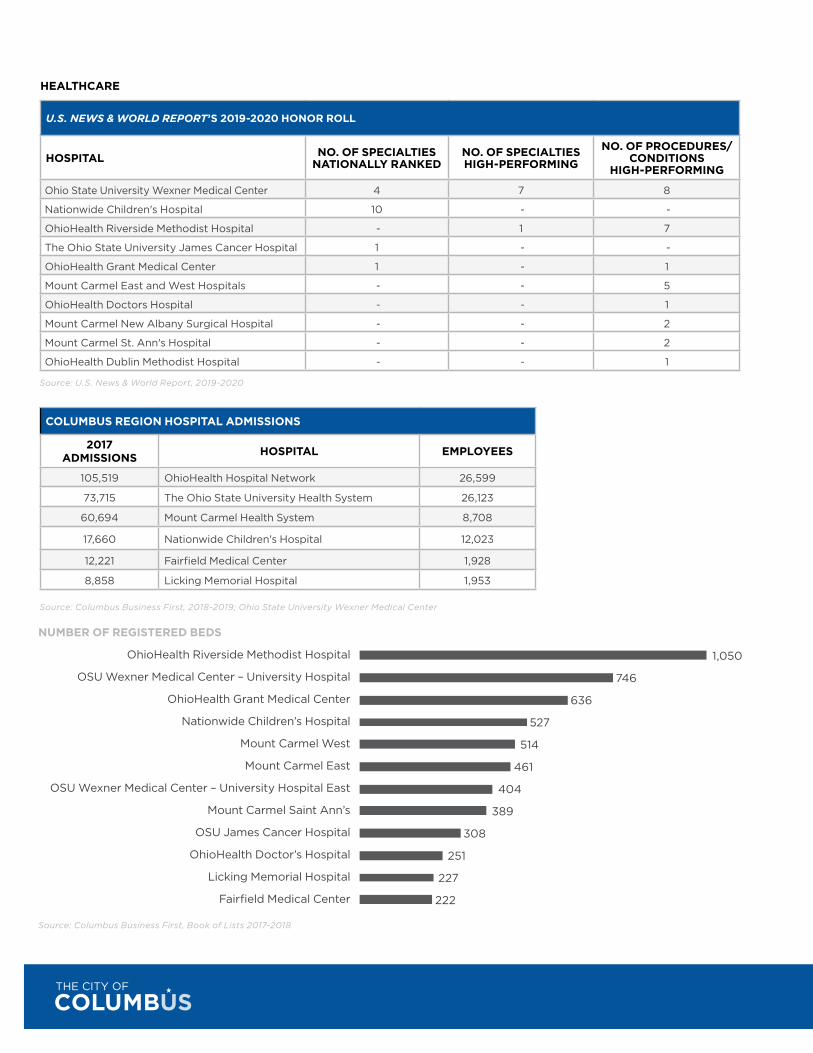
U.S. NEWS & WORLD REPORT’S 2019-2020 HONOR ROLL
HOSPITAL NO. OF SPECIALTIES NATIONALLY RANKED
NO. OF SPECIALTIES HIGH-PERFORMING
NO. OF PROCEDURES/CONDITIONS
HIGH-PERFORMING
Ohio State University Wexner Medical Center 4 7 8
Nationwide Children's Hospital 10 - -
OhioHealth Riverside Methodist Hospital - 1 7
The Ohio State University James Cancer Hospital 1 - -
OhioHealth Grant Medical Center 1 - 1
Mount Carmel East and West Hospitals - - 5
OhioHealth Doctors Hospital - - 1
Mount Carmel New Albany Surgical Hospital - - 2
Mount Carmel St. Ann's Hospital - - 2
OhioHealth Dublin Methodist Hospital - - 1
COLUMBUS REGION HOSPITAL ADMISSIONS
2017 ADMISSIONS HOSPITAL EMPLOYEES
105,519 OhioHealth Hospital Network 26,599
73,715 The Ohio State University Health System 26,123
60,694 Mount Carmel Health System 8,708
17,660 Nationwide Children's Hospital 12,023
12,221 Fairfield Medical Center 1,928
8,858 Licking Memorial Hospital 1,953
NUMBER OF REGISTERED BEDS
OhioHealth Riverside Methodist Hospital
OSU Wexner Medical Center – University Hospital
OhioHealth Grant Medical Center
Nationwide Children’s Hospital
Mount Carmel West
Mount Carmel East
OSU Wexner Medical Center – University Hospital East
Mount Carmel Saint Ann’s
OSU James Cancer Hospital
OhioHealth Doctor’s Hospital
Licking Memorial Hospital
Fairfield Medical Center
HEALTHCARE
Source: Columbus Business First, Book of Lists 2017-2018
Source: U.S. News & World Report, 2019-2020
Source: Columbus Business First, 2018-2019; Ohio State University Wexner Medical Center
1,050
746
636
527
514
461
404
389
308
251
227
222

47FACTBOOK
NOTES

NOTES

49FACTBOOK
NOTES

5-20
columbus.gov/econdev


