Factor analysis of combined organic and inorganic aerosol massspectra from high resolution aerosol mass spectrometermeasurements
Y. L. Sun1, Q. Zhang2, J. J. Schwab3, T. Yang1, N. L. Ng4, and K. L. Demerjian3
1State Key Laboratory of Atmospheric Boundary Layer Physics and Atmospheric Chemistry,Institute of Atmospheric Physics, Chinese Academy of Sciences, Beijing, China2Department of Environmental Toxicology, University of California, Davis, California, USA3Atmospheric Sciences Research Center, State University of New York at Albany, Albany, New York, USA4School of Chemical and Biomolecular Engineering and School of Earth and Atmospheric Sciences,Georgia Institute of Technology, Atlanta, Georgia, USA
Received: 1 May 2012 – Published in Atmos. Chem. Phys. Discuss.: 25 May 2012Revised: 2 September 2012 – Accepted: 6 September 2012 – Published: 21 September 2012
Abstract. Positive matrix factorization (PMF) was appliedto the merged high resolution mass spectra of organic andinorganic aerosols from aerosol mass spectrometer (AMS)measurements to investigate the sources and evolution pro-cesses of submicron aerosols in New York City in summer2009. This new approach is able to study the distribution oforganic and inorganic species in different types of aerosols,the acidity of organic aerosol (OA) factors, and the frag-ment ion patterns related to photochemical processing. In thisstudy, PMF analysis of the unified AMS spectral matrix re-solved 8 factors. The hydrocarbon-like OA (HOA) and cook-ing OA (COA) factors contain negligible amounts of inor-ganic species. The two factors that are primarily ammoniumsulfate (SO4-OA) and ammonium nitrate (NO3-OA), respec-tively, are overall neutralized. Among all OA factors the or-ganic fraction of SO4-OA shows the highest degree of oxida-tion (O/C= 0.69). Two semi-volatile oxygenated OA (OOA)factors, i.e., a less oxidized (LO-OOA) and a more oxidized(MO-OOA), were also identified. MO-OOA represents lo-cal photochemical products with a diurnal profile exhibitinga pronounced noon peak, consistent with those of formalde-hyde (HCHO) and Ox(= O3 + NO2). The NO+/NO+
2 ion ra-tio in MO-OOA is much higher than that in NO3-OA and inpure ammonium nitrate, indicating the formation of organicnitrates. The nitrogen-enriched OA (NOA) factor contains∼ 25 % of acidic inorganic salts, suggesting the formation of
secondary OA via acid-base reactions of amines. The sizedistributions of OA factors derived from the size-resolvedmass spectra show distinct diurnal evolving behaviors butoverall a progressing evolution from smaller to larger particlemode as the oxidation degree of OA increases. Our resultsdemonstrate that PMF analysis of the unified aerosol massspectral matrix which contains both inorganic and organicaerosol signals may enable the deconvolution of more OAfactors and gain more insights into the sources, processes,and chemical characteristics of OA in the atmosphere.
1 Introduction
Atmospheric fine particles exert a serious impact on air qual-ity and visibility reduction (Watson, 2002), and harmful ef-fects on human health (Pope III et al., 2002, 2009). Organicaerosols (OA) – a major fraction of fine particles (Zhanget al., 2007a; Jimenez et al., 2009) have a highly uncertainimpact on radiative forcing (Forster et al., 2007). Currentmodels often underestimate OA loading substantially, mainlydue to unknown sources, sinks, and formation mechanisms(e.g., aqueous-phase production of secondary OA) (Healdet al., 2005, 2011; Volkamer et al., 2006; Dzepina et al.,2009; Wood et al., 2010). Thus, a better understanding of thesources and evolution processes of OA is of importance for
Published by Copernicus Publications on behalf of the European Geosciences Union.
8538 Y. L. Sun et al.: Factor analysis of combined organic and inorganic aerosol mass spectra
assessing aerosol’s impacts and reducing the uncertainties inmodels.
OA from a wide variety of sources are either primary fromdirect emissions, e.g., combustion of fossil fuels and biomassburning, or secondary which is formed via gas-to-particleconversions such as oxidation of volatile organic compounds(VOCs) and/or aqueous-phase production. The atmosphericevolution such as aging, mixing, and cloud processing fur-ther leads to a change of the chemical, physical and op-tical properties of both primary OA (POA) and secondaryOA (SOA). While the primary emissions of OA are fairlywell understood, there are considerable uncertainties in quan-tification and characterization of SOA. The traditional EC-tracer method (Turpin and Huntzicker, 1995) may involvelarge uncertainties in quantification of secondary organic car-bon (SOC) due to either the differences in defining OC andEC from thermal-optical analysis (Khan et al., 2011) or vari-ations in OC/ECprimary ratio from different combustion emis-sion sources. The molecular-marker based chemical massbalance (CMB) receptor model is capable of quantifying thecontributions of primary sources, but often a large fractionof secondary species remains uncharacterized (Schauer andCass, 2000; Zheng et al., 2002). In addition, the techniquesmentioned above often rely on measurements over hours todays, making it difficult to capture the fast evolution pro-cesses of OA in the atmosphere.
The Aerodyne Aerosol Mass Spectrometers (AMS) usingthermal vaporization (typically 600◦C) and electron impactionization (∼ 70 eV) allow us to obtain the ensemble massspectra of OA in real time, typically in a few seconds to min-utes (Jayne et al., 2000; Drewnick et al., 2005; DeCarlo etal., 2006). The custom principle component analysis (CPCA)was firstly used to deconvolve the OA into different fac-tors that are associated with different sources and processes(Zhang et al., 2005a). The hydrocarbon-like OA (HOA), asurrogate of POA from traffic emissions, and oxygenated OA(OOA), a surrogate of SOA, were ubiquitously resolved aturban locations. HOA often shows tight correlations with thetracers for primary emissions, e.g., NOx, BC, and CO, etc.,while OOA is generally correlated with secondary inorganicspecies, e.g., sulfate and/or nitrate (Zhang et al., 2005b). Themultiple component analysis (MCA) was further developedto characterize the potential sub-OOA factors, e.g., highlyoxidized OOA (OOA-I) and less oxidized OOA (OOA-II)(Zhang et al., 2007a). MCA analysis of 37 AMS datasetsin the Northern Hemisphere shows an overall dominance ofOOA at various atmospheric environments from urban, urbandownwind, to rural and remote sites (Zhang et al., 2007a).The positive matrix factorization (PMF) (Paatero and Tap-per, 1994), a bilinear model that constrains the factors to benon-negative is currently mostly used for OA mass spectraanalysis (Lanz et al., 2007; Ulbrich et al., 2009; Zhang etal., 2011). Various POA components like HOA, cooking OA(COA), and biomass burning OA (BBOA), and SOA compo-nents like semi-volatile OOA (SV-OOA) and low-volatility
OOA (LV-OOA) are broadly identified depending on sites,seasons, and source emissions. The OA factors together withthe measurements of hygroscopicity, volatility, and oxidationstates significantly improve our understanding of the sourcesand evolution processes of OA in the atmosphere (Jimenez etal., 2009).
The recent PMF analysis of high resolution mass spectra(HRMS) further improves the differentiation of OA factorsand also allows us to determine the oxidation state of eachfactor (Aiken et al., 2009; DeCarlo et al., 2010; Sun et al.,2011c). Given that the atmospheric evolution of OA mightinvolve a progressive oxidation from fresh to highly agedOA associated with a change of functionalities, volatilities,and oxidative properties (Heald et al., 2010; Ng et al., 2010;Sun et al., 2011b), more sub-OOA factors are expected, butdifficult to be resolved due to a lack of collocated variables.Slowik et al. (2010b) firstly combined the OA spectra fromAMS measurements with the VOCs measured by a protontransfer reaction-mass spectrometer (PTR-MS). PMF analy-sis of the unified dataset shows the capability of resolvingmore OOA factors and improving the interpretations of theirsources and photochemical processes. Docherty et al. (2011)performed the PMF analysis to the combined ambient andthermally denuded OA spectra (TD-PMF-AMS) during the2005 Study of Organic Aerosols at Riverside (SOAR-1). TheTD-PMF-AMS with improved differentiation of OA factorsidentified two more secondary OOA factors in addition to theprevious SV-OOA and LV-OOA. Despite this, the two ap-proaches above are often limited by the collocated measure-ments of VOCs by PTR-MS or thermally denuded OA spec-tra that are not available in field studies. Chang et al. (2011)first tried to perform PMF on the entire unit mass resolutionspectra measured by a compact Time-of-Flight AMS overthe central Arctic Ocean. This approach successfully distin-guished marine biogenic and continental sources. However,most previous PMF analysis is only performed on AMS OAspectra, while the inorganic species, e.g., sulfate and nitrateare used as external tracers for comparison purpose. Since theorganic and inorganic species from different sources and for-mation mechanisms are often externally or internally mixedas a function of aerosol evolution in the atmosphere, PMFanalysis of OA spectra only may bury the intrinsic relation-ship between organic and inorganic species.
In this study, we re-analyze the three-week HRMS of or-ganic and inorganic aerosols (IOA) measured by an Aero-dyne High Resolution Time-of-Flight AMS (HR-ToF-AMS,DeCarlo et al., 2006) at Queens College in New York City(NYC) in summer, 2009 (Sun et al., 2011c). For the first time,we integrate the organic and inorganic HR spectral matricesinto one unified dataset for PMF analysis. The sources, acid-ity, and photochemical processing of OA and IOA are inves-tigated. In addition, the size distributions of OA factors arederived from 3-dimensional size-resolved mass spectra, andtheir implications in studying the sources and processes ofOA are discussed.
Y. L. Sun et al.: Factor analysis of combined organic and inorganic aerosol mass spectra 8539
2 Method
2.1 AMS measurements and data analyses
The HR-ToF-AMS was deployed on the campus of QueensCollege (40.74◦ N, 73.82◦ W) in NYC from 13 July through3 August 2009 for in-situ measurements of the mass con-centrations, chemical composition and size distributionsof non-refractory submicron aerosol (NR-PM1) species.The descriptions of the sampling site and operations ofthe HR-ToF-AMS and collocated instruments have beendetailed in Sun et al. (2011c) and Lin et al. (2012). TheHR-ToF-AMS data were re-analyzed with the latest versionsof standard AMS software (PIKA v1.10H and SQUIR-REL v1.51H; http://cires.colorado.edu/jimenez-group/ToFAMSResources/ToFSoftware/index.html). Compared toSun et al. (2011c), a major update of the new software isthe calculation of ion counting errors. However, such updateappears to show minor effects on the PMF results, which issupported by the very similar spectral patterns of OA factorsin these two studies (r2
= 0.99–1.0, slope= 0.99–1.02).The mass concentrations and size distributions of NR-PM1species, and the elemental composition of OA were obtained.In addition, the high resolution (HR) mass spectral matricesand 3-dimensional size-resolved mass spectra were extractedfor the subsequent PMF analysis and size deconvolution.All data in this study is reported at Eastern Standard Time(EST= UTC – 5 h).
2.2 Preparation of mass spectral and error matrices
The procedures for preparation of HR mass spectral and errormatrices for PMF analysis have been detailed in DeCarlo etal. (2010).The HR data matrix was obtained by the differenceof “Open” and “Closed” ion sticks, i.e., “OMinusC” in HRanalysis panel. The corresponding HR error matrix was de-termined as the sum of quadrature of Poisson counting statis-tics and electronic noise for each ion (Allan et al., 2003).Note that the ion counting errors in the latest version of PIKAalso included baseline errors. Also, a minimum error was in-troduced for each ion (Ulbrich et al., 2009). The “bad” ionswith signal-to-noise (S/N) ratio< 0.2 were removed fromthe HR data and error matrices, and the “weak” ions withS/N between 0.2 and 2 were downweighed by increasingtheir error values a factor of 2 as described in Ulbrich etal. (2009). In addition, the particulate ion CO+
2 and its asso-ciated CO+, H2O+, HO+, and O+ were also downweighedaccording to Ulbrich et al. (2009). Both the HR data and er-ror matrices were converted from ion signals to mass con-centrations before PMF analysis. Following the same proce-dures, the mass spectral and error matrices of inorganic frag-ment ions including sulfate, nitrate, ammonium, and chlo-ride were prepared and integrated with those of OA intoone unified dataset. However, only major fragment ions foreach inorganic species are included. They are SO+(m/z 48),
SO+
2 (m/z 64), SO+
3 (m/z 80), HSO+
3 (m/z 81), and H2SO+
4(m/z 98) for sulfate, NO+ (m/z 30) and NO+2 (m/z 46)for nitrate, NH+(m/z 15), NH+
2 (m/z 16), NH+
3 (m/z 17)for ammonium, and Cl+ (m/z 35) and HCl+ (m/z 36) forchloride. Ions that are constrained, i.e., scaled to ion inten-sities (e.g., according to the known isotope ratios for iso-topic ions), are not included. The sum of selected fragmentions represents a major fraction of nitrate (96.2 %), ammo-nium (99.6 %) and chloride (75.8 %), and∼ half of sul-fate (50.6 %), respectively. Further, these fragment ions showvery tight correlations with the total mass concentration ofeach species (r2
≈ 1, Fig. S1 in Supplement), indicating thatthe selected ions are well representative of each inorganicspecies. Similarly, the inorganic fragment ions before PMFanalysis were also converted to mass concentrations in bothdata and error matrices. After PMF analysis, the total massconcentration of each inorganic species is derived from thesum of fragment ions divided by their fractional contribu-tions in the corresponding species (Fig. S1).
2.3 Positive matrix factorization (PMF)
As a standard multivariate factor analysis approach, PMF(Paatero and Tapper, 1994) uses the positively constrained bi-linear model to deconvolve the HR mass spectral matrix (xij ;dimensions:m ×n) into distinct factors (p) without a prioriassumptions for either time series or mass spectral profiles.
xij =
∑p
gip fpj + eij (1)
wherei andj refer to row and column indices in the matrix,respectively, andp is the number of factors in the solution.xij is the measured concentrations of ion fragmentj at time-stepi. gip is the concentration of a given factorp at time-stepi, andfpj is the fraction of an ion fragmentj in the massspectral profile of factorp, andeij is the residual not fit bythe model. PMF solves Eq. (1) by minimizing the sum of theerror weighed squared residuals (“Q”).
Q =
m∑i=1
n∑j=1
(eij/σij )2 (2)
whereσij is the estimated error of ion fragmentj at time-stepi in them ×n matrix. The solutions are constrained to be pos-itive which is physically meaningful in real atmospheric en-vironment. The PMF analysis using PMF2 algorithm (v 4.2)in robust mode was performed on the combined HR matricesof OA and IOA. The PMF2 solutions were then evaluatedwith an Igor Pro-based PMF Evaluation Tool (PET, v2.04)(Ulbrich et al., 2009) following the procedures detailed inZhang et al. (2011) (Fig. S2). The PMF analysis was alsoperformed on the HR matrices of OA, and the results of 5-factor solution were already presented in Sun et al. (2011c).
After a detailed evaluation of mass spectral profiles, timeseries, diurnal variations, and correlations with external trac-ers, the 8-factor solution with FPEAK= 0(Q/Qexp = 1.5)
8540 Y. L. Sun et al.: Factor analysis of combined organic and inorganic aerosol mass spectra
was chosen. The mass spectral profiles, time series, and diur-nal variations of 7-factor and 9-factor solutions are shown inFigs. S3 and S4, respectively. While the results of 7-factor so-lution are very similar to those reported in Sun et al. (2011c),the 9-factor solution appears to show a split of SO4-OA thatis difficult to interpret. Thus, we selected the 8-factor solutionin this study. The eight factors identified include two primaryfactors, i.e., a hydrocarbon-like OA (HOA, O/C= 0.04) anda cooking OA (COA, O/C= 0.13), two semi-volatile oxy-genated OA (OOA) factors, i.e., a more oxidized (MO-OOA,O/C = 0.48) and a less oxidized (LO-OOA, O/C= 0.27),a low volatility OOA (LV-OOA, O/C = 0.59), a nitrogen-enriched OA (NOA, O/C= 0.28), and two factors that areprimarily ammonium sulfate (SO4-OA, O/C= 0.69) and am-monium nitrate (NO3-OA, O/C = 0.14). The rotational am-biguity of the 8-factor solution was explored by varying theinitial FPEAK values. The mass spectra and time series ofthe factors for selected FPEAK values are shown in Fig. S5.While the factor profiles and time series are reasonably con-sistent for most PMF factors, the NOA and MO-OOA ap-pear to show relatively higher uncertainties. Table S1 gives asummary of the fractional contributions of the PMF factorsassociated with rotational ambiguity. The PMF solution wasfurther justified through the comparisons of the time series ofthe factors with those of tracer species. As shown in Fig. S6,the FPEAK= 0 solution presents the best correlations be-tween PMF factors and external tracer species. Since we donot have specific reasons for choosing other FPEAK values,the PMF solution with FPEAK= 0 is thus chosen.
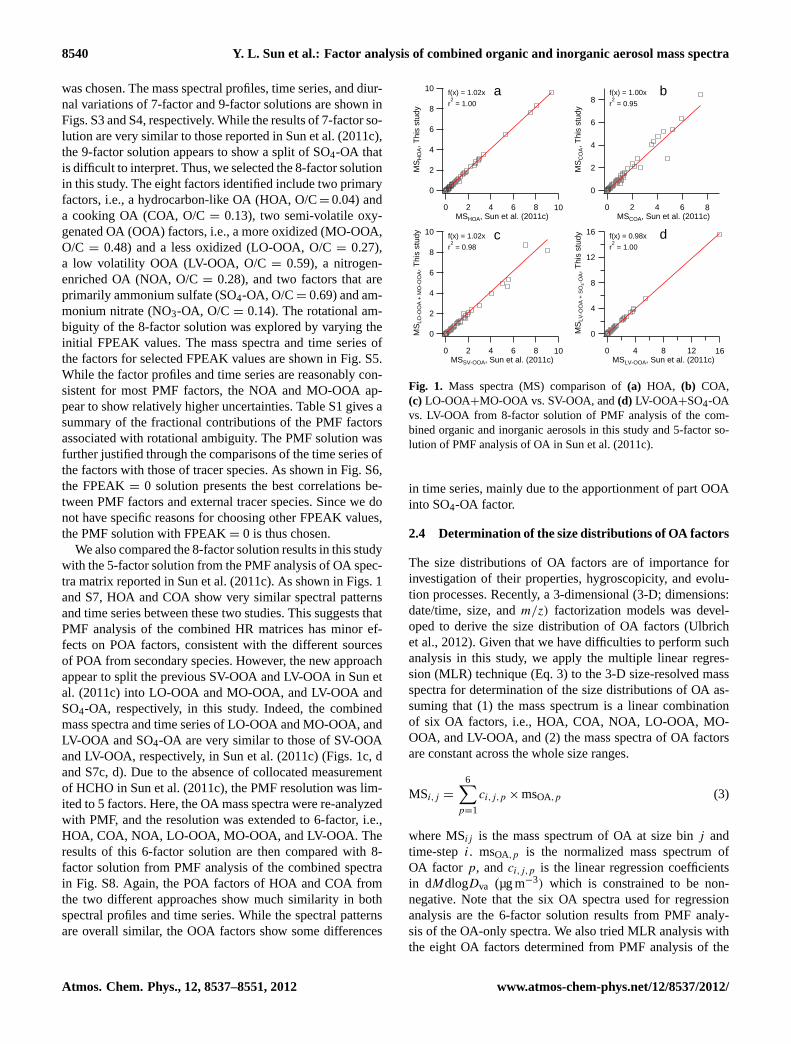
We also compared the 8-factor solution results in this studywith the 5-factor solution from the PMF analysis of OA spec-tra matrix reported in Sun et al. (2011c). As shown in Figs. 1and S7, HOA and COA show very similar spectral patternsand time series between these two studies. This suggests thatPMF analysis of the combined HR matrices has minor ef-fects on POA factors, consistent with the different sourcesof POA from secondary species. However, the new approachappear to split the previous SV-OOA and LV-OOA in Sun etal. (2011c) into LO-OOA and MO-OOA, and LV-OOA andSO4-OA, respectively, in this study. Indeed, the combinedmass spectra and time series of LO-OOA and MO-OOA, andLV-OOA and SO4-OA are very similar to those of SV-OOAand LV-OOA, respectively, in Sun et al. (2011c) (Figs. 1c, dand S7c, d). Due to the absence of collocated measurementof HCHO in Sun et al. (2011c), the PMF resolution was lim-ited to 5 factors. Here, the OA mass spectra were re-analyzedwith PMF, and the resolution was extended to 6-factor, i.e.,HOA, COA, NOA, LO-OOA, MO-OOA, and LV-OOA. Theresults of this 6-factor solution are then compared with 8-factor solution from PMF analysis of the combined spectrain Fig. S8. Again, the POA factors of HOA and COA fromthe two different approaches show much similarity in bothspectral profiles and time series. While the spectral patternsare overall similar, the OOA factors show some differences
30
831
Fig. 1. Mass spectra (MS) comparison of (a) HOA, (b) COA, (c) LO-OOA + MO-OOA 832
vs. SV-OOA, and (d) LV-OOA + SO4-OA vs. LV-OOA from 8-factor solution of PMF 833
analysis of the combined organic and inorganic aerosols in this study and 5-factor 834
solution of PMF analysis of OA in Sun et al. (2011c). 835
d
a b
c
10
8
6
4
2
0
MS
HO
A, T
his
stud
y
1086420MSHOA, Sun et al. (2011c)
f(x) = 1.02xr2 = 1.00 8
6
4
2
0
MS
CO
A, T
his
stud
y
86420MSCOA, Sun et al. (2011c)
f(x) = 1.00xr2 = 0.95
10
8
6
4
2
0MS
LO-O
OA
+ M
O-O
OA,
Thi
s st
udy
1086420MSSV-OOA, Sun et al. (2011c)
f(x) = 1.02xr2 = 0.98
16
12
8
4
0MS
LV-O
OA
+ S
O4-
OA, T
his
stud
y
1612840MSLV-OOA, Sun et al. (2011c)
f(x) = 0.98xr2 = 1.00
Fig. 1. Mass spectra (MS) comparison of(a) HOA, (b) COA,(c) LO-OOA+MO-OOA vs. SV-OOA, and(d) LV-OOA+SO4-OAvs. LV-OOA from 8-factor solution of PMF analysis of the com-bined organic and inorganic aerosols in this study and 5-factor so-lution of PMF analysis of OA in Sun et al. (2011c).
in time series, mainly due to the apportionment of part OOAinto SO4-OA factor.
2.4 Determination of the size distributions of OA factors
The size distributions of OA factors are of importance forinvestigation of their properties, hygroscopicity, and evolu-tion processes. Recently, a 3-dimensional (3-D; dimensions:date/time, size, andm/z) factorization models was devel-oped to derive the size distribution of OA factors (Ulbrichet al., 2012). Given that we have difficulties to perform suchanalysis in this study, we apply the multiple linear regres-sion (MLR) technique (Eq. 3) to the 3-D size-resolved massspectra for determination of the size distributions of OA as-suming that (1) the mass spectrum is a linear combinationof six OA factors, i.e., HOA, COA, NOA, LO-OOA, MO-OOA, and LV-OOA, and (2) the mass spectra of OA factorsare constant across the whole size ranges.
MSi,j =
6∑p=1
ci,j,p × msOA,p (3)
where MSij is the mass spectrum of OA at size binj andtime-step i. msOA,p is the normalized mass spectrum ofOA factor p, andci,j,p is the linear regression coefficientsin dMdlogDva (µg m−3) which is constrained to be non-negative. Note that the six OA spectra used for regressionanalysis are the 6-factor solution results from PMF analy-sis of the OA-only spectra. We also tried MLR analysis withthe eight OA factors determined from PMF analysis of the
Y. L. Sun et al.: Factor analysis of combined organic and inorganic aerosol mass spectra 8541
31
836
Fig. 2. (a) High resolution mass spectra of PMF factors. The mass spectra of OA in SO4-837
OA and NO3-OA are enhanced by a factor of 3 and 10, respectively, for clarity. (b) 838
Diurnal profiles of OA in each factor. The solid circles refer to mean values, and the gray 839
shaded areas are 25th and 75th percentiles. 840
6420
543210
6420
43210
86420
86420
1.00.80.60.40.20.0
2.52.01.51.00.50.0
7/13 7/18 7/23 7/28 8/2Date & Time (EST)
Mas
s C
once
ntra
tion
(µg
m-3
)
1050
100908070605040302010m/z (amu)
1050
10
5
0
86420
86420
1086420
40302010
0
201510
50
O/C = 0.59; OM/OC = 1.91
O/C = 0.48; OM/OC = 1.75
O/C = 0.27; OM/OC = 1.48
O/C = 0.28; OM/OC = 1.61
O/C = 0.13; OM/OC = 1.32
O/C = 0.04; OM/OC = 1.22
O/C = 0.14; OM/OC = 1.39
O/C = 0.69; OM/OC = 2.05
% o
f Tot
al S
igna
l
CxHy CxHyO1 CxHyO2 CxHyNp
CxHyOzNp HyO1 SOx NOx NHx Clx
SO4-OA
NO3-OA
HOA
COA
NOA
LO-OOA
MO-OOA
LV-OOA 2.01.51.00.50.0
24201612840Hour of Day
3.02.01.00.0
3.02.01.00.0
0.80.60.40.20.0
2.01.51.00.50.0
2.01.51.00.50.0
0.30.20.10.0
1.20.80.40.0
Mas
s C
once
ntra
tion
(µg
m-3
)
a b c
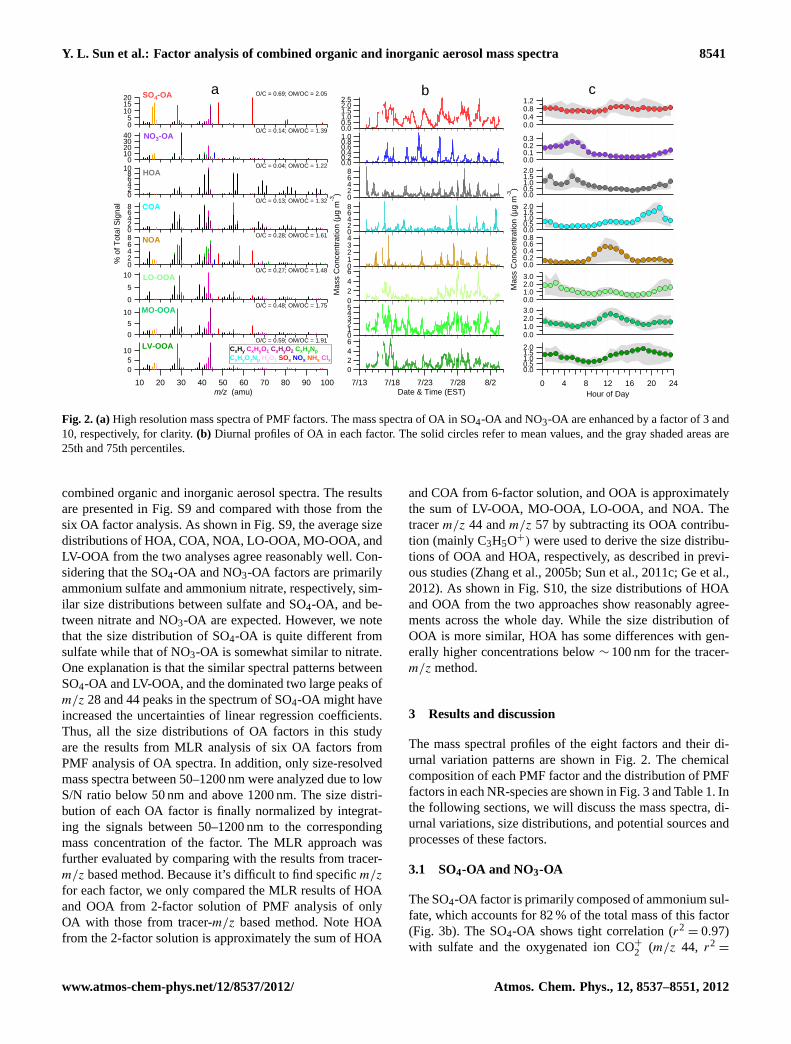
Fig. 2. (a)High resolution mass spectra of PMF factors. The mass spectra of OA in SO4-OA and NO3-OA are enhanced by a factor of 3 and10, respectively, for clarity.(b) Diurnal profiles of OA in each factor. The solid circles refer to mean values, and the gray shaded areas are25th and 75th percentiles.
combined organic and inorganic aerosol spectra. The resultsare presented in Fig. S9 and compared with those from thesix OA factor analysis. As shown in Fig. S9, the average sizedistributions of HOA, COA, NOA, LO-OOA, MO-OOA, andLV-OOA from the two analyses agree reasonably well. Con-sidering that the SO4-OA and NO3-OA factors are primarilyammonium sulfate and ammonium nitrate, respectively, sim-ilar size distributions between sulfate and SO4-OA, and be-tween nitrate and NO3-OA are expected. However, we notethat the size distribution of SO4-OA is quite different fromsulfate while that of NO3-OA is somewhat similar to nitrate.One explanation is that the similar spectral patterns betweenSO4-OA and LV-OOA, and the dominated two large peaks ofm/z 28 and 44 peaks in the spectrum of SO4-OA might haveincreased the uncertainties of linear regression coefficients.Thus, all the size distributions of OA factors in this studyare the results from MLR analysis of six OA factors fromPMF analysis of OA spectra. In addition, only size-resolvedmass spectra between 50–1200 nm were analyzed due to lowS/N ratio below 50 nm and above 1200 nm. The size distri-bution of each OA factor is finally normalized by integrat-ing the signals between 50–1200 nm to the correspondingmass concentration of the factor. The MLR approach wasfurther evaluated by comparing with the results from tracer-m/z based method. Because it’s difficult to find specificm/z
for each factor, we only compared the MLR results of HOAand OOA from 2-factor solution of PMF analysis of onlyOA with those from tracer-m/z based method. Note HOAfrom the 2-factor solution is approximately the sum of HOA
and COA from 6-factor solution, and OOA is approximatelythe sum of LV-OOA, MO-OOA, LO-OOA, and NOA. Thetracerm/z 44 andm/z 57 by subtracting its OOA contribu-tion (mainly C3H5O+) were used to derive the size distribu-tions of OOA and HOA, respectively, as described in previ-ous studies (Zhang et al., 2005b; Sun et al., 2011c; Ge et al.,2012). As shown in Fig. S10, the size distributions of HOAand OOA from the two approaches show reasonably agree-ments across the whole day. While the size distribution ofOOA is more similar, HOA has some differences with gen-erally higher concentrations below∼ 100 nm for the tracer-m/z method.
3 Results and discussion
The mass spectral profiles of the eight factors and their di-urnal variation patterns are shown in Fig. 2. The chemicalcomposition of each PMF factor and the distribution of PMFfactors in each NR-species are shown in Fig. 3 and Table 1. Inthe following sections, we will discuss the mass spectra, di-urnal variations, size distributions, and potential sources andprocesses of these factors.
3.1 SO4-OA and NO3-OA
The SO4-OA factor is primarily composed of ammonium sul-fate, which accounts for 82 % of the total mass of this factor(Fig. 3b). The SO4-OA shows tight correlation (r2
8542 Y. L. Sun et al.: Factor analysis of combined organic and inorganic aerosol mass spectra
32
841
Fig. 3. (a,b) Chemical composition of PMF factors, i.e., mass concentrations and mass 842
fractions of NR-species (organics, sulfate, nitrate, ammonium, and chloride) in each 843
factor; (c,d) Distribution of PMF factors in each NR-species; (e) Average composition of 844
OA in this study and 5-factor OA (LV-OOA, SV-OOA, HOA, COA, and NOA) 845
composition in Sun et al. (2011c). 846
1.0
0.8
0.6
0.4
0.2
0.0
Mas
s Fr
actio
n
Org
SO42-
NO
3-
NH
4+
Chl
NR-Species
6
5
4
3
2
1
0
Con
cent
ratio
n (µ
g m
-3)
Org
SO42-
NO
3-
NH
4+
Chl
NR-Species
LV-OOAMO-OOALO-OOANOACOAHOANO3-OASO4-OA
4
3
2
1
0
Con
cent
ratio
n (µ
g m
-3)
LV-O
OA
MO
-OO
A
LO-O
OA
NO
A
CO
A
HO
A
NO
3-O
A
SO
4-O
A
Org SO42-
NO3- NH4
+ Chl
1.0
0.8
0.6
0.4
0.2
0.0
Mas
s Fr
actio
n
LV-O
OA
MO
-OO
A
LO-O
OA
NO
A
CO
A
HO
A
NO
3-O
A
SO4-
OA
a
b
c
d
eThis study
Sun et al. 2011c
12%
19%
24%
17% 3% 2% 11%
12%
30%
34%
6% 16%
14%
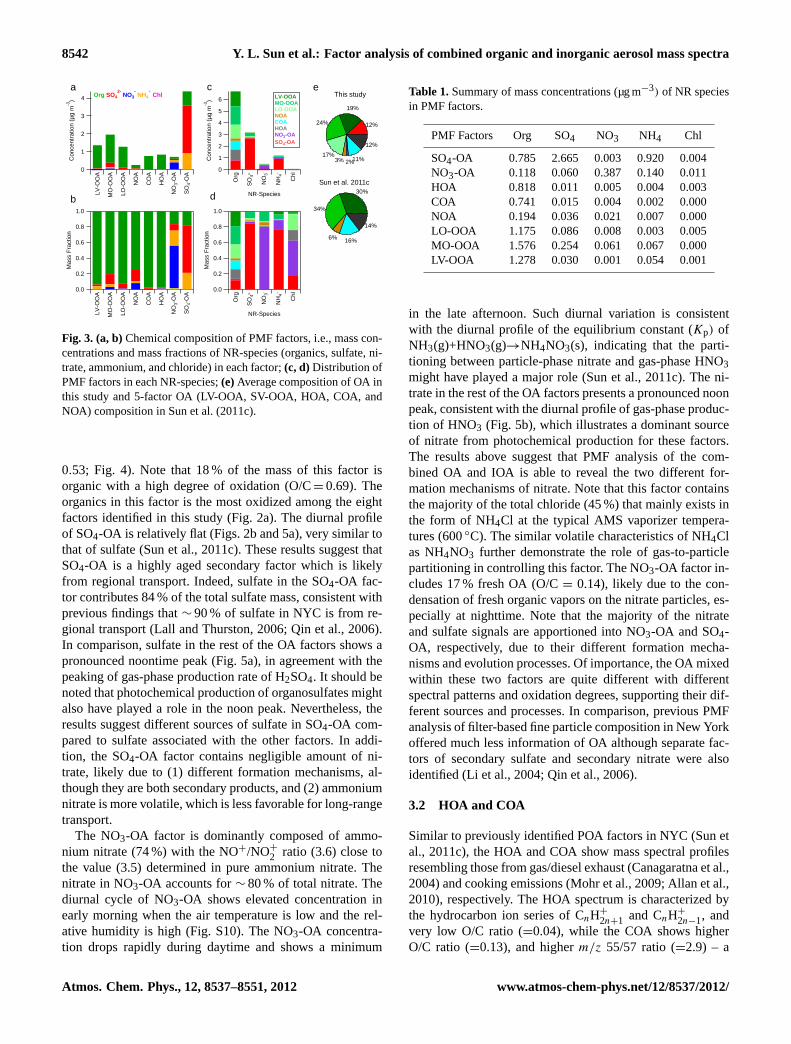
Fig. 3. (a, b)Chemical composition of PMF factors, i.e., mass con-centrations and mass fractions of NR-species (organics, sulfate, ni-trate, ammonium, and chloride) in each factor;(c, d)Distribution ofPMF factors in each NR-species;(e)Average composition of OA inthis study and 5-factor OA (LV-OOA, SV-OOA, HOA, COA, andNOA) composition in Sun et al. (2011c).
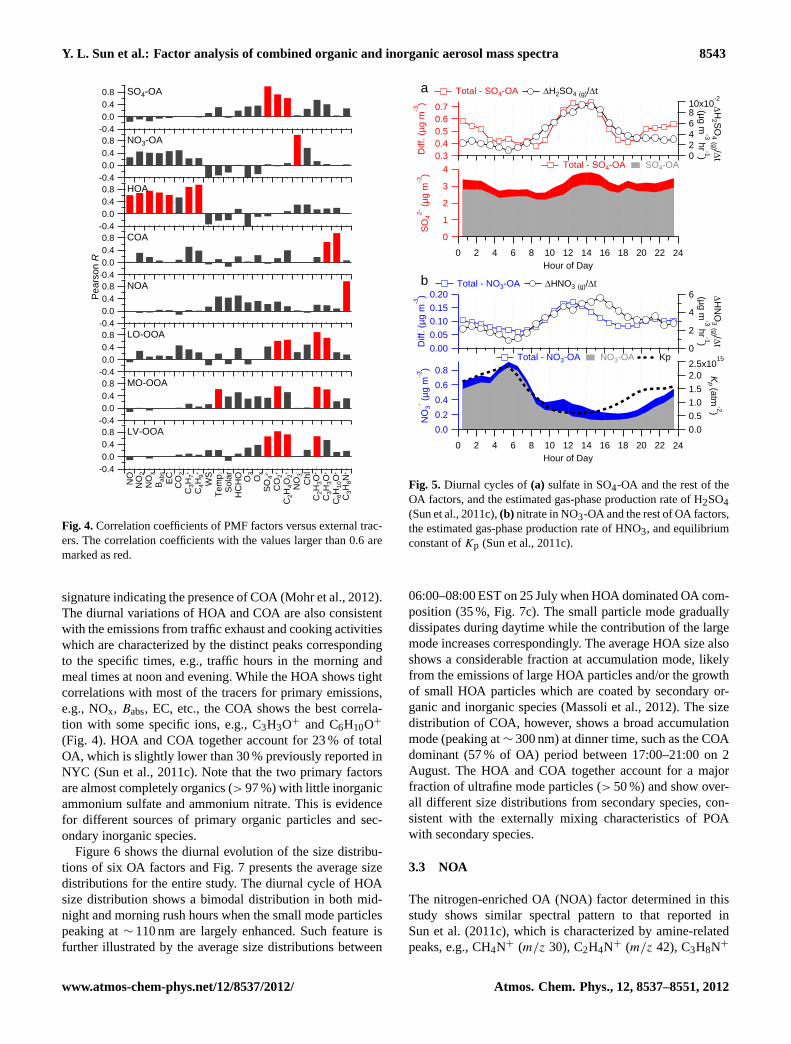
0.53; Fig. 4). Note that 18 % of the mass of this factor isorganic with a high degree of oxidation (O/C= 0.69). Theorganics in this factor is the most oxidized among the eightfactors identified in this study (Fig. 2a). The diurnal profileof SO4-OA is relatively flat (Figs. 2b and 5a), very similar tothat of sulfate (Sun et al., 2011c). These results suggest thatSO4-OA is a highly aged secondary factor which is likelyfrom regional transport. Indeed, sulfate in the SO4-OA fac-tor contributes 84 % of the total sulfate mass, consistent withprevious findings that∼ 90 % of sulfate in NYC is from re-gional transport (Lall and Thurston, 2006; Qin et al., 2006).In comparison, sulfate in the rest of the OA factors shows apronounced noontime peak (Fig. 5a), in agreement with thepeaking of gas-phase production rate of H2SO4. It should benoted that photochemical production of organosulfates mightalso have played a role in the noon peak. Nevertheless, theresults suggest different sources of sulfate in SO4-OA com-pared to sulfate associated with the other factors. In addi-tion, the SO4-OA factor contains negligible amount of ni-trate, likely due to (1) different formation mechanisms, al-though they are both secondary products, and (2) ammoniumnitrate is more volatile, which is less favorable for long-rangetransport.
The NO3-OA factor is dominantly composed of ammo-nium nitrate (74 %) with the NO+/NO+
2 ratio (3.6) close tothe value (3.5) determined in pure ammonium nitrate. Thenitrate in NO3-OA accounts for∼ 80 % of total nitrate. Thediurnal cycle of NO3-OA shows elevated concentration inearly morning when the air temperature is low and the rel-ative humidity is high (Fig. S10). The NO3-OA concentra-tion drops rapidly during daytime and shows a minimum
Table 1.Summary of mass concentrations (µg m−3) of NR speciesin PMF factors.
in the late afternoon. Such diurnal variation is consistentwith the diurnal profile of the equilibrium constant (Kp) ofNH3(g)+HNO3(g)→NH4NO3(s), indicating that the parti-tioning between particle-phase nitrate and gas-phase HNO3might have played a major role (Sun et al., 2011c). The ni-trate in the rest of the OA factors presents a pronounced noonpeak, consistent with the diurnal profile of gas-phase produc-tion of HNO3 (Fig. 5b), which illustrates a dominant sourceof nitrate from photochemical production for these factors.The results above suggest that PMF analysis of the com-bined OA and IOA is able to reveal the two different for-mation mechanisms of nitrate. Note that this factor containsthe majority of the total chloride (45 %) that mainly exists inthe form of NH4Cl at the typical AMS vaporizer tempera-tures (600◦C). The similar volatile characteristics of NH4Clas NH4NO3 further demonstrate the role of gas-to-particlepartitioning in controlling this factor. The NO3-OA factor in-cludes 17 % fresh OA (O/C= 0.14), likely due to the con-densation of fresh organic vapors on the nitrate particles, es-pecially at nighttime. Note that the majority of the nitrateand sulfate signals are apportioned into NO3-OA and SO4-OA, respectively, due to their different formation mecha-nisms and evolution processes. Of importance, the OA mixedwithin these two factors are quite different with differentspectral patterns and oxidation degrees, supporting their dif-ferent sources and processes. In comparison, previous PMFanalysis of filter-based fine particle composition in New Yorkoffered much less information of OA although separate fac-tors of secondary sulfate and secondary nitrate were alsoidentified (Li et al., 2004; Qin et al., 2006).
3.2 HOA and COA
Similar to previously identified POA factors in NYC (Sun etal., 2011c), the HOA and COA show mass spectral profilesresembling those from gas/diesel exhaust (Canagaratna et al.,2004) and cooking emissions (Mohr et al., 2009; Allan et al.,2010), respectively. The HOA spectrum is characterized bythe hydrocarbon ion series of CnH+
2n+1 and CnH+
2n−1, andvery low O/C ratio (=0.04), while the COA shows higherO/C ratio (=0.13), and higherm/z 55/57 ratio (=2.9) – a
Y. L. Sun et al.: Factor analysis of combined organic and inorganic aerosol mass spectra 8543
33
847
Fig. 4. Correlation coefficients of PMF factors versus external tracers. The correlation 848
coefficients with the values larger than 0.6 are marked as red. 849
0.80.40.0
-0.4
NO
NO
2N
Ox
B abs EC C
O2
C3H
7+
C4H
9+
WS
Tem
p.S
olar
HC
HO O
3O
xS
O42-
CO
2+
C2H
4O2+
NO
3-
Chl
C2H
3O+
C3H
3O+
C6H
10O
+
C3H
8N+
0.80.40.0
-0.4
0.80.40.0
-0.4
0.80.40.0
-0.4
0.80.40.0
-0.4
0.80.40.0
-0.4
0.80.40.0
-0.4
0.80.40.0
-0.4
LV-OOA
MO-OOA
LO-OOA
NOA
COA
HOA
NO3-OA
SO4-OAPe
arso
n R
Fig. 4.Correlation coefficients of PMF factors versus external trac-ers. The correlation coefficients with the values larger than 0.6 aremarked as red.
signature indicating the presence of COA (Mohr et al., 2012).The diurnal variations of HOA and COA are also consistentwith the emissions from traffic exhaust and cooking activitieswhich are characterized by the distinct peaks correspondingto the specific times, e.g., traffic hours in the morning andmeal times at noon and evening. While the HOA shows tightcorrelations with most of the tracers for primary emissions,e.g., NOx, Babs, EC, etc., the COA shows the best correla-tion with some specific ions, e.g., C3H3O+ and C6H10O+
(Fig. 4). HOA and COA together account for 23 % of totalOA, which is slightly lower than 30 % previously reported inNYC (Sun et al., 2011c). Note that the two primary factorsare almost completely organics (> 97 %) with little inorganicammonium sulfate and ammonium nitrate. This is evidencefor different sources of primary organic particles and sec-ondary inorganic species.
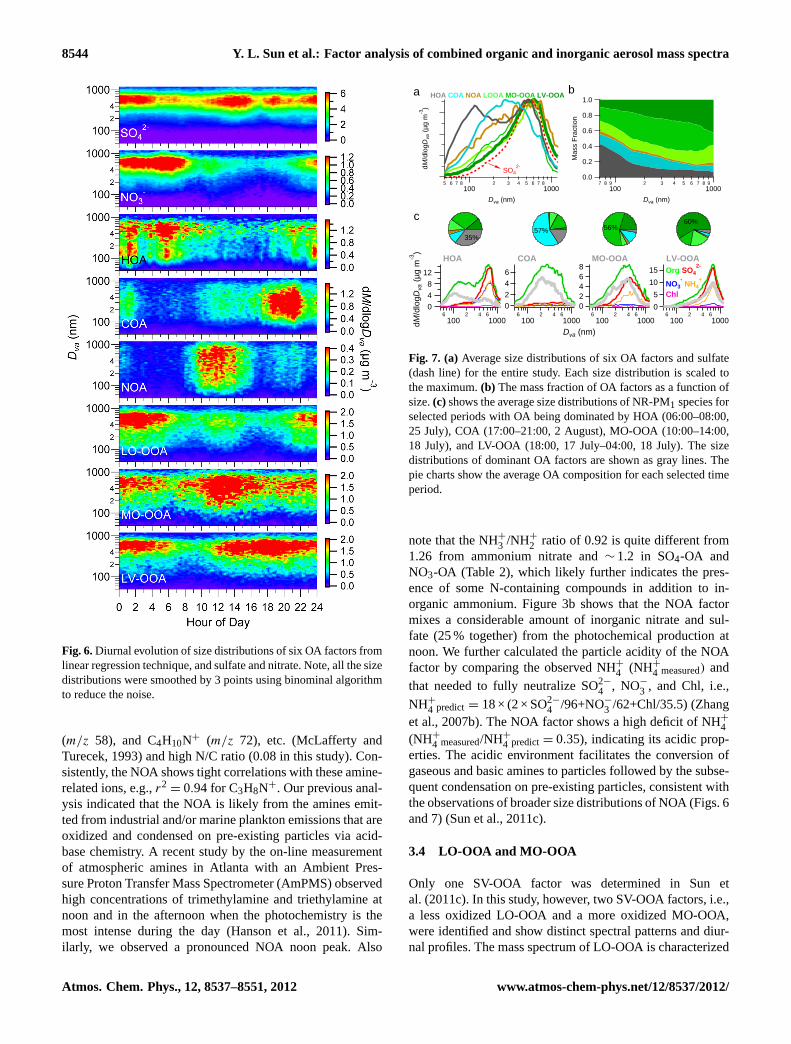
Figure 6 shows the diurnal evolution of the size distribu-tions of six OA factors and Fig. 7 presents the average sizedistributions for the entire study. The diurnal cycle of HOAsize distribution shows a bimodal distribution in both mid-night and morning rush hours when the small mode particlespeaking at∼ 110 nm are largely enhanced. Such feature isfurther illustrated by the average size distributions between
34
850
Fig. 5. Diurnal cycles of (a) sulfate in SO4-OA and the rest of the OA factors, and the 851
estimated gas-phase production rate of H2SO4 (Sun et al., 2011c), (b) nitrate in NO3-OA 852
and the rest of OA factors, the estimated gas-phase production rate of HNO3, and 853
equilibrium constant of Kp (Sun et al., 2011c). 854
4
3
2
1
0
SO42-
(µg
m-3
)
0.70.60.50.40.3D
iff. (
µg m
-3) 10x10-2
86420
H2 SO
4 (g) /t
(µg m-3 hr -1)
242220181614121086420Hour of Day
Total - SO4-OA H2SO4 (g)/t
Total - SO4-OA SO4-OA
a
0.80.60.40.20.0
NO
3- (µg
m-3
)
0.200.150.100.050.00D
iff. (
µg m
-3)
2.5x10¹⁵
2.01.51.00.50.0
Kp (atm
-2)
6
4
2
0
HN
O3 (g) /t
(µg m-3 hr -1)
242220181614121086420Hour of Day
Total - NO3-OA NO3-OA Kp
Total - NO3-OA HNO3 (g)/tb
Fig. 5. Diurnal cycles of(a) sulfate in SO4-OA and the rest of theOA factors, and the estimated gas-phase production rate of H2SO4(Sun et al., 2011c),(b) nitrate in NO3-OA and the rest of OA factors,the estimated gas-phase production rate of HNO3, and equilibriumconstant ofKp (Sun et al., 2011c).
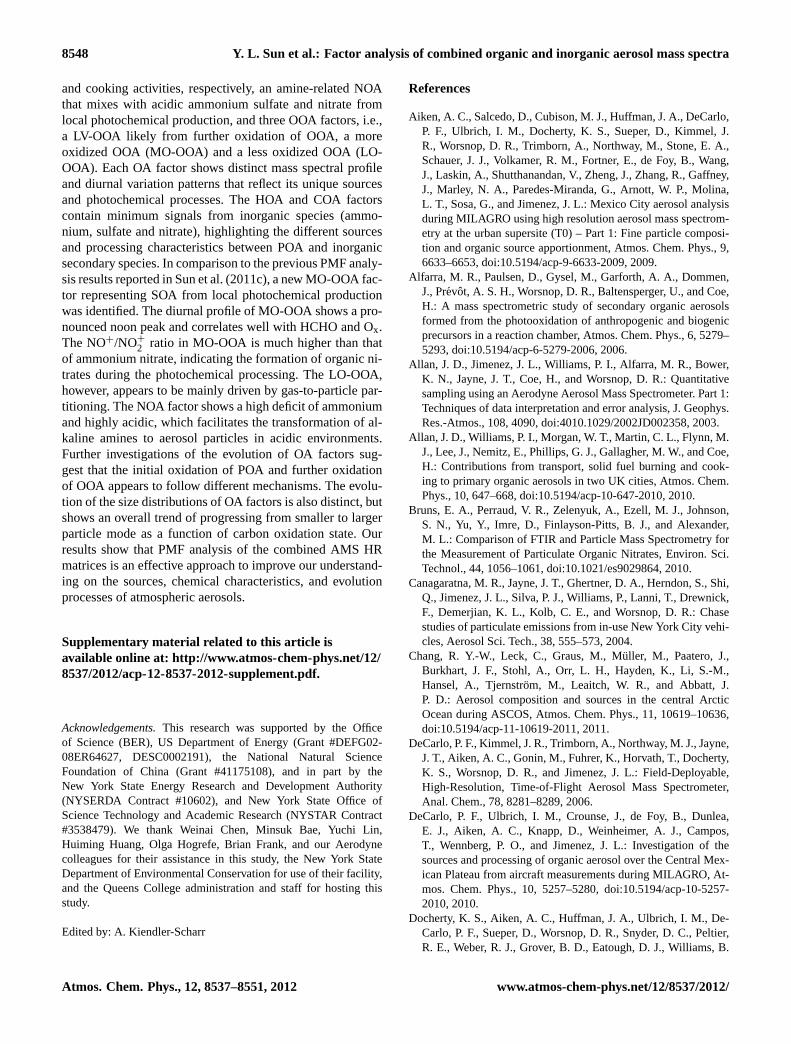
06:00–08:00 EST on 25 July when HOA dominated OA com-position (35 %, Fig. 7c). The small particle mode graduallydissipates during daytime while the contribution of the largemode increases correspondingly. The average HOA size alsoshows a considerable fraction at accumulation mode, likelyfrom the emissions of large HOA particles and/or the growthof small HOA particles which are coated by secondary or-ganic and inorganic species (Massoli et al., 2012). The sizedistribution of COA, however, shows a broad accumulationmode (peaking at∼ 300 nm) at dinner time, such as the COAdominant (57 % of OA) period between 17:00–21:00 on 2August. The HOA and COA together account for a majorfraction of ultrafine mode particles (> 50 %) and show over-all different size distributions from secondary species, con-sistent with the externally mixing characteristics of POAwith secondary species.
3.3 NOA
The nitrogen-enriched OA (NOA) factor determined in thisstudy shows similar spectral pattern to that reported inSun et al. (2011c), which is characterized by amine-relatedpeaks, e.g., CH4N+ (m/z 30), C2H4N+ (m/z 42), C3H8N+
8544 Y. L. Sun et al.: Factor analysis of combined organic and inorganic aerosol mass spectra
Fig. 6.Diurnal evolution of size distributions of six OA factors fromlinear regression technique, and sulfate and nitrate. Note, all the sizedistributions were smoothed by 3 points using binominal algorithmto reduce the noise.
(m/z 58), and C4H10N+ (m/z 72), etc. (McLafferty andTurecek, 1993) and high N/C ratio (0.08 in this study). Con-sistently, the NOA shows tight correlations with these amine-related ions, e.g.,r2
= 0.94 for C3H8N+. Our previous anal-ysis indicated that the NOA is likely from the amines emit-ted from industrial and/or marine plankton emissions that areoxidized and condensed on pre-existing particles via acid-base chemistry. A recent study by the on-line measurementof atmospheric amines in Atlanta with an Ambient Pres-sure Proton Transfer Mass Spectrometer (AmPMS) observedhigh concentrations of trimethylamine and triethylamine atnoon and in the afternoon when the photochemistry is themost intense during the day (Hanson et al., 2011). Sim-ilarly, we observed a pronounced NOA noon peak. Also
36
859
Fig. 7. (a) Average size distributions of six OA factors and sulfate (dash line) for the 860
entire study. Each size distribution is scaled to the maximum. (b) The mass fraction of 861
OA factors as a function of size. (c) shows the average size distributions of NR-PM1 862
species for selected periods with OA being dominated by HOA (6:00-8:00, 25 July), 863
COA (17:00-21:00, 2 August), MO-OOA (10:00-14:00, 18 July), and LV-OOA (18:00, 864
17 July – 4:00, 18 July). The size distributions of dominant OA factors are shown as gray 865
lines. The pie charts show the average OA composition for each selected time period. 866
12840
dM/d
logD
va (µ
g m
-3)
6100
2 4 61000
6420
6100
2 4 61000
86420
6100
2 4 61000
1510
50
6100
2 4 61000
HOA COA MO-OOA LV-OOA
Dva (nm)
Org SO42-
NO3- NH4
+
Chl
dM/d
logD
va (µ
g m
-3)
5 6 7 8100
2 3 4 5 6 7 81000
Dva (nm)
HOA COA NOA LOOA MO-OOA LV-OOA
SO42-
1.0
0.8
0.6
0.4
0.2
0.0
Mas
s Fr
actio
n
7 8 9100
2 3 4 5 6 7 8 91000
Dva (nm)
35%57% 56%
60%
a b
c
Fig. 7. (a)Average size distributions of six OA factors and sulfate(dash line) for the entire study. Each size distribution is scaled tothe maximum.(b) The mass fraction of OA factors as a function ofsize.(c) shows the average size distributions of NR-PM1 species forselected periods with OA being dominated by HOA (06:00–08:00,25 July), COA (17:00–21:00, 2 August), MO-OOA (10:00–14:00,18 July), and LV-OOA (18:00, 17 July–04:00, 18 July). The sizedistributions of dominant OA factors are shown as gray lines. Thepie charts show the average OA composition for each selected timeperiod.
note that the NH+3 /NH+
2 ratio of 0.92 is quite different from1.26 from ammonium nitrate and∼ 1.2 in SO4-OA andNO3-OA (Table 2), which likely further indicates the pres-ence of some N-containing compounds in addition to in-organic ammonium. Figure 3b shows that the NOA factormixes a considerable amount of inorganic nitrate and sul-fate (25 % together) from the photochemical production atnoon. We further calculated the particle acidity of the NOAfactor by comparing the observed NH+
4 (NH+
4 measured) andthat needed to fully neutralize SO2−
4 , NO−
3 , and Chl, i.e.,NH+
4 predict= 18 × (2 × SO2−
4 /96+NO−
3 /62+Chl/35.5) (Zhanget al., 2007b). The NOA factor shows a high deficit of NH+
4(NH+
4 measured/NH+
4 predict= 0.35), indicating its acidic prop-erties. The acidic environment facilitates the conversion ofgaseous and basic amines to particles followed by the subse-quent condensation on pre-existing particles, consistent withthe observations of broader size distributions of NOA (Figs. 6and 7) (Sun et al., 2011c).
3.4 LO-OOA and MO-OOA
Only one SV-OOA factor was determined in Sun etal. (2011c). In this study, however, two SV-OOA factors, i.e.,a less oxidized LO-OOA and a more oxidized MO-OOA,were identified and show distinct spectral patterns and diur-nal profiles. The mass spectrum of LO-OOA is characterized
Y. L. Sun et al.: Factor analysis of combined organic and inorganic aerosol mass spectra 8545
Table 2. Summary of the fraction (%) of selected fragment ions, and ion ratios in eight PMF factors. The average ion ratios for the entirestudy, and NO+/NO+
by two prominent peaks,m/z 29 (mainly CHO+) and 43(mainly C2H3O+), and shows much similarity to the SV-OOA component resolved from PMF analysis of thermally-denuded OA spectra during SOAR-1 (Docherty et al., 2011).Also, the low O/C ratio (=0.27) and low fraction ofm/z 44(2.6 %) for LO-OOA are consistent with those of SV-OOAin Docherty et al. (2011). In addition, the LO-OOA showhigh fraction of CxHyO+
1 family (40 %), most likely fromcarbonyl or alcohol function groups, while much lower con-tribution of CxHyO+
2 family (5.3 %), mainly from carboxylicfunctional groups. The diurnal variation of LO-OOA showssome similarities to nitrate with higher concentration at nightand lower concentration during daytime, indicating their sim-ilar volatile properties (Docherty et al., 2011). Note that asmall noon peak in the diurnal profile of LO-OOA is also ob-served. The mass spectral features and diurnal variation ofLO-OOA likely suggest that (1) LO-OOA is an intermediateaging product from freshly oxidized OA to highly oxidizedOA (Docherty et al., 2011), and/or (2) LO-OOA might bedriven by the partitioning of organic vapors between gas andparticle phase, which is facilitated by the high humidity andlow temperature.
The second OOA factor, i.e., MO-OOA, however, showsmore oxidized properties with higher O/C ratio (=0.48) andhigher fraction of CxHyO+
2 family (17 %). The mass spec-trum of MO-OOA resembles to that of OOA factor widelyobserved at other sites (Ng et al., 2010), and also biogenicOA (Slowik et al., 2010a; Sun et al., 2011a), although it ap-pears to show relatively lowerm/z 43/44 ratio. Particularly,the spectrum of MO-OOA shows much similarity to a localSOA identified from PMF analysis of the unified dataset fromAMS and PTR-MS measurements (Slowik et al., 2010b).The local SOA was found to be associated with local photo-chemical products of acetaldehyde and formaldehyde, indi-cating that MO-OOA also likely represents a local SOA. Thediurnal cycle of MO-OOA presents a pronounced noon peakwith the concentration starting to increase at∼ 09:00 andpeaking at 13:00. The subsequent decrease of MO-OOA af-
ter 13:00 is likely due to the further oxidation of MO-OOA toLV-OOA, consistent with the corresponding increase of LV-OOA. Figure 8a shows the time series of MO-OOA, HCHOand Ox (=O3+NO2). Overall, similar time trends were ob-served for these three species. The daily correlations betweenMO-OOA and HCHO, MO-OOA and Ox are significant dur-ing days with intense solar radiation, e.g.,r = 0.88 and 0.90for MO-OOA vs. HCHO on 22 and 24 July, respectively. Fur-ther, the diurnal cycle of MO-OOA is also very similar to thatof HCHO as shown in Fig. 8b. Our previous analysis showedthat ∼ 70 % of HCHO in NYC is from the photochemicalproduction,∼ 44 % of which is from isoprene oxidation (Linet al., 2012). All these results suggest that MO-OOA is aSOA product mainly from local photochemical processing,e.g., oxidation of biogenic VOCs. The diurnal size evolutionof MO-OOA shows a much broader size distribution duringthe photochemical processing time, likely indicating the for-mation of smaller particles from photochemical productionfollowed by condensation on pre-existing particles. Dochertyet al. (2011) identified a medium-volatility OOA (MV-OOA)that comprises a higher-volatility MV-OOA (MV-OOA-hv)and a lower-volatility MV-OOA (MV-OOA-lv) fraction dur-ing SOAR-1. The two MV-OOA factors correlate with Oxand WSOC significantly and show very similar diurnal cy-cles to that of MO-OOA in this study. Detailed analysis sug-gests that the photochemical processing is the major sourceof these two factors, consistent with our conclusions.
Further investigation of the case study on 22 July (Sun etal., 2011b) also supports the photochemical production ofMO-OOA with the processes co-varying with the solar ra-diation and the formation of HCHO (Fig. S11). The initialphotochemical production in the early morning firstly leadsto an increase of MO-OOA, and then followed by an increaseof more aged LV-OOA after∼ 13:00. The formation of LV-OOA is coincidently corresponding to the decrease of MO-OOA, likely indicating an oxidation process from MO-OOAto LV-OOA. The regional transport from the south, how-ever, appears to play more important roles in controlling the
Fig. 8. (a) Time series of solar radiation (SR) and precipitation,Ox (=NO2+O3), HCHO, and MO-OOA, and daily correlations ofMO-OOA vs. HCHO, and MO-OOA vs. Ox. (b) Diurnal profiles ofMO-OOA, HCHO, and Ox for the entire study.
variation of highly aged OA in SO4-OA factor, which showsa gradual increase from∼ 09:00 until 18:00, in agreementwith the air masses from the polluted regions to the south ofNYC. Results here indicate that the OA evolution on 22 Julyis an aging process mixed with local photochemical produc-tion and regional transport.
We also note that the MO-OOA factor contains∼ 20 % ofinorganic species, but the fragment ion patterns are quite dif-ferent from those of pure inorganic species (Table 2). For ex-ample, the ion ratio of NO+/NO+
2 in MO-OOA factor is 9.4,which is much higher than 3.5 of ammonium nitrate alone.High NO+/NO+
2 ratio is an indication for the presence oforganic nitrates (Alfarra et al., 2006; Rollins et al., 2010), al-though the ratio may vary depending on the specific HR-ToF-AMS instruments (Farmer et al., 2010). Alfarra et al. (2006)reported a ratio of NO+/NO+
2 of 7.5 and 5.1 for the pho-tooxidation of 1,3,5-TMB andα-pinene with NOx, respec-tively. Similarly, high NO+/NO+
2 ratios were also observedfor NO3 oxidation ofβ-pinene (∼ 10) (Fry et al., 2009), vari-ous monoterpene (∼ 10–15) and isoprene (∼ 5) (Bruns et al.,
2010). These results together suggest that NO+ and NO+
2 inMO-OOA factor is likely from the contribution of organic ni-trates, especially at noon time, which are formed via the pho-tochemical oxidation of VOCs. The nitrate in MO-OOA fac-tor contributes∼ 12 % of total nitrate mass. If assuming thatNO+
x fragments in MO-OOA are all from organic nitrates andon average account for∼ 10 % of total organic nitrate signal,we estimate that organic nitrates in NYC contribute∼ 7 %of total organics. In addition, the ratio of NH+3 /NH+
2 in MO-OOA factor is∼ 0.9 which is lower than that of ammonium(∼ 1.2 in this study). This might also indicate the presenceof nitrogenated organic compounds in addition to inorganicammonium. We also observed SO+ and SO+
2 fragment ions,but very minor other sulfate-related ions, e.g., SO+
3 , HSO+
3 ,and H2SO+
4 in MO-OOA. Unfortunately, we do not have evi-dence to conclude if these SO+
x ions are from organic sulfatesor ammonium sulfate.
3.5 LV-OOA
The LV-OOA factor determined in this study shows very sim-ilar spectral pattern to the previously reported LV-OOA (Nget al., 2010; Sun et al., 2011c), which is characterized by highO/C ratio (=0.59) andf44 (15 %). The diurnal profile of LV-OOA is different from those of the other OA factors, showinga gradual increase from noon until late afternoon despite therising boundary layer. Note that the increase of LV-OOA ap-pears to be associated with the decrease LO-OOA and MO-OOA, likely indicating a photochemical oxidation progressfrom less oxidized OOA to highly oxidized LV-OOA. Thesize distribution of LV-OOA presents a persistent and sin-gle large accumulation across the day. Although LV-OOAis highly aged, it does not mix much with ammonium sul-fate and ammonium nitrate, further indicating the differentsources of LV-OOA and highly aged OA in SO4-OA. Indeed,the correlation between LV-OOA and sulfate from the newPMF analysis is weaker than that from PMF analysis of OAonly (r2
= 0.42 vs. 0.66). It appears that the previous LV-OOA (Sun et al., 2011c) comprises two highly aged OA fac-tors primarily from regional (SO4-OA) and local contribu-tions (LV-OOA). Consistently, the contribution of the sumof highly oxidized SO4-OA (12 %) and LV-OOA (19 %) tothe total OA is close to that of LV-OOA (∼ 30 %) reportedpreviously (Sun et al., 2011c). Also, the combined size dis-tribution of LV-OOA and SO4-OA is very similar to that ofsulfate (Fig. 7), which is characterized by a large accumula-tion mode peaking at∼ 600 nm.
3.6 Evolution of OA
To further investigate the evolution of OA, the triangle plot(f44 vs.f43) (Ng et al., 2010) and the Van Krevelen diagram(Heald et al., 2010) are presented in Fig. 9. The HOA, COA,NO3-OA, and LO-OOA show similar low oxidative proper-ties with varyingf43, which are located at the bottom of the
Y. L. Sun et al.: Factor analysis of combined organic and inorganic aerosol mass spectra 8547
38
871
Fig. 9. (a,b) Hourly averaged f44 (fraction of m/z 44 in OA) vs. f43 (fraction of m/z 43 in 872
OA), and fCO2+ (fraction of CO2
+ in OA) vs. fC2H3O+ (fraction of C2H3O
+ in OA). The 873
f44 vs. f43 and fCO2+ vs. fC2H3O
+ relationships for eight OA factors are also shown. The 874
dash lines in (a) and (b) refer to a triangular region that encompasses ambient OOA 875
factors determined from PMF analyses of 43 AMS datasets (Ng et al., 2010). (c) Van 876
Krevelen diagram for hourly averaged OA and eight OA factors. The dash lines indicate 877
the changes of H/C against O/C due to adding specific functional groups to an aliphatic 878
carbon (Heald et al., 2010). The red and blue lines are derived from the right and left 879
lines in the triangle plot, and the light gray shaded region denotes ±10% uncertainty (Ng 880
et al., 2011). 881
0.30
0.25
0.20
0.15
0.10
0.05
0.00
fCO
2+
0.200.150.100.050.00fC2H3O
+
0.30
0.25
0.20
0.15
0.10
0.05
0.00
f44
0.200.150.100.050.00
f43
LV-OOAMO-OOALO-OOANOACOAHOANO3-OASO4-OA
2.0
1.8
1.6
1.4
1.2
1.0
H/C
1.00.80.60.40.20.0
O/C
ketone/aldehyde(slope = -2)
carboxylic acid(slope = -1)
alcohol/peroxides(slope = 0)
(slope = -0.5)
a b
c
Fig. 9. (a, b)Hourly averagedf44 (fraction of m/z 44 in OA) vs.f43 (fraction of m/z 43 in OA), andf CO+
2 (fraction of CO+
2 in OA)
vs.f C2H3O+ (fraction of C2H3O+ in OA). Thef44 vs.f43 andf CO+
2 vs.f C2H3O+ relationships for eight OA factors are also shown.The dash lines in(a) and(b) refer to a triangular region that encompasses ambient OOA factors determined from PMF analyses of 43 AMSdatasets (Ng et al., 2010).(c) Van Krevelen diagram for hourly averaged OA and eight OA factors. The dash lines indicate the changes ofH/C against O/C due to adding specific functional groups to an aliphatic carbon (Heald et al., 2010). The red and blue lines are derived fromthe right and left lines in the triangle plot, and the light gray shaded region denotes ± 10 % uncertainty (Ng et al., 2011).
triangular region. As aging progresses, OA evolves to the up-per corner and shows more similar oxidative properties toMO-OOA and LV-OOA. However, the ensemble OA neverreaches the high oxidation state of SO4-OA. Since the trian-gle plot represents an integration of OOA factors, in whichm/z 44 andm/z 43 are primarily CO+2 and C2H3O+, re-spectively. It is of interest to check the relationship betweenf CO+
2 (fraction of CO+
2 in OA) vs. f C2H3O+ (fraction ofC2H3O+ in OA) (Fig. 9b). Clearly, different behaviors wereobserved forf44 vs.f43. The POA factors of HOA and COAare located at the left-bottom corner with the lowestf CO+
2andf C2H3O+, LO-OOA and NO3-OA, however, reside inthe triangular region with highf C2H3O+ yet similar lowf CO+
2 , indicating their different sources and properties fromHOA and COA. It appears that the aging of OA is character-ized by two pathways. The initial oxidization of fresh OA,e.g., HOA/COA appears to involve a synchronous increaseof bothf CO+
2 andf C2H3O+, and evolves into the triangu-lar region first. The further oxidation of less oxidized OA,e.g., LO-OOA/NO3-OA, however, appears to follow a trendwith a decrease off C2H3O+ and increase off CO+
2 . Thetwo evolving trends are consistent with the evolution of H/C
vs. O/C in the Van Krevelen diagram. The initial oxidationof POA shows a steeper slope than−1, likely driven by thefunctionalization by incorporating carbonyl groups (Ng etal., 2011). The further oxidation of OA shows a shallowerslope (∼ −0.8), most likely from the additions of both acidand alcohol functional groups with little fragmentation (Nget al., 2011). The evolution processes also lead to a changeof the size distributions of OA factors (Fig. 7), and the sizeappears to progress from smaller to larger particles as a func-tion of oxidization state.
4 Conclusions
PMF analysis was performed for the first time to the com-bined HR mass spectral matrices of organic and inorganicaerosols from the HR-ToF-AMS measurements conductedat QC in NYC in summer 2009. In this study, eight factorswere identified, including a SO4-OA that contains primar-ily ammonium sulfate and highly oxidized OA from regionalscale, a NO3-OA that contains primarily ammonium nitrate,two POA factors, i.e., HOA and COA from traffic emissions
8548 Y. L. Sun et al.: Factor analysis of combined organic and inorganic aerosol mass spectra
and cooking activities, respectively, an amine-related NOAthat mixes with acidic ammonium sulfate and nitrate fromlocal photochemical production, and three OOA factors, i.e.,a LV-OOA likely from further oxidation of OOA, a moreoxidized OOA (MO-OOA) and a less oxidized OOA (LO-OOA). Each OA factor shows distinct mass spectral profileand diurnal variation patterns that reflect its unique sourcesand photochemical processes. The HOA and COA factorscontain minimum signals from inorganic species (ammo-nium, sulfate and nitrate), highlighting the different sourcesand processing characteristics between POA and inorganicsecondary species. In comparison to the previous PMF analy-sis results reported in Sun et al. (2011c), a new MO-OOA fac-tor representing SOA from local photochemical productionwas identified. The diurnal profile of MO-OOA shows a pro-nounced noon peak and correlates well with HCHO and Ox.The NO+/NO+
2 ratio in MO-OOA is much higher than thatof ammonium nitrate, indicating the formation of organic ni-trates during the photochemical processing. The LO-OOA,however, appears to be mainly driven by gas-to-particle par-titioning. The NOA factor shows a high deficit of ammoniumand highly acidic, which facilitates the transformation of al-kaline amines to aerosol particles in acidic environments.Further investigations of the evolution of OA factors sug-gest that the initial oxidation of POA and further oxidationof OOA appears to follow different mechanisms. The evolu-tion of the size distributions of OA factors is also distinct, butshows an overall trend of progressing from smaller to largerparticle mode as a function of carbon oxidation state. Ourresults show that PMF analysis of the combined AMS HRmatrices is an effective approach to improve our understand-ing on the sources, chemical characteristics, and evolutionprocesses of atmospheric aerosols.
Supplementary material related to this article isavailable online at:http://www.atmos-chem-phys.net/12/8537/2012/acp-12-8537-2012-supplement.pdf.
Acknowledgements.This research was supported by the Officeof Science (BER), US Department of Energy (Grant #DEFG02-08ER64627, DESC0002191), the National Natural ScienceFoundation of China (Grant #41175108), and in part by theNew York State Energy Research and Development Authority(NYSERDA Contract #10602), and New York State Office ofScience Technology and Academic Research (NYSTAR Contract#3538479). We thank Weinai Chen, Minsuk Bae, Yuchi Lin,Huiming Huang, Olga Hogrefe, Brian Frank, and our Aerodynecolleagues for their assistance in this study, the New York StateDepartment of Environmental Conservation for use of their facility,and the Queens College administration and staff for hosting thisstudy.
Edited by: A. Kiendler-Scharr
References
Aiken, A. C., Salcedo, D., Cubison, M. J., Huffman, J. A., DeCarlo,P. F., Ulbrich, I. M., Docherty, K. S., Sueper, D., Kimmel, J.R., Worsnop, D. R., Trimborn, A., Northway, M., Stone, E. A.,Schauer, J. J., Volkamer, R. M., Fortner, E., de Foy, B., Wang,J., Laskin, A., Shutthanandan, V., Zheng, J., Zhang, R., Gaffney,J., Marley, N. A., Paredes-Miranda, G., Arnott, W. P., Molina,L. T., Sosa, G., and Jimenez, J. L.: Mexico City aerosol analysisduring MILAGRO using high resolution aerosol mass spectrom-etry at the urban supersite (T0) – Part 1: Fine particle composi-tion and organic source apportionment, Atmos. Chem. Phys., 9,6633–6653,doi:10.5194/acp-9-6633-2009, 2009.
Alfarra, M. R., Paulsen, D., Gysel, M., Garforth, A. A., Dommen,J., Prevot, A. S. H., Worsnop, D. R., Baltensperger, U., and Coe,H.: A mass spectrometric study of secondary organic aerosolsformed from the photooxidation of anthropogenic and biogenicprecursors in a reaction chamber, Atmos. Chem. Phys., 6, 5279–5293,doi:10.5194/acp-6-5279-2006, 2006.
Allan, J. D., Jimenez, J. L., Williams, P. I., Alfarra, M. R., Bower,K. N., Jayne, J. T., Coe, H., and Worsnop, D. R.: Quantitativesampling using an Aerodyne Aerosol Mass Spectrometer. Part 1:Techniques of data interpretation and error analysis, J. Geophys.Res.-Atmos., 108, 4090, doi:4010.1029/2002JD002358, 2003.
Allan, J. D., Williams, P. I., Morgan, W. T., Martin, C. L., Flynn, M.J., Lee, J., Nemitz, E., Phillips, G. J., Gallagher, M. W., and Coe,H.: Contributions from transport, solid fuel burning and cook-ing to primary organic aerosols in two UK cities, Atmos. Chem.Phys., 10, 647–668,doi:10.5194/acp-10-647-2010, 2010.
Bruns, E. A., Perraud, V. R., Zelenyuk, A., Ezell, M. J., Johnson,S. N., Yu, Y., Imre, D., Finlayson-Pitts, B. J., and Alexander,M. L.: Comparison of FTIR and Particle Mass Spectrometry forthe Measurement of Particulate Organic Nitrates, Environ. Sci.Technol., 44, 1056–1061,doi:10.1021/es9029864, 2010.
Canagaratna, M. R., Jayne, J. T., Ghertner, D. A., Herndon, S., Shi,Q., Jimenez, J. L., Silva, P. J., Williams, P., Lanni, T., Drewnick,F., Demerjian, K. L., Kolb, C. E., and Worsnop, D. R.: Chasestudies of particulate emissions from in-use New York City vehi-cles, Aerosol Sci. Tech., 38, 555–573, 2004.
Chang, R. Y.-W., Leck, C., Graus, M., Muller, M., Paatero, J.,Burkhart, J. F., Stohl, A., Orr, L. H., Hayden, K., Li, S.-M.,Hansel, A., Tjernstrom, M., Leaitch, W. R., and Abbatt, J.P. D.: Aerosol composition and sources in the central ArcticOcean during ASCOS, Atmos. Chem. Phys., 11, 10619–10636,doi:10.5194/acp-11-10619-2011, 2011.
DeCarlo, P. F., Kimmel, J. R., Trimborn, A., Northway, M. J., Jayne,J. T., Aiken, A. C., Gonin, M., Fuhrer, K., Horvath, T., Docherty,K. S., Worsnop, D. R., and Jimenez, J. L.: Field-Deployable,High-Resolution, Time-of-Flight Aerosol Mass Spectrometer,Anal. Chem., 78, 8281–8289, 2006.
DeCarlo, P. F., Ulbrich, I. M., Crounse, J., de Foy, B., Dunlea,E. J., Aiken, A. C., Knapp, D., Weinheimer, A. J., Campos,T., Wennberg, P. O., and Jimenez, J. L.: Investigation of thesources and processing of organic aerosol over the Central Mex-ican Plateau from aircraft measurements during MILAGRO, At-mos. Chem. Phys., 10, 5257–5280,doi:10.5194/acp-10-5257-2010, 2010.
Docherty, K. S., Aiken, A. C., Huffman, J. A., Ulbrich, I. M., De-Carlo, P. F., Sueper, D., Worsnop, D. R., Snyder, D. C., Peltier,R. E., Weber, R. J., Grover, B. D., Eatough, D. J., Williams, B.
Y. L. Sun et al.: Factor analysis of combined organic and inorganic aerosol mass spectra 8549
J., Goldstein, A. H., Ziemann, P. J., and Jimenez, J. L.: The 2005Study of Organic Aerosols at Riverside (SOAR-1): instrumentalintercomparisons and fine particle composition, Atmos. Chem.Phys., 11, 12387–12420,doi:10.5194/acp-11-12387-2011, 2011.
Drewnick, F., Hings, S. S., DeCarlo, P. F., Jayne, J. T., Gonin, M.,Fuhrer, K., Weimer, S., Jimenez, J. L., Demerjian, K. L., Bor-rmann, S., and Worsnop, D. R.: A new Time-of-Flight AerosolMass Spectrometer (ToF-AMS) – Instrument description andfirst field deployment., Aerosol Sci. Tech., 39, 637–658, 2005.
Dzepina, K., Volkamer, R. M., Madronich, S., Tulet, P., Ulbrich,I. M., Zhang, Q., Cappa, C. D., Ziemann, P. J., and Jimenez, J.L.: Evaluation of recently-proposed secondary organic aerosolmodels for a case study in Mexico City, Atmos. Chem. Phys., 9,5681–5709,doi:10.5194/acp-9-5681-2009, 2009.
Farmer, D. K., Matsunaga, A., Docherty, K. S., Surratt, J. D., Se-infeld, J. H., Ziemann, P. J., and Jimenez, J. L.: Response of anaerosol mass spectrometer to organonitrates and organosulfatesand implications for atmospheric chemistry, P. Natl. Acad. Sci.USA, 107, 6670–6675,doi:10.1073/pnas.0912340107, 2010.
Forster, P., Ramaswamy, V., Artaxo, P., Berntsen, T., Betts, R., Fa-hey, D. W., Haywood, J., Lean, J., Lowe, D. C., Myhre, G.,Nganga, J., Prinn, R., Raga, G., Schulz, M., and Dorland, R.V.: Changes in Atmospheric Constituents and in Radiative Forc-ing, in: Climate Change 2007: The Physical Science Basis. Con-tribution of Working Group I to the Fourth Assessment Reportof the Intergovernmental Panel on Climate Change, edited by:Solomon, S., Qin, D., Manning, M., Chen, Z., Marquis, M., Av-eryt, K. B., Tignor, M., and Miller, H. L.: Cambridge UniversityPress, Cambridge, United Kingdom and New York, NY, USA,2007.
Fry, J. L., Kiendler-Scharr, A., Rollins, A. W., Wooldridge, P. J.,Brown, S. S., Fuchs, H., Dube, W., Mensah, A., dal Maso,M., Tillmann, R., Dorn, H.-P., Brauers, T., and Cohen, R.C.: Organic nitrate and secondary organic aerosol yield fromNO3 oxidation ofβ-pinene evaluated using a gas-phase kinet-ics/aerosol partitioning model, Atmos. Chem. Phys., 9, 1431–1449,doi:10.5194/acp-9-1431-2009, 2009.
Ge, X., Setyan, A., Sun, Y., and Zhang, Q.: Primary and secondaryorganic aerosols in Fresno, California during wintertime: Re-sults from high resolution aerosol mass spectrometry, J. Geo-phys. Res.,doi:10.1029/2012JD018026, in press, 2012.
Hanson, D. R., McMurry, P. H., Jiang, J., Tanner, D., and Huey,L. G.: Ambient Pressure Proton Transfer Mass Spectrometry:Detection of Amines and Ammonia, Environ. Sci. Technol., 45,8881–8888,doi:10.1021/es201819a, 2011.
Heald, C. L., Jacob, D. J., Park, R. J., Russell, L. M., Huebert, B. J.,Seinfeld, J. H., Liao, H., and Weber, R. J.: A large organic aerosolsource in the free troposphere missing from current models, Geo-phys. Res. Lett., 32, L18809,doi:10.1029/2005GL023831, 2005.
Heald, C. L., Kroll, J. H., Jimenez, J. L., Docherty, K. S., DeCarlo,P. F., Aiken, A. C., Chen, Q., Martin, S. T., Farmer, D. K., andArtaxo, P.: A simplified description of the evolution of organicaerosol composition in the atmosphere, Geophys. Res. Lett., 37,L08803,doi:10.1029/2010gl042737, 2010.
Heald, C. L., Coe, H., Jimenez, J. L., Weber, R. J., Bahreini, R.,Middlebrook, A. M., Russell, L. M., Jolleys, M., Fu, T.-M., Al-lan, J. D., Bower, K. N., Capes, G., Crosier, J., Morgan, W.T., Robinson, N. H., Williams, P. I., Cubison, M. J., DeCarlo,P. F., and Dunlea, E. J.: Exploring the vertical profile of atmo-
spheric organic aerosol: comparing 17 aircraft field campaignswith a global model, Atmos. Chem. Phys., 11, 12673–12696,doi:10.5194/acp-11-12673-2011, 2011.
Jayne, J. T., Leard, D. C., Zhang, X., Davidovits, P., Smith, K. A.,Kolb, C. E., and Worsnop, D. R.: Development of an aerosolmass spectrometer for size and composition analysis of submi-cron particles, Aerosol Sci. Tech., 33, 49–70, 2000.
Jimenez, J. L., Canagaratna, M. R., Donahue, N. M., Prevot, A. S.H., Zhang, Q., Kroll, J. H., DeCarlo, P. F., Allan, J. D., Coe,H., Ng, N. L., Aiken, A. C., Docherty, K. S., Ulbrich, I. M.,Grieshop, A. P., Robinson, A. L., Duplissy, J., Smith, J. D.,Wilson, K. R., Lanz, V. A., Hueglin, C., Sun, Y. L., Tian, J.,Laaksonen, A., Raatikainen, T., Rautiainen, J., Vaattovaara, P.,Ehn, M., Kulmala, M., Tomlinson, J. M., Collins, D. R., Cu-bison, M. J., E, Dunlea, J., Huffman, J. A., Onasch, T. B., Al-farra, M. R., Williams, P. I., Bower, K., Kondo, Y., Schnei-der, J., Drewnick, F., Borrmann, S., Weimer, S., Demerjian, K.,Salcedo, D., Cottrell, L., Griffin, R., Takami, A., Miyoshi, T.,Hatakeyama, S., Shimono, A., Sun, J. Y., Zhang, Y. M., Dzepina,K., Kimmel, J. R., Sueper, D., Jayne, J. T., Herndon, S. C., Trim-born, A. M., Williams, L. R., Wood, E. C., Middlebrook, A. M.,Kolb, C. E., Baltensperger, U., and Worsnop, D. R.: Evolutionof organic aerosols in the atmosphere, Science, 326, 1525–1529,doi:10.1126/science.1180353, 2009.
Khan, B., Hays, M. D., Geron, C., and Jetter, J.: Differences in theOC/EC Ratios that Characterize Ambient and Source Aerosolsdue to Thermal-Optical Analysis, Aerosol Sci. Tech., 46, 127–137,doi:10.1080/02786826.2011.609194, 2011.
Lall, R. and Thurston, G. D.: Identifying and quantifying trans-ported vs. local sources of New York City PM2.5 fine particulatematter air pollution, Atmos. Environ., 40, 333–346, 2006.
Lanz, V. A., Alfarra, M. R., Baltensperger, U., Buchmann, B.,Hueglin, C., and Prevot, A. S. H.: Source apportionment of sub-micron organic aerosols at an urban site by factor analytical mod-elling of aerosol mass spectra, Atmos. Chem. Phys., 7, 1503–1522,doi:10.5194/acp-7-1503-2007, 2007.
Li, Z., Hopke, P. K., Husain, L., Qureshi, S., Dutkiewicz, V. A.,Schwab, J. J., Drewnick, F., and Demerjian, K. L.: Sources offine particle composition in New York city, Atmos. Environ., 38,6521–6529, 2004.
Lin, Y. C., Schwab, J. J., Demerjian, K. L., Bae, M.-S., Chen, W.-N., Sun, Y., Zhang, Q., Hung, H.-M., and Perry, J.: SummertimeFormaldehyde Observations in New York City: Ambient levels,Sources and Its Contribution to HOx Radicals, J. Geophys. Res.,117, D08305,doi:10.1029/2011JD016504, 2012.
Massoli, P., Fortner, E. C., Canagaratna, M. R., Williams, L.R., Zhang, Q., Sun, Y., Schwab, J. J., Trimborn, A., Onasch,T. B., Demerjian, K. L., Kolb, C. E., Worsnop, D. R., andJayne, J. T.: Pollution Gradients and Chemical Characteriza-tion of Particulate Matter from Vehicular Traffic Near Ma-jor Roadways: Results from the 2009 Queens College AirQuality Study in NYC, Aerosol Sci. Tech., 46, 1201–1218,doi:10.1080/02786826.2012.701784, 2012.
McLafferty, F. W. and Turecek, F.: Interpretation of Mass Spectra,University Science Books, Mill Valley, California, 1993.
Mohr, C., Huffman, J. A., Cubison, M. J., Aiken, A. C., Docherty,K. S., Kimmel, J. R., Ulbrich, I. M., Hannigan, M., and Jimenez,J. L.: Characterization of primary organic aerosol emissionsfrom meat cooking, trash burning, and motor vehicles with
8550 Y. L. Sun et al.: Factor analysis of combined organic and inorganic aerosol mass spectra
High-Resolution Aerosol Mass Spectrometry and comparisonwith ambient and chamber observations, Environ. Sci. Technol.,43, 2443–2449,doi:10.1021/es8011518, 2009.
Mohr, C., DeCarlo, P. F., Heringa, M. F., Chirico, R., Slowik, J.G., Richter, R., Reche, C., Alastuey, A., Querol, X., Seco, R.,Penuelas, J., Jimenez, J. L., Crippa, M., Zimmermann, R., Bal-tensperger, U., and Prevot, A. S. H.: Identification and quan-tification of organic aerosol from cooking and other sources inBarcelona using aerosol mass spectrometer data, Atmos. Chem.Phys., 12, 1649–1665,doi:10.5194/acp-12-1649-2012, 2012.
Ng, N. L., Canagaratna, M. R., Zhang, Q., Jimenez, J. L., Tian,J., Ulbrich, I. M., Kroll, J. H., Docherty, K. S., Chhabra, P.S., Bahreini, R., Murphy, S. M., Seinfeld, J. H., Hildebrandt,L., Donahue, N. M., DeCarlo, P. F., Lanz, V. A., Prevot, A. S.H., Dinar, E., Rudich, Y., and Worsnop, D. R.: Organic aerosolcomponents observed in Northern Hemispheric datasets fromAerosol Mass Spectrometry, Atmos. Chem. Phys., 10, 4625–4641,doi:10.5194/acp-10-4625-2010, 2010.
Ng, N. L., Canagaratna, M. R., Jimenez, J. L., Chhabra, P. S., Se-infeld, J. H., and Worsnop, D. R.: Changes in organic aerosolcomposition with aging inferred from aerosol mass spectra, At-mos. Chem. Phys., 11, 6465–6474,doi:10.5194/acp-11-6465-2011, 2011.
Paatero, P. and Tapper, U.: Positive matrix factorization: A non-negative factor model with optimal utilization of error estimatesof data values, Environmetrics, 5, 111–126, 1994.
Pope III, C. A., Burnett, R. T., Thun, M. J., Calle, E. E., Krewski,D., Ito, K., and Thurston, G. D.: Lung cancer, cardiopulmonarymortality, and long-term exposure to fine particulate air pollu-tion, JAMA-J. Am. Med. Assoc., 287, 1132–1141, 2002.
Pope III, C. A., Ezzati, M., and Dockery, D. W.: Fine-particulateair pollution and life expectancy in the United States, N. Engl. J.Med., 360, 376–386,doi:10.1056/NEJMsa0805646, 2009.
Qin, Y., Kim, E., and Hopke, P. K.: The concentrations and sourcesof PM2.5 in metropolitan New York City, Atmos. Environ., 40,312–332, 2006.
Rollins, A. W., Fry, J. L., Hunter, J. F., Kroll, J. H., Worsnop, D. R.,Singaram, S. W., and Cohen, R. C.: Elemental analysis of aerosolorganic nitrates with electron ionization high-resolution massspectrometry, Atmos. Meas. Tech., 3, 301–310,doi:10.5194/amt-3-301-2010, 2010.
Schauer, J. J. and Cass, G. R.: Source apportionment of wintertimegas-phase and particle-phase air pollutants using organic com-pounds as tracers, Environ. Sci. Technol., 34, 1821–1832, 2000.
Slowik, J. G., Stroud, C., Bottenheim, J. W., Brickell, P. C., Chang,R. Y.-W., Liggio, J., Makar, P. A., Martin, R. V., Moran, M. D.,Shantz, N. C., Sjostedt, S. J., van Donkelaar, A., Vlasenko, A.,Wiebe, H. A., Xia, A. G., Zhang, J., Leaitch, W. R., and Ab-batt, J. P. D.: Characterization of a large biogenic secondary or-ganic aerosol event from eastern Canadian forests, Atmos. Chem.Phys., 10, 2825–2845,doi:10.5194/acp-10-2825-2010, 2010a.
Slowik, J. G., Vlasenko, A., McGuire, M., Evans, G. J., and Abbatt,J. P. D.: Simultaneous factor analysis of organic particle and gasmass spectra: AMS and PTR-MS measurements at an urban site,Atmos. Chem. Phys., 10, 1969–1988,doi:10.5194/acp-10-1969-2010, 2010b.
Sun, Y., Zhang, Q., Zheng, M., Ding, X., Edgerton, E. S., and Wang,X.: Characterization and source apportionment of water-solubleorganic matter in atmospheric fine particles (PM2.5) with High-
Resolution Aerosol Mass Spectrometry and GC-MS, Environ.Sci. Technol., 45, 4854–4861,doi:10.1021/es200162h, 2011a.
Sun, Y. L., Zhang, Q., Schwab, J. J., Chen, W. N., Bae, M. S.,Lin, Y. C., Hung, H. M., and Demerjian, K. L.: A case studyof aerosol processing and evolution in summer in New YorkCity, Atmos. Chem. Phys., 11, 12737–12750,doi:10.5194/acp-11-12737-2011, 2011b.
Sun, Y.-L., Zhang, Q., Schwab, J. J., Demerjian, K. L., Chen, W.-N., Bae, M.-S., Hung, H.-M., Hogrefe, O., Frank, B., Rattigan,O. V., and Lin, Y.-C.: Characterization of the sources and pro-cesses of organic and inorganic aerosols in New York city witha high-resolution time-of-flight aerosol mass apectrometer, At-mos. Chem. Phys., 11, 1581–1602,doi:10.5194/acp-11-1581-2011, 2011c.
Turpin, B. J. and Huntzicker, J. J.: Identification of secondary or-ganic aerosol episodes and quantitation of primary and secondaryorganic aerosol concentrations during SCAQS, Atmos. Environ.,29, 3527–3544, 1995.
Ulbrich, I. M., Canagaratna, M. R., Zhang, Q., Worsnop, D. R., andJimenez, J. L.: Interpretation of organic components from Posi-tive Matrix Factorization of aerosol mass spectrometric data, At-mos. Chem. Phys., 9, 2891–2918,doi:10.5194/acp-9-2891-2009,2009.
Ulbrich, I. M., Canagaratna, M. R., Cubison, M. J., Zhang, Q., Ng,N. L., Aiken, A. C., and Jimenez, J. L.: Three-dimensional factor-ization of size-resolved organic aerosol mass spectra from Mex-ico City, Atmos. Meas. Tech., 5, 195–224,doi:10.5194/amt-5-195-2012, 2012.
Volkamer, R., Jimenez, J. L., Martini, F. S., Dzepina, K., Zhang,Q., Salcedo, D., Molina, L. T., Molina, M. J., and Worsnop,D. R.: Secondary organic aerosol formation from anthropogenicVOCs: Rapid and higher than expected, Geophys. Res. Lett., 33,L17811,doi:10.1029/2006GL026899, 2006.
Watson, J. G.: Visibility: Science and regulation, J. Air Waste Man-age., 52, 628–713, 2002.
Wood, E. C., Canagaratna, M. R., Herndon, S. C., Onasch, T. B.,Kolb, C. E., Worsnop, D. R., Kroll, J. H., Knighton, W. B.,Seila, R., Zavala, M., Molina, L. T., DeCarlo, P. F., Jimenez,J. L., Weinheimer, A. J., Knapp, D. J., Jobson, B. T., Stutz,J., Kuster, W. C., and Williams, E. J.: Investigation of the cor-relation between odd oxygen and secondary organic aerosol inMexico City and Houston, Atmos. Chem. Phys., 10, 8947–8968,doi:10.5194/acp-10-8947-2010, 2010.
Zhang, Q., Alfarra, M. R., Worsnop, D. R., Allan, J. D., Coe, H.,Canagaratna, M. R., and Jimenez, J. L.: Deconvolution and quan-tification of hydrocarbon-like and oxygenated organic aerosolsbased on aerosol mass spectrometry, Environ. Sci. Technol., 39,4938–4952, doi:4910.1021/es048568l, 2005a.
Zhang, Q., Worsnop, D. R., Canagaratna, M. R., and Jimenez, J.L.: Hydrocarbon-like and oxygenated organic aerosols in Pitts-burgh: insights into sources and processes of organic aerosols,Atmos. Chem. Phys., 5, 3289–3311,doi:10.5194/acp-5-3289-2005, 2005b.
Zhang, Q., Jimenez, J. L., Canagaratna, M. R., Allan, J. D., Coe,H., Ulbrich, I., Alfarra, M. R., Takami, A., Middlebrook, A. M.,Sun, Y. L., Dzepina, K., Dunlea, E., Docherty, K., DeCarlo, P.F., Salcedo, D., Onasch, T., Jayne, J. T., Miyoshi, T., Shimono,A., Hatakeyama, S., Takegawa, N., Kondo, Y., Schneider, J.,Drewnick, F., Weimer, S., Demerjian, K., Williams, P., Bower,
Y. L. Sun et al.: Factor analysis of combined organic and inorganic aerosol mass spectra 8551
K., Bahreini, R., Cottrell, L., Griffin, R. J., Rautiainen, J., Sun, J.Y., Zhang, Y. M., and Worsnop, D. R.: Ubiquity and dominanceof oxygenated species in organic aerosols in anthropogenically-influenced northern hemisphere mid-latitudes, Geophys. Res.Lett., 34, L13801,doi:10.1029/2007GL029979, 2007a.
Zhang, Q., Jimenez, J. L., Worsnop, D. R., and Canagaratna, M.: Acase study of urban particle acidity and its effect on secondaryorganic aerosol, Environ. Sci. Technol., 41, 3213–3219, 2007b.
Zhang, Q., Jimenez, J., Canagaratna, M., Ulbrich, I., Ng, N.,Worsnop, D., and Sun, Y.: Understanding atmospheric or-ganic aerosols via factor analysis of aerosol mass spec-trometry: a review, Anal. Bioanal. Chem., 401, 3045–3067,doi:10.1007/s00216-011-5355-y, 2011.
Zheng, M., Cass, G. R., Schauer, J. J., and Edgerton, E. S.: SourceApportionment of PM2.5 in the Southeastern United States Us-ing Solvent-Extractable Organic Compounds as Tracers, Envi-ron. Sci. Technol., 36, 2361–2371, 2002.