Factor Proportions and the Structure of Trade: HOS-Krugman-DFS Model The Explanation of International Trade: Differences across countries in relative abundance of factors of production. Assumptions: Identical Technologies Identical Demand Patterns The HOS Model:
Transcript
Factor Proportions and the Structure of Trade: HOS-
Krugman-DFS Model
The Explanation of International Trade: Differences across countries inrelative abundance of factors of production.
Structural Bias: The Transformation Curve( = ABC) shifts asymmetrically with unbalanced changes in K and L. A Rise in K, with no change in L, leads to an increase(fall) in X (Y)).
C
YL
XL
YK
XK
a
a
a
a
YL
YK
XL
XK
a
a
a
aor
D
B
YKa
K KYaXa
LYaXa
YKXK
YLXL
E
F
AT POINT F
1) Labor is unemployed: W=0.(2) The X-industry is active The Y-industry is inactive. Therefore:
AT POINT A
1) Capital is unemployed: R=0.(2) Y-industry is active X-industry is inactive. Therefore:
Y
X
a
a
P
P
a
PRW
YPRaWa
XPRaWa
YK
XK
Y
X
XK
X
YYKYL
XXKXL
,0
0
0
AT Point A (continue):
0
,0
0
0
Y
X
a
a
P
P
a
PWR
YPRaWa
XPRaWa
YL
XL
Y
X
YL
Y
YYKYL
XXKXL
At Point B
Y
x
P
P
YK
XK
a
a
YL
XL
a
a
Y
X
Relative Supply
0,0
YX
a
a
P
P
a
a
PRaWa
PRaWa
YL
XL
Y
X
YK
XK
YYKYL
XXKXL
Two Countries: H and F: H is more capital abundant.
H’s Relative Supply is biased towards X:
Y
x
P
P
YK
XK
a
a
YL
XL
a
a
FRS
HRS
FH
FH
YY
XX
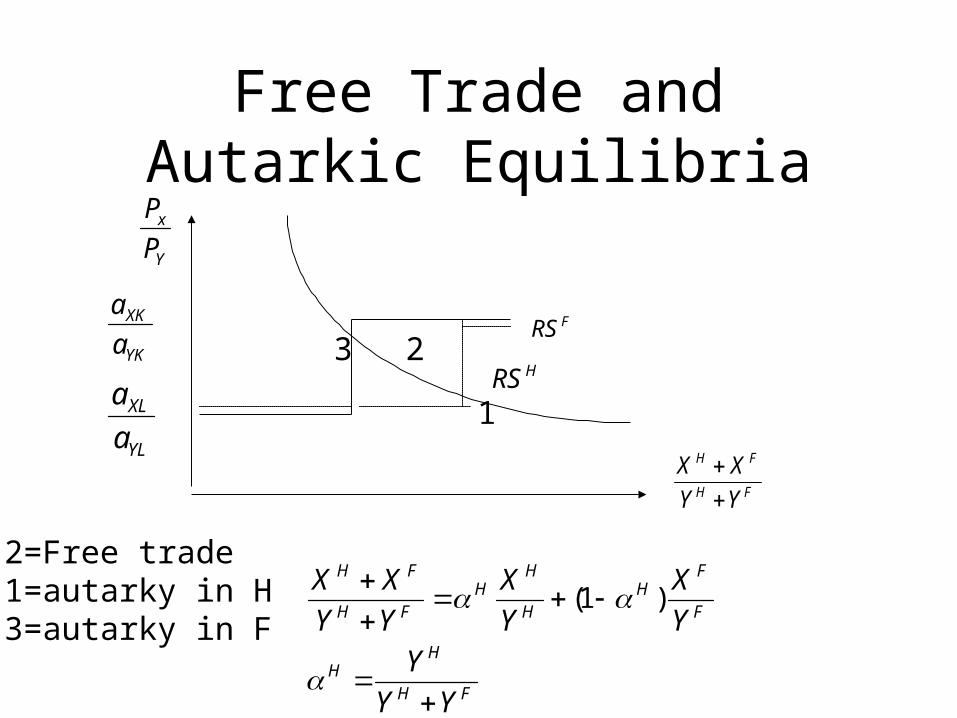
Free Trade and Autarkic Equilibria
Y
x
P
P
YK
XK
a
a
YL
XL
a
a
FRS
HRS
FH
FH
YY
XX
3 2
1
2=Free trade1=autarky in H3=autarky in F
FH
HH
F
FH
H
HH
FH
FH
YY
Y
Y
X
Y
X
YY
XX
)1(
Full Employment Supply of X and Y:
XKYLYKXL
XLXK
XKYLYKXL
YLYK
YKXK
YLXL
aaaa
LaKaY
aaaa
KaLaX
KYaXa
LYaXa
The Heckscher-Ohlin Proposition #1:Any country will export the good
which makes intensive use in its production of relative abundant factor supply.
YYKYL
XXKXL
PRaWa
PRaWa
Full Employment Factor Prices:
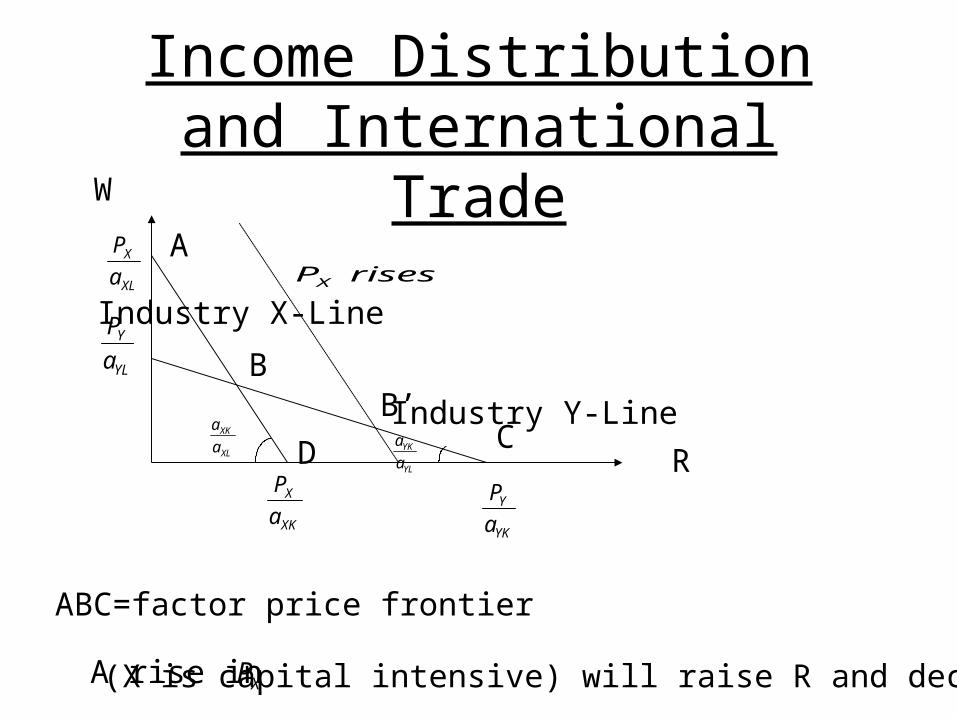
Income Distribution and International Trade
R
W
XK
X
a
P
YK
Y
a
P
XL
X
a
P
XL
XK
a
a
YL
YK
a
a
A
BB’
D C
ABC=factor price frontier
A rise in XP (X is capital intensive) will raise R and decrease W.
risesPX
YL
Y
a
P Industry X-Line
Industry Y-Line
The Heckscher-Ohlin Proposition #2(dual to Proposition #1):
Free trade causes an increase in the factor price of the factor of production which is used intensively in the export industry and a fall in the factor price used intensively in the import competing industry.
Factor Price Equalization: Failures
Two ways to generate a failure of FPE:
• Assume that factor proportions are sufficiently different that they are outside the FPE set.
• Introduce costs to international trade, which could have strong effect on trade volume.
Romalis (AER, March 2004, 94, No.1, 67-97)
• Generalizes a Heckscher-Ohlin model of Dornbusch-Fischer-Samuelson framework, and explains trade structure;
• Assumes a many-country version of the Heckscher-Ohlin model;
• Integrates this with Krugman intra-industry trade;
• Allows for transportation costs.
The Model
There are 2M countries, M each in the North and South.
Southern variables are marked with an asterisk.
There are two factors of production: skilled and unskilled labor.
The proportion of skilled labor is
Northern countries are abundant in skilled labor
*
Preferences
1)(
)(ln)(
1
0
1
0
dzzb
dzzQzbU
Monopolistic Competition
1
1)(
0
*
)),(()),((
),()(
)]()([)(
)(
),(
wsizqizqTC
diizqzQ
znznMzN
zN
izq
SS
zND
S= Production of variety i
Number of of varieties in industry z
Sub-utility function
Fixedcost
DualUnit cost
Number ofcountries
Transportation costs
1 Units of a good must be shipped for 1 unit to arrive in any other country
Equilibrium in an industry
Solve for the share of world production that each country commands, conditional on relative production costs. Countries with lower costs capture larger market shares.
1
1
)('
1
)('
1
)'),(()(
'),(
),(),(
1
1
zIi
zIi
D
diizpzG
diizp
izpizq
Consumer price
IdealPrice index
National income and Spending
wsY )1(
A constant fraction of income b(z) is spent on industry z
World Demand
111
11
)*
(*)()()1()(
])*(*
)()1([1
11
G
pbYM
G
pbYM
G
pbYpq
pMn
pnMnpG
S
North-South relative price
1
1
)1(1,*
*)(
)1(*
1)(
MFp
pp
YYMW
qq
wszp
SS
p
If is low, (1) is the solution;if is high, (2) is the solution
0*,)1(*
*)(*,0
0*,)1(
*)(
np
YYbnn
np
YYbn
p
(1)
(2)
p
General Equilibrium
***(
*1))(1
()()1(
*))(1
()(*
1
1)()()1(1
)()(1
1
0
1
0
1
0
1
0
SS
S
qpnnpqM
npq
dzzM
Wzzb
dzzM
Wzzbs
dzzWzbzw
dzzWzzbs
Special Case
The Dornbusch-Fischer-Samuelson Model is a special case with no transportation costs
Perfect competition1
0
Transport costs
The addition of the transport costs leads a stark structure of production and trade:
Share ofindustry
Skill intensity of industry (z)
Unskilled goods produced in southNon-traded goods Produced In North