Journal of Clinical Medicine Article Factorial Structure and Validity of Depression (PHQ-9) and Anxiety (GAD-7) Scales after Traumatic Brain Injury Ali Teymoori 1,2, *, Anastasia Gorbunova 2 , Fardzadeh E. Haghish 2 , Ruben Real 2 , Marina Zeldovich 2 , Yi-Jhen Wu 2 , Suzanne Polinder 3 , Thomas Asendorf 2,4 , David Menon 5 , CENTER-TBI Investigators and Participants † and Nicole v. Steinbüchel 2 1 the Department of Social Psychology, Helmut Schmidt University, 22043 Hamburg, Germany 2 the Institute of Medical Psychology and Medical Sociology, Georg August University, 37073 Göttingen, Germany; [email protected] (A.G.); [email protected] (F.E.H.); [email protected] (R.R.); [email protected] (M.Z.); [email protected] (Y.-J.W.); [email protected] (T.A.); [email protected] (N.v.S.) 3 Department of Public Health, Erasmus University Medical Center, 3000 Rotterdam, the Netherlands; [email protected]4 Institute of Medical Statistics, Medical Center, Georg August University, 37073 Göttingen, Germany 5 Division of Anaesthesia, University of Cambridge/Addenbrooke’s Hospital, Box 157, Cambridge CB2 0QQ, UK; [email protected]* Correspondence: [email protected]† For the list of CENTER-TBI Investigators and Participants, see the Supplementary Material. Received: 11 February 2020; Accepted: 11 March 2020; Published: 23 March 2020 Abstract: Background: The dimensionality of depression and anxiety instruments have recently been a source of controversy. Objectives and Design: in a European-wide sample of patients after Traumatic Brain Injury (TBI), we aim to examine the factorial structure, validity, and association of the Patient Health Questionnaire for depression (PHQ-9) and the Generalized Anxiety Disorder (GAD-7) instruments. This study is based on longitudinal observational data. We conducted analyses of factorial structure and discriminant validity of outcomes six-months after TBI. We also examined the prevalence, co-occurrence, and changes of scores on the PHQ-9 and GAD-7 at 3-, 6-, and 12-month post-TBI assessments. Participants: At six-months post-TBI assessment, 2137 (738 (34.5%) women) participants completed the PHQ-9 and GAD-7 questionnaires. For the longitudinal analysis, we had 1922 participants (672 (35.0%) women). Results: The results of exploratory factor analysis suggested a general latent construct underlying both PHQ-9 and GAD-7 measures. Confirmatory factor analyses showed a slight improvement in the fit indices for the bifactorial model. The Omega hierarchical test clearly differentiated two subfactors of PHQ-9 and GAD-7 items over and above the underlying general factor; however, most of the variance (85.0%) was explained by the general factor and the explained variance of the subfactors was small. The PHQ-9 and GAD-7 performed similarly in detecting post-traumatic stress disorder (PTSD). As defined by conventional cut-offs, depression and anxiety have different prevalence rates in the sample. The scales also differed in their relationships with the short form of health survey (SF-36v2) subscales. The longitudinal analysis showed high stability of depression and anxiety symptoms: 49–67% of the post-TBI patients with comorbid depression and anxiety reported the persistence of the symptoms over time. Discussion: The factorial structure analysis favors a general latent construct underlying both depression and anxiety scales among patients after TBI. We discuss the implications our findings and future research directions. Keywords: depression; anxiety; bifactorial model; validity; comorbidity J. Clin. Med. 2020, 9, 873; doi:10.3390/jcm9030873 www.mdpi.com/journal/jcm
Transcript
Journal of
Clinical Medicine
Article
Factorial Structure and Validity of Depression(PHQ-9) and Anxiety (GAD-7) Scales after TraumaticBrain Injury
Ali Teymoori 1,2,*, Anastasia Gorbunova 2, Fardzadeh E. Haghish 2, Ruben Real 2,Marina Zeldovich 2, Yi-Jhen Wu 2, Suzanne Polinder 3, Thomas Asendorf 2,4, David Menon 5 ,CENTER-TBI Investigators and Participants † and Nicole v. Steinbüchel 2
1 the Department of Social Psychology, Helmut Schmidt University, 22043 Hamburg, Germany2 the Institute of Medical Psychology and Medical Sociology, Georg August University,
3 Department of Public Health, Erasmus University Medical Center, 3000 Rotterdam, the Netherlands;[email protected]
4 Institute of Medical Statistics, Medical Center, Georg August University, 37073 Göttingen, Germany5 Division of Anaesthesia, University of Cambridge/Addenbrooke’s Hospital, Box 157,
Cambridge CB2 0QQ, UK; [email protected]* Correspondence: [email protected]† For the list of CENTER-TBI Investigators and Participants, see the Supplementary Material.
Received: 11 February 2020; Accepted: 11 March 2020; Published: 23 March 2020�����������������
Abstract: Background: The dimensionality of depression and anxiety instruments have recentlybeen a source of controversy. Objectives and Design: in a European-wide sample of patients afterTraumatic Brain Injury (TBI), we aim to examine the factorial structure, validity, and associationof the Patient Health Questionnaire for depression (PHQ-9) and the Generalized Anxiety Disorder(GAD-7) instruments. This study is based on longitudinal observational data. We conducted analysesof factorial structure and discriminant validity of outcomes six-months after TBI. We also examinedthe prevalence, co-occurrence, and changes of scores on the PHQ-9 and GAD-7 at 3-, 6-, and 12-monthpost-TBI assessments. Participants: At six-months post-TBI assessment, 2137 (738 (34.5%) women)participants completed the PHQ-9 and GAD-7 questionnaires. For the longitudinal analysis, we had1922 participants (672 (35.0%) women). Results: The results of exploratory factor analysis suggesteda general latent construct underlying both PHQ-9 and GAD-7 measures. Confirmatory factor analysesshowed a slight improvement in the fit indices for the bifactorial model. The Omega hierarchicaltest clearly differentiated two subfactors of PHQ-9 and GAD-7 items over and above the underlyinggeneral factor; however, most of the variance (85.0%) was explained by the general factor andthe explained variance of the subfactors was small. The PHQ-9 and GAD-7 performed similarlyin detecting post-traumatic stress disorder (PTSD). As defined by conventional cut-offs, depressionand anxiety have different prevalence rates in the sample. The scales also differed in their relationshipswith the short form of health survey (SF-36v2) subscales. The longitudinal analysis showed highstability of depression and anxiety symptoms: 49–67% of the post-TBI patients with comorbiddepression and anxiety reported the persistence of the symptoms over time. Discussion: The factorialstructure analysis favors a general latent construct underlying both depression and anxiety scalesamong patients after TBI. We discuss the implications our findings and future research directions.
Depression and anxiety are among the most commonly experienced mental health disordersin both the general population and different medical conditions [1,2]. However, depression and anxietyare often under-recognized in medical settings [3], and this can complicate the patients’ recovery [4].
Among individuals with a history of Traumatic Brain Injury (TBI), depression and anxietyare the most common mental health problems [5,6]. TBI is characterized by alterations of brainfunction, including loss of consciousness, impaired memory, neurological deficit (e.g., loss of balance),and alteration of mental state at the time of injury [7]. TBI severity varies from mild to moderate andsevere, and over 90% of the TBI cases are mild TBIs [7]. The prevalence of TBI is high, with 50 millionannual worldwide occurrences: Nearly half of the world’s population will suffer from some form ofTBI at least once over their lifetime [7].
When remaining untreated, depression and anxiety not only impede the patient’s recovery fromTBI, but also leave a lasting impairment in their post-TBI life, such as poorer social functioning andmore post-concussion symptoms [8–10]. The prevalence rate of depression among patients after TBI isestimated to be between 15% and 27% [8,11] and for anxiety between 23% and 29% [5,10,12].
There is a growing body of literature reporting the coexistence and comorbidity of depressionand anxiety [13–15]. The comorbidity of depression and anxiety has also been found in TBI [9].As a result, there is a growing call to investigate depression and anxiety together and further examinetheir relationship and comorbidity not only cross-sectionally but also over time [5].
Furthermore, conceptually, depression and anxiety are distinct constructs, although they are partof the same category of mood disorders. For instance, anxiety was predominantly conceptualized asan unpleasant feeling and worrying reaction to a perceived future threat and depression as a diminishedactivity and loss of pleasure and interest [16].
Empirically, the factorial structure analysis of depression and anxiety has resulted in contradictoryevidence not only in the composite scale of depression and anxiety (such as Depression Anxiety StressScales—21 (DASS-21): [17]; Mood and Anxiety Symptom Questionnaire (MASQ): [18]; Hospital Anxietyand Depression Scale (HADS): [19]), but also in the scales that aim to measure the two constructsof depression and anxiety separately. In the composite measurement of depression and anxiety,using HADS for instance, previous research proposed various hierarchical structure of this scaleincluding a one-factorial [20], two-factorial [21,22], three-factorial [23], and a bifactorial model [24,25].With the use of a bifactorial model, which depicts a general psychological distress factor encompassingall items and two orthogonal grouping subfactors of depression and anxiety, most variance wasexplained by the general factor and the subfactors’ contribution was negligible [24,25]. Consequently,a systematic review of studies on the latent structure of HADS cast doubt on the ability of this measureto reliably differentiate depression and anxiety and proposed a general latent construct of psychologicaldistress underlying the HADS measure [26].
Regarding the measurements that aim to screen patients with symptoms of depression and anxietyseparately, the widely used instruments are the nine-item Patient Health Questionnaire (PHQ-9; [27,28])and the seven-item scale for Generalised Anxiety Disorder (GAD-7; [29]). Both PHQ-9 and GAD-7items are based on the DSM-IV criteria for depression and anxiety [27,29] and proved to be validin a variety of different medical settings [see 10] including for patients after TBI, e.g., [5,30].
Dimensionality has not been thoroughly scrutinized on a composite measure of PHQ-9 and GAD-7.In most studies, they were considered to be independent and unidimensional instruments (for a review,see [10]), with few studies showing an extra somatic subdimension besides the cognitive affectivesubdimension in both PHQ-9 and GAD-7 (e.g., [31]). Recently, Kroenke et al. [32] combined the PHQ-9and GAD-7 items and with the use of bifactorial modeling proposed a composite measure of depressionand anxiety called the Patient Health Questionnaire Anxiety and Depression Scale (PHQ-ADS).According to the bifactorial modelling terminology, PHQ-ADS is the general factor and the two PHQ-9and GAD-7 scales are the subfactors. Despite the negligible contribution from the subfactors tothe explanation of scale variance, Kroenke et al. [32] stated that PHQ-ADS does not override the value
J. Clin. Med. 2020, 9, 873 3 of 21
of individual PHQ-9 and GAD-7 subfactors. However, they did not provide the evidence showingthe independent effect of PHQ-9 and GAD-7 over and above PHQ-ADS. In this study, we examinethe factorial structure of a composite measure PHQ-ADS in TBI and evaluate the subfactors PHQ-9and GAD-7′s discriminant, construct, and predictive validity. We also look at the cross-sectional andlongitudinal comorbidity of depression and anxiety.
In sum, the aims of the present study are (1) to investigate the relation between scores ofPHQ-9 and GAD-7 instruments, (2) the factorial structure of the composite measure of PHQ-ADS,and (3) the discriminant, construct, and predictive validity of the subfactors of PHQ-9 and GAD-7.We examine the study objectives in a European sample of patients after TBI.
2. Methods
2.1. Participants
This study uses data from the Collaborative European NeuroTrauma Effectiveness Research in TBI(CENTER-TBI (Core 2.0)) project [33]. CENTER-TBI is a longitudinal observational study involving59 different medical and research centers in 18 countries. The CENTER-TBI study included 4509 patientswith a clinical diagnosis of TBI [34]. The inclusion criteria included being recruited within 24 h after TBI,clinical indication for a CT-scan, lack of severe neurological disorders before the injury, and informedconsent [33]. We selected those who were 16 years of age or above (n = 4360) and survived the 6-monthspost TBI (n = 3886). For the factorial structure analysis, we used the 6-month post-TBI data, in which2137 participants (738 (34.5%) women, 1399 (65.5%) men) completed the psychological outcomemeasures of PHQ-9 and GAD-7. These participants were recruited from three strata including patientsprimarily admitted to the intensive care unit (ICU, 885 (41.4%) at the time of enrollment), patientsadmitted to hospital ward (admission stratum, 805 (37.7%)), and patients evaluated in the emergencyroom and discharged (ER, 447 (20.9%)). The cause of injury was mainly due to road accidents (40.71%of incidence) and incidental fall (43.61%) and few patients reported their injury to be due to othercauses such as assault (3.93%) and suicide attempt (0.89%).
For the predictive validity and sequential comorbidity of depression and anxiety, we analyzed1922 patients that had at least two out of the three time-point assessments (3, 6, and 12 months post-TBI:672 (35.0%) women, 1250 (65.0%) men), from which 794 (41.3%) patients were recruited from the ICU,761 (39.6%) from the admission stratum, and 376 (19.1%) from the ER.
2.2. Ethical Approval
The CENTER-TBI study has been conducted in conformance with all relevant local national ethicalguideline and regulatory requirements for recruiting human subjects, as well as with relevant dataprotection, privacy regulations, and informed consent. The study obtained ethical clearance from boththe EU and the relevant institutions across all countries that were involved in the project. Informedconsent was also obtained from all participants according to national and local procedures (for a list of sites,ethical committees, and ethical approval details, see https://www.center-tbi.eu/project/ethical-approval).
2.3. Instruments
Demographic information was collected at the time of enrollment into the study and includedparticipants’ sex, age, and educational background.
The Glasgow Coma Scale (GCS) assesses coma and impaired consciousness after TBI with scoresthat were obtained at several time points within 24 h post-injury such as pre-hospital, first arrival athospital, and post-stabilization [35]. Following the IMPACT methodology [36], GCS scores were basedon the post-stabilization period, and when the score was not available at the post-stabilization stage,the previous non-missing scores were used. The GCS categorizes injury into severe (3–8), moderate(9–12), and mild (13–15).
The Glasgow Outcome Scale, Extended (GOSE) was assessed at 6-months post-TBI to assessfunctional disability and recovery after TBI [37]. The GOSE classifies functional outcomes into eightcategories: Dead (1), vegetative state (2), lower severe disability (3), upper severe disability (4), lowermoderate disability (5), upper moderate disability (6), lower good recovery (7), and upper goodrecovery (8). In our study, we had patients with a GOSE score of 3 or above.
The PHQ-9 assesses the frequency and severity of symptoms of depression using nine 4-pointLikert-scaled items ranging from 0 (not at all) to 3 (nearly every day) [27] (Kroenke & Spitzer, 2002).A total score ranging from 0 to 27 is obtained by summing across all items, with ordinary meansubstitution for missing items if no more than one third (no more than three items) are missing. The totalscore can be categorized at a cutoff of 10 to differentiate between minimal/mild versus moderate/severedepression [15,38]. However, a systematic review indicated that a cutoff of 8 might increase sensitivityto depression [39]. We used both cut-off points.
The GAD-7 measures the frequency and severity of generalized anxiety disorder symptoms [29],using seven 4-point Likert-scale items with a response format ranging from 0 (not at all) to 3 (nearly everyday). A total score ranging from 0 to 21 was obtained by summing all items with ordinary meansubstitution for missing items if less than one third (less than two items) were missing. The totalscore can be categorized at a cutoff of 10 [15] or 8 to optimize the test’s sensitivity and specificity foridentifying other anxiety disorders [40].
The PHQ-ADS combines the PHQ-9 and GAD-7 scales as composite measure of mental distress [32].The Short-Form-36v2 (SF-36v2; [41]) is a generic measure of physical and mental outcomes with
eight dimensions: Physical Functioning (PF, 10 items), Role Limitation due to Physical Health (RP,4 items), Role Limitation due to Emotional Health (RE, 3 items), Social Functioning (SF, 2 items), BodyPain (BP, 2 items), Vitality (VT, 4 items), Mental Health (MH, 5 items), General Health (GH, 5 items).SF-36 is commonly used to measure TBI people’s health-related quality of life [42]. Higher scoresindicate better health-related quality of life.
The PTSD Checklist for DSM-5 (PCL-5; [43]) is a self-report instrument to assess symptomsof post-traumatic stress disorder (PTSD) across four symptoms clusters defined in the DSM-5(reexperiencing, avoidance, negative alterations in cognition and mood, and hyperarousal). Intensityis assessed using 20 five-point Likert scaled items ranging from 0 (not at all) to 4 (extremely). A totalsum score exceeding a cutoff of 33 indicates a likely PTSD [43,44].
We used the translated versions of the PHQ-9 and GAD-7 questionnaires that were availablein the relevant languages (see https://www.phqscreeners.com/select-screener/36) and were shown tobe valid and invariant across different sex, patient strata, and languages [45]. Following a procedurerecommended by Acquadro, Conway, Giroudet, and Mear [46], GOSE and PCL-5 were translated,back-translated, panel-reviewed, and finally underwent a cognitive debriefing with several patientsand healthy participants. The final versions were revised based on the cognitive debriefing results toensure the conceptual and linguistic equivalence of the scales with the original English language.
2.4. Statistical Analysis
We examined three different aspects of the PHQ-9 and GAD-7 tests: (a) Reliability, (b) factorialvalidity using exploratory and Confirmatory Factor Analyses (CFA) and Omega hierarchical test,and (c) discriminant, construct, and predictive validity.
Reliability: Reliability was first analyzed using Cronbach’s alpha and Lambda 2 of Guttmann’scoefficient (λ2) separately for PHQ-9 and GAD-7 as well as for the composite measure of depressionand anxiety (PHQ-ADS). The item level descriptive statistics of the PHQ-ADS showed manyskewed-distributed items (Appendix A), creating a floor effect and violating the normality assumption.Moreover, using the original response format, the initial CFA analysis shows dissatisfactory modelfit indices even with the use of ordinal estimator, the Weighted Least Square Mean and Varianceadjusted (WLSMV). Consequently, to examine the factorial structure, we dichotomized the items
(see the note in Appendix A), with two values: 0 (no depression/no anxiety) and 1 (some degree ofdepression/anxiety, collapsing the original scores from 1 to 3 into 1).
Factorial validity: Principal Axis Factoring (PAF) was used to determine the number offactors for PHQ-ADS in a parallel analysis of the scree plots with the Kaiser–Guttman criterion.To confirm the factorial structure of PHQ-ADS items, we used CFA with WLSMV estimator andtheta parameterization for ordinal variables. We compared models with a one-, two-, and bifactorialstructure. Finally, to examine the factorial structure reliability, we used McDonald’s Omega Hierarchicaltest (OmegaH).
The OmegaH test evaluates the bifactorial structure of the scale, examining how the factorialstructure of the PHQ-ADS can be accounted for by: (a) a single general factor (g), representingthe shared explained variance of all items, and (b) a set of group factors in which additional varianceover and above the general factor can be explained by a subset of similar items [47,48]. As a result,the OmegaH test examines the extent to which the test reflects a common trait and is a good testfor dimensionality of the latent construct. We used several different parameters from Omega testincluding Omega general for the general factor and subfactors, OmegaH, Explained Common Variance(ECV), and Percentage of Uncontaminated Correlation (PUC) [49,50]. Omega general assesses the unitweighted variance of the general factor and the subfactors, whereas OmegaH estimates the proportionof variance that can be attributed to the general factor, treating the variance due to the subfactors asmeasurement error [48]. The ECV provides an assessment of the relative strength of the subfactors,examining the variance explained by general factor divided by variance explained by both generalfactor and subfactors [48]. In conjunction with ECV, PUC evaluates the percentage of unique correlationestimating the general factor, providing additional information whether there is a bias in consideringthe scale as unidimensional. Higher PUC values indicate lower variability in ECV coefficient. Sufficientevidence of unidimensionality in the Omega hierarchical test of the bifactorial model depends ofthe ECV coefficient (≥0.70), PUC (≥0.70), and OmegaH coefficient (≥0.70) [48].
We used the omega function with oblique rotation method, tetrachoric correlation matrix giventhe ordinal nature of the rescaled responses, and the Schmid–Leiman transformation for a bifactorialmodel [51]. Following suggestions from Rodrigues et al., [50] and Bonifay et al., [49], we conductedvarious validity tests to further examine whether the subfactors of PHQ-9 and GAD-7 have distinctexplanatory contribution.
Discriminant validity: For discriminant validity, we compared the performance of PHQ-9 andGAD-7 in detecting an anxiety related disorder, PTSD. We hypothesized that GAD-7 would havea better odds ratio in classifying patients with PTSD correctly than would PHQ-9 [29,40]. For thispurpose, we applied logistic regression and cross tabulation for an odds ratio of correct classification.
Construct and predictive validity: For construct validity, we examined the relationship of PHQ-9and GAD-7 with the SF-36v2. Using the longitudinal data, we examined whether anxiety precedesdepression, as assumed in previous literature (e.g., [52]). For this purpose, we analyzed the 3-, 6-,and 12-month data. To do so, we divided the participants into two groups based on their GAD-7 scoreat 3 or 6 months. Then we applied the McNemar’s test for the intra-individual changes of depressionsymptom over time in each of the low and high anxiety group [53].
Sequential comorbidity. Finally, we examined the sequential comorbidity of depression andanxiety using the McNemar–Bowker with a pairwise post-hoc analysis, which is an extension ofMcNemar test for more than two groups. With the McNemar–Bowker test, we examined whetherthe contingency table is symmetric such that the probability of cell (i, j) is equal to the probabilityof change in the cell (j, i), and a significant result would indicate a change from i to j. We relied onCohen’s [54] criteria to assess the odds ratio (OR: Small effect <1.86, medium for 1.86–3.00, and largefor ≥3.00) and Cohen’s g (small effect size for <0.15, medium for 0.15–0.25, large for ≥0.25).
All analyses were conducted using R version 3.5.3, and the packages “lavaan” [55], and “psych” [51].We exported the data from the Neurobot platform of the CENTER-TBI (https://center-tbi.incf.org/) andused the “CENTER Core 2.0” dataset.
The basic demographic information and medical characterization of the study participants(at six-months post-TBI assessment) for the overall sample, as well as for each sex separately, canbe seen in Table 1. The participants had a wide age range (M = 49.19, SD = 19.30, Mdn = 51,range = 16–95), relatively high education background (1585 (83.1%) completed high school educationor more), and diverse linguistic backgrounds (see Table 1). The GOSE score showed that more than halfof the participants (62.8%) had good recovery, a quarter had moderate disability (25.7%), and 10.3%had severe disability at six months after TBI.
Table 1. Descriptive characteristics of the sample.
Variable Overall Stratified
n 2137 Female (738) Male (1399)
Countries (n, (%))The Netherlands 498 (23.3) 199 (40) 299 (60)
ER = Emergency Room; Admission = patients admitted to hospital wards; ICU = Intensive Care Unit,GOSE = the Glasgow Outcome Scale, Extended; Severe dis. = patients with severe disability; Moderate dis. = patientswith moderate disability.
J. Clin. Med. 2020, 9, 873 7 of 21
3.2. Descriptive of Variables and Their Reliability
Table 2 shows the descriptive statistics, reliability coefficients, and the intercorrelation of the studyvariables. The mean scores for depression (PHQ-9, M = 5.07, SD = 5.35, range = 0–27) and anxietysymptoms (GAD-7, M = 3.63, SD = 4.54, range = 0–21) were low. Cronbach’s alpha and Guttman’slambda 2 of PHQ-9, GAD-7, and PHQ-ADS showed very good internal consistency. The correlationbetween PHQ-9 and GAD-7 was high (r = 0.80).
Table 2. The descriptive statistics, reliability coefficients, and the correlation between variables.
PHQ-ADS: The Patient Health Questionnaire Anxiety and Depression Scale. M = mean, SD = standard deviation.Q1 = first quartile, 25%; Q2 = second quartile or median, 50%; Q3 = third quartile, 75%. PF = Physical Functioning;RP = Role Limitation due to Physical Health; RE = Role Limitation due to Emotional Health; SF = Social Functioning;BP = Body Pain; VT = Vitality; MH = Mental Health; GH = General Health. Notes: α: Cronbach’s alpha coefficient;λ2: Lambda 2 of Guttman coefficient; all correlation coefficients were significant at p < 0.001.
3.3. Factorial Structure of PHQ-ADS
As explained in statistical analysis section (also see the descriptive statistics in Table 2 andAppendix A), we dichotomized responses to 0 (no depression/anxiety) and 1 (some depression/anxiety).In the parallel analysis (see Appendix B), only one factor seemed to fit the data based on the eigenvalueof more than one (eigen values: 1st factor = 9.81, 2nd = 0.47, 3rd = 0.32), a sharp break in the scree plotbetween the first and the second factor, and the explained variance (explained variance = 0.61).
We compared model fit indices of one-, two-, and bifactorial models estimated within CFAframework. As can be seen in Table 3, all fit indices had a slight improvement in the bifactorial model.The chi-square was significant for all models, as is the case with the large sample size; however, the ratioof χ2-to-df in the two-factorial and bifactorial models was below 3, a threshold that Kline [56] putfor a good fitting model. In the two-factorial model, the correlation between PHQ-9 and GAD-7 washigh (r = 0.91, p < 0.001), implying that one dimension might be able to measure both factors [57].The bifactorial model seems to be the best fitting model based on the slightly better fit indices.
Table 3. Summary of the Confirmatory Factor Analyses (CFA) for single, two, and bifactorial models ofdepression and anxiety.
Bifactorial M. 189.76 (88) 2.15 <0.001 0.024 0.019–0.028 0.032 0.999 0.998 0.998 0.999a RMSEA = root mean squared error of approximation; b RMSEA (95% CI) = 95% confidence interval of root meansquared error of approximation; c SRMR = standardized root mean square residual; d CFI = comparative fit index;e TLI = Tucker–Lewis index; f NFI = the Normed Fit Index, g IFI = incremental fit index. Notes: Traditionally,the standard cut-offs for RMSEA (<0.06) and CFI, TLI, NFI, and IFI (>0.95) indices were used to indicate acceptablemodel fit [58]. However, these cut-offs are not validated for WLSMV estimator and therefore we did not interpretthem directly but used them for model comparisons.
J. Clin. Med. 2020, 9, 873 8 of 21
3.4. Factorial Structure Reliability
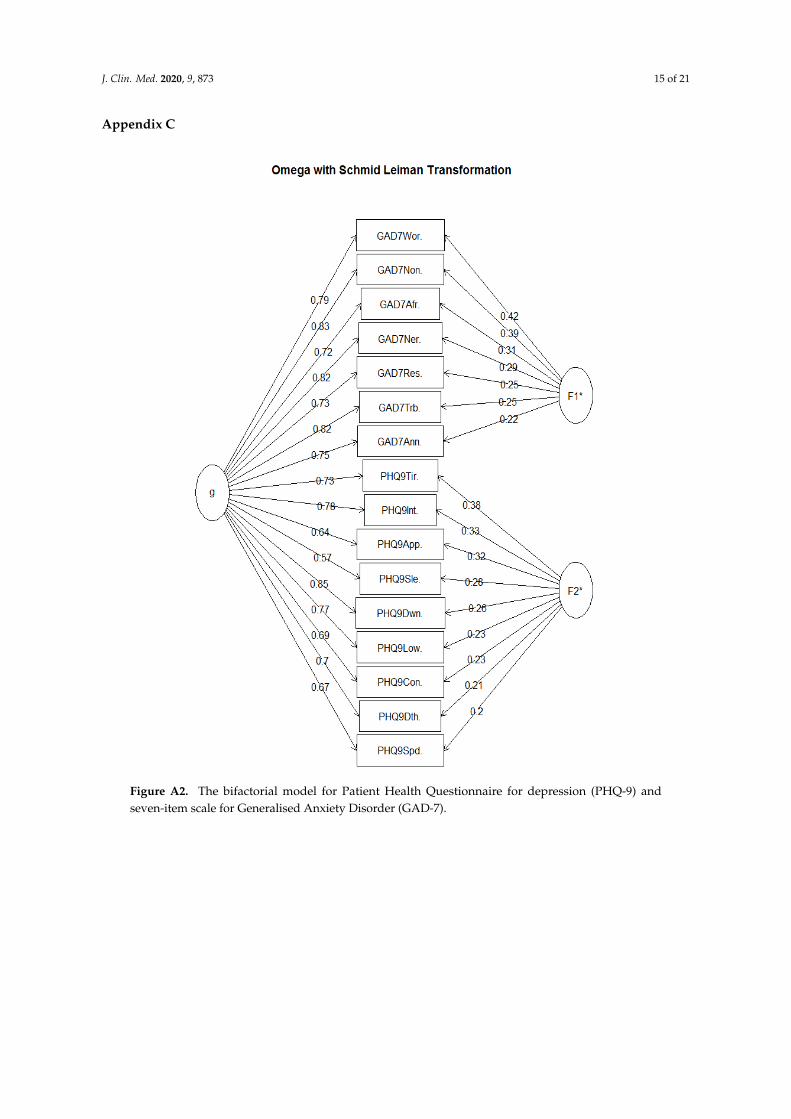
The Omega coefficients for the general factor (ω = 0.97) and the subscales of depression (ω = 0.92)and anxiety (ω = 0.94) were excellent. The OmegaH coefficient for a bifactorial model of PHQ-ADSwas 0.87, meaning that 87% of the variance of unit-weighted total scores can be attributed to individualdifferences in the general factor (see Appendix C). As a result, most of the reliable variances can beexplained by the general factor and only 10% (ω (0.97)−ωh (0.87)) of the variance in individuals scorescaused by distinct subfactors of PHQ-9 and GAD-7. The ECV coefficient was 0.85, indicating thatthe 85% of the common variance was captured by the general factor and the remaining 15% is spreadacross subfactors. The general factor explains most of the variance using OmegaH and ECV coefficientsand the subfactors contribution is low in accounting for the individuals’ difference in depression andanxiety. The PUC coefficient was rather low (PUC = 0.53), implying that perhaps there would be a biasin considering the test as unidimensional based on the result of ECV.
The percent of common variance due to the general factor was also calculated for each item(Item Explained Common Variance: I-ECV) and higher scores in I-ECV (≥0.85) indicates the contributionto the general factor and little contribution to the subfactors which was the case for majority of the itemsin this study (Appendix D).
Overall, the omega hierarchical test suggests that GAD-7 and PHQ-9 fit a unidimensional constructbetter than the bifactorial model. Further validity tests can examine whether, based on the result ofPUC coefficient, there is a bias in considering the test unidimensional.
3.5. Discriminant Validity
We first categorized the patients based on the cut-off point of 33 in PCL5 into two categories with0 (no/low PTSD) and 1 (moderate/severe PTSD) values. Logistic regression showed that both PHQ-9(B = 0.20, z = 8.54, p < 0.001, OR = 1.22 (95% CI: 1.16–1.27)) and GAD-7 (B = 0.20, z = 7.85, p < 0.001,OR = 1.22 (95% CI: 1.16–1.28)) significantly associated with PCL-5. We also categorized the PHQ-9and GAD-7 to test which scale would better detect participants with moderate or severe PTSD cases.With the strict cut-off point of 10 for PHQ-9 and GAD-7, the odd ratios (OR) of correctly classifyingthe PTSD cases were 28.73 (95% CI: 19.85–41.59) and 28.11 (95% CI: 19.80–39.90), respectively. Withthe lenient cut-off point of 8 for PHQ-9 and GAD-7, the OR of correct classification of PTSD cases were30.8 (95% CI: 19.92–47.62) and 29.83 (95% CI: 20.80–42.79), respectively.
We categorized the PHQ-ADS into two low and moderate/severe groups based on the cut-off
point of 20 [32] and obtained a higher OR of correct classification of PTSD cases (OR = 41.56, 95%CI: 28.76–60.06).
3.6. Prevalence, Comorbidity, and Construct Validity
With the use of a stricter cut-off point of 10, the proportion of moderate to severe depressionand anxiety symptoms in our study were 18% and 11%, respectively. With the cut-off point of8, the prevalence of moderate and moderately severe depression and anxiety were 25% and 16%respectively. Using the cut-off point of 8, the majority of participants had neither depression noranxiety (1526 participants, 72%), and among the rest, 288 (14%) participants had comorbid depressionand anxiety, 245 (12%) had only depression, and 53 (3%) had only anxiety. A total of 54% (288 out of535) of the moderately/severely depressed patients had comorbid anxiety, and 86% (288 out of 341) ofmoderately/severely anxious patients, had comorbid depression.
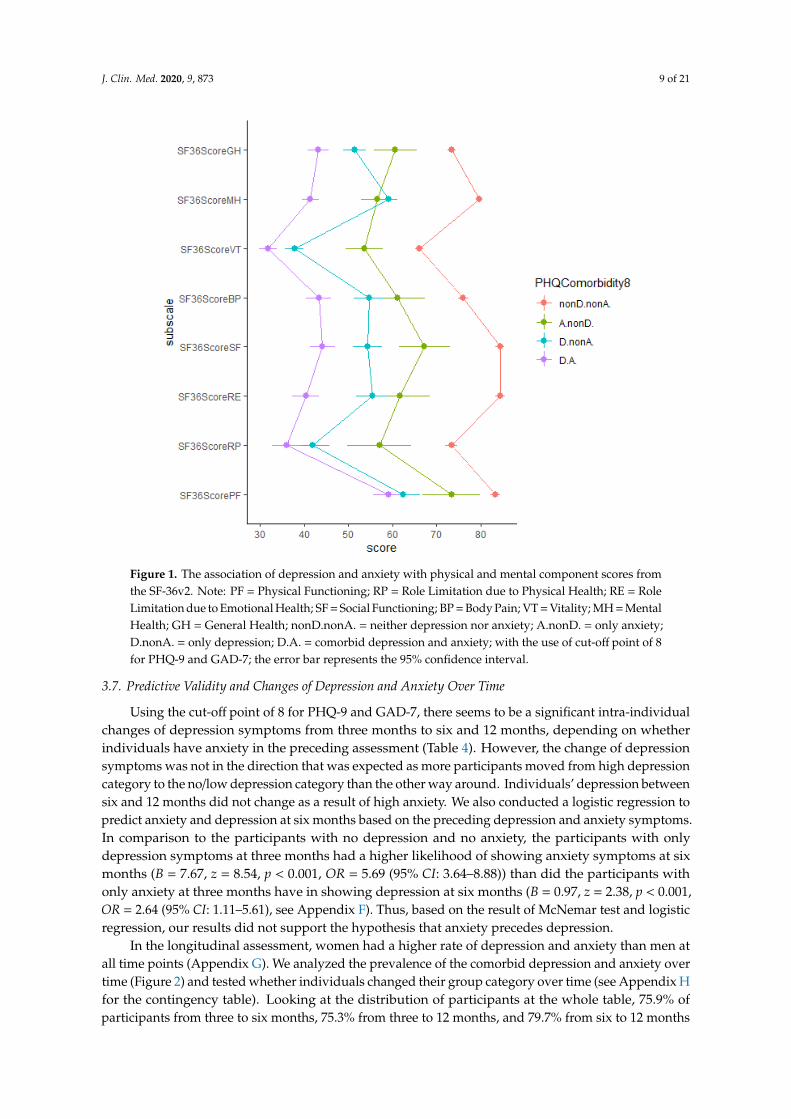
We examined the association of the PHQ-9 and GAD-7 with the SF-36. The correlation of PHQ-9and GAD-7 with SF-36 dimensions was significant (Table 2). PHQ-9 had a stronger relationship withSF-36 dimensions than did GAD-7. Individuals with comorbid depression and anxiety had the lowestscores on various dimensions of the physical and psychological outcomes and individuals with neitherdepression nor anxiety had the highest physical and psychological outcomes score on all dimensions(Figure 1, for the same analysis with the cut-off point 10 for PHQ-9 and GAD-7 see Appendix E).
J. Clin. Med. 2020, 9, 873 9 of 21
J. Clin. Med. 2020, 9, x FOR PEER REVIEW 9 of 20
We examined the association of the PHQ-9 and GAD-7 with the SF-36. The correlation of PHQ-9 and GAD-7 with SF-36 dimensions was significant (Table 2). PHQ-9 had a stronger relationship with SF-36 dimensions than did GAD-7. Individuals with comorbid depression and anxiety had the lowest scores on various dimensions of the physical and psychological outcomes and individuals with neither depression nor anxiety had the highest physical and psychological outcomes score on all dimensions (Figure 1, for the same analysis with the cut-off point 10 for PHQ-9 and GAD-7 see Appendix E).
Figure 1. The association of depression and anxiety with physical and mental component scores from the SF-36v2. Note: PF = Physical Functioning; RP = Role Limitation due to Physical Health; RE = Role Limitation due to Emotional Health; SF = Social Functioning; BP = Body Pain; VT = Vitality; MH = Mental Health; GH = General Health; nonD.nonA. = neither depression nor anxiety; A.nonD. = only anxiety; D.nonA. = only depression; D.A. = comorbid depression and anxiety; with the use of cut-off point of 8 for PHQ-9 and GAD-7; the error bar represents the 95% confidence interval.
3.7. Predictive Validity and Changes of Depression and Anxiety Over Time
Using the cut-off point of 8 for PHQ-9 and GAD-7, there seems to be a significant intra-individ-ual changes of depression symptoms from three months to six and 12 months, depending on whether individuals have anxiety in the preceding assessment (Table 4). However, the change of depression symptoms was not in the direction that was expected as more participants moved from high depres-sion category to the no/low depression category than the other way around. Individuals’ depression between six and 12 months did not change as a result of high anxiety. We also conducted a logistic regression to predict anxiety and depression at six months based on the preceding depression and anxiety symptoms. In comparison to the participants with no depression and no anxiety, the partici-pants with only depression symptoms at three months had a higher likelihood of showing anxiety symptoms at six months (B = 7.67, z = 8.54, p < 0.001, OR = 5.69 (95% CI: 3.64–8.88)) than did the participants with only anxiety at three months have in showing depression at six months (B = 0.97, z
Figure 1. The association of depression and anxiety with physical and mental component scores fromthe SF-36v2. Note: PF = Physical Functioning; RP = Role Limitation due to Physical Health; RE = RoleLimitation due to Emotional Health; SF = Social Functioning; BP = Body Pain; VT = Vitality; MH = MentalHealth; GH = General Health; nonD.nonA. = neither depression nor anxiety; A.nonD. = only anxiety;D.nonA. = only depression; D.A. = comorbid depression and anxiety; with the use of cut-off point of 8for PHQ-9 and GAD-7; the error bar represents the 95% confidence interval.
3.7. Predictive Validity and Changes of Depression and Anxiety Over Time
Using the cut-off point of 8 for PHQ-9 and GAD-7, there seems to be a significant intra-individualchanges of depression symptoms from three months to six and 12 months, depending on whetherindividuals have anxiety in the preceding assessment (Table 4). However, the change of depressionsymptoms was not in the direction that was expected as more participants moved from high depressioncategory to the no/low depression category than the other way around. Individuals’ depression betweensix and 12 months did not change as a result of high anxiety. We also conducted a logistic regression topredict anxiety and depression at six months based on the preceding depression and anxiety symptoms.In comparison to the participants with no depression and no anxiety, the participants with onlydepression symptoms at three months had a higher likelihood of showing anxiety symptoms at sixmonths (B = 7.67, z = 8.54, p < 0.001, OR = 5.69 (95% CI: 3.64–8.88)) than did the participants withonly anxiety at three months have in showing depression at six months (B = 0.97, z = 2.38, p < 0.001,OR = 2.64 (95% CI: 1.11–5.61), see Appendix F). Thus, based on the result of McNemar test and logisticregression, our results did not support the hypothesis that anxiety precedes depression.
In the longitudinal assessment, women had a higher rate of depression and anxiety than men atall time points (Appendix G). We analyzed the prevalence of the comorbid depression and anxiety overtime (Figure 2) and tested whether individuals changed their group category over time (see Appendix Hfor the contingency table). Looking at the distribution of participants at the whole table, 75.9% ofparticipants from three to six months, 75.3% from three to 12 months, and 79.7% from six to 12 months
J. Clin. Med. 2020, 9, 873 10 of 21
stayed in the same depression and anxiety category. The preceding symptoms had an impact on laterrate of depression and anxiety. Between 88.4% and 90.0% of those with no depression and anxietyat three-month assessment had no depression and anxiety at six and 12 months post-TBI injury andbetween 49.6% and 66.9% of comorbid depression and anxiety still had comorbid depression andanxiety up to 12 months post-TBI (Appendix H). The McNemar–Bowker Test showed a negligiblechange in the probability of off-diagonal change in the contingency table from three to six months(OR = 1.43, p = 0.558, Cohen’s g = 0.089), from three to 12 months (OR = 1.30, p = 0.565, Cohen’s g = 0.065),and from six to 12 months (OR = 1.30, p = 0.566, Cohen’s g = 0.066). Thus, there were no significantdifferences in probability of change from depression to anxiety, and vice versa (see Appendix H forcontingency Table A4).
J. Clin. Med. 2020, 9, x FOR PEER REVIEW 10 of 20
= 2.38, p < 0.001, OR = 2.64 (95% CI: 1.11–5.61), see Appendix F). Thus, based on the result of McNemar test and logistic regression, our results did not support the hypothesis that anxiety precedes depres-sion.
In the longitudinal assessment, women had a higher rate of depression and anxiety than men at all time points (Appendix G). We analyzed the prevalence of the comorbid depression and anxiety over time (Figure 2) and tested whether individuals changed their group category over time (see Appendix H for the contingency table). Looking at the distribution of participants at the whole table, 75.9% of participants from three to six months, 75.3% from three to 12 months, and 79.7% from six to 12 months stayed in the same depression and anxiety category. The preceding symptoms had an impact on later rate of depression and anxiety. Between 88.4% and 90.0% of those with no depression and anxiety at three-month assessment had no depression and anxiety at six and 12 months post-TBI injury and between 49.6% and 66.9% of comorbid depression and anxiety still had comorbid depres-sion and anxiety up to 12 months post-TBI (Appendix H). The McNemar–Bowker Test showed a negligible change in the probability of off-diagonal change in the contingency table from three to six months (OR = 1.43, p = 0.558, Cohen’s g = 0.089), from three to 12 months (OR = 1.30, p = 0.565, Cohen’s g = 0.065), and from six to 12 months (OR = 1.30, p = 0.566, Cohen’s g = 0.066). Thus, there were no significant differences in probability of change from depression to anxiety, and vice versa (see Ap-pendix H for contingency Table A4).
Figure 2. The prevalence (%) of depression and anxiety categories at three time points of 3, 6, and 12 months. Note: F = female; M = male. nonD.nonA. = neither depression nor anxiety; A.nonD. = only anxiety; D.nonA. = only depression; D.A. = comorbid depression and anxiety.
Figure 2. The prevalence (%) of depression and anxiety categories at three time points of 3, 6, and 12 months.Note: F = female; M = male. nonD.nonA. = neither depression nor anxiety; A.nonD. = only anxiety;D.nonA. = only depression; D.A. = comorbid depression and anxiety.
J. Clin. Med. 2020, 9, 873 11 of 21
Table 4. The McNemar test statistics (chi-squared) for intra-individuals changes of depression over time in low and high anxiety groups using the McNemarchi-squared test.
Generalized Anxiety Disorder (GAD-7) Categories at 3-Month Based on the Cut-Off Point of 8
Low Anxiety at 3-Months High Anxiety at 3-Months
Matched variable Depression at 6 Mo Depression at 6 Mo0, n (%) 1, n (%) Total Mc (df), p * 0, n (%) 1, n (%) Total Mc (df), p
Depression at 3 mo 0 1056 (91.6) 97 (8.4) 11530.18 (1), p = 0.61 Depression at 3 mo 0 33 (80.5) 8 (19.5) 41 42.61 (1), p < 0.001
Generalized Anxiety Disorder (GAD-7) categories at 3-month based on the cut-off point of 8
Low anxiety at 3-Months High anxiety at 3-Months
Depression at 12 Mo Depression at 12 Mo
0, n (%) 1, n (%) Total Mc (df), p 0, n (%) 1, n (%) Total Mc.(df), p
Depression at 3 mo 0 713 (89.6) 83 (10.4) 796 0.94 (1), p = 0.33 Depression at 3 mo 0 17 (70.8) 7 (29.2) 24 23.17 (1), p < 0.0011 71 (47.7) 78 (52.3) 149 1 40 (31.5) 87 (68.5) 127
Total 784 (83.0) 161 (17.0) Total 57 (37.7) 94 (62.3)
Generalized Anxiety Disorder (GAD-7) categories at 6-month based on the cut-off point of 8
Low anxiety at 6-Months High anxiety at 6-Months
Depression at 12 Mo Depression at 12 Mo
0, n (%) 1, n (%) Total Mc (df), p 0, n (%) 1, n (%) Total Mc (df), p
Depression at 6 mo 0 818 (90.5) 86 (9.5) 904 8.38 (1), p < 0.01 Depression at 6 mo 0 20 (62.5) 12 (37.5) 32 0.86 (1), p = 0.3531 52 (39.1) 81 (60.9) 133 1 17 (12.8) 116 (87.2) 133
Total 870 (83.9) 167 (16.1) Total 37 (22.4) 128 (77.6)
* McNemar’s chi-squared (degree of freedom), p-value. Bold: Highlighting the asymmetrical change of depression from earlier to later time point, i.e., individuals that changed their cellsover time.
J. Clin. Med. 2020, 9, 873 12 of 21
4. Discussion
In this study, we examined the factorial structure of a composite measure of depression andanxiety and evaluated the validity of the subfactors. The results of exploratory and confirmatoryfactor analyses, as well as the Omega hierarchical test, suggested a unidimensional construct suchthat both instruments were part of a common general factor, as the subscales of PHQ-9 and GAD-7separately had negligible independent effects to explain the variance of the construct. This is partlyunderstandable as there are a few similar items in both the subscales, such as being restless and havingtrouble relaxing/sleeping. In addition, both depression and anxiety symptoms are part of the samemood disorder category, share a common domain of negative affect, and share a cognitive process withnegative bias in information processing.
The subfactors of PHQ-9 and GAD-7 performed very similarly in detecting an anxiety-relateddisorder, PTSD. Examining the construct validity, both PHQ-9 and GAD-7 subfactors were negativelyrelated to various domains of physical and psychological outcomes, with PHQ-9 having noticeablystronger negative relationship with SF-36 subscales than GAD-7 (Table 2, Figure 1). The negativerelationship with SF-36 subscales was much higher for patients with comorbid depression and anxiety.In addition, the result of our longitudinal analysis did not support the hypothesis that anxiety precedesdepression, as proposed in the literature [52]. Perhaps it is the nature of the traumatic experiences suchas TBI that provides a common cause for the experience of both depression and anxiety symptoms.on the other hand, it is the social avoidance aspect of the anxiety that is deemed to be a risk factor forthe onset of depression [59,60]. Unfortunately, we did not have a measure for social anxiety in ourstudy. Besides that, the TBI incidence, the subsequent medical care and potential social support, as wellas the post-TBI recovery process might complicate the relevance of social avoidance aspect of anxietyfor the onset of depression symptoms.
The depression and anxiety symptoms seemed to be stable over time and the small developmentalchanges pattern from general anxiety to depression symptoms and vice versa were rather symmetricalup to one year after TBI. Similarly, in a birth cohort that was followed for 32 years, Moffitt et al. [61]found that depression also precedes general anxiety symptoms as often as the reverse pattern.Thus, the developmental changes from one to another requires us to take both pathways into accountand study it with other types of anxiety symptoms as well (for a review, see [59]).
Our findings concern patients after TBI, and this should be borne in mind when seekingexplanations of why depression and anxiety are so closely related. It would be interesting to find outwhat shared cognitive processes, or shared biological pathways, contribute to the strong relationshipbetween depression and anxiety. However, it is not clear if the unidimensionality is because ofthe specific traumatic experience in TBI that provides a shared common cause for both depressionand anxiety. Comparative works with depression and anxiety after other types of traumatic events,e.g., other stressful life events, and comparison with control group can shed more light on this.
Furthermore, it is not clear whether the lack of unique effect of depression and anxiety subfactors isdue to the self-report nature of PHQ-9 and GAD-7 measures. Is the difference between these constructsmore experiential that might be better captured through other research method? Using mixedmethods such as the diagnostic interviews and phenomenological analysis in addition to the self-reportmeasure can better clarify this point. For instance, with using HADS and structural interviews,Whelan-Goodinson, Ponsford, and Schönberger [62] found that HADS is a reliable measure of a generalpsychological distress construct for patients after TBI and cannot differentiate depressed and anxiouscases identified through structural interviews.
To test the predictive validity, we had only data from three, six, and 12 months after TBI, and it is notclear if anxiety does not precede depression or if this is not a sufficient time period for anxious patientsto develop depression. As already explained, we included only the general anxiety disorder andthere might be another sub-type of anxiety, such as social anxiety, that might be a risk factor forthe onset of depression. A more comprehensive longitudinal test requires data for a longer period andinformation on different sub-types of anxiety symptoms (e.g., social anxiety, phobias), familial and
J. Clin. Med. 2020, 9, 873 13 of 21
contextual factors, as well as the pre-TBI depression and anxiety symptoms. Finally, a more detailedinvestigation between PHQ-ADS and more related constructs such as bipolar disorder and suicidalityare required. For instance, one of the items in PHQ-9 has been contested to measure suicidality ratherthan depression [38], although the criteria remained in the recent edition of DSM-IV.
Furthermore, we have not investigated the association between depression and other physical,social, and clinical functioning of the TBI patients given the characteristics of our sample.Teymoori et al. [45] found that the functional recovery is a much more important predictor ofdepression and anxiety severity than the baseline TBI severity, such that individuals with severeand moderate disability six months after the TBI had higher depression and anxiety symptomsin comparison to individuals who had a good recovery after the TBI. Noteworthy, TBI severity wasnot related to depression and anxiety after controlling for functional recovery measure [45]. Furtheranalysis regarding the association of depression and anxiety with other physical, social, and clinicalfunctioning should a task that can be addressed in the future studies.
The debate about whether depression and anxiety scales can actually differentiate the depressedand anxious people is not new (e.g., see [63]). on the other hand, the result of studies on other scales, suchas HADs, has already shown such inability to differentiate these two constructs through self-reportingmeasures. In addition, the high comorbidity and strong correlation between depression and anxietymight indicate a lack of distinctiveness in measuring what they aim to measure (also see [64]). Ourstudy shows that PHQ-ADS as a general unidimensional measure is valid and reliable to use forscreening patients for depression and anxiety after TBI and has a good performance in detecting relatedconstruct such as PTSD. Notwithstanding, for an accurate clinical diagnosis and treatment purposes,detailed medical and psychiatric/psychological evaluations are required.
Supplementary Materials: The following are available online at http://www.mdpi.com/2077-0383/9/3/873/s1,the CENTER-TBI participants and investigators.
Author Contributions: All authors have read and agree to the published version of the manuscript.Conceptualization, A.T., R.R. and F.E.H.; Data collection, CENTER-TBI Investigators; Data analysis, A.T, A.G.,R.R.; writing—original draft preparation, A.T.; writing—review and editing, A.G., F.E.H., R.R., M.Z., Y.-J.W., T.A.,N.v.S, S.P., D.M.; project administration, D.M., N.v.S.; funding acquisition, D.M., N.v.S. All authors have read andagreed to the published version of the manuscript.
Funding: The European Union Seventh Framework program (EC grant 602150) supported the CENTER-TBIstudy. The Hannelore Kohl Stiftung (Germany), One Mind (USA), Integra Life Sciences Corporation (USA),and Neurotrauma Sciences (USA) were additional funding parties.
Conflicts of Interest: The authors declare no conflicts of interest.
Note: As can be seen in the descriptive statistics, most participants answered that they were not at all or just a fewdays of the week bothered by the symptoms of the depression and anxiety. As a result, most participants selectedthe lower end of the item responses (0 or 1). For instance, the first quantile, median, and third quantile for the firstitem of the PHQ-9 was 0, 0, and 1, and for the first item of GAD-7 was also 0, 0, 1, respectively. As another example,in response to a question as to on how many days of the last two weeks individuals were afraid something awfulmight happen (Item 7 of GAD-7), 1607 participants were not bothered at all (0), 341 for just several days (1), 85 formore than half the days (2), and 79 participants nearly every day (3).
Note: As can be seen in the descriptive statistics, most participants answered that they were not at all or just a few days of the week bothered by the symptoms of the depression and anxiety. As a result, most participants selected the lower end of the item responses (0 or 1). For instance, the first quantile, median, and third quantile for the first item of the PHQ-9 was 0, 0, and 1, and for the first item of GAD-7 was also 0, 0, 1, respectively. As another example, in response to a question as to on how many days of the last two weeks individuals were afraid something awful might happen (Item 7 of GAD-7), 1607 participants were not bothered at all (0), 341 for just several days (1), 85 for more than half the days (2), and 79 participants nearly every day (3).
Appendix B
Figure A1. The Scree plot for a composite measure of Patient Health Questionnaire Anxiety and De-pression Scale (PHQ-ADS).
Figure A1. The Scree plot for a composite measure of Patient Health Questionnaire Anxiety andDepression Scale (PHQ-ADS).
J. Clin. Med. 2020, 9, 873 15 of 21
Appendix C
J. Clin. Med. 2020, 9, x FOR PEER REVIEW 15 of 20
Appendix C
Figure A2. The bifactorial model for Patient Health Questionnaire for depression (PHQ-9) and seven-item scale for Generalised Anxiety Disorder (GAD-7).
Appendix D
Table A2. Standardized Factor Loadings for the General Factor and the Two Sub-Factors of Depression and Anxiety in Omega Test and CFA
Schmid–Leiman CFA Items Gen. Anx. Dep. Communality EV I-ECV Gen. Anx Dep
I-ECV: Item Explained Common Variance; EV: Error Variance Note: Schmid–Leiman Factor loadings greater than0.2; all factor loadings are statistically significant, p < 0.001). For CFA: *** for p < 0.001; ** for p < 0.01; * for p < 0.05.
I-ECV: Item Explained Common Variance; EV: Error Variance Note: Schmid–Leiman Factor loadings greater than 0.2; all factor loadings are statistically significant, p < 0.001). For CFA: *** for p < 0.001; ** for p < 0.01; * for p < 0.05.
Appendix E
Figure A3. The relative impact of depression and anxiety on the physical and psychological outcomes with the cut-off point of 10 for PHQ-9 and GAD-7.
Appendix F
Table A3. Depression and anxiety groups at three months predicting depression and anxiety (cut-off point of 8) at six months using logistic regression.
PHQ9 at 6-Months GAD7 at 6-Months 3 months Beta (ER) Z OR (95%CI) Beta (ER) Z OR (95%CI) A.nonD 0.97 (0.41) 2.38 *** 2.64 (1.11–5.61) 2.25 (0.37) 6.04 *** 9.53 (4.45–19.46) D.nonA 2.44 (0.17) 14.08 *** 11.52 (8.22–16.23) 1.74 (0.23) 7.67 *** 5.69 (3.64–8.88)
Figure A3. The relative impact of depression and anxiety on the physical and psychological outcomeswith the cut-off point of 10 for PHQ-9 and GAD-7.
J. Clin. Med. 2020, 9, 873 17 of 21
Appendix F
Table A3. Depression and anxiety groups at three months predicting depression and anxiety (cut-off
point of 8) at six months using logistic regression.
PHQ9 at 6-Months GAD7 at 6-Months
3 months Beta (ER) Z OR (95%CI) Beta (ER) Z OR (95%CI)A.nonD 0.97 (0.41) 2.38 *** 2.64 (1.11–5.61) 2.25 (0.37) 6.04 *** 9.53 (4.45–19.46)D.nonA 2.44 (0.17) 14.08 *** 11.52 (8.22–16.23) 1.74 (0.23) 7.67 *** 5.69 (3.64–8.88)
1. Kessler, R.C.; Berglund, P.; Demler, O.; Jin, R.; Merikangas, K.R.; Walters, E.E. Lifetime prevalenceand age-of-onset distributions of DSM-IV disorders in the National Comorbidity Survey Replication.Arch. Gen. Psychiatry 2005, 62, 593–602. [CrossRef] [PubMed]
2. Merikangas, K.R.; He, J.; Burstein, M.; Swanson, S.A.; Avenevoli, S.; Cui, L.; Benjet, C.; Georgiades, K.;Swendsen, J. Lifetime prevalence of mental disorders in US adolescents: results from the National ComorbiditySurvey Replication–Adolescent Supplement (NCS-A). J. Am. Acad. Child Adolesc. Psychiatry 2010, 49, 980–989.[CrossRef] [PubMed]
3. Barkin, R.L.; Schwer, W.A.; Barkin, S.J. Recognition and management of depression in primary care: A focuson the elderly. A pharmacotherapeutic overview of the selection process among the traditional and newantidepressants. Am. J. Ther. 2000, 7, 205–226. [CrossRef] [PubMed]
4. Gilbody, S.; Richards, D.; Brealey, S.; Hewitt, C. Screening for depression in medical settings with the PatientHealth Questionnaire (PHQ): A diagnostic meta-analysis. J. Gen. Intern. Med. 2007, 22, 1596–1602. [CrossRef]
8. Fann, J.R.; Bombardier, C.H.; Dikmen, S.; Esselman, P.; Warms, C.A.; Pelzer, E.; Rau, H.; Temkin, N. Validityof the Patient Health Questionnaire-9 in assessing depression following traumatic brain injury. J. HeadTrauma Rehabil. 2005, 20, 501–511. [CrossRef]
9. Jorge, R.E.; Robinson, R.G.; Moser, D.; Tateno, A.; Crespo-Facorro, B.; Arndt, S. Major depression followingtraumatic brain injury. Arch. Gen. Psychiatry 2004, 61, 42–50. [CrossRef]
10. Mooney, G.; Speed, J. The association between mild traumatic brain injury and psychiatric conditions.Brain Inj. 2001, 15, 865–877. [CrossRef]
11. Seel, R.T.; Kreutzer, J.S.; Rosenthal, M.; Hammond, F.M.; Corrigan, J.D.; Black, K. Depression after traumaticbrain injury: A National Institute on Disability and Rehabilitation Research Model Systems multicenterinvestigation. Arch. Phys. Med. Rehabil. 2003, 84, 177–184. [CrossRef] [PubMed]
12. Bryant, R.A.; O’donnell, M.L.; Creamer, M.; McFarlane, A.C.; Clark, C.R.; Silove, D. The psychiatric sequelaeof traumatic injury. Am. J. Psychiatry 2010, 167, 312–320. [CrossRef]
13. Hanel, G.; Henningsen, P.; Herzog, W.; Sauer, N.; Schaefert, R.; Szecsenyi, J.; Löwe, B. Depression, anxiety,and somatoform disorders: vague or distinct categories in primary care? Results from a large cross-sectionalstudy. J. Psychosom. Res. 2009, 67, 189–197. [CrossRef] [PubMed]
14. Hirschfeld, R.M. The comorbidity of major depression and anxiety disorders: recognition and managementin primary care. Prim. Care Companion J. Clin. Psychiatry 2001, 3, 244. [CrossRef] [PubMed]
15. Kroenke, K.; Spitzer, R.L.; Williams, J.B.; Löwe, B. The patient health questionnaire somatic, anxiety, and depressivesymptom scales: A systematic review. Gen. Hosp. Psychiatry 2010, 32, 345–359. [CrossRef] [PubMed]
16. Dobson, K.S. The relationship between anxiety and depression. Clin. Psychol. Rev. 1985, 5, 307–324. [CrossRef]17. Osman, A.; Wong, J.L.; Bagge, C.L.; Freedenthal, S.; Gutierrez, P.M.; Lozano, G. The depression anxiety stress
Scales—21 (DASS-21): further examination of dimensions, scale reliability, and correlates. J. Clin. Psychol.2012, 68, 1322–1338. [CrossRef] [PubMed]
18. Buckby, J.A.; Yung, A.R.; Cosgrave, E.M.; Killackey, E.J. Clinical utility of the Mood and Anxiety SymptomQuestionnaire (MASQ) in a sample of young help-seekers. BMC Psychiatry 2007, 7, 50. [CrossRef]
19. Zigmond, A.S.; Snaith, R.P. The hospital anxiety and depression scale. Acta Psychiatr. Scand. 1983, 67, 361–370.[CrossRef]
20. Johnston, M.; Pollard, B.; Hennessey, P. Construct validation of the hospital anxiety and depression scalewith clinical populations. J. Psychosom. Res. 2000, 48, 579–584. [CrossRef]
21. Caci, H.; Baylé, F.J.; Mattei, V.; Dossios, C.; Robert, P.; Boyer, P. How does the Hospital and Anxiety andDepression Scale measure anxiety and depression in healthy subjects? Psychiatry Res. 2003, 118, 89–99. [CrossRef]
22. Hinz, A.; Schwarz, R. [Anxiety and depression in the general population: normal values in the HospitalAnxiety and Depression Scale]. Psychother. Psychosom. Med. Psychol. 2001, 51, 193–200. [CrossRef] [PubMed]
23. Dunbar, M.; Ford, G.; Hunt, K.; Der, G. A confirmatory factor analysis of the Hospital Anxiety and Depressionscale: comparing empirically and theoretically derived structures. Br. J. Clin. Psychol. 2000, 39, 79–94.[CrossRef] [PubMed]
24. Iani, L.; Lauriola, M.; Costantini, M. A confirmatory bifactor analysis of the hospital anxiety and depressionscale in an Italian community sample. Health Qual. Life Outcomes 2014, 12, 84. [CrossRef] [PubMed]
25. Norton, S.; Cosco, T.; Doyle, F.; Done, J.; Sacker, A. The Hospital Anxiety and Depression Scale: A metaconfirmatory factor analysis. J. Psychosom. Res. 2013, 74, 74–81. [CrossRef]
26. Cosco, T.D.; Doyle, F.; Ward, M.; McGee, H. Latent structure of the Hospital Anxiety And Depression Scale:A 10-year systematic review. J. Psychosom. Res. 2012, 72, 180–184. [CrossRef]
27. Kroenke, K.; Spitzer, R.L. The PHQ-9: A new depression diagnostic and severity measure. Psychiatr. Ann.2002, 32, 509–515. [CrossRef]
28. Kroenke, K.; Spitzer, R.L.; Williams, J.B. The PHQ-9: validity of a brief depression severity measure. J. Gen.Intern. Med. 2001, 16, 606–613. [CrossRef]
29. Spitzer, R.L.; Kroenke, K.; Williams, J.B.; Löwe, B. A brief measure for assessing generalized anxiety disorder:The GAD-7. Arch. Intern. Med. 2006, 166, 1092–1097. [CrossRef]
30. Fogelberg, D.J.; Hoffman, J.M.; Dikmen, S.; Temkin, N.R.; Bell, K.R. Association of Sleep and Co-OccurringPsychological Conditions at 1 Year After Traumatic Brain Injury. Arch. Phys. Med. Rehabil. 2012, 93,1313–1318. [CrossRef]
31. Boothroyd, L.; Dagnan, D.; Muncer, S. Psychometric analysis of the Generalized Anxiety Disorder Scale andthe Patient Health Questionnaire using Mokken scaling and confirmatory factor analysis. Health Prim. Care2018, 2, 1–4. [CrossRef]
32. Kroenke, K.; Wu, J.; Yu, Z.; Bair, M.J.; Kean, J.; Stump, T.; Monahan, P.O. The Patient Health QuestionnaireAnxiety and Depression Scale (PHQ-ADS): Initial Validation in Three Clinical Trials. Psychosom. Med. 2016,78, 716–727. [CrossRef] [PubMed]
33. Maas, A.I.R.; Menon, D.K.; Steyerberg, E.W.; Citerio, G.; Lecky, F.; Manley, G.T.; Hill, S.; Legrand, V.; Sorgner, A.Collaborative European NeuroTrauma Effectiveness Research in Traumatic Brain Injury (CENTER-TBI)AProspective Longitudinal Observational Study. Neurosurgery 2015, 76, 67–80. [CrossRef] [PubMed]
34. Steyerberg, E.W.; Wiegers, E.; Sewalt, C.; Buki, A.; Citerio, G.; Keyser, V.D.; Ercole, A.; Kunzmann, K.;Lanyon, L.; Lecky, F.; et al. Case-mix, care pathways, and outcomes in patients with traumatic brain injuryin CENTER-TBI: A European prospective, multicentre, longitudinal, cohort study. Lancet Neurol. 2019, 18,923–934. [CrossRef]
35. Teasdale, G.; Maas, A.; Lecky, F.; Manley, G.; Stocchetti, N.; Murray, G. The Glasgow Coma Scale at 40 years:standing the test of time. Lancet Neurol. 2014, 13, 844–854. [CrossRef]
36. Marmarou, A.; Lu, J.; Butcher, I.; McHugh, G.S.; Murray, G.D.; Steyerberg, E.W.; Mushkudiani, N.A.; Choi, S.;Maas, A.I. Prognostic value of the Glasgow Coma Scale and pupil reactivity in traumatic brain injury assessedpre-hospital and on enrollment: An IMPACT analysis. J. Neurotrauma 2007, 24, 270–280. [CrossRef]
37. Wilson, J. t. L.; Pettigrew, L.E. l.; Teasdale, G.M. Structured Interviews for the Glasgow Outcome Scale andthe Extended Glasgow Outcome Scale: Guidelines for Their Use. J. Neurotrauma 1998, 15, 573–585. [CrossRef]
38. Kroenke, K.; Strine, T.W.; Spitzer, R.L.; Williams, J.B.; Berry, J.T.; Mokdad, A.H. The PHQ-8 as a measure ofcurrent depression in the general population. J. Affect. Disord. 2009, 114, 163–173. [CrossRef]
39. Manea, L.; Gilbody, S.; McMillan, D. Optimal cut-off score for diagnosing depression with the Patient HealthQuestionnaire (PHQ-9): A meta-analysis. CMAJ 2012, 184, E191–E196. [CrossRef]
40. Plummer, F.; Manea, L.; Trepel, D.; McMillan, D. Screening for anxiety disorders with the GAD-7 and GAD-2:A systematic review and diagnostic metaanalysis. Gen. Hosp. Psychiatry 2016, 39, 24–31. [CrossRef]
41. Ware Jr, J.E.; Kosinski, M.; Bjorner, J.B.; Turner-Bowker, D.M.; Gandek, B.; Maruish, M.E. User’s manual forthe SF-36v2 health survey, 2nd edn. QualityMetric. Inc Linc. 2007.
42. Bullinger, M. The TBI Consensus Group Quality of life in patients with traumatic brain injury-basic issues,assessment and recommendations. Restor. Neurol. Neurosci. 2002, 20, 111–124. [PubMed]
43. Bovin, M.J.; Marx, B.P.; Weathers, F.W.; Gallagher, M.W.; Rodriguez, P.; Schnurr, P.P.; Keane, T.M. Psychometricproperties of the PTSD Checklist for Diagnostic and Statistical Manual of Mental Disorders–Fifth Edition(PCL-5) in veterans. Psychol. Assess. 2016, 28, 1379–1391. [CrossRef] [PubMed]
44. Krüger-Gottschalk, A.; Knaevelsrud, C.; Rau, H.; Dyer, A.; Schäfer, I.; Schellong, J.; Ehring, T. The Germanversion of the Posttraumatic Stress Disorder Checklist for DSM-5 (PCL-5): psychometric properties anddiagnostic utility. BMC Psychiatry 2017, 17, 1–9. [CrossRef] [PubMed]
45. Teymoori, A.; Real, R.; Gorbunova, A.; Haghish, E.F.; Andelic, N.; Wilson, L.; Asendorf, T.; Menon, D.; vonSteinbüchel, N. Measurement invariance of assessments of depression (PHQ-9) and anxiety (GAD-7) acrosssex, strata and linguistic backgrounds in a European-wide sample of patients after Traumatic Brain Injury.J. Affect. Disord. 2020, 262, 278–285. [CrossRef] [PubMed]
46. Acquadro, C.; Conway, K.; Giroudet, C.; Mear, I. Linguistic Validation Manual for Health Outcome Assessments;Mapi Institute: Kerry Way Downey, CA, USA, 2012.
47. Chen, F.F.; Hayes, A.; Carver, C.S.; Laurenceau, J.-P.; Zhang, Z. Modeling General and Specific Variancein Multifaceted Constructs: A Comparison of the Bifactor Model to Other Approaches. J. Pers. 2012, 80,219–251. [CrossRef]
49. Bonifay, W.; Lane, S.P.; Reise, S.P. Three Concerns With Applying a Bifactor Model as a Structure ofPsychopathology. Clin. Psychol. Sci. 2017, 5, 184–186. [CrossRef]
50. Rodriguez, A.; Reise, S.P.; Haviland, M.G. Applying bifactor statistical indices in the evaluation ofpsychological measures. J. Pers. Assess. 2016, 98, 223–237. [CrossRef]
51. Revelle, W. psych: Procedures for Personality and Psychological Research; Northwestern University: Evanston, IL,USA, 2017; Available online: http://CRAN.R-project.org/ (accessed on 21 March 2020).
52. Garber, J.; Weersing, V.R. Comorbidity of Anxiety and Depression in Youth: Implications for Treatment andPrevention. Clin. Psychol. Sci. Pract. 2010, 17, 293–306. [CrossRef]
53. McCrum-Gardner, E. Which is the correct statistical test to use? Br. J. Oral Maxillofac. Surg. 2008, 46, 38–41.[CrossRef] [PubMed]
54. Cohen, J. Statistical Power Analysis for the Behavioral Sciences; Routledge: New York, NY, USA, 1988.55. Rosseel, Y. Lavaan: An R package for structural equation modeling and more. Version 0.5–12 (BETA).
J. Stat. Softw. 2012, 48, 1–36. [CrossRef]56. Kline, P. An Easy Guide to Factor Analysis; Routledge: Abingdon, UK, 2014; ISBN 978-1-317-72560-2.57. Byrne, B.M. Structural Equation Modeling With AMOS: Basic Concepts, Applications, and Programming, 3rd. ed.;
Routledge: Abingdon, UK, 2016; ISBN 978-1-317-63313-6.58. Hu, L.; Bentler, P.M. Cutoff criteria for fit indexes in covariance structure analysis: Conventional criteria
versus new alternatives. Struct. Equ. Model. Multidiscip. J. 1999, 6, 1–55. [CrossRef]59. Cummings, C.M.; Caporino, N.E.; Kendall, P.C. Comorbidity of anxiety and depression in children and
adolescents: 20 years after. Psychol. Bull. 2014, 140, 816. [CrossRef] [PubMed]60. Parker, G.; Wilhelm, K.; Mitchell, P.; Austin, M.-P.; Roussos, J.; Gladstone, G. The influence of anxiety as a risk
to early onset major depression. J. Affect. Disord. 1999, 52, 11–17. [CrossRef]
61. Moffitt, T.E.; Harrington, H.; Caspi, A.; Kim-Cohen, J.; Goldberg, D.; Gregory, A.M.; Poulton, R. Depressionand generalized anxiety disorder: cumulative and sequential comorbidity in a birth cohort followedprospectively to age 32 years. Arch. Gen. Psychiatry 2007, 64, 651–660. [CrossRef]
62. Whelan-Goodinson, R.; Ponsford, J.; Schönberger, M. Validity of the Hospital Anxiety and Depression Scaleto assess depression and anxiety following traumatic brain injury as compared with the Structured ClinicalInterview for DSM-IV. J. Affect. Disord. 2009, 114, 94–102. [CrossRef]
63. Mendels, J.; Weinstein, N.; Cochrane, C. The relationship between depression and anxiety. Arch. Gen. Psychiatry1972, 27, 649–653. [CrossRef]
64. Toft, T.; Fink, P.E.R.; Oernboel, E.V.A.; Christensen, K.A.J.; Frostholm, L.; Olesen, F. Mental disordersin primary care: prevalence and co-morbidity among disorders. Results from the functional illnessin primary care (FIP) study. Psychol. Med. 2005, 35, 1175–1184. [CrossRef]