Factors Affecting Guest Perceived Service
Quality, Product Quality, and Satisfaction–A
Study of Luxury Restaurants in Ho Chi Minh
City, Vietnam
Khuong Mai Ngoc and Tran Tran Uyen
School of Business Administration, International University–VNU-HCMC, Vietnam
Email: [email protected], [email protected]
Abstract—This study was conducted to examine the direct
and indirect impacts of the factors of SERVQUAL model;
tangibles, reliability, responsiveness, empathy, and
assurance together with other factors of price, authenticity,
and meal pace on guest satisfaction of luxury restaurants in
Ho Chi Minh City through the mediation of factors of
service quality and product quality. The empirical results
provided a general view about customer’s assessment about
product quality or food quality and service quality of luxury
restaurants. In addition, this study also argued that, to
achieve higher guest satisfaction level, luxury restaurateurs
should focus more on the improvement of their service
quality, product quality, assurance, responsiveness,
empathy, and reliability of staff, offer better price and pre–
and in meal pace process. On the other hand, despite having
no direct effect on guest satisfaction, tangibles dimension
and activities of post meal pace process contributed an
important indirect impact on guest satisfaction.
Index Terms—guest satisfaction, luxury restaurant,
perceived service quality, perceived product quality
I. INTRODUCTION
Nowadays, with the higher living standard, having
dining in restaurants is not unfamiliar with Vietnamese,
even it become a culture in great urban such as Ho Chi
Minh City and Ha Noi capital. Guests come to restaurants
not only for eating and drinking but also for their
business, their celebration, etc. No matter what business
the owners are in, they always find ways to attract
customers to their establishments. Retaining customers is
important; it costs three or five times as much to attract a
new customer as it does to retain an old customer [1].
About 80% profit business get coming from 20% loyal
customer. Therefore, the big issue for business is how to
make customers repurchase product or service and
become loyal customers. Based on the finding of many
previous authors about the relationship between customer
satisfaction and loyalty [2] and [3], it can be concluded
that one of best way to have loyal customers is satisfying
the existing customer. Consumer satisfaction is
Manuscript received May 29, 2014; revised August 11, 2014.
considered a heart of marketing, an essential indicator for
evaluating corporate performance because of the close
relationship between it and corporate profit [4] and [5].
On the other hand, a satisfied customer will exhibit
positive word-of-mouth [6] and [7] which is “one of the
most important factors to acquiring new customer” [8].
Ho Chi Minh City, known as―Far East Pearl, has over
10 million people and is center of economic, culture and
education of Vietnam. This destination provides many
different kinds of restaurants from fast-casual restaurants,
casual-dining restaurants to luxury restaurants which
offer different types of special food and beverage of
different countries such as: Japan, Korea, India, Europe,
China and so on. The battle for market share in the
restaurant industry is intensive [9] in the U.S. and that is
also true in Vietnam with more and more restaurants
opened each year. Guest come to restaurant not only
enjoy aromatic flavor of food and beverage but also enjoy
service quality; how the guests served, style of restaurants,
etc. The higher price customers pay when they eat in
restaurant, the higher the demand they request about
service quality and product quality. Therefore, it is more
difficult for luxury restaurant’s owners to develop and
improve their restaurants to satisfy the customers when
they always deal and serve the choosy guests who can
pay high for a meal; however they require perfection for
everything. Indeed, Customer is considered as King
because customer is who makes decision whether a
restaurant can continue to open and do business or not. In
the hard race of conquering customer in order to persuade
them purchase and repurchase a product of restaurant,
restaurateurs always try to develop, modify and renovate
service quality and product quality through defining
factors that lead to guest satisfaction.
II. LITERATURE REVIEW
A. Luxury Restaurant
The word “luxury” comes from the Latin word
“Luxus” which means rankness, excess, debauchery, also
richness, abundance. Besides that, the word luxury also
describes ways of behavior, expenditure, and products
Journal of Advanced Management Science Vol. 3, No. 4, December 2015
©2015 Engineering and Technology Publishing 284doi: 10.12720/joams.3.4.284-291
considered as exceeding necessary and sensibility. In
today’s day and age, the idea of luxury is usually
associated with exclusive and expensive brands.
According to [10], they define luxury restaurant is a place
where provide full service of food and beverage and with
expensive price, high quality food and service, and
distinguished physical environment such as stylish décor,
pleasing or fancy atmosphere, etc.
B. Guest/Customer Satisfaction
Reference [11] first denoted customer satisfaction as a
related psychological state to appraise the reasonableness
between what consumer actually gets and gives.
Customer satisfaction as a psychological state when there
is an existing discrepancy between emotion and
expectation [12]. Reference [13] assumed guest
satisfaction as a consumer’s fulfill response. It is a
judgment that a product or service feature providing a
pleasurable of consumption related fulfillments. Thus,
guest satisfaction towards restaurants is an assessment
whether the service and product quality meets their needs
and expectation involved.
C. Perceived Service Quality
The service defines a commodity as intangible
including the performance of certain work or effort, and
usually is offered through the effort of people or a
mechanical effort to a certain person [14]. Reference [15]
defined service quality is difference between customer
expectation of service providers and their assessment of
the actual service or [16] cited service quality is
customer’s judgment about the excellence or superior of
service. Service quality is not only considered as a tool
for revenue streams but also become to the most
important competitive factor in business world which has
been offered some metaphors such as the most powerful
competition weapon [17], the organization’s life-giving
blood [18].
Based on the gap of the theory of service quality, [19]
developed SERVQUAL as an instrument to measure
service quality consisting of ten determinants: tangible,
reliability, responsiveness, competence, courtesy,
credibility, security, accessibility, communication and
understanding the customer. The ten factors were then
simplified and reduced into five factors which are
tangibles, reliability, responsiveness, assurance and
empathy.
SERVQUAL has been received many criticism from
the other authors. The first question is about the validity
of SERVQUAL in measure the expectation of customer
in service place where there are many people who just
come there in the first time and their expectation is not
realistic [20]. Reference [21] and [22] contended it
depends on the field of research in which the dimensions
of SERVQUAL are applied because the definitions and
the number differ. It can be said that, SERVQUAL is
open model and flexible which can be applied for
different industry. There are varieties of research
conducted in hospitality industry using the SERVQUAL
model. The effectiveness of SERVQUAL in studying
service quality in hospitality industry has been well
demonstrated by several researchers [23] and [24]. On the
other hand, the items for measuring the variable of
tangibles in this research were a combination of the items
of DINESCAPE [25] and items of tangibles in
PERSERQUAL [26] for evaluating physical evidence of
luxury restaurants in Ho Chi Minh City.
D. Perceived Product Quality
[27] and [28] defined product quality is all of
characteristics and features of product satisfying given
needs. Perceived product quality in restaurants is assessed
by evaluating of customer about actual product (meal or
food quality) and place where meal or food is delivered
(physical environment). However, the "physical
environment and equipment" was similar to the tangible
dimension proposed by Parasuraman, Zeithaml, and
Berry in 1988 [29]. Therefore, this research focuses on
food quality as a measurement for the mediating variable
of perceived product quality influencing guest
satisfaction when guests dine in a luxury restaurant.
Reference [30] stated three components of measuring
food quality: safety, appeal, dietary acceptability and
found that food quality is the most important factor
affecting on guest satisfaction compared with the other
aspects of restaurant including physical environment and
service quality. Another research model proposed by [31]
tested the impact of food quality on guest satisfaction and
their behavioral intention. This research found a linkage
between food quality and guest satisfaction as well as
behavioral intentions. They selected presentation, menu
item variety, healthy options, taste, freshness, and
temperature to assess food quality. Reference [32] used
food presentation, menu design, serving size to measure
product quality or food quality in the foodservice industry.
This research adopts measuring items from the previous
mentioned researches, hence, the factor food quality will
be evaluated by: tastiness of food, food variety, menu
design, food safety, food serving size, and food
presentation.
E. Price
Reference [33] not only considered price as a
multidimensional variable consisting of objective price,
monetary price and sacrifice, but also defined defines
price as something, customer have to give up or scarify to
obtain kinds of product and service. [34] noted that price
is the amount of money customer has to pay for the
benefits that they get from the product or service.
Economists have aware of the concept of judging
quality by price. For instance, reference [35] stated that
price is an important element of consumer’s purchase;
therefore it has large influence on consumers’ satisfaction
judgment. Today, the word “expensive” has come to
connote “quality” in the mind of the consumer. The two
concepts have almost become synonymous. The
perception of price as an indicator of product is basically
rational. It indicates a trust in the forces of supply and
demand and is based on the assumption that prevailing
market prices exist because they were found to be fair
and reasonable [36].
Journal of Advanced Management Science Vol. 3, No. 4, December 2015
©2015 Engineering and Technology Publishing 285
F. Meal Pace
According to [37], the goal of revenue management is
maximizing revenue by the way of variable pricing and
duration control. Revenue management has applied in
services that are sold to customer for a fixed amount of
time.
Meal pace can be understood as the duration of meal
experience which begins when customer are seated in
restaurant’s table and ends when restaurant vacate the
table. Research on waiting time has also shown that
customer’s reaction to wait for service depends on the
stage of experience. Dining experience can be broken into
three main stages: (1) preprocess stage; (2) in-process
stage; and (3) post-process stage [38] in which preprocess
stage extends from a customer who arrive at restaurant
until he or she receive the first food course; in-process
stage involves placing order and consuming meal; post-
process begins with check settlement and ends when
customer leaves.
With the mentioned independent variables and
mediating variables related to guest satisfaction above,
this study hypothesizes that:
H1: Perceived service quality and perceived product
quality affect guest satisfaction.
H2: Factors of tangibles, reliability, responsiveness,
empathy, assurance, price, authenticity, and meal
pace affect perceived service quality.
H3: Factors of tangibles, reliability, responsiveness,
empathy, assurance, price, authenticity, and meal
pace affect perceived product quality.
H4: Factors of tangibles, reliability, responsiveness,
empathy, assurance, price, authenticity, and meal
pace affect guest satisfaction.
H5: Guest satisfaction is indirectly affected by factors
tangibles, reliability, responsiveness, empathy,
assurance, price, authenticity, and meal pace
through the mediation of perceived service
quality and perceived product quality.
III. METHODOLOGY
A. Research Methodology and Sample
This research applied quantitative approach which
dealt with statistical, mathematical, and computational
techniques.
Respondents of this research were chosen from the Ho
Chi Minh City population who dined in luxury
restaurants in Ho Chi Minh City. In this study, there were
52 measured items measuring the independent variables
including tangibles, reliability, responsiveness, empathy,
assurance, price, authenticity, and meal pace and 20 items
measuring the dependent variables of perceived service
quality, perceived product quality, and guest satisfaction.
In order to ensure the validity and reliability of the
research variables, the sample size of this research was
360 (n = 360) with the ratio of 7:1.
B. Research Instrument and Data Collection
The research questionnaire design was mainly based
on the 5-point Likert scale items where 1 = strongly
disagree; 2 = disagree; 3 = neutral; 4 = agree and 5 =
strongly agree. The second part of questionnaire included
questions about the demographic information.
Data Collection: Researcher came and asked for
luxury restaurant manager’s permission to deliver
questionnaires to guests in restaurants. If researchers got
the permission of the managers, then questionnaires
would be directly delivered to guests with directions to
help them provide correct answers.
C. Factor Analysis and Reliability
Two exploratory factor analyses were conducted using
the principal component extraction method and varimax
rotation of 20 measured items of the group of dependent
variables of guest satisfaction, perceived service quality,
and perceived product quality and 52 items of the group
of independent variables related to the factors influencing
guest satisfaction. The data was screened by examining
the descriptive statistics on each item before running the
analysis with the SPSS. In this study, the factor analysis
procedure was applied twice; once for the group of
independent variables with 8 variables, and again for the
group of dependent variables, including 3 variables.
According to [39], to be significant, the Kaiser-Meyer-
Olkin Measure of Sampling Adequacy (KMO) value has
to be .60 or above. As the results, the Kaiser-Meyer-
Olkin Measure of Sampling Adequacy (KMO) value
was .856 for the group of independent variables and .777
for the group of dependent variables that above the value
of .60, indicating that the present data was suitable for
principal components analysis. Similarly, Bartlett’s test
of sphericity [40] was significant (p<.001), indicating
sufficient correlation between the variables to proceed
with the analysis.
TABLE I. SUMMARY OF INDEPENDENT VARIABLES WITH
RELIABILITY COEFFICIENTS
Given name Number of items Alpha
Meal pace Pre and In-process (PRENIN) 5 .831
Meal pace Post-process (POSPRO) 4 .830
Assurance (ASSUR) 4 .784
Price (PRICE) 4 .797
Responsiveness and Empathy (RESNEM) 4 .750
Tangibles (TAN) 4 .701
Reliability (RELIA) 3 .713
Using the Kaiser-Guttman’s retention criterion of
Eigenvalues greater than 1.0, only seven components
have Eigenvalue that were greater than 1. These seven
factors accounted for 64% of the total variance. There
was a mergence of responsiveness and empathy variables
into a new variable named responsiveness and empathy in
this study. There was also a separation of Meal pace
variable into two factors of meal pace pre-and-In-process
and meal pace post-process. The Cronbach’s coefficients
ranged from .701 to .831 among the seven factors
indicating good subscale reliability as shown in Table I
above.
Additionally, a three-factor solution provided clearest
extraction for the group of dependent variables including
20 items. These three components accounted for 52.3%
Journal of Advanced Management Science Vol. 3, No. 4, December 2015
©2015 Engineering and Technology Publishing 286
of the total variance. The Cronbach’s coefficients ranged
from .784 to .831 among the three factors indicating good
subscale reliability as shown in Table II below.
TABLE II. SUMMARY OF DEPENDENT VARIABLES WITH RELIABILITY
COEFFICIENTS
Given name Number of items Alpha
Perceived Product Quality
(PERPROQUA) 5 .831
Guest satisfaction (GUESATIS) 5 .830
Perceived Service Quality
(PERSERQUA) 3 .784
The present seven-factor model and three-factor model
of this study were deemed the best solution because of
their conceptual clarity and ease of interpretability.
IV. RESULT
A. Characteristics of Respondents
TABLE III. DEMOGRAPHIC
Frequency Percentage
Gender - Male 176 48.9
- Female 184 51.1
Total 360 100.0
Marital Status
- Single 176 48.9
- Married 184 51.1 Total 360 100.0
Age
- 18-25 42 11.7 - 25-35 154 42.8
- 35-45 110 30.6 - 45-55 46 12.8
- >55 8 2.2
Total 360 100.0
B. Factors Affect Guest Satisfaction
Pearson Product-moment Correlation Coefficients (r)
were employed in order to find out which factors had
relationship with guest satisfaction variable.
TABLE IV. CORRELATIONS OF THE GUESATIS MODEL
GUES
ATIS
1 2 3 4 5 6 7 8
1. PRENIN .547*
2. POSPRO .347* .503*
3. ASSUR .434* .333* .386* 4. PRICE .499* .406* .237* .317*
5. RESNEM .570* .512* .232* .341* .373*
6. TAN .314* .341* .395* .347* .237* .235*
7. RELIA .503* .370* .281* .513* .321* .400* .377*
8.PERPROQUA .331* .212* .202* .418* .419* .147* .253* .285*
9.PERSERQUA .375* .284* .451* .339* .208* .172* .476* .336* .373*
Mean 3.70 3.73 4.01 3.96 3.59 3.38 3.87 3.69 4.01
SD. .482 .534 .563 .555 .609 .569 .506 .502 .481
Note: * Significant level at p < .001
Table IV shows that there were significant
relationships between dependent variable of guest
satisfaction (GUESATIS) and all independent variables.
There were substantially positive correlations between
PRENIN and GUESATIS (r = .547, p < .001), RESNEM
and GUESATIS (r = .570, p < .001), and RELIA and
GUESATIS (r = .503, p < .001) that means the better
service activities in meal pace preprocess and in-process
leaded the higher guest satisfaction in luxury restaurants.
Furthermore, the variables of POSPRO, ASSUR, PRICE,
TAN, PERPROQUA, and PERSERQUA were
moderately correlated with GUESATIS (r = .347, p
< .001), (r = .434, p < .001), (r = .499, p < .001), (r = 314,
p < .001), (r=.331, p<.001), and (r=.375, p<.001)
respectively. That means the better services in the meal
pace post-process, assurance, price, tangibles, perceived
product quality, and perceived service quality also leaded
to the higher level of guest satisfaction.
In order to explore the direct effects of the independent
and intervening variables on the guest satisfaction, the
result of multiple regression analyses showed that the
guest satisfaction was directly affected by PERSERQUA
(β = .252, p < .001), RESNEM (β = .229, p < .001),
PERPROQUA (β = .222, p < .001), RELIA (β = .183, p
< .001), PRENIN (β = .177, p < .001), PRICE (β = .171,
p < .001), and ASSUR (β = .078, p < .050). This means
that every 1-standard deviation increase in perceived
service quality, responsiveness and empathy, perceived
product quality, reliability, meal pace pre-and-in-process,
price, and assurance (β = .078, p < .050) would lead to an
increase in guest satisfaction
by .252, .229, .222, .183, .177, .171 and .078 units
respectively when other factors were kept unchanged.
C. Factor Analysis and Reliability
The indirect effect of an independent variable on the
dependent variable through the intervening variable was
the total product of the effects of that independent
variable on the intervening variables and the effect of the
intervening variable on the dependent variable of guest
satisfaction [41].
1) Perceived service quality
As the result of multiple regression analysis of the
group of independent variables and the dependent
variable of PERSERQUA, the factors of tangibles, meal
pace post-process, and reliability significantly affect
PERSERQUA with (β = .336, p < .001), (β = .280, p
< .001), (β = .131, p < .001), respectively. Meanwhile,
PERSERQUA significantly affected GUESATIS with (β
= .252, p < .001). Therefore, the factors of tangibles, meal
pace post-process, and reliability created an indirect
effect on guest satisfaction through mediating variable of
perceived service quality at (.085), (.033), and (.033),
respectively.
2) Perceived product quality
The result of multiple regression analysis between the
group of independent variables and PERSERQUA
indicated the factors of assurance, price, and
responsiveness and empathy significantly affected
PERSERQUA with (β = .226, p < .001), (β = .226, p
< .001), (β = -.096, p < .001), respectively. In addition,
GUESATIS was significantly affected by PERSERQUA
with (β = .222, p < .001). Therefore, the factors of
assurance, price, and responsiveness and empathy created
an indirect effect on guest satisfaction through mediating
Journal of Advanced Management Science Vol. 3, No. 4, December 2015
©2015 Engineering and Technology Publishing 287
variable of perceived product quality at (.059), (.059),
and (-.021) respectively.
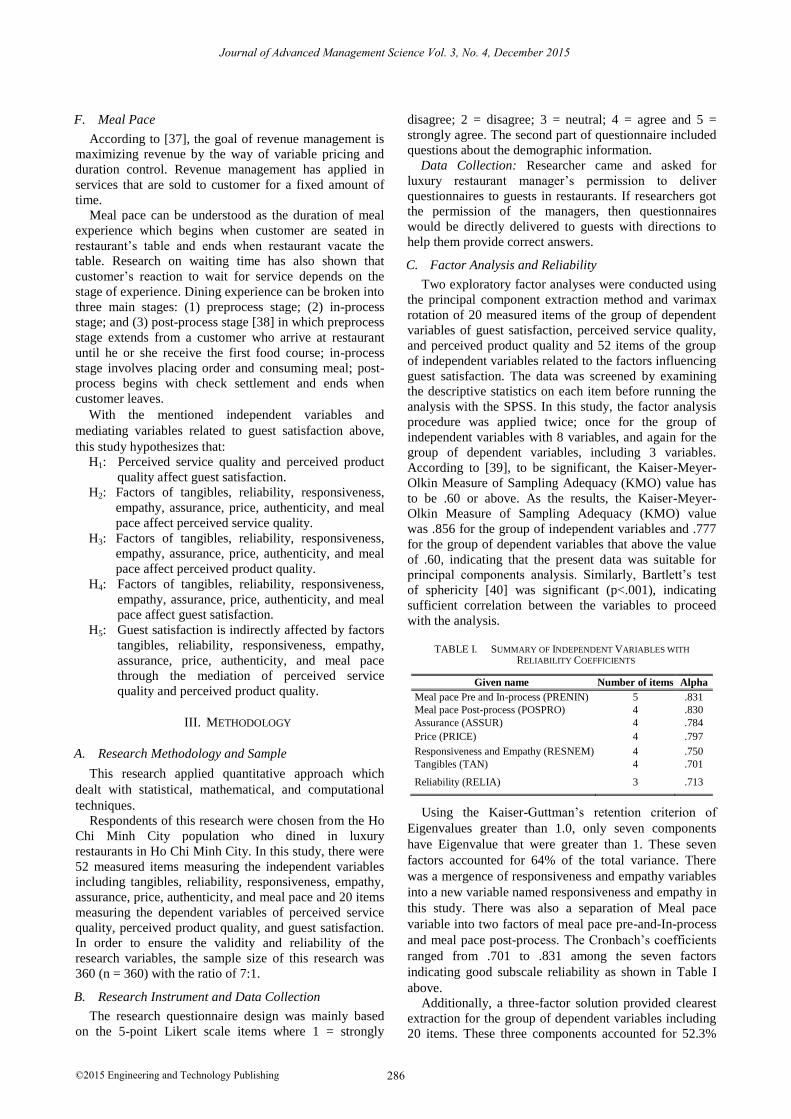
D. Path Diagram of Guest Satisfaction
Figure 1. Path coefficients of the GUESATIS model.
Note: All coefficients in the model were significant at the .05 level.
The path analysis was performed to find out the direct
and indirect effects of the independent variables on the
dependent variable of this research. The total effect of
one variable on GUESATIS can be divided into direct
effects and indirect effects. The direct effect of an
independent variable on the dependent variable of
GUESATIS is a standardized regression coefficient (beta)
and is considered as a path coefficient in the path model.
E. Significance of Indirect Effects
Table V showed the results of the bootstrapping
method recommended by [41] to test the significance of
indirect effects or mediations. The output provided the
bootstrapped confidence intervals (at the 95%). If there is
a ZERO (0) lies within the interval range between the
lower boundary (LL) and the upper boundary (UL), then
we can conclude that, with 95% confidence, there is no
mediation or indirect effect. On the other hand, if zero
does not occur between the LL and the UL, then we can
conclude that, with 95% confidence, the mediation or
indirect effect is significant [42]. As can be seen in the
output of Table V, the indirect effects of ASSUR, PRICE,
RESNEM, RELIA, TAN, and POSPRO on GUESATIS
through the mediation of PERPROQUA and
PERSERQUA were estimated to lie between 0.0261 and
0.1168, 0.0126 and 0.0933, 0.0106 and 0.0657, 0.0379
and 0.1223, 0.0765 and 0.1969, and 0.0576 and 0.1701
with 95% confidence, respectively. Because zero is not in
the 95% confidence interval, we can conclude that the
indirect effects were indeed significantly different from
zero at p <.05 (two tailed) and the mediations of
PERPROQUA and PERSERQUA in this study were true.
F. Total Causal Effects on Guest Satisfaction
Table V summarizes the effects of the independent
variables together with perceived product quality and
perceived service quality on the dependent variable of
guest satisfaction. Regard to the total effect, it’s clear that
PERSERQUA (β = .252), PERPROQUA (β = .222),
RESNEM (β = .250), PRICE (β = .230), PRENIN (β
= .177), ASSUR (β = .137), and RELIA (β = .216) have
low moderated effects on GUESATIS. The total effect of
these factors on guest satisfaction was 1.602.
TABLE V. INDIRECT AND TOTAL CAUSAL EFFECT
Variables Causal Effects
LL
UL Direct Indirect Total
ASSUR .078 .059 .137 .0261 .1168
PRICE .171 .059 .230 .0126 .0933
RESNEM .229 .021 .250 .0106 .0657
RELIA .183 .033 .216 .0379 .1223
TAN - .085 .085 .0765 .1969
POSPRO - .033 .033 .0576 .1701
PRENIN .177 - .177
PERPROQUA .222 - .222
PERSERQUA .252 - .252
Total 1.312 .290 1.602
V. DISCUSSION AND RECOMMENDATIONS
A. Perceived Service Quality and Product Quality
As a results shown in Table IV, it’s clear that
perceived product quality (r = .331, p < .001) and
perceived service quality (r = .375, p < .331) were
positively correlated with guest satisfaction. The results
also showed that the higher service and product quality
leaded to higher level of guest satisfaction. These results
were consistent with many previous studies identifying
the relationship between perceived service quality,
perceived product quality and guest satisfaction [29]-[31],
[43]. According to the regression analysis, service quality
and product quality were found to directly influence to
guest satisfaction. From that, some recommendations for
restaurant will be given.
Luxury restaurant owners and managers should
concentrate on enhancing service quality in luxury
restaurants because it is the factor which directly affects
guest satisfaction. In order to improve the first item of
service quality which regard to the facilities of luxury
restaurant, the owners should equip their restaurants with
high quality and aesthetic facilities.
In addition, physical environment also plays an
important role in making decision to choose a restaurant
due to reasons for dining. For example, restaurant has
romantic physical environment will be the best choice for
love couple or family dining on special occasion;
restaurants with the décor formal, courteous can be the
best choice for business man who want to find a place for
dining with their partner, their important customers, etc..
Therefore, a restaurant physical environment should be
decorated with a completely penetrated stylish idea but
still suitable with variety of guests’ dinning reasons. For
instance, a restaurant can be decorated with the peaceful
and mild atmosphere of Northern Europe countries;
however, there are special areas that serve for each guest’
dinning reasons. On the other hand convenience level is
also a concern of guests. Guests prefer eating in a
restaurant with convenient location rather than trying to
look for a special restaurant with the location which is
difficult to find. From that, restaurant owners should pay
Journal of Advanced Management Science Vol. 3, No. 4, December 2015
©2015 Engineering and Technology Publishing 288
attention to the area they want to allocate their restaurants.
They should hire places which are easy to find with many
people who live and work nearby. One more thing, the
décor of restaurant’s atmosphere should be appropriate
with the foods restaurant provides. It means that if
restaurant specialize in Japanese foods, the décor should
have color of Japan. Some guests in Ho Chi Minh City
complained that they sometimes have dining in Italian
restaurants, Japanese restaurants, Korean restaurants, etc;
however they find difficult to see facilities or accessories
that have special color of a country.
Secondly, the product that restaurants deliver to guest
is primary foods. Appetizing is the first criteria to
evaluate a dish. Restaurant’s owner, manager, chef have
to find ways to modify, adjust and enhance the taste of
foods more and more to satisfy all guest’s taste for both
local guests and guests coming from other places. Food
serving size and sanitary should also be paid attention.
One way to know the opinion of guests, restaurant can
design a small measurement with some questions about
foods of restaurant. Then, give it to guests when they
finish meal and wait for payment.
Moreover, according to some comments of guests,
restaurants should invest to develop more new foods and
special foods of restaurant. That means there are some
foods, customers just enjoy if only they come to a
particular restaurant. The special foods will remind guest
to remember a restaurant’s name as well as attract guest
to come back with more people.
B. Independent Variables
According to the results, assurance had direct impact
on both perceived product quality and guest satisfaction.
Moreover, these findings indicated not only the existence
of a negative effect of responsiveness and empathy on
perceived product quality at the β = -.096 but also direct
effect on guest satisfaction with the β = .229. Comparing
with the results of the research of [44] that concluded in
their research that “responsiveness” a dimension of
service quality was the most important to customers with
the attributes of employees including whether employees
were prompt, courteous, knowledgeable, helpful,
understand customer’s needs, attentive, and neat in
appearance, it’s easy to find out some resemble attributes,
although, the factor responsiveness and empathy were
merged into the only one factor of responsiveness and
empathy. Responsiveness and empathy was one of the
factors providing strongest effect on guest satisfaction
with β = .250 just less than perceived service quality.
With the negative effect, responsiveness and empathy
contributed a part of prediction of guest satisfaction
through the mediation of perceived product quality.
Guests perceived that restaurants employees did not
perform well enough. The employees might not
understand well guest’s need, their queries about
restaurant’s service as well as foods. Some objectives
reasons such as rush hour, crowded customers, or lack of
employees that caused the employees’ late response to
guest’s requests. Another reason which leaded to the
negative impact of responsiveness and empathy of the
employees might be the language barrier when the
restaurant’s employees communicate with foreign guests
using their second languages. They might not understand
clearly what guest say and did not have enough foreign
language skills to explain clearly and deeply to guest
about restaurant’s special foods, drinks as well as service.
Furthermore, the empirical results illustrated that
preprocess stage and in-process stage had direct impact
on guest satisfaction, even though they were merged into
one factor. Post-process did not affect to guest
satisfaction directly; nevertheless, they provided direct
effect on perceived service quality and contributed an
indirect impact on guest satisfaction which was supported
by [45] who found that the perception of respondents
about the pace of dining experience affected their
satisfaction. Their results also indicated that the guests
had greater tolerance for the fast pace in the post-process
stage rather than pre-process and in-process stage. In
addition, customers in fine-dining restaurants are more
sensitive with the meal pace than the ones in other kinds
of restaurant.
Based on the empirical findings of this research, it is
essential to develop an appropriate program and provide
on-going training on the various attributes that guests
concern such as: skills for serving, speeding up checking
settlement, knowledge about foods, beverages, wines
served in restaurant, experience, understand guest’s
specific needs, attentive to strengthen employee’s ability
and improve service quality as well as product quality of
luxury restaurants. Moreover, it’s necessary to encourage
the employees to report and assess their performance
themselves every week as well as restaurant’s manager
keep track their performance to have the directions to
improve service quality of restaurant. Furthermore, it
needs to have a prize or reward for the best employees in
each month to commend their performance and motivate
them continue to keep the achievements as well as
impulse the other employee’s effort. Besides that, in
order to improve the meal pace activities, restaurateur can
reduce efforts on post-process stage by speeding up check
settlement and departure. The restaurateurs can use
handheld devices for printing bill and process the credit
or debit card at the table that save time for both
restaurant’s employees and guests.
Reference [44] also proved that price was an important
factor in influencing guest satisfaction. However, the
negative β value of price suggests that when the price is
not in accordance with the customer’s expectation, the
satisfaction level declines. Fortunately, the result shown
in this research of β value was positive for both direct and
indirect effect on guest satisfaction towards luxury
restaurants in Ho Chi Minh City. That means there is
correlation between price and guest’s expectation about
both product and service quality. In order to make guests
feel more satisfied, restaurant’s manager and other
department in restaurant management board should
discuss and design closed/VIP guest programs which give
discount for guest who come to restaurant regularly. The
discount is also applied for guest who reserves the table
for five people or more. Besides that some promotion
Journal of Advanced Management Science Vol. 3, No. 4, December 2015
©2015 Engineering and Technology Publishing 289
programs should be offered by restaurants to attract
guests come. Although offering discount, the quality of
products and services must continuously keep improved
to motivate guests to recommend their friends, partner,
and family to go to the restaurants.
Lastly, reference [46] found that reliability and
tangibles affected service quality and guest satisfaction.
However, with the standardized loadings value, the
reliability is a little more important than tangibles that
was contrast with the result of this study that provided
reliability with β = .131 which is smaller than tangibles
with β = .336. According to the result of the research,
tangibles in restaurant are evaluated based on background
music, lighting, kind of payments and table settings.
Although they have no direct impact on guest satisfaction,
they played a crucial part in perceived service quality.
Comfortable lights, enjoyable music and right dining hall
temperature can make a guest comfortable [32]. To
enhance the level of guest satisfaction, restaurateurs
should conduct a small survey or ask guest’s opinion to
modify, adjust music background, lighting, table settings
as much suitable as possible.
VI. CONCLUSIONS
All of research objectives have been obtained. At first,
identify which factor had effect on perceived service
quality, perceived product quality and guest satisfaction.
Secondly, evaluate the direct and indirect effects of the
independent variables on main dependent variable of
guest satisfaction through perceived service quality and
perceived product quality. Then, give recommendations
for luxury restaurants in order to improve service quality
and product quality better and better.
The applications of multivariate statistical techniques
allow researcher to exert the causal relationship between
variables of the model with factor analysis, multiple
regression analysis, and path analysis. Based on the
review of literature and empirical findings of this
research, the explanations and suggestions were given.
Bivariate correlations and Pearson product-moment
correlation coefficients were used to explore that
relationship and its strength between each independent
variable and guest satisfaction as well as between guest
satisfaction and mediating variables of perceived service
quality and perceived product quality. The direct and
indirect impacts were also discussed and explained in
order to reach all of research objectives and had evidence
for hypotheses. Generally, this research gives theoretical
and practical results that contribute to the field of
consumer behavior and customer relationship
management.
Future researchers should consider other important
factors that create guest satisfaction or satisfy the guests
whose main purpose to transact their business or to enjoy
time with their cherished people (family, friends, spouse,
etc.) rather than assuming the primary reasons for guests
coming to luxury restaurant are for their meals.
REFERENCES
[1] J. Fierman, “The death and rebirth of the salesman,” Fortune, pp.
80-90, July 25, 1994.
[2] N. F. Awara and J. A. Anyadighibe, “The relationship between customer satisfaction and loyalty: A study of selected eateries in
calabar, cross,” Interdisciplinary Journal of Contemporary
Research in Business, vol. 5, no. 9, pp. 110-125, 2014. [3] I. Khan, “Impact of customer satisfaction and customer retention
on customer loyalty,” International Journal of Scientific and Technology Research, vol. 1, no. 2, pp. 106-110, 2012.
[4] C. Pedro, S. Vilares, and J. Manuel, “Measuring the return of
quality investments,” Total Quality Management & Business Excellence: An Official Journal of the European Society for
Organizational Excellence, vol. 21, pp. 21-42, 2010. [5] A. H. Westlund, G. Christina, L. Elisabeth, and M. Bo, “On
customer satisfaction and financial results in the Swedish real
estate market,” Total Quality Management, vol. 16, no. 10, pp. 1149-1159, 2005.
[6] A. Kazemi, V. M. P. Emami, A. Abbaszadeh, and J. Pourzamani, “Impact of brand identity on customer loyalty and word of mouth
communications, considering mediating role of customer
satisfaction and brand commitment,” (Case Study: Customers of Mellat bank in Kermanshah), International Journal of Academic
Research in Economics and Management Sciences, vol. 2, no. 4, pp. 1-14, 2013.
[7] Lymperopoulos and Chaniotakis, “Price satisfaction and personnel
efficiency as antecedents of overall satisfaction from consumer credit products and positive word of mouth,” Journal of Financial
Services Marketing, vol. 13, no. 1, pp. 63-71, 2008. [8] T. O. Jones and W. E. Sasser Jr., “Why satisfied customer
defects?” Havard Business Review, vol. 73, no. 11/12, pp. 88-99,
1995. [9] R. L. Papiernick, “As sales increase $14.8B, battle for share to
intensify,” Nation's Restaurant News, pp. 35-36, January 1, 1996.
[10] J. H. Lee and J. Hwang, “Luxury marketing: The influences of
psychological and demographic characteristics on attitudes toward
luxury restaurants,” International Journal of Hospitality Management, vol. 30, pp. 658-669, 2011.
[11] J. A. Howard and N. S. Jagdish, The Theory of Buyer Behavior, New York: Wiley, 1969.
[12] R. L. Oliver, “Measurement and evaluation of satisfaction process
in retail setting,” Journal of Retailing, vol. 57, pp. 25-48, 1981. [13] R. L. Oliver, Satisfaction: A Behavioral Perspectives on the
Consumer, New York: Mc Graw-Hill, 1997. [14] W. M. Pride and O. C. Ferrell, Marketing, NewYork, 2000.
[15] A. Parasuraman, V. A. Ziethaml, and L. L. Berry, “Servqual: A
multi-item scale for measuring customer perceptions of service,” Journal of Retailing, vol. 64, no. 1, pp. 12-40, 1988.
[16] V. A. Zeithaml, “Consumer perceptions of price, quality, and value: A means-end model and synthesis of evidence,” Journal of
Marketing, vol. 52, no. 3, pp. 2-22, 1988.
[17] J. Kandampully, “Service quality to service loyalty: A relationship
which goes beyond customer services,” Total Quality
Management & Business Excellence, vol. 9, no. 6, pp. 431-443, 1998.
[18] K. E. Clow, “Building a competitive advantage for service firms,”
International Journal of Service Marketing, vol. 7, no. 1, pp. 22-32, 1993.
[19] A. Parasuraman, V. A. Ziethaml, and L. L. Berry, “A conceptual model of service quality and its implications for future research,”
Journal of Marketing Research, vol. 41, pp. 9-41, 1985.
[20] J. M. Carman, “Consumer perceptions of service quality: An assessment of the SERVQUAL dimensions,” Journal of Retailing,
vol. 66, no. 1, pp. 33-55, 1990. [21] R. Ladhari, “A review of twenty years of SERVQUAL research,”
International Journal of Quality and Service Sciences, vol. 1, no.
2, pp. 172–198, 2009. [22] S. Robbinson. “Measuring service quality, current thinking and
future requirements,” Marketing Intelligence and Planning, vol. 17, no. 1, pp. 21-32, 1999.
[23] S. Markovic and S. Raspor, “Measuring perceived service quality
using servqual: A case study of the Croatian hotel industry,” Management, vol. 5, no. 3, pp. 195-209, 2010.
[24] Y. L. Lee and N. Hing, “Measuring quality in restaurant operations: An application of the SERVQUAL instrument,”
Journal of Advanced Management Science Vol. 3, No. 4, December 2015
©2015 Engineering and Technology Publishing 290
International Journal of Hospitality Management. vol. 14, no. 3, pp. 293-310, 1995.
[25] R. Kisang and S. Cheong Jang, “DINESCAPE: A scale for
customers' perception of dining environments,” Journal of Foodservice Business Research, vol. 11, no. 1, pp. 2-22, 2008.
[26] A. Parasuraman, V. A. Zeithaml, and L. L. Berry, “Alternative scales for measuring service quality: A comparative assessment
based on psychometric and diagnostic criteria,” Journal of
Retailing, vol. 70, no. 3, pp. 201-230, 1994. [27] R. E. Winder and D. K. Judd, “Organizational orienteering:
Linking deming, covey, and senge in an integrated five dimension quality model,” ASQC Seventh National Quality Management
Conference Transactions. American Society for Quality, 1996.
[28] R. B. Chavan, Manual on Quality Assurance for Khadi. Mahatma Gandhi Institute of Rural Industrialization a Collaborative Project
of KVIC and IITD, 2003. [29] L. T. Bei and Y. C. Chiao, “An integrated model for the effects of
perceived product, perceived service quality, and perceived price
fairness on customer satisfaction and loyalty,” Journal of Consumer Satisfaction, Dissatisfaction and Complaining Behavior,
vol. 14, pp. 125-140, 2001. [30] J. M. Sulek and R. L. Hensley, “The relative importance of food,
atmosphere, and fairness of wait,” Cornell Hotel and Restaurant
Administration Quarterly, vol. 45, no. 3, pp. 235–247, 2004. [31] Y. Namkung and S. Jang, “Does food quality really matter in
restaurants? Its impact on customer,” Journal of Hospitality and Tourism Research, vol. 31, no. 3, pp. 387-409, 2007.
[32] N. A. Raajpoot, “A multiple item scale for measuring tangible
quality in foodservice industry,” Journal of Foodservice Business Research, vol. 5, no. 2, pp. 109–127, 2002.
[33] V. A. Zeithaml, “Consumer perceptions of price, quality, and value: A means-end model and synthesis of evidence,” Journal of
Marketing, vol. 52, no, 3, pp. 2-22, 1988.
[34] P. Kotler and G. Armstrong, Principles of Marketing, vol. ED-13, New Jersey: Prentice Hall, 2010.
[35] H. Andreas, X. Lan, B. M. Kent, and H. Frank, “The influence of price fairness on customer satisfaction,” Journal of Product and
Brand Management, vol. 16, no, 1, pp. 49–58, 2007.
[36] A. G. Bedeian, “Consumer perception of price as an indicator of product quality,” MSU Business Topic, 1971.
[37] S. E. Kimes and R. B. Chase, “The strategic levers of yield management,” Journal of Service Research, vol. 1, no. 2, pp. 156-
66, 1998.
[38] L. Dube-Rioux, B. H. Schmitt, and F. Leclerc, “Customer's reaction to waiting: When delays affect the perception of service
quality,” Advances in Consumer Research, vol. 16, no. 1, pp. 59-63, 1989.
[39] P. Julie, SPSS Survival Manual: A Step by Step Guide to Data
Analysis Using SPSS Version 12, 2nd ed. Buckingham: Open University Press, 2005.
[40] D. A. De Vaus, Surveys in Social Research, 5th ed. Sydney: Allen and Unwin, 2002.
[41] J. K. Preacher and A. F. Hayes, “Asymptotic and resampling
strategies for assessing and comparing indirect effects in multiple mediator models,” Behavior Research Methods, vol. 40, no. 3, pp.
879-891, 2008. [42] J. K. Preacher and A. F. Hayes, “SPSS and SAS procedures for
estimating indirect effects in simple mediation models,” Behavior
Research Methods, Instruments, and Computers, vol. 36, no. 4, pp. 717-731, 2004.
[43] J. J. Cronin Jr., M. K Brady, and G T. M. Hult, “Assessing the effects of quality, value and customer satisfaction on consumer
behavioral intentions in service environment,” Journal of
Retailing, vol. 76, no. 2, pp. 193-218, 2000. [44] S. A. Syed and C. Carolyn, “Customer satisfaction in the
restaurant industry: An examination of the transaction-specific model,” The Journal of Services Marketing, vol. 20, no. 1, pp. 3-
12, 2006.
[45] B. M. Noone, S. E. Kimes, A. S. Mattila, and J. Wirtz, “The effect of meal pace on customer satisfaction,” Cornell Hotel and
Restaurant Administration Quarterly, vol. 48, no. 3, pp. 231-245, 2007.
[46] Q. Hong and V. R. Prybutok, “Determinants of customer-
perceived service quality in fast-food restaurants and their relationship to customer satisfaction and behavioral intentions,”
The Quality Management Journal, vol. 15, no. 2, pp. 35-50, 2008.
Khuong Mai Ngoc (PhD.)
is a lecturer and
researcher of School of Business
Administration –
International University –
VNU-HCM. He has bachelor degree in Tourism
and Hospitality Management, Master of
Science degree in Leisure, Tourism and Environment at Wageningen University –
The
Netherlands, and PhD degree in Development
Management at School of Public Administration of the National Institute of
Development Administration (NIDA), Bangkok
–
Thailand.
Tran Uyen Tran (BA) is a research assistant of
School of Business Administration –
International University –
Vietnam National
University –
Ho Chi Minh.
Journal of Advanced Management Science Vol. 3, No. 4, December 2015
©2015 Engineering and Technology Publishing 291