137


Factors Affecting U.S.
Petroleum Refining
Impact of New Technology September 1973
Prepared by the National Petroleum Council's Committee
on Factors Affecting U.S. Petroleum Refining
Orin E. Atkins, Chairman
with the Assistance of the Coordinating Subcommittee George Holzman, Chairman
NATIONAL PETROLEUM COUNCIL
H. A. True, Jr., Chairman
Robert G. Dunlop, Vice Chairman
Vincent M. Brown, Executive Director
Industry Advisory Council to the
U.S. DEPARTMENT OF THE INTERIOR
Rogers C. B. Morton, Secretary
Stephen A. Wakefield, Assistant
Secretary for Energy and Minerals
Duke R. Ligon, Director,
U.S. Office of Oil and Gas
All Rights Reserved
Library of Congress Catalog Card Number: 73-84033 © National Petroleum Council 1973
Printed in the United States of America
Preface
On February 9, 1972, the National Petroleum Council, an officially established industry advisory body to the Secretary of the Interior, was requested by the Assistant Secretary of the Interior-Mineral Resources to undertake a survey of the factors-economic, governmental, technological and environmental-which affect the ability of domestic refining capacity to respond to demands for essential petroleum products. The Assistant Secretary asked that the Council's report discuss those elements which are considered essential to the development of domestic refining capacity. A copy of the request letter is included as Appendix 1 .
In response to this request, the National Petroleum Council established a Committee on Factors Affecting U.S. Petroleum Refining under the chairmanship of Orin E. Atkins, Chairman of the Board, Ashland Oil, Inc., and the cochairmanship of Hon. Stephen A. Wakefield, Assistant Secretary of the Interior for Energy and Minerals. The Committee was assisted by a Coordinating Subcommittee, chaired by George Holzman, General Manager, Refineries, Shell Oil Company. (For a listing of members of the Committee and its subcommittees, see Appendix 2 . )
This report, Factors Affecting U.S. Petroleum Refining-Impact of New Technology, i s designed to call attention to those technological factors and issues which have affected domestic refining in the past 25 to 30 years . The report was prepared as part of the work of the Facilities and Technology Task Group, George F. L. Bishop, Chairman, and was coordinated by A. S. Lehmann, General Manager of Research, Organization and Facilities, Shell Development Company.
The full results of the Committee's investigation of all the factors affecting U.S. petroleum refining are presented in a separate volume and are also available in summary form in Factors
Affecting U.S. Petroleum Refining-A Summary.
In 1967, the National Petroleum Council published a report entitled, Impact of New Technology
on the U.S. Petroleum Industry 1946-1965, at the request of the Department of the Interior. That report documented the technical advances made through that 20-year period. While in the course of preparing the 1 973 NPC report, Factors Affecting U.S. Petroleum Refining, it became apparent to the NPC Committee on Factors Affecting U.S. Petroleum Refining that many technological changes had occurred since 1965 and that an update of "Part 11-Impact of New Technology on U.S. Petroleum Refining" was in order.
The update is limited to Part II of the original report (Chapters Eight through Fifteen) . Part I covering exploration, production and transportation-pipelines, terminals and tankers-( Chapters One through Seven) is not treated.
Table of Contents
Part One-Summary ------------------------------------------------------------------------------------------------------------------ 3
Part Two-Impact of New Technology
Chapter One-Product Quality Improvement 1 1
Chapter Two-Refining Techniques -------------------------------------------------------------------------------------- 37
Chapter Three-Refinery Efficiency -------------------------------------------------------------------------------------- 63
Chapter Four-Refinery Personnel ---------------------------------------------------------------------------------------- 75
Chapter Five-Storage and Transportation -------------------------------------------------------------------------- 83
Chapter Six-Petroleum Products Demand -------------------------------------------------------------------------- 93
Chapter Seven-Technical Aspects of Government and Community Relations ------------------ 101
Appendices
Appendix 1-Study Request Letter -------------------------------------------------------------------------------------- 1 13
Appendix 2-List of Committee M(il1lbers -------------------------------------------------------------------------- 1 15
Appendix 3-Review of Federal, State and Local Fuel Sulfur Regulations ------------------------ 121
Glossary -------------------------------------------------------------------------------------------------------------------------------------- 137

Part One
Summary
Summary
The period following the conclusion of World War II has been a period of rapid· growth and momentous change in the petroleum refining industry. This era has been marked by two primary characteristics. The first is rapid technological advancement which resulted in the abandonment of the mainstay refinery techniques of the 1930's. In their place, a host of new processes, generally catalytic in nature, has arisen. Included in these new processes are catalytic cracking, catalytic reforming, alkylation, light hydrocarbon (C4) isomerization and distillate hydrotreating. The use of these processes has succeeded in producing larger volumes of higher quality products in the gasoline, kerosine and furnace oil boiling ranges. More recent developments include hydrocracking and heavier hydrocarbon (C5/C6) isomerization, as well as process and catalyst improvements to the catalytic cracking and catalytic reforming processes. Processes for stack gas scrubbing and extension of the hydrotreating process to residue desulfurization have undergone extensive development, and, while they are technically feasible, their commercial suitability is yet to be established.
The second striking change is the growth in the size of individual processing units. Recently built units have capacities of up to five times the size of the largest units of the 1940's. The resultant economies of size contributed greatly to the rise in refinery productivity achieved during the post \\forld War II period. These economies and those resulting from new refinery processes, catalysts, etc., have helped to offset the continuing increase in crude oil, labor and transportation costs.
During the latter half of the 1960's, a series of new social and economic changes arose which began to influence trends in the industry. Specifically, the
growing shortage of low cost energy supplies, combined with the rise of environmentalism, has and will continue to impact heavily on the location and rate of industry growth, the product mix and the quality standards required for acceptance in the marketplace.
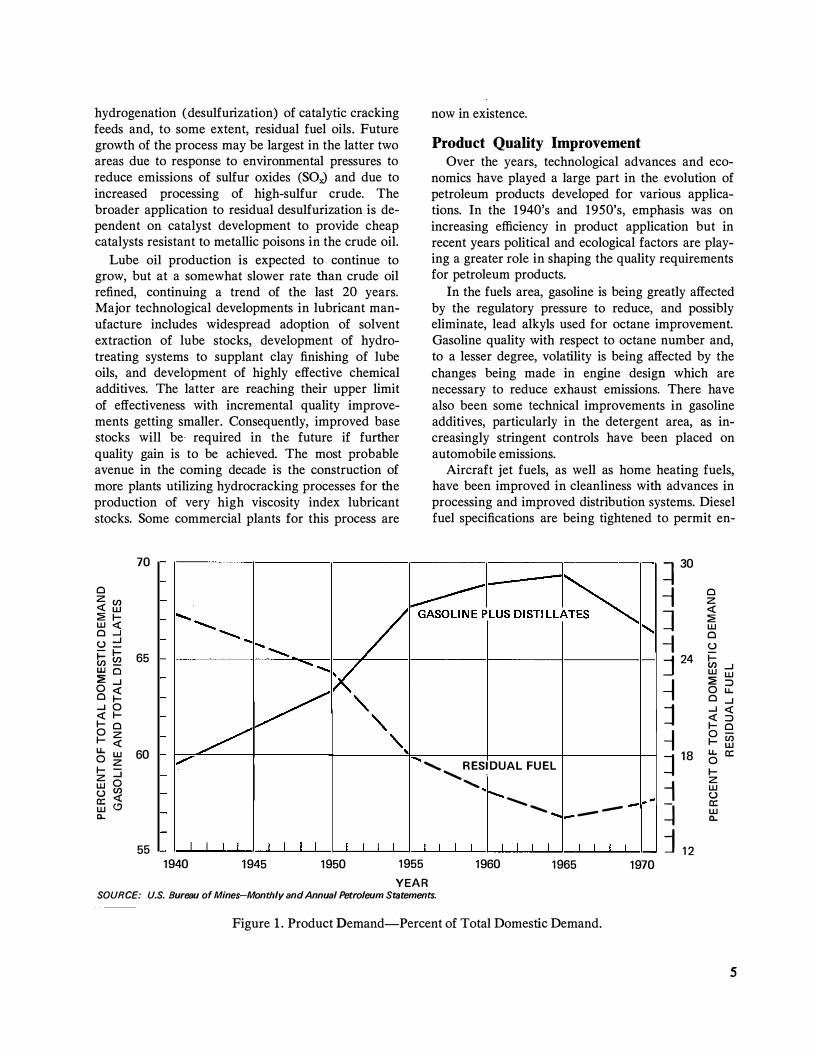
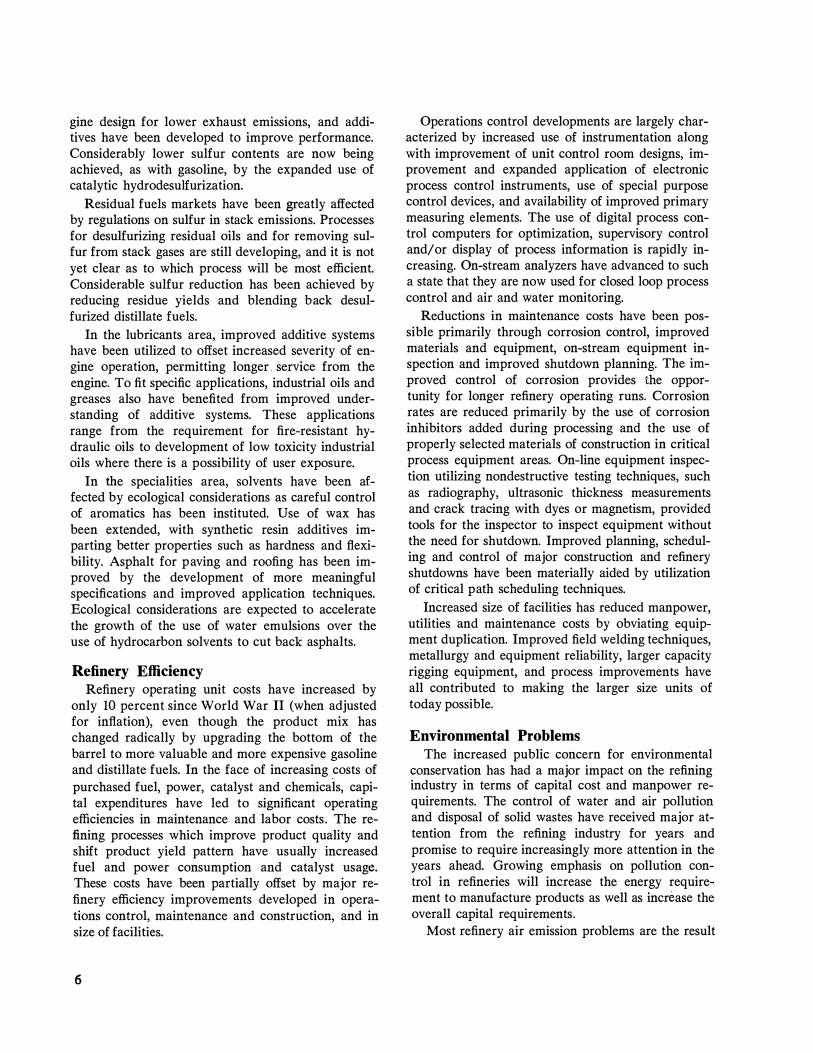
Refining Processes The need for increasing the yield of light products
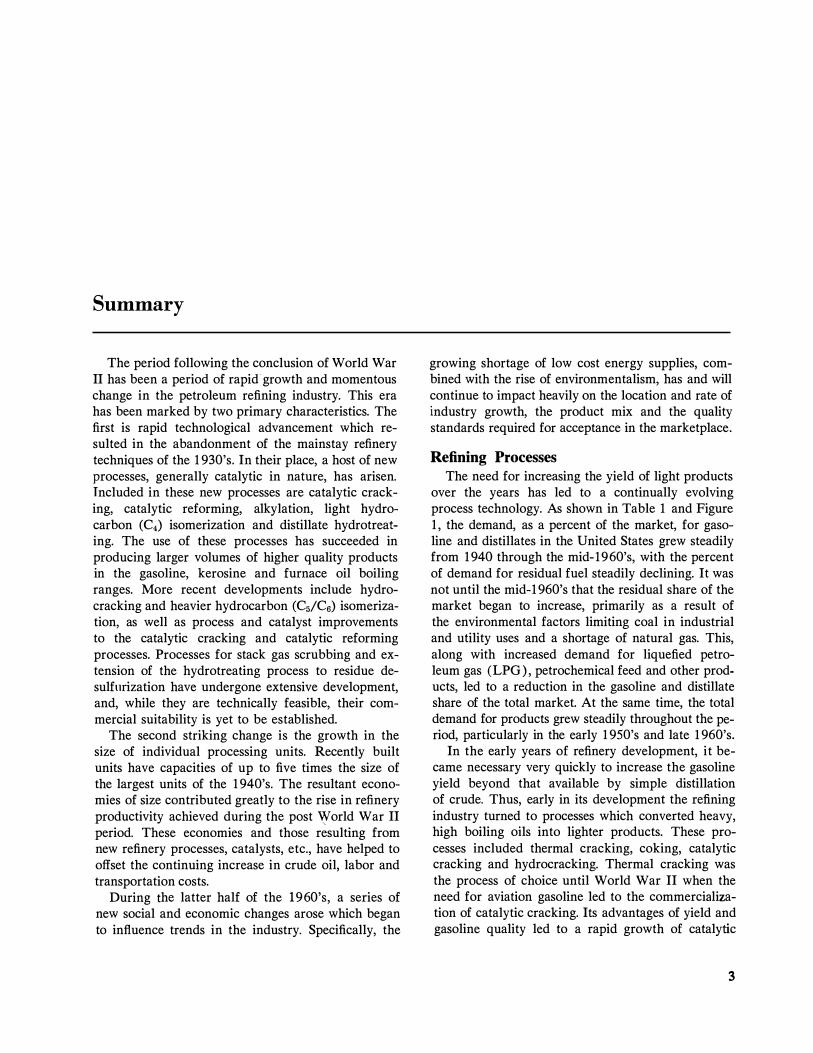
over the years has led to a continually evolving process technology. As shown in Table 1 and Figure 1, the demand, as a percent of the market, for gasoline and distillates in the United States grew steadily from 1940 through the mid-1960's, with the percent of demand for residual fuel steadily declining. It was not until the mid-1960's that the residual share of the market began to increase, primarily as a result of the environmental factors limiting coal in industrial and utility uses and a shortage of natural gas. This, along with increased demand for liquefied petroleum gas (LPG ) , petrochemical feed and other products, led to a reduction in the gasoline and distillate share of the total market. At the same time, the total demand for products grew steadily throughout the period, particularly in the early 1950's and late 1960's.
In the early years of refinery development, it became necessary very quickly to increase the gasoline yield beyond that available by simple distillation of crude. Thus, early in its development the refining industry turned to processes which converted heavy, high boiling oils into lighter products. These processes included thermal cracking, coking, catalytic cracking and hydrocracking. Thermal cracking was the process of choice until World War II when the need for aviation gasoline led to the commercialization of catalytic cracking. Its advantages of yield and gasoline quality led to a rapid growth of catalytic
3

TABLE 1
PRODUCT DEMAND-PERCENT OF TOTAL DOMESTIC DEMAND*
1 940 1 950
Gasoline 41 .0 41 .8
Distillate 1 8.5 21 .6
Total 59.5 63.4
Lubes, LPG , Asphalt and All Others 1 3.7 1 3.3
Residual 26.8 23.3 * Source: Table 23.
cracking capacity and decline in thermal cracking.
Catalytic cracking continues to be the most important conversion process used by the refining industry. While the advent of hydrocracking in the 1960's threatened to challenge the preeminence of catalytic cracking, process developments during the last 5 years (zeolite catalyst and riser cracking, for example) have led to significant improvements in process economics. At the same time, the future of hydrocracking has suffered from an anticipated increase in hydrogen costs related to shortages and price increases of the feed raw material-natural gas. A significant breakthrough in catalyst development in hydrocracking would be required to provide major yield and economics improvements.
Gasoline upgrading processes have been an integral part of the refining picture since thermal reforming made its debut in the 1930's as a means of increasing gasoline octane numbers. Beginning in the late 1940's, catalytic reforming began to supplant thermal reforming because of more favorable yields at a given gasoline quality. As demand rose for higher and higher octane numbers, fully regenerative designs were developed which permitted operation at lower pressure where yields are more favorable. More recently, the development of bimetallic catalysts, which are less sensitive to carbon deposition, has permitted operation at higher severity without serious activity decline, thus permitting a further increase in product quality. Current processes in-
4
1 955 1 960 1965 1 970 1 972
43.3 42.8 42.9 41 .4 40.7
24.4 26.0 26.5 25.4 25.6
67.7 68.8 69.4 66.8 66.3
1 4.3 1 5.4 16.4 1 8.0 1 8 .3
1 8.0 15.8 1 4.2 1 5.2 1 5.4
elude the use of swing reactors for regeneration, continuous regeneration wherein a portion of the catalyst is continuously removed for regeneration in separate equipment, and periodic regeneration during unit shutdowns.
The anticipated future trends suggest a greater dependence on catalytic reforming arising from restrictions on the use of tetraethyl lead (TEL) for octane number improvement. Certainly, catalytic reforming processes will grow at the same rate as crude capacity, and they may grow more rapidly if the need for higher octane numbers (associated with reduction of lead alkyls in gasoline) leads to the necessity to reform gasoline from the catalytic cracking unit. Future gasoline quality requirements may also lead to increased use of isomerization to upgrade octane numbers of light components. Processing options may include the use of molecular sieve recycle of normal paraffins. Alternatively, gasification or pyrolysis of light normal paraffins may be used in order to remove these low octane components from the gasoline pool.
Hydrotreating process growth has paralleled that of catalytic reforming, since the latter has made avail able large quantities of byproduct hydrogen. The process is aimed at the quality improvement of naphthas and distillates, particularly in the areas of sulfur removal, color and odor improvement, and reduction in corrosion properties and gum formation. More recently, the application has been extended to
hydrogenation ( desulfurization) of catalytic cracking feeds and, to some extent, residual fuel oils. Future growth of the process may be largest in the latter two areas due to response to environmental pressures to reduce emissions of sulfur oxides (SOx) and due to increased processing of high-sulfur crude. The broader application to residual desulfurization is dependent on catalyst development to provide cheap catalysts resistant to metallic poisons in the crude oil.
Lube oil production is expected to continue to grow, but at a somewhat slower rate than crude oil refined, continuing a trend of the last 20 years. Major technological developments in lubricant manufacture includes widespread adoption of solvent extraction of lube stocks, development of hydrotreating systems to supplant clay finishing of lube oils, and development of highly effective chemical additives. The latter are reaching their upper limit of effectiveness with incremental quality improvements getting smaller. Consequently, improved base stocks will be· required in the future if further quality gain is to be achieved. The most probable avenue in the coming decade is the construction of more plants utilizing hydrocracking processes for the production of very high viscosity index lubricant stocks. Some commercial plants for this process are
70
Cl z en <( w � 1-w <( Cl...J u::: -�--l- en 65 en-WQ :E ...J 0<( Clf-...J 0
<( 1-1- Cl 0 z 1- <( u.. w 60 0 z 1- :::i z 0 w u en a: <( w (.!) 0..
55 1940 1945 1950 1955
now in existence.
Product Quality Improvement Over the years, technological advances and eco
nomics have played a large part in the evolution of petroleum products developed for various applications. In the 1940's and 1950's, emphasis was on increasing efficiency in product application but in recent years political and ecological factors are playing a greater role in shaping the quality requirements for petroleum products.
In the fuels area, gasoline is being greatly affected by the regulatory pressure to reduce, and possibly eliminate, lead alkyls used for octane improvement. Gasoline quality with respect to octane number and, to a lesser degree, volatility is being affected by the changes being made in engine design which are necessary to reduce exhaust emissions. There have also been some technical improvements in gasoline additives, particularly in the detergent area, as increasingly stringent controls have been placed on automobile emissions.
Aircraft jet fuels, as well as home heating fuels, have been improved in cleanliness with advances in processing and improved distribution systems. Diesel fuel specifications are being tightened to permit en-
........_ RESIDUAL FUEL
...................
.................
1960 1965
--
1970
� 30
--i J -I j 24
-I j i J 18
i � j 12
Cl z <( � w Cl u i= en ...J w w :2 ::::> 0 u.. Cl ...J ...J <(
<( ::::> 1- Cl 0 en 1- w u.. a: 0 1-z w u a: w 0..
YEAR SOURCE: U.S. Bureau of Mines-Monthly and Annual Petroleum Statements.
Figure 1 . Product Demand-Percent of Total Domestic Demand.
5
gine design for lower exhaust emissions, and additives have been developed to improve performance. Considerably lower sulfur contents are now being achieved, as with gasoline, by the expanded use of catalytic hydrodesulfurization.
Residual fuels markets have been greatly affected by regulations on sulfur in stack emissions. Processes for desulfurizing residual oils and for removing sulfur from stack gases are still developing, and it is not yet clear as to which process will be most efficient. Considerable sulfur reduction has been achieved by reducing residue yields and blending back desulfurized distillate fuels.
In the lubricants area, improved additive systems have been utilized to offset increased severity of engine operation, permitting longer. service from the engine. To fit specific applications, industrial oils and greases also have benefited from improved understanding of additive systems. These applications range from the requirement for fire-resistant hydraulic oils to development of low toxicity industrial oils where there is a possibility of user exposure.
In the specialities area, solvents have been affected by ecological considerations as careful control of aromatics has been instituted. Use of wax has been extended, with synthetic resin additives imparting better properties such as hardness and flexibility. Asphalt for paving and roofing has been improved by the development of more meaningful specifications and improved application techniques. Ecological considerations are expected to accelerate the growth of the use of water emulsions over the use of hydrocarbon solvents to cut back asphalts.
Refinery Efficiency Refinery operating unit costs have increased by
only 10 percent since World War II (when adjusted for inflation), even though the product mix has changed radically by upgrading the bottom of the barrel to more valuable and more expensive gasoline and distillate fuels. In the face of increasing costs of
purchased fuel, power, catalyst and chemicals, capital expenditures have led to significant operating efficiencies in maintenance and labor costs. The refining processes which improve product quality and shift product yield pattern have usually increased fuel and power consumption and catalyst usage. These costs have been partially offset by major refinery efficiency improvements developed in operations control, maintenance and construction, and in size of facilities.
6
Operations control developments are largely characterized by increased use of instrumentation along with improvement of unit control room designs, improvement and expanded application of electronic process control instruments, use of special purpose control devices, and availability of improved primary measuring elements. The use of digital process control computers for optimization, supervisory control and/ or display of process information is rapidly increasing. On-stream analyzers have advanced to such a state that they are now used for closed loop process control and air and water monitoring.
Reductions in maintenance costs have been possible primarily through corrosion control, improved materials and equipment, on-stream equipment inspection and improved shutdown planning. The improved control of corrosion provides the opportunity for longer refinery operating runs. Corrosion rates are reduced primarily by the use of corrosion inhibitors added during processing and the use of properly selected materials of construction in critical process equipment areas. On-line equipment inspection utilizing nondestructive testing techniques, such as radiography, ultrasonic thickness measurements and crack tracing with dyes or magnetism, provided tools for the inspector to inspect equipment without the need for shutdown. Improved planning, scheduling and control of major construction and refinery shutdowns have been materially aided by utilization of critical path scheduling techniques.
Increased size of facilities has reduced manpower, utilities and maintenance costs by obviating equipment duplication. Improved field welding techniques, metallurgy and equipment reliability, larger capacity rigging equipment, and process improvements have all contributed to making the larger size units of today possible.
Environmental Problems The increased public concern for environmental
conservation has had a major impact on the refining industry in terms of capital cost and manpower requirements. The control of water and air pollution and disposal of solid wastes have received major attention from the refining industry for years and promise to require increasingly more attention in the years ahead. Growing emphasis on pollution control in refineries will increase the energy requirement to manufacture products as well as increase the overall capital requirements.
Most refinery air emission problems are the result
of combustion operations in furnaces, boilers and catalyst regeneration systems. Emissions of SOx will be reduced by a combination of more efficient fuel usage and the use of fuels having low sulfur content. Emissions of oxides of nitrogen (NOx) will be reduced by more effective fuel burning techniques such as two-stage combustion. Particulate emission problems center principally around the catalytic cracker regenerator where dust recovery devices, such as high efficiency cyclones and electrostatic precipitators, are required to meet legal restrictions.
Hydrocarbon losses to the atmosphere are largely associated with storage tank breathing, product bulk loading operations and processing leakage. There is some economic as well as environmental incentive to reduce these losses, and more widespread use of vapor conservation tankage systems and vapor recovery. systems are indicated. Processing leakage, on th� other hand, is best controlled by good housekeeping to detect and repair leaking flanges, valves and stem packing and shaft seals. More widespread use of mechanical seals has reduced rotating shaft leakage from pumps and compressors.
Refinery water effluent problems are related to the presence of oil, treating chemicals and trace contaminants picked up by process water in the course of refining. Alleviation techniques include sour water stripping to remove dissolved hydrogen sulfide and ammonia. Other water streams (cooling tower and boiler blow down, ballast water and sanitary wastes) are also components of the refinery effluent. Very effective treating methods have been developed involving primary treatment to separate oil and solids coupled with secondary treatment (activated sludge or trickling filters or lagoons) to remove biodegradeable components.
Regulations are continuing to develop which will affect refinery operation as well as the construction of new facilities. Recently there has been an increasing awareness of the need to consider the overall cost as well as the benefits to be achieved by regulations, rather than simply aiming at pollution control alone. Also, as public awareness of the overall energy shortage increases, pressure will develop to pass regulations which will provide for construction of necessary facilities which are compatible with the environment.
Storage and Transportation Petroleum gains much of its value to society by
being the most portable form of stored energy. In
order to satisfy energy requirements of the public, it is essential that petroleum products be widely available at low costs. An efficient, broadly based and extensive distribution system is a major factor in supplying adequate amounts of gasoline and other liquid fuels throughout the Nation at minimum expense. Similarly, efficient warehousing and distribution systems have been developed for lubricants and other packaged goods supplied by the petroleum industry. Most technological advances in petroleum storage and transportation have been implemented in order to improve efficiency, safety, conservation and convenience of the distribution system.
Storage and distribution systems as well as three specific means of transportation-tank trucks, barges and tank cars-are discussed in this report. Pipelines and tankers, which are the most important means of transportation but less closely allied to refining, are not covered in this report but appear in the original Impact of New Technology report.*
Future Trends
The demand for petroleum products is projected to grow at a rate of 4.2 percent per year during the 1970's. Gasoline will continue to be the principal petroleum product, but its growth at 3 .4 percent per year will be lower than for all products. This is due to anticipated supply problems, the change in driving habits, and the change in the mix of the car population. Distillate fuel consumption for home heating will likely grow moderately over the same period due to the shortage of natural gas and electric generating capability. Residual fuel, commercial aviation turbine fuel and highway diesel fuel are forecast to grow at about twice the average for all oil products. During the same period, petrochemical feedstocks may show a 10-percent gain per year.
While the overall average growth is not significantly higher than the recent trend, factors such as curtailment of automobile use in major cities, natural gas use limitations, delays in the nuclear power generation program, and other legislative acts related to the environment could have a significant impact on these projections.
Environmental factors are expected to have a considerable impact on product quality in the future. In addition to the reduction of lead alkyls in gasoline, octane and volatility requirements are expected
* NPC, Impact of New Technology on the U.S. Petroleum Industry 1946-1965 (1967), pp. 221-229.
7

to limit gasoline blending flexibility and necessitate removal of some heavy fractions from the gasoline pool. Also, allowable sulfur contents of residual fuels are expected to continue to be lowered, requiring increased processing. Water conservation and improvements in quality of emissions to reach the 1 985 goals wili require both technical effort and significant capital.
In respect to processing, gasoline quality requirements will lead to increased need to upgrade quality of the front end of gasoline via isomerization or
8
pyrolysis and alkylation of olefins. Catalytic reforming will continue to be a major gasoline upgrading process, with some limitations on end point of feed due to volatility requirements. Catalytic cracking will also continue to be the primary conversion process. Continued emphasis will be placed on process improvements through use of new and improved catalysts, control techniques and maintenance methods.
Energy conservation both in new designs and in existing refineries will command increasing effort as fuel values shift upward.

Part Two
Impact of· New Technology

Chapter One
Product Quality Improvement
Motor Fuels and Lubricants
Automotive Gasoline Today's modern automotive gasolines and lubri
cants have evolved as a direct result of constantly changing technological, political, economic and sociological factors, and it is a certainty that these factors will continue to prompt changes in the future.
In the early days of automotive transportation, gasoline was a relatively simple mixture of petroleum fractions derived from straight-run and thermally cracked stocks. In contrast, (oday's fuel is a complex mixture of blends derived from catalytic cracking, alkylation, catalytic reforming, polymerizations, isomerizations and hydrocracking, plus small amounts of additives designed to further improve the overall efficiency and reliability of the internal combustion engine. A brief historical review of engine fuel developments and interactions will illustrate this transition.
From 1925 to 1950, there was a gradual but steady increase in compression ratio. During the 1 950's, this increase was more rapid, with a final leveling off in the late 1 960's. This increase in compression ratio was aimed at improving overall engine performance and efficiency. Its effect on fuel composition was direct since increased compression ratio requires an increase in fuel octane number to prevent knocking. The octane increase was achieved partly by the addition of lead alkyls but mostly via the changes in the petroleum refining processes. Without these changes, the amount of gasoline that
could be obtained from a barrel of crude would have been drastically reduced.
During the 1950's and 1960's, other changes also were made in automotive gasoline to help achieve the objectives of greater efficiency and reliability. Additives were developed that helped to minimize such problems as carburetor icing and fouling, valve and engine deposits, spark plug fouling, fuel system corrosion, and poor fuel distribution.
All of these factors have contributed to today's highly complex gasoline formulations which meet the stringent requirements of today's equally complex automobile engines. However, the increasing demands for automobiles by our highly mobile society has created a new set of problems, namely, ecological.
As gasoline is burned in the internal combustion engine, it is converted predominately into harmless carbon dioxide and water. However, small amounts of carbon monoxide and nitrogen oxides also are formed and emitted to the atmosphere along with some unburned hydrocarbons. These components, if present in sufficient concentration, can contribute to various manifestations of photochemical smog. Modifications to internal combustion engines aimed at reducing this atmospheric pollution were started in the mid-1960's, and modifications continue to appear at an accelerated rate.
The Clean Air Act and Amendments of 1970 have made it mandatory that new 1975 cars exhibit a 90-percent reduction in carbon monoxide (CO) and hydrocarbon exhaust emissions when compared to 1970 cars. They also require that, by 1976, the amount of NOx be reduced by 90 percent of the
1 1

value characteristic of 1971 cars. These changes are in addition to the significant reductions in emissions accomplished during the late 1960's. Despite the fact that enforcement of the initial standards was postponed for 1 year, the interim standards represent only a modest relaxation. In effect, this will almost completely eliminate the automobile as a source of air pollution. However, to achieve these goals will require substantial changes and additions to the internal combustion engine. Changes in gasoline formulation and additive use are expected, but except for proposed government regulations to limit the use of lead alkyls, no clear pattern of fuel requirement has evolved. Changes already made and envisioned for the future include positive crankcase ventilation, adjustments in engine timing, exhaust gas recirculation, catalytic mufflers, reductions in lead alkyl usage and trace contaminants levels in the exhaust, and changes in fuel composition. The
10
1-
effect that these modifications will have on power and efficiency is significant. Exhaust gas recirculation will dirty the engine as well as decrease power and efficiency, as will the catalytic mufflers and reduced compression ratio. Elimination of lead alkyls will reduce octane quality, and to upgrade octane quality without lead will require additional processing. In addition, such fuels will cost more to manufacture. All of this means that it will cost the motorist more to operate his automobile. Even more significant is the fact that all of these combined changes that reduce overall efficiency also increase the rate of gasoline consumption. This is happening when the Nation is having to import more and more crude and when the world itself is rapidly approaching the time when it will begin to run out of fossil fuel reserves.
The 1970's will certainly be a decade when innovation in fuel technology will be required to reduce
� -�
9 fL _r 0
� a:
z 0
� 8 w a: c.. 2: 0 (..)
-
r-
-
f 7 � t-
6 1950
I I I I 1955
-
I I I I
L-,_J
I I I I 1960 1965
YEAR
.,_ __
L I I _I I l I I 1970 1975
SOURCE: Ethyl Corp., Brief Passenger Car Data ( 1950- 1970); Dupont Data-1971 - 1972 and estimates after 1972.
I l I I
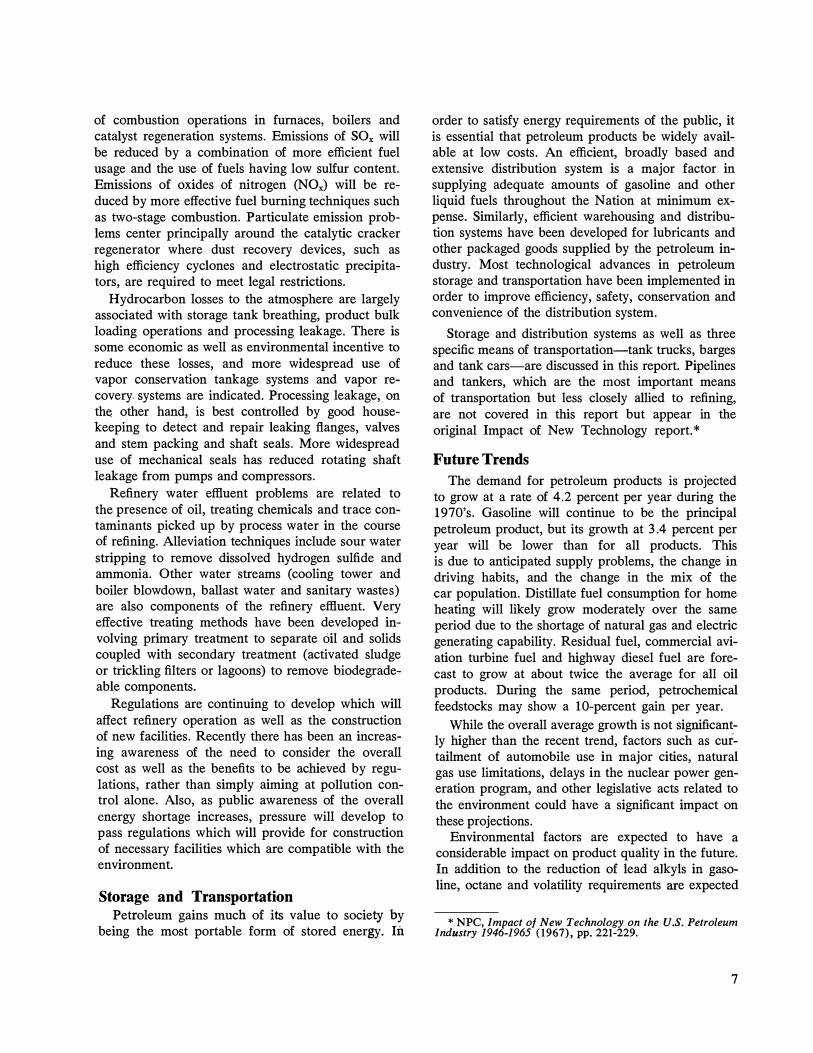
Figure 2. Production Weighted Average Compression Ratios for U.S. Passenger Cars.
1 2

102 REGULAR GRADE
98
94 a: w co :2 90 :::> z w z <( 86 1-u 0
82
78
74
102 PREMIUM GRADE
98 RESEARCH
94 a: w co :2 90 :::> z w z 86 <( MOTOR 1-u 0
82
78
74 1946 '50
SOURCE: Bureau of Mines,"Motor Gasoline," Mineral Industry Surveys.
Figure 3 . Trends in Octane Numbers of Motor Gasolines.
the penalties imposed by the Nation's desire to clean up the atmosphere. New types of power plants, such as the rotary engine (Wankel) and Sterling engines which may impose additional fuel problems also must be considered.
As these newer automobiles with their new fuel requirements are phased in, fuels must still be produced to satisfy the older cars. In addition to the requirement for current grades of gasoline, one or more new grades will be required. The following
sections will treat some of the more important factors in greater detail.
Gasoline Antiknock Quality
The long-term trend toward more efficient utilization of fuels in spark ignition, reciprocating engines reached a peak in the 1 965-1 970 period. As previously stated, this was accomplished by a concomitant increase in engine compression ratios and in fuel octane number quality. Trends in these param-
13

eters since 1950 are shown in Figures 2 and 3. The relationship of compression ratio and octane requirement for one particular engine under a given set of operating conditions is shown in Figure 4.
110
I- 105 z w :a: w a:
:J 100 d w a:
a: w Ill
95 :a: :J z w z 90 <.( I-u 0 85
80
/
/ /
/ /
/ /
75 I I I 6 8 10 12
COMPRESSION RATIO
SOURCE: Max M. Roensch, "The Automotive Engine- Today and Tomorrow," SAE Paper No. 710845 (October 1971 ).
Figure 4. Relationship Between Compression Ratio and Octane Requirement.
In 1 97 1 and 1972, a sharp decrease in compression ratio occurred in passenger car engines in the United States. This decrease was made to permit the engines to operate on unleaded gasolines of an octane quality which could be produced by the petroleum industry in reasonably large volumes. This quality was calculated to be 9 1 Research Octane Number (RON) and 83 Motor Octane Number (MON).
Lead Alkyl Levels and Other Catalyst Poisons
In addition to the apparent need to supply unleaded gasolines for 1 975 model year cars which will reportedly have lead-sensitive catalytic reactors, there is a desire to reduce the lead particulate emissions from automotive engines. This caused the Environmental Protection Agency (EPA) to establish the proposed lead removing/reducing schedule shown
14
in Table 2. The EPA proposal states that most service stations offer at least one unleaded grade of gasoline by July 1 , 1 974.
Two additional elements which are believed to poison the catalysts proposed for 1 975 model cars are phosphorus and sulfur. For this reason, the unleaded grades of fuel manufactured after July 1 , 1974, will have no phosphorus-containing additives. Sulfur levels in gasoline are low and are declining slowly and, hence, there are no current proposals to restrict sulfur concentrations.
Gasoline Mileage
The progressively lower limits on hydrocarbon, carbon monoxide and nitrogen oxide emissions from automobile exhausts through 1976 will have a significant negative effect on gasoline mileage relative to 1 970 model cars for several reasons:
• Reduced compression ratios reduce gasoline mileage and power output.
• Increased engine size or increased gear ratios (to regain the power lost by reduced compression ratios) lowers gasoline mileage.
• The use of exhaust gas recirculation to reduce nitrogen oxide emissions lowers gasoline mileage.
• Operation at non-optimum spark advance settings to reduce emissions lowers gasoline mileage.
The combined effects that these changes are expected to have on gasoline mileage are shown in Table 3 . Trends toward smaller cars and public or governmental pressure toward better gasoline mileage may help alleviate the impact of these effects on the average consumption of the total U.S. automotive population.
Refinery Pool Octane Levels
The trends of high compression ratios through 1970 and lower compression ratios from 1971 onward have created a U.S. car population with widely different and constantly changing octane number re·quirements. The distribution of fuel octane requirements of U.S. manufactured passenger cars, according to the car manufacturers' fuel recommendation during the 1970-1980 period, appears in Table 4.
To satisfy cars with the foregoing varied octane requirement levels and lead antiknock additive limits requires the marketing of two or three more grades of gasoline. Various industry-wide studies by Pace,

TABLE 2
EPA PROPOSED LEAD REMOVING/ REDUCING SCHEDULE AS OF FEBRUARY 1 972
Lead Content (Grams per Gallon)
Grade 1 972 1 973 1 974 1 975 1 976 1 977 1 978
Unleaded 91 Octane 0.05* 0.05 0.05 0.05 0.05
Leaded Regular t 3.0 3.0 2.0 1 .7 1 .5 1 .25 1 .25
Leaded Premium t 3.0 3.0 2.0 1 .7 1 .5 1 .25 1 .25
1 979
0.05
1 .25
1 .25
*Trace lead al lowed; does not permit incl usion of lead i n blend ing; l imi t applies after July 1, 1 974.
1 980
0.05
1 .25
1 .25
t 1 972 and 1 973 lead level without regulation. On January 1 0, 1 973, EPA publ ished a 1 -year extension of these phaseout levels.
TABLE 3
EFFECT OF EMISSION STANDARDS AND ENGINE MODIFICATIONS ON THE AVERAGE GASOLINE MILEAG E OF U.S. PASSENGER CARS
Percent Reduction Model Years in Gasoline Mileage Investigators
1 968 to 1 973 7.7 Envi ronmental P rotection Agency*
1 968 to 1 972 5.0 Chrysl er Corporationt
1 972 to 1 973 1 0.0 Chrysler Corporation
1 968 to 1 973 1 5.0 Chrysler Corporation
1 970 to 1 973 1 7.0:j: DuPont§
1 965 to 1 975 26.0:j: Ford Motor Companyll
1 974 to 1 975 6.3 Ford Motor Company
* EPA, Office of Air and Water Programs, Mobi le Source Pol lution Control Program, Fuel Economy and Emission Control (November 1972).
t G. J. Huebner, Jr., and D. J. Gasser of Chrysler Corporation, "General Factors Affecting Vehicle Fuel Consumption," Presented at 1 973 SAE National Automobile Engineering Meeting, Detroit, Michigan, May 1 5, 1 973.
:1: These data include the effect of car weight and other design changes in addition to the effect of emission standards and engine mod ifications.
§E. I. DuPont, Petroleum Chemicals Division, "1 973 Technical Conference," p. PE-1 1 .
i I Remarks by Harold C . MacDonald, Vice President, Product Development Group, Ford Motor Company, at 1 973 SAE National Automobile Engineering Meeting, Detroit, Mi ichigan, May 1 5, 1 973.
1 5
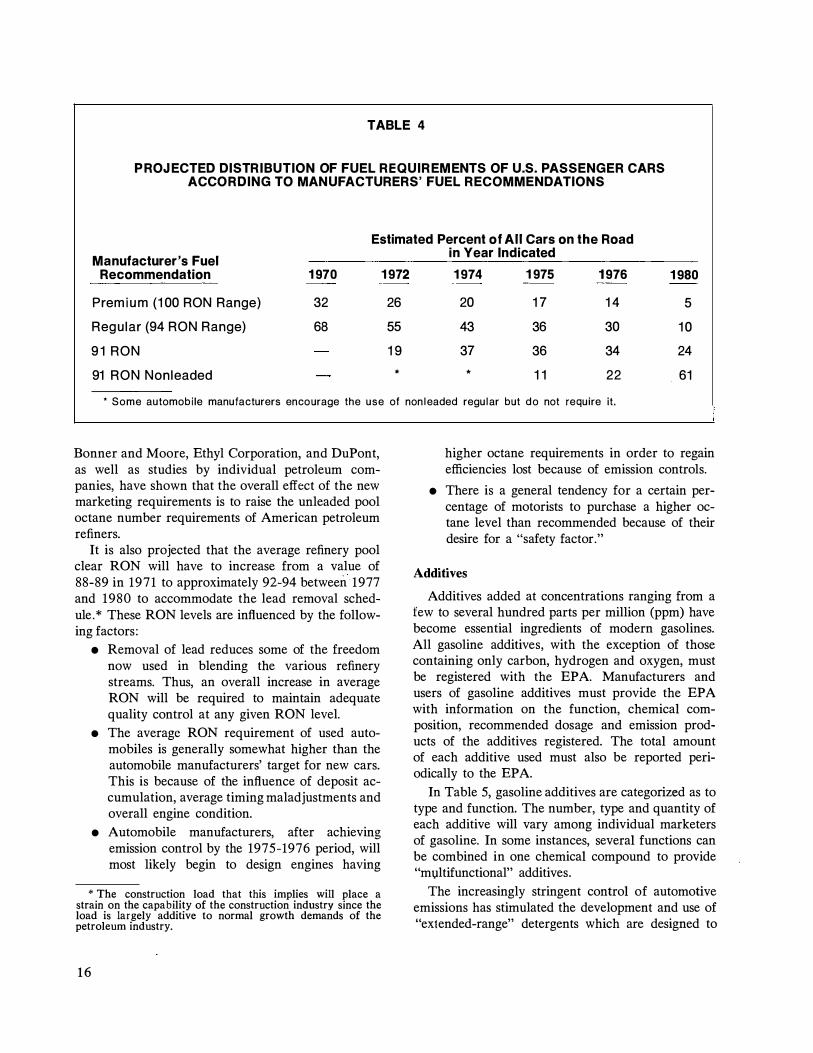
TABLE 4
P ROJ ECTED DISTRIBUTION OF FUEL REQUIREMENTS OF U.S. PASSENGER CARS ACCORDING TO MANUFACTURERS' FUEL RECOMMENDATIONS
Estimated Percent of All Cars on the Road
Manufacturer's Fuel in Year Indicated
Recommendation 1 970 1 972 1 974 1 975 1 976 1 980
Prem i u m (1 00 RON Range) 32 26 20 1 7 1 4 5
Regu lar (94 RON Range) 68 55 43 36 30 1 0
9 1 RON 1 9 37 36 34 24
91 RON Nonleaded * * 1 1 22 61
* Some automobile manufacturers encourage the use of nonleaded regular but do not require it.
Bonner and Moore, Ethyl Corporation, and DuPont, as well as studies by individual petroleum companies, have shown that the overall effect of the new marketing requirements is to raise the unleaded pool octane number requirements of American petroleum refiners.
It is also projected that the average refinery pool clear RON will have to increase from a value of 88-89 in 1971 to approximately 92-94 between 1977 and 1980 to accommodate the lead removal schedule.* These RON levels are influenced by the following factors:
• Removal of lead reduces some of the freedom now used in blending the various refinery streams. Thus, an overall increase in average RON will be required to maintain adequate quality control at any given RON level.
• The average RON requirement of used automobiles is generally somewhat higher than the automobile manufacturers' target for new cars. This is because of the influence of deposit accumulation, average timing maladjustments and overall engine condition.
• Automobile manufacturers, after achieving emission control by the 1975-1976 period, will most likely begin to design engines having
* The construction load that this implies will place a strain on the capability of the construction industry since the load is largely additive to normal growth demands of the petroleum industry.
16
higher octane requirements in order to regain efficiencies lost because of emission controls.
• There is a general tendency for a certain percentage of motorists to purchase a higher octane level than recommended because of their desire for a "safety factor."
Additives
Additives added at concentrations ranging from a few to several hundred parts per million (ppm) have become essential ingredients of modern gasolines. All gasoline additives, with the exception of those containing only carbon, hydrogen and oxygen, must be registered with the EPA. Manufacturers and users of gasoline additives must provide the EPA with information on the function, chemical composition, recommended dosage and emission products of the additives registered. The total amount of each additive used must also be reported periodically to the EPA.
In Table 5, gasoline additives are categorized as to type and function. The number, type and quantity of each additive will vary among individual marketers of gasoline. In some instances, several functions can be combined in one chemical compound to provide "ml)ltifunctional" additives.
The increasingly stringent control of automotive emissions has stimulated the development and use of "extended-range" detergents which are designed to
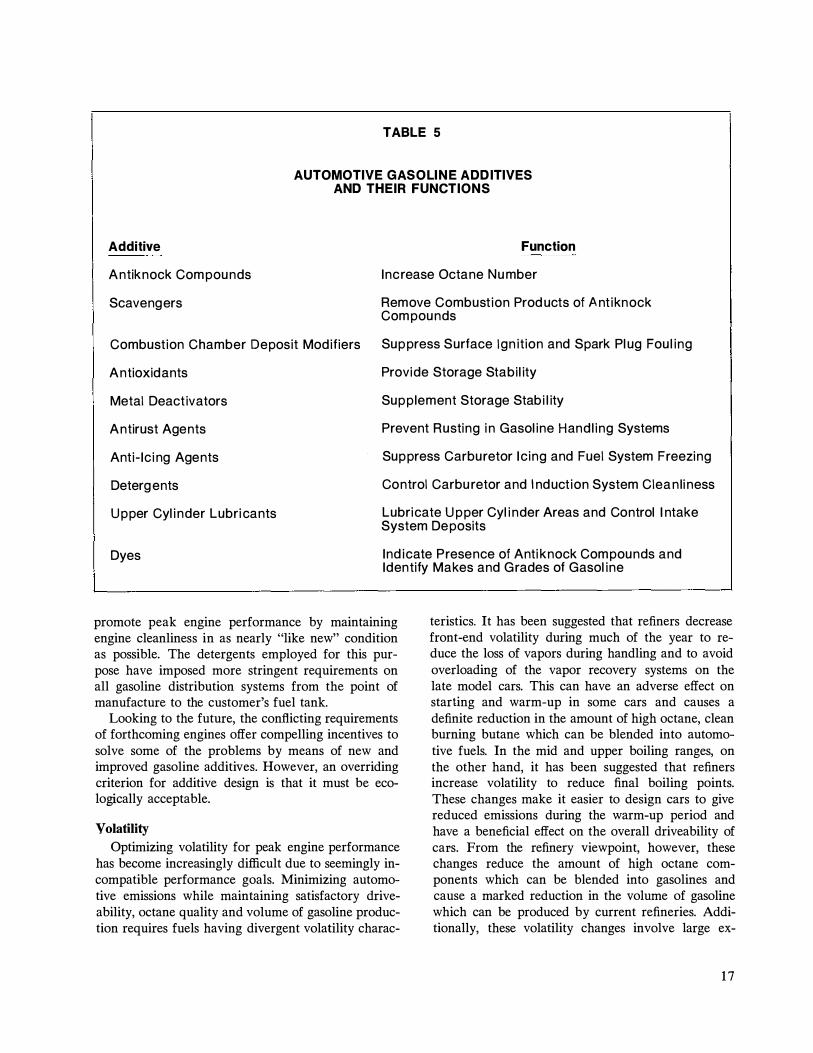
TABLE 5
AUTOMOTIVE GASOLINE ADDITIVES AND THEIR FUNCTIONS
Additive Function
Antiknock Compounds Increase Octane Nu mber
Scavengers Remove Combust ion Prod ucts of Ant iknock Compounds
Combustion Chamber Deposit Modifiers
Antioxidants
Suppress Surface Ignit ion and Spark Pl ug Foul ing
Provide Storage Stabi l ity
Metal Deact ivators Supplement Storage Stabi l ity
Antirust Agents
Anti- Ic ing Agents
Deterg ents
Upper Cyl inder Lubri cants
Prevent Rusting in Gasol ine Handl ing Systems
Suppress Carburetor Icing and Fuel System Freezing
Control Carbu retor and Induct ion System Cleanliness
Lubricate Upper Cyl inder Areas and Control Intake System Deposits
Dyes Ind icate Presence of Anti knock Compounds and Identify Makes and Grades of Gasol ine
promote peak engine performance by maintaining engine cleanliness in as nearly "like new" condition as possible. The detergents employed for this purpose have imposed more stringent requirements on all gasoline distribution systems from the point of manufacture to the customer's fuel tank.
Looking to the future, the conflicting requirements of forthcoming engines offer compelling incentives to solve some of the problems by means of new and improved gasoline additives. However, an overriding criterion for additive design is that it must be ecologically acceptable.
Volatility
Optimizing volatility for peak engine performance has become increasingly difficult due to seemingly incompatible performance goals. Minimizing automotive emissions while maintaining satisfactory driveability, octane quality and volume of gasoline production requires fuels having divergent volatility charac-
teristics. It has been suggested that refiners decrease front-end volatility during much of the year to reduce the loss of vapors during handling and to avoid overloading of the vapor recovery systems on the late model cars. This can have an adverse effect on starting and warm-up in some cars and causes a definite reduction in the amount of high octane, clean burning butane which can be blended into automotive fuels. In the mid and upper boiling ranges, on the other hand, it has been suggested that refiners increase volatility to reduce final boiling points. These changes make it easier to design cars to give reduced emissions during the warm-up period and have a beneficial effect on the overall driveability of cars. From the refinery viewpoint, however, these changes reduce the amount of high octane components which can be blended into gasolines and cause a marked reduction in the volume of gasoline which can be produced by current refineries. Additionally, these volatility changes involve large ex-
17

penditures for refinery processing equipment and increased refinery operating costs.
Aviation Fuels Two types of aircraft fuels are used in the United
States today-aviation gasolines (A VGAS) for spark ignition engines and jet fuels for aircraft turbine engines. Figure 5, which illustrates the U.S. demand for aviation fuel during recent years, shows that military demand for jet fuel has been relatively constant in recent years when compared to the demand for commercial jet fuel. A VGAS demand has declined steadily since 1965, and military demand for A VGAS probably will continue to shrink, although a growing population of private light aircraft may become a compensating factor.
The rapid growth in demand for commercial jet fuel which occurred in the late 1960's was brought about by the continued conversion by the air carriers from piston engine planes to jets. This conversion is
700
�
600
>- 500 <( Cl
a: w 0.. (/) 400 ...J w a: a: <( co
�
/
/ v
�
�/ v � �
Cl 300 z <( (/) ::::> f-0 :::c 200 1-
1-........
. 100
I-
0
now virtually complete-at the end of 1971 , 98 percent of fixed-wing planes in scheduled domestic service were jets or turboprops. Now, however, a replacement period has begun in which the first generation jets are being supplanted by more modem aircraft. Although many of these planes are larger and consume more fuel than their predecessors, their greater passenger-carrying capacity points to a more gradual growth in commercial jet fuel demand.
Aviation Gasolines
In 194 7, the American Society for Testing and Materials (ASTM) issued specifications for aviation gasolines, Grade 9 1 -98 and Grade 1 00-1 30.* Since then, specifications for three additional grades were added: ( 1 ) Grade 1 1 5-145 (1948), (2) Grade 80-87 (1951) , and (3) Grade 108-135 ( 1953). Other
* These numbers refer to antiknock performance: the first number under lean conditions and the second number under rich conditions.
� � l
COMMERCIAL
/ (Bonded and Domestic)
v
� MILITARY (Imported and Domestic)
AVGAS (Military and Civilian)
1965 1966 1967 1968 1969 1970 1971 1972 YEAR
SOURCE: U.S. Bureau of Mines.
Figure 5 . U.S. Aviation Fuel Demand .
18

changes made in the specifications included dyes for the five grades, improved test methods, and an increase in the number of approved antioxidants from three to five.
Commercial availability of Grade 1 08-135 has steadily decreased in recent years, and it is, for practical purposes, now unavailable. Likewise, it was shown that engines designed to operate on Grade 9 1-98 could operate easily on Grade 100- 1 30. Thus, Grade 9 1 -98 has disappeared.
Perhaps the largest trend toward grade minimization was initiated by the oil industry in 1970 with the introduction of a low-lead (2.0 milliliters [ml] tetraethyl lead [TEL] per gallon maximum) Grade 100-1 30 and a subsequent effort to phase out Grade 80-87. It is predicted that by 1 975 there will only be one grade of aviation gasoline-low-lead Grade 1 00-1 30.
Quality control in aviation gasoline is even more critical than in motor gasoline since engine failure is a much more serious matter in aircraft. Antiknock control is especially critical because, unlike the motorist, the pilot is unable to hear an engine knock over the high noise level. Volatility, freezing point, heat of combustion and oxidation stability are all very important to the A VGAS consumer. Quality control techniques and close control of processing have made aviation gasoline a reliable premium refinery product.
Aviation gasolines contain up to 4.6 ml TEL per gallon (1 1 5-145). Ethylene dibromide is added to scavenge the lead and has been found more effective under high-load aircraft conditions than the chloride/bromine scavenger mixtures used in motor gasolines. Other alkyl leads, tetramethyl lead or methylethyl lead compounds, are not used in aviation gasolines.
Some hydrocarbon constituents of A VGAS tend to oxidize during storage at ambient temperatures. The products of oxidation, fuel-soluble and fuel-insoluble gums, interfere with metering of the fuel to the engine and must be controlled. Certain amine and phenolic chemical compounds have been found to be particularly effective in this service.
Jet Fuels
Commercial kerosine was used as a fuel in early development work on jet aircraft in the United States. This choice of kerosine over gasoline was based on its low volatility to avoid occurrence of vapor lock under certain flight conditions and its
availability as a commercial product of uniform characteristics. JP-1 , the first military jet fuel, was highly refined kerosine having a very low freezing point (- 7 6 °F). Kerosine from selected crudes high in naphthenes was the only fuel having this low freezing point specified for JP- 1 . The demand for this fuel increased very rapidly and, as a result, the Military Petroleum Advisory Board scrutinized the fuel demand of jet engines, together with availability of JP-1 and A VGAS. The Board made a strong recommendation for the development of a military jet fuel having greater availability in wartime than either JP-1 or A VGAS. The second candidate jet fuel was JP-2, but it did not have the desired availability. JP-3 fuel was another possibility which included the total boiling range of kerosine and gasoline. A cooperative program of testing by the Coordinating Research Council demonstrated that the high vapor pressure of JP-3 (Reid vapor pressure of 5 to 7 pounds) resulted in vaporization of the fuel during climb to altitude. In addition, some fuels foamed excessively during vaporization so that very large losses of liquid could occur along with the vented vapors.
To overcome the disadvantages of JP-3, the Reid vapor pressure was reduced to 2 to 3 pounds, and JP-4 was developed in 195 1 . The new fuel is a blend of 25- to 35-percent kerosine and 65- to 75-percent gasoline components and has proved quite satisfactory for military requirements.
One important Navy turbine fuel developed for carrier operation during the Korean War was a mixture of a special kerosine and A VGAS. A VGAS was stored in tanks in the central zone of carriers to minimize the possibility of hazardous fuel leaks in the event of battle damage. Space in this area was in high demand for other purposes, thereby limiting available storage space for A VGAS. The problem was solved by the development of JP-5 fuel for aircraft carriers, which was a special 140°F flash point kerosine and, because of its low volatility, could be stored safely in outer tanks of carriers. When mixed with A VGAS, JP-5 gave a fuel similar to JP-4. Later, the Navy eliminated the use of the A VGAS mixture and used the JP-5 alone.
Commercial airline jet fuels in the United States fall within the general framework of ASTM Jet A, A-1 and B fuels. Jet A and A-1 are of the kerosine type. Jet B corresponds to the military JP-4 fuel. Volume demands for Jet A and A-1 are large, but small for Jet B .
Jet fuel fulfills a dual purpose in the aircraft. It
1 9

provides energy and serves as a coolant for lubricating oil and other aircraft components. Exposure of the fuel to high temperatures may cause the formation of oxidation matter (gums) which reduces the efficiency of heat exchangers and clogs filters and valves in aircraft fuel handling systems. Thermal stability is the resistance to formation of gums at high temperature. The JP-4, JP-5 and equivalent commercial fuels have satisfactory thermal stability for aircraft operating at speeds up to about Mach 2.0. Future jet aircraft operating at higher speeds, e.g., Mach 3, may expose the fuel to greater thermal stresses and, therefore, may require a more stable fuel. The development of Mach 3-4 turbojets, Mach 6 + ramjets, and rockets using hydrocarbon fuels will pose additional problems on fuel stability characteristics.
An attractive method of improving jet fuel quality is through the use of additives. The more common applications of additives are-
• Antioxidants: Some jet fuels may oxidize during storage at ambient temperature to form fuel-soluble and fuel-insoluble gums. These oxidation products may cause (1) clogging of filters in the aircraft fuel distribution systems or (2) coking of engine burner nozzles. The same antioxidants approved for A VGAS are used in jet fuels to inhibit oxidation.
• Copper Deactivator: Traces of dissolved copper in jet fuel accelerate oxidation of the fuel during storage at ambient temperatures. A copper chelating agent-N, N ' disalicylidene- 1 ,2-propanediamine-has been approved for addition to jet fuel to deactivate the pro-oxidant effects of copper.
• Corrosion Inhibitors: Fuel-soluble corrosion inhibitors have limited specific approval for jet fuels. The inhibitors are added to protect pipelines against corrosion by occluded water and indirectly to reduce contamination of the fuel with rust. Several commercial inhibitors are available.
• Anti-Icing Additive: The major hazard of free water in jet fuels is plugging of fuel lines and filters by ice during flight. Fuel heaters are used in civilian aircraft to prevent ice formation and its resulting consequences. The military adopted the approach of adding 0. 1 to 0 . 15 percent of an anti-icing inhibitor comprising a mixture of 99.6-weight-percent ethyl-
20
ene glycol monomethyl ether and 0.4-weightpercent glycerol. The additive has the added feature of having biocidal properties. At above freezing temperatures, liquid water can cause erratic operation of electrical fuel gauges and provides a suitable environment for growth of bacteria and fungi. More recently, the antiidng additive has been changed to eliminate the glycerol.
• Antistatic Additive: High-speed flow (600 to 800 gallons per minute) through fill lines, filters and valves generates electrostatic charges in jet fuels. Electrostatic potential differences between the fuel and fuel tank walls may cause sparking in the vapor spaces of fuel tanks. If the vapor compositions are ignitable and the electrostatic discharges have enough energy to ignite the vapor, then fires or explosions may result. Intensive investigations have shown that additives which decrease resistivity of the fuel can reduce electrostatic hazards.
Refiners make every effort to deliver clean, waterfree fuel to jet aircraft. However, in handling and delivery there are many places where traces of contaminants can enter the fuel .
Particulate matter and free water can be removed by bulk settling or filtering. The filter units (filter/ coalescers) contain resin-coated filters to remove particulate matter followed by a glass fiber filter or a specially resin-coated filter to coalesce and remove free water. Removal of solids down to 5 microns (0.000 1 9 inch) is generally desired to avoid plugging of filters on fuel control valves and burner nozzles.
Surface active agents (surfactants) in jet fuels are highly undesirable because they promote the formation of water-in-fuel emulsions and reduce the efficiency of filter/coalescers. Certain surfactants in extremely small quantities ( 1 ppm) appear capable of reducing the efficiency of filter/coalescers. Surfactants produced by refining operations are removed by neutralization, water washing, clay treating, filtration or settling. Polar additives that are added to jet fuel are chosen on the basis of having minimum surfactant properties.
Bacteria, fungi and other microorganisms can live in a water layer that could collect in storage or wing tanks. Rapid growth of the microorganisms may cause plugging of filters in fuel delivery lines or aircraft fuel lines and may accelerate corrosion
of aluminum wing tanks on aircraft. Good housekeeping does much to eliminate this problem. The anti-icing additive added to JP-4 fuel is a biocide and has helped to eliminate the problem from aircraft supplied with this fuel.
Future Fuels
By proper selection of structural materials and aircraft design, it may be feasible to use conventional hydrocarbon fuels up to flight speeds approaching Mach 4. Flight speeds higher than Mach 4 will require more heat-sink capacity than normally provided by fuels in the liquid state. Vaporization of the fuel can increase the overall heat-sink capacity by about 25 percent. A promising alternate is to allow endothermic fuels to undergo mild thermal cracking which can absorb several times the heat picked up in the liquid state alone. Cryogenic fuels -liquefied hydrogen, methane and propane-also offer an attractive way of cooling aircraft, although these fuels have the disadvantage of a low volumetric energy content.
Low-altitude, high-speed, ramjet-powered aircraft require a fuel with a high volumetric heat content. The Air Force has been pursuing the development of slurry fuels in which metal is burned to take advantage of the high heat of formation of metal oxides. Research efforts are continuing to develop fuels having the greatest possible metal content and to overcome problems such as poor pumpability, abrasiveness and low combustion efficiency.
The Air Force is not presently supporting research on the high-density fuels (aromatics and condensed polycyclic hydrocarbons), but is interested in evaluating new materials that may possess heating values of about 1 50,000 BTU's per gallon or higher with a freezing point of - 50°F or lower.
Diesel Fuels and Heating Oils
Diesel Fuels
Although some evolution in diesel fuel composition has occurred during the last 1 5 years, the net effect has not resulted in markedly improved performance levels. Major performance factors of diesel fuel are characterized by sulfur content, cetane number, viscosity, volatility and pour point. *
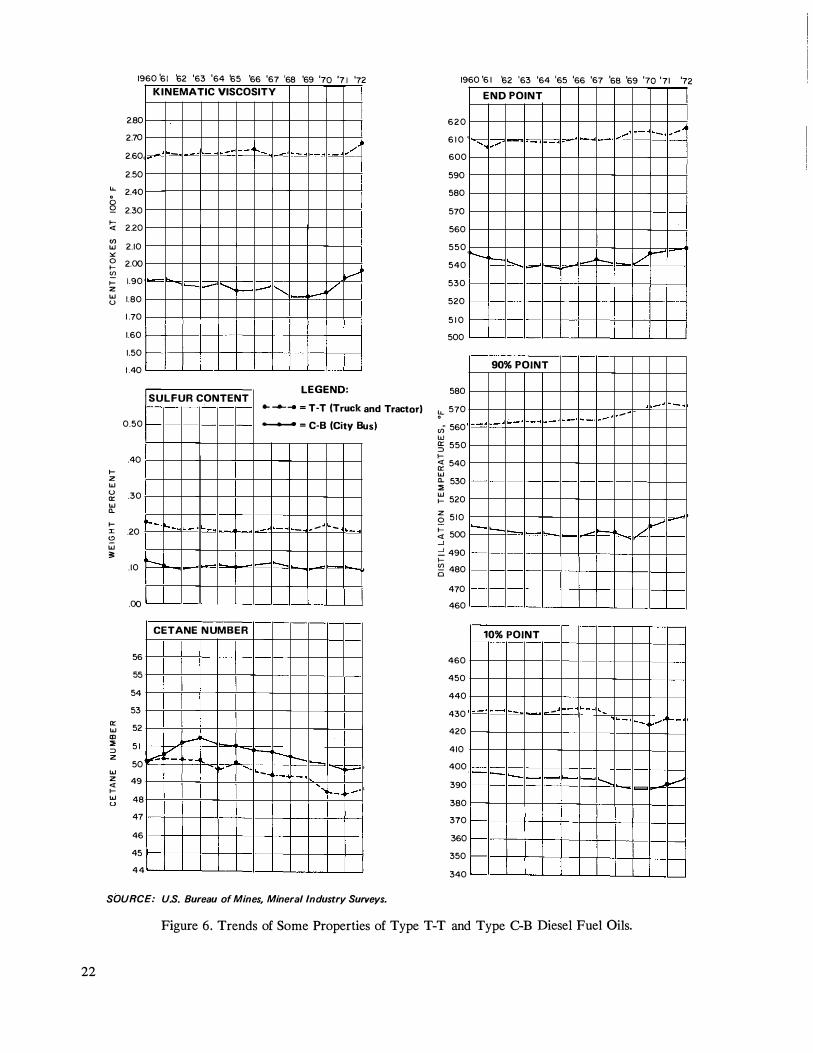
Recent changes in diesel fuel properties (shown in Figure 6) have resulted from competition for
* Cetane number is a measure of ignition quality; pour point indicates fluidity or flow at low temperatures.
available distillate blending stocks for use in other fuels or as process materials. For example, the rapid increase in commercial jet fuel consumption has significantly reduced availability of the more volatile straight-run components. Thus, the fraction of cracked stocks in diesel fuel continues to increase. Hydrogenation of cracked stocks reduces sulfur content, improves stability and upgrades rather poor performers to satisfactory diesel components. Some key properties of typical diesel fuel are shown in Figure 6. Most properties have leveled off, but cetane number is slowly declining. This trend is expected to continue as the demand for energy progresses.
Most diesel engines in truck service can operate satisfactorily on truck and tractor fuels available today. However, there is a wide range of fuels possible under this classification, and variation within the classification can have a significant effect on a given engine's performance.
Emphasis on improving air quality is bringing about engine design changes to reduce exhaust emissions. Previously preeminent factors such as increased power output and improved fuel economy are yielding in importance to reduction of smoke, nitrogen oxides, carbon monoxide and hydrocarbon emissions. Engine modifications designed to reduce exhaust emissions probably will result in a narrowing of the range of fuel specifications in regard to cetane number and volatility.
The quality of railroad fuels has not changed significantly with time. Some railroads operate on special economy grade fuels that have much broader volatility and lower cetane numbers and almost always contain large percentages of cracked stock. The large diesel engines in railroad service are less sensitive to fuel properties than their smaller truck or tractor counterparts and can operate satisfactorily on fuels with less exacting specifications.
Of the total U.S. diesel fuel oil sales, about 75 percent is for use in transportation. Trucks and buses consume about 45 percent, railroads consume about 25 percent, and marine uses amount to about 5 percent. Industrial plants, utilities and the military consume the remainder. In metropolitan areas, electric power companies are installing gas turbines that burn diesel fuel for power generation. Gas turbines can be installed quickly at relatively low initial costs and are reasonably free of undesirable emissions. The fraction of diesel fuel used by utilities is increasing.
21
22
1960 '6 1 62 '63 '64 '65 '66 '67 '68 '69 '70 '7 1 '72 1960 '6 1 62 '63 '64 '65 'ss '67 'sa '69 '7o ' 7 1 '72 KIN EMATIC VISCOSITY
2.80
2.70
2.60 -- - t-- - / - - - -
2.50
"- 2.40 0 Q 2.30 f-.
2.20 �
(/) 2.10 w
"' 0 2.00 f-. �
1.90 f-. z w 1.80 u
v r-- " ......... v
1 .70
1.60
1.50
1 .40
LEGEND: SULFUR CONTENT
._ _.__. = T-T (Truck
0.50 -- = C-B (City B
.40 f-. z w u .30 a:: w CL f-. I .20
.... _ �� - - - - - - - -� w ;;:
. 10 r-----
.00
CETANE N UMBER
56
55
54
53
a:: 52 w m :::!; 5 1 ::> z 50 w z 49 � f-.
I.-1"----� v r--r--r---
� --- � - '"'- -·, - -w 48 u
47
46
45
4 4
6 2 0
6 1 0
600
590
580
570
560
550
540
530
520
5 1 0
500
580
and Tractor) :;- 570
us) ui 560 w � 550 f-. � 540 a:: w CL 530 ::;:
::' 520
Q 5 1 0
!;;: 500 ...J = 490 f-. � 480 0
470
460
460
450
440
430
420
410
400
390
380
370
360
350
340
E N D POINT
..... .....
r--�
90% POINT
- -
10% POINT
· - -
.....
--- - -
�
- ---
..:::::,.
SOURCE: U.S. Bureau of Mines, Mineral Industry Surveys.
Figure 6. Trends of Some Properties of Type T-T and Type C-B Diesel Fuel Oils.
- - .....
./ �
- -
L. v
- �- P---
v

As in the case of gasolines, the use of additives has become much more common in diesel fuels. Cetane improvers, largely alkyl nitrates, provide ignition quality improvement. Ignition quality influences ease of starting and smoothness of operation. A variety of additives is used to improve storage stability and permit the use of otherwise unstable stocks. Polymeric and other types of additives have been used as detergents and dispersants. The detergents have the ability of maintaining fuel injection nozzle cleanliness and will markedly increase operating time between nozzle overhauls. The so-called dispersants increase fuel-filter life, and many diesel fuels also contain rust inhibitors.
The high demand for diesel and jet fuels has made it difficult to obtain appropriate low temperature flow characteristics by base stock selection. This has led to increased use of pour point depressant additives. Several of these materials, both polymeric and nonpolymeric, have the ability to greatly reduce pour points, resulting in substantial improvement in flow through distribution and truck piping systems. However, their effect on cloud point (the first appearance of wax crystals which can cause filter plugging under cold conditions) is small. Nevertheless, pour point depressants have found wide acceptance. Fuel system modifications, such as mounting filters in warm locations or installing filter heaters, have been incorporated to provide for the use of pour point depressants.
Smoke emission laws have led truck operators to investigate antismoking additives. The most functional of these are barium based organic compounds which are effective at concentrations of about 1 ,000 ppm. Effective concentrations of the barium additive are quite costly, and the ash contributed by the barium salts has been a problem in some engines. Therefore, antismoke additives are generally not incorporated into diesel fuels. Two other types of additives are emerging from the development stages. They are biocides to prevent bacterial attack on the fuel and masking agents to improve the odor of exhaust fumes in city bus service.
During the last several years, quality of diesel fuel has leveled off, and it is not expected to change unless unforeseen environmental considerations emerge.
Home Heating Oil
Domestic heating oil must be a clean product and it should form no sediment in storage and leave no measurable quantity of ash or other deposit on
burning. Since it is stored at low temperatures, it should be fluid at storage conditions encountered outdoors during the winter months. The chemical composition of the product must be controlled to assist in reducing smoke emission. Sulfur content, which at one time was not considered a problem, is quite important today. In addition to considerations related to corrosion control, strict limits are imposed by local ordinances to minimize air pollution due to sulfur dioxide which accompanies burning of high-sulfur fuel.
Grade No. 2 fuel oil is the designation given to the heating oil most commonly used for domestic and small commercial space heating. This product is a distillate product, normally fractionated to a boiling range of 350°F to 650°F. During the last 25 years, significant improvements have been made in both the quality of home heating oils and in the manufacturing techniques employed in producing these products. Originally, No. 2 heating oil was composed of selected refinery straight-run stocks blended to meet product quality standards. The resultant product had good stability and was very satisfactory in performance. As the refining industry was called upon to make greater and greater amounts of motor gasoline at higher octane levels, cracking processes were developed to convert virgin gas oils to lighter boiling products. This necessitated the use of increasing amounts of both catalytically and thermally cracked gas oils in finished heating oil blends. Heating oil blending became more complex in order to maintain a satisfactory quality level without excessive treating expense.
The first cracking process to be used was thermal. This process achieved the fundamental objectivemore and higher octane gasoline-but yielded a high percentage of olefinic material. This type of compound was not particularly objectionable in gasoline, but it produced instability in fuel oils during protracted storage intervals. Distillate fuels containing high percentages of cracked stocks tended to form organic sediment. As octane requirements for motor gasoline went higher, catalytic cracking processes were installed, and fuel oils produced from catalytically cracked distillates were high in aromatic compounds. These fuels were not as stable as straight-run materials and were more difficult to burn in older equipment, although they gave no problem in modern burners.
The oil industry worked in several directions to correct the quality problems associated with the ex-
23

tensive use of cracked distillates. New treating processes, improved burner design and the development of additives all progressed simultaneously. Refiners worked closely with equipment manufacturers in the development of improved combustion devices to handle adequately the fuels which were more difficult to burn. At the same time, the industry began to develop and use additives to improve stability. Another development which proceeded concurrently was the use of caustic washing for fuel oil. Several processes were developed using either sodium hydroxide or potassium hydroxide in varying concentrations. These processes were preferred over acid treating and proved to be more effective from the standpoint of improving product stability. Many refiners still use a caustic wash in their processing sequence.
In the early 1 950's, reforming of straight-run gasoline came into widespread use. This process made available to the refining industry large volumes of hydrogen which heretofore had been costly to produce. With this relatively cheap byproduct hydrogen, it was possible to adopt catalytic hydrogen treating as a means of obtaining further improvement in fuel oil quality. The primary objective in the hydrogen treating of heating oils is to enhance their quality by a reduction in sulfur and removal of small, but objectionable, amounts of nitrogen compounds. This treatment also reduces carbon residue, improves burning characteristics and color stability, and reduces sludging tendencies. The problem of sulfur removal has become increasingly important as refiners have increased processing intensity. Incremental crude has also, in many cases, been high in sulfur, further contributing sulfur removal problems.
Quality inspections of the feed and hydrogentreated product from both straight-run and catalytically cracked heating oil stocks show that critical properties are significantly improved in every case by hydrogen treating. Sulfur reduction is generally 70 to 80 percent complete, but can be as high as 90 to 95 percent, if needed. Carbon residue on 1 0-percent distillation bottoms is reduced to less than 0. 1 0 percent. The stability tests show that hydrogentreated products are of excellent quality from the standpoint of both color stability and resistance to sludge formation during storage.
Residual Fuels
Grades 4, 5 and 6 are the designations given the
24
fuels most commonly used for commercial, industrial, marine and other uses involving larger installations than those used for domestic and small commercial uses. Typically, these fuels are used to provide steam and heat for industry and large buildings, to generate electricity in competition with coal or gas, and to power ships. Most users of residual fuels have converted their equipment to handle higher viscosity Grade 6, which is less costly as it utilizes less of the distillate "cutter" stocks which can be converted more readily into gasoline. In the shipping industry, heavy bunker fuels are known as Bunker C and generally correspond to Grade 6 fuel oil.
The largest single user of residual fuels is the electrical power generating industry which consumes about 40 percent of available residual fuel. Because of air conservation measures which tend to favor the use of residual fuels over coal, this segment of the market demand has been the most rapidly growing segment in recent years. In the past few years, the demand for residual fuels to replace coal and the demand for low-sulfur residual fuels have created a degree of disequilibrium in the supply /demand picture. Future growing demand for lowsulfur fuel oils can be met, in theory, by several means, but each strategy has its own particular drawbacks. Adding desulfurization capacity to the existing array of refining equipment involves a substantial time requirement, and desulfurization of fuel oils, especially the heavier grades, is an expensive process. The alternatives of selecting low-sulfur crudes or importing large amounts of low-sulfur residual fuels are no longer plausible solutions because of limited supplies.
Residual fuels are, by their nature, high-boiling and contain stocks which are difficult to burn quickly under "cold" conditions. Accordingly, such fuels are generally burned in equipment which permits relatively steady operation in an environment where firebox temperatures can be high.
Since residual fuels compete directly with other fuels in many areas, the price of the fuel must be competitive. Accordingly, it has not been economically practical to improve the quality of residual fuels to levels which are possible in theory.
The steady increase in the use of catalytic cracking during the last decade has had the effect of decreasing the percentage yield of residual fuels as well as changing their makeup. As more highboiling materials were charged to catalytic crack-
ing, the remaining oil which was sold as residual fuel became heavier and heavier. Common industry practice was to blend these heavy stocks with a distillate to lower their viscosity for a salable fuel. Continued work in this field led to the use of mild thermal cracking of the vacuum still bottoms which yielded a small additional amount of distillate product and reduced the viscosity of the remainiug bottoms. Such . bottoms required less distillate cutter stock to produce a salable residual fuel oil. This modest advance was developed before World War II and was known as visbreaking.
Refining processes in the United States continue to become more efficient in producing the more profitable products, and residual fuels account for smaller and smaller fractions of the refinery output. Increasing imports of foreign residual fuels have kept the sulfur level fairly constant, and the quality of domestic fuels has remained essentially unchanged during this period. On a worldwide basis, residual fuels do vary considerably in quality for a given location, depending on the crude used and the economy of the country where it is refined.
Most of the advances in residual fuel oil technology since World War II have led to improvements in its use rather than in oil quality. Metals such as sodium and vanadium, which are commonly found in small amounts in residual oils, can cause fireside tube deposits in boilers, corrosion and fly ash air contaminants. Some of the sodium can be removed by water washing and centrifugation. There is no known commercially feasible way to remove metals such as vanadium from residual oils. Fly ash and other solid particulates can be removed from stack effluents by use of electrical precipitation, although some practical problems exist.
When combustion occurs, part of the sulfur in the oil may contribute to boiler tube deposits, part may be converted to sulfuric acid, leading to corrosion at low temperature points, and the remainder escapes as oxides into the atmosphere. Methods for desulfurizing residual oils have been developed but have not been economically feasible to date. This economic situation with regard to sulfur content will change in the future as air pollution requirements become more widespread and the availability of low-sulfur fossil fuels cannot keep pace with demand.
The oil industry and boiler manufacturers have recently stepped up their efforts considerably in the areas of desulfurizing fuel oil and flue gas and re-
ducing fuel oil metals content. Several test installations designed to remove sulfur from flue gas are being evaluated. Much work is under way in the research laboratories of both oil and boiler manufacturing companies.
A large number of additives have been developed for reducing residual fuel oil sludge, tube deposit formation and corrosion and for increasing combustion efficiency. Some of these additives are poly-functional. Metal-organic, dispersant-type compounds, such as sulfonates, have been found effective in reducing sludge. Additives for reducing fireside fouling of superheater tubes by metallic compounds have met with some success, but the fouling problem has not been completely solved. Some of the metallic compounds are corrosive at temperatures in excess of about 1 , 100°F. Use of additives to reduce this high temperature corrosion has been reported to be effective in some power plants and gas turbine operations in the United States and Europe. A number of additives for control of deposits and high temperature corrosion contain magnesium, calcium, barium, aluminum and silicon compounds, singly or in combination. These metals are intended to raise the melting point of the potential deposit material so that it will not fuse to the tubes.
Some of the problems in making use of residual oil as a fuel have been alleviated by improvements in burning and handling equipment and in engineering practices. Better alloys have been developed for boiler and turbine components which are more resistant to corrosion. Better oil atomization has resulted from new burner design which has led to improved combustion and reduction of tube deposits. Advances in insulation practices and pump design have made it easier to handle high-viscosity oils. Minimizing excess combustion air has reduced heat loss and the formation of sulfur trioxide, which in turn has reduced corrosion and acid mists escaping to the atmosphere.
From the preceding discussion, it can be seen that, although residual fuel oil often is a byproduct, there have been advances in its use which, at least in some cases, make it economically competitive with gas. Future advances in technology are expected to reduce the amount of residual oil while increasing the production of more valuable products. Catalytic hydrogenation processes will be further developed to upgrade the heaviest high-sulfur residue by reducing its sulfur content.
25
Liquefied Petroleum Gas LPG is a specialty product that has taken on in
creased importance during the past few years. The most common constituents of this product-propane and butane-do not exist to any great extent in most crude oils. However, the extensive use of catalytic cracking and catalytic reforming processes and the growth in hydrocracking have resulted in the production of large quantities of refinery LPG. Prior to the start of the tremendous growth in the petrochemical industry, namely in ethylene production, the major use of refinery-produced LPG was for household and industrial fuel. Now, however, it is anticipated that the industrial demand will increase considerably more due to the shortage of natural gas. Part of this increased demand for LPG will be offset by increased refinery production.
Catalytic cracking of gas oil produces a light ends material which is a mixture of olefins and paraffins. The olefinic portion-propylene and butylenes-is normally converted to gasoline blending components by either polymerization or alkylation. LPG products are produced concurrently in both of these operations. Catalytic reforming of straight-run naphtha is a relatively high-yield process, but appreciable amounts of LPG are produced as a byproduct.
Since LPG must be stored at either reduced temperature or elevated pressure, conventional storage is extremely costly. The refiner has been faced with either the development of less expensive storage techniques or the sale of the product on an asproduced basis. Underground storage proved to be the answer to this problem. Large volumes of storage capacity could be obtained for a reasonable cost, allowing the refiner to store the product during the summer months for sale during the heating season. The large petrochemical demand for LPG has created a need for even greater storage capacity.
On March 2, 1 97 1 , there was reported to be a total of 1 69 ,881 ,000 barrels of underground storage capacity. This figure represents a 5 1-percent increase over 1 966. In addition, there is a total of approximately 5 ,300,000 barrels of storage aboveground. Various types of storage are employed. Some facilities are mined from granite, shale, limestone or chalk, while others consist of caverns in salt domes or strata. Water and gas sands are used in some areas, and the use of frozen pits has recently been employed. Storage in salt formations is the most prevalent installation and can be developed very economically by drilling a hole into the salt
26
strata. Water is then forced into the hole to dissolve the salt. When the cavern reaches the desired capacity, circulation is discontinued and the required injection equipment for the specific product to be stored is installed. Products are removed from storage by adding saturated brine or water. When products are added to storage, water is displaced into pits or ponds, as the case may be.
Underground storage was originally developed for conventional LPG products. It is now used for numerous petrochemicals such as ethylene, propylene and butylenes. This development has saved industry and the consuming public millions of dollars during the past few years.
Engine Oils, Gear Oils and Transmission Fluids
Automotive Oils Engine oils, gear oils and automatic transmission
fluids are three major products used in automotive applications. Each product has many varied requirements imposed by governmental agencies, equipment manufacturers and end-users. Engine oil developments of the future will be more difficult and costly because of the advent of new and different engine types, different fuels and compositional constraints imposed by environmental considerations.
The primary functions of lubricants are to lubricate, seal, cool, clean, protect and cushion. Lubrication means the separation of the moving parts of the engine so that the engine operates without excessive friction and with minimum wear. The separation is a result of an actual buildup of an oil film between moving parts called hydrodynamic lubrication and is the ideal type of surface separation. However, such parts as cams and lifters may operate at loads (or at slow relative sliding velocities) which do not permit the development of a hydrodynamic film and, therefore, must be separated by a chemical film. Certain materials provide chemical films that are able to carry tremendous loads. These are known as antiwear, extreme-pressure or antiscuffing additives. Thus, these materials also provide a separation and prevent scuffing and catastrophic wear, keeping friction to a minimum.
There must be a sealing oil film between the piston ring and the cylinder wall because, without its presence, small grooves, machine marks and minor imperfections of the ring and cylinder surfaces would permit loss of compression and loss of combustion efficiency. The degree of resistance to flow

(viscosity) of an engine oil is the property which provides the sealing qualities.
The engine oil acts as an indirect heat-transfer medium. While the major portion of the heat rejection from stationary surfaces is dissipated directly by the engine cooling system. Pistons and bearings are cooled indirectly by the circulating engine oil. With too viscous an oil, proper cooling will not be obtained; with too thin an oil, improper sealing and poor lubrication will result.
Cleaning keeps the internal engine parts free of generated harmful deposits. Dispersant and detergent additives keep contaminants, which result from oil oxidation and from products of fuel combustion, in suspension. These harmful deposit-precursors are then drained with the used engine oil.
Acids and water, formed during combustion or from products of combustion, can attack iron and steel engine parts. Further, contaminants which result from oil oxidation and from products of fuel composition can result in corrosion of nonferrous engine parts, primarily bearings. Protection against corrosion can be accomplished by additive agents which form a tightly adhering protective film or by agents which neutralize acids which are formed. In addition, oxidation inhibitors have a secondary effect of reducing corrosion by interfering with the chain reaction that causes oil to break down into corrosive products.
The shock absorbing qualities of engine oil cushion mating surfaces and reduce engine noise and extraordinary engine stresses. This is accomplished by the strength and elasticity of the viscous film.
In order to perform the six functions just discussed, a good engine oil must possess some important characteristics. These characteristics can be divided into two classes: ( 1 ) those attributable to the base oil used and (2) those imparted to the oil by additives. Engine oils are formulated by adding required agents to a well-defined and carefully chosen base oil. A good base oil requires careful selection of crude oil as well as selectivity in refining. Qualities not attainable by refining methods alone are obtained by additive agents.
Some of the more important engine oil characteristics are described in the following:
• Good Temperature/Viscosity Properties: The Society of Automotive Engineers (SAE) has defined grades of viscosity. These engine oil viscosity classifications are based on oil viscosity at 210°F and/or 0 °F. Single graded engine
oils, which are required to meet the viscosity requirement at 2 10°F only (e.g., SAE 30), are generally achieved with proper selectivity of base oils. Multi-graded oils, which are required to meet viscosity requirements at both 0 °F and 2 l 0 °F (e.g., SAE lOW /50), generally require the addition of polymeric additives called viscosity index (VI) improvers.
• Good Oxidative and Thermal Stability: The conditions in the engine are ideal for oxidation. High temperatures and catalytic surfaces serve to accelerate oxidation. The oxidation stability of an oil is partially controlled by the type of crude and refining process used in manufacturing the product. However, the major contribution to oxidation stability is made with additives known as oxidation inhibitors. The end result of poor thermal stability may be very similar to that of poor oxidation stability, i.e., lacquer or sludge formation that causes ring sticking, plugs passages, and causes excessive thickening of the oil, and the two effects may be combined and confused. Thermal stability is usually not subject to control by additives, but is an inherent characteristic of the base stock itself. Sometimes additives themselves are not thermally stable.
• Good Dispersancy: Engine oils must keep the engine clean if the engine is to operate properly. As foreign materials enter the oil, they tend to agglomerate into large particles and settle out as deposits. Dispersants prevent the agglomeration of these particles. Metallic soaptype materials, of which calcium or barium sulfonates are probably the best known examples, are effective dispersants at high temperatures. Polymeric materials, known as ashless dispersants, are highly effective in handling sludge under low temperature conditions.
• Antiwear Effectiveness: Under the proper conditions (load and relative sliding velocities of mating surfaces), the lubricant has sufficient viscosity to provide hydrodynamic lubrication. Even so, corrosion may cause wear. One way of preventing this corrosive wear is to provide an additive with an alkaline reserve which will neutralize corrosive acids that can form when the lubricant is stressed during use.
When conditions are not favorable to the formation of a hydrodynamic lubricating film,
27

boundary lubricant additives are required. Zinc dithiophosphate is a very effective and wellknown additive for protection of highly loaded surfaces within an engine.
• Antirust Effectiveness: Short trip and cold weather service, longer oil drain intervals, and closed crankcase engine systems are controlled by chemicals that neutralize the corrosive materials or by surface-active agents that prevent corrosive materials from contacting the surface.
• Antifoam Effectiveness: Agents are required to minimize the foaming tendency of engine oils.
Modern engine oils contain greater or lesser amounts of each type of additive depending on engine severity and/ or end-user service.
In the period just prior to and during World War II, developments in gasoline and diesel engine design and operating conditions resulted in the introduction of many new types of crankcase oils. The American Petroleum Institute (API) was asked to define these new oils so that engine manufacturers could recommend oils accordingly. API definitions "regular," "premium" and "heavy duty" were published in 1947. By 1 949, it became evident that these categories were not satisfactory, and a system to classify oils by intended use was needed. In 1 952, API published the revised system. It included six classes of service-three for gasoline engine service (ML, MM and MS) and three for diesel engine service (DG, DM and DS) . Again by 1969, the need for an improved system became apparent. Accordingly, in 1 97 1 , the Engine Oil Performance Classifications were adopted by API, ASTM and SAE.
The classification system divides service station (gasoline) engine oil performance into five separate categories. This group includes service classifications (SA, SB, SC, SD and SE) describing oils for use in passenger cars and light trucks. Also, the classification system divides the commercial and fleet (diesel) engine oil performance into four categories. This group describes commercial classifications (CA, CB, CC and CD) for use in heavier vehicles. The new Engine Oil Performance and Engine Service Classification system provides a sound technical basis for proper labeling of oils and is open-ended, allowing new categories to be added when needed. Oils which meet the performance requirements of several categories may be labeled with all the appropriate designations.
In addition to those lubricants mentioned, there
28
are several important types of specialized engine lubricating oils. Oils for two-cycle outboard engines and other two-cyle engines have a special requirement because these engines are sensitive to lubricating oil ash which tends to foul spark plugs. Under conditions of high output, such as water skiing, this ash can cause preignition and burn holes in pistons. Consequently, many lubricating oils for this service have used ashless detergents of the amido-amide or the succinimide type and have been an outstanding success.
Another specialized service is the railroad diesel engine. Most of these engines employ silver wristpin bearings which are easily corroded by active sulfur. Consequently, they cannot use oils containing zinc thiophosphates even in the presence of silver pacifiers. It is necessary, therefore, to formulate these oils with high detergency and high resistance to deterioration with other inhibitors. This has been done successfully and outstanding service is being obtained with the best oils.
It is not possible to predict exactly what kind of engine oil will be required for the future since new hardware will be required to cope with the stringent exhaust emissions standards. Potential emission control systems include retarded spark timing, leaner air/fuel ratios, catalytic converters, exhaust reactors and exhaust gas recirculation. As antipollution devices are added, the small amount of engine oil carried into the combustion chamber will play an increasing role in the kinds and qualities of exhaust emissions. As such, engine oil composition will have to conform.
As an example, catalytic converters will require that an unleaded gasoline be used, and testing with unleaded gasolines indicates that improved oil performance with regard to antirust will be realized. However, increased deposition of varnish will also result. Potentially, these deposits could change the operation of the engine. Phosphorus and sulfur are harmful to some catalytic converter systems and, since many of today's engine oil additives contain either or both of these elements, substitute compounds may need to be discovered.
Emissions equipment results in higher under-hood temperatures either by causing combustion inefficiencies or acting as a secondary heat source. These engine modifications may result in increased bulk engine oil temperatures of 1 5 °F to 20°F.
In order to cope with requirements imposed by environmental considerations, composition of engine

oils of the future may be radically different from that used today.
Gear Oils
The gear lubricants supplied to the military during World War II were, by present standards, relatively low performance materials. Specifications were simple and could easily be met with products available at that time. Although these lubricants proved to be entirely satisfactory when using the equipment available then, they could not match the advancements in gear design that greatly increased loadings. Therefore, many automobile manufacturers used "active sulfur" gear lubricants which were primarily mineral oil plus 1- to 2-percent elemental sulfur. These gave satisfactory performance in passenger car axles in use at that time, with the only undesirable quality being a high corrosion rate.
The more powerful engines developed in the early 1950's and the wide use of complex hypoid gears to lower the height of the car again made improved gear lubrication necessary. This demand was met with improved base oils to provide better thermal stability and improved flow characteristics at low temperatures, plus introduction of numerous additives to provide wear protection, corrosion resistance and high abrasive protection. Lubrication under the most extreme pressure conditions is afforded by additives that chemically react with the gear teeth to form a protective wear-resistant film. These lubricants are vastly superior to earlier products.
A new type of axle design, offered in recent years as an option on passenger cars and light trucks, has more demanding lubrication requirements than standard differentials. It is the so-called "limited slip" differential which provides maximum torque on the wheel having the best traction. These axles greatly increase an automobile's traction under slippery conditions and are very desirable where operation in snow or mud is common. The major difference in lubrication requirements involves the clutches in this complicated differential that require special lubrication to avoid chatter. This has been met by new additives which provide frictional characteristics that minimize or eliminate this problem.
Developments in axle and gear lubricants have reached the stage where, on a practical basis, they have ceased to be problems. Drainage of these lubricants is rarely necessary over the life of the car, and, in recent years, manufacturers have even eliminated the drain plugs.
Commercial fleets, including those employing heavy-duty trucks, use essentially the same kinds of lubricants as do the passenger cars. In low-speed, high-torque service, lubricant replacements are more frequent but here, too, the gear lubricants have been highly satisfactory and service complaints are rare.
In the future, gear lubricants should continue to improve in wear protection and stability and to minimize maintenance costs in commercial operation.
Automatic Transmission Fluids
The fluids used in the automatic transmissions of passenger cars and light trucks are considered extremely sophisticated, exacting and the most complicated of all petroleum products.
When the first automatic transmission, "the Hydramatic," was introduced by Oldsmobile in 1 938 , the only source of fluid was the Oldsmobile Division of General Motors Corporation. The product obtained from the petroleum industry was supplied by Oldsmobile and usually gave satisfactory performance. Neither uncompounded mineral oils nor the few compounded engine oils available in 1938 were satisfactory in this transmission.
The automatic transmission was so successful and grew in use so rapidly after its introduction that better, more functional lubricants were required. The functions of an automatic transmission fluid may be described as follows:
• A mild extreme-pressure lubricant to protect the transmission planetary gears and thrust surfaces
• A hydraulic fluid with non-foaming properties for trouble-free operation in torque converters and fluid couplings and in the hydraulic valve controls
• A fluid with such high oxidation resistance that it can sustain exposure to high temperature (up to 325 °F) and atmospheric oxygen without forming varnish and sludge which would prevent operation of the sensitive transmission valve systems
• A rust preventive and anticorrosion lubricant which will not affect any of the various metals, gaskets, rubber seals, clutch facings and other materials present in the transmission
• A fluid with proper low temperature viscosity for rapid response and trouble-free operation down to -40°F
29

• A lubricant which will allow smooth engagement of the transmission clutches and bands without excessive slipping or grabbing, retaining its frictional characteristics virtually for the life of the converter, even when mixed with other approved fluids
• A heat transfer medium which can transfer up to 1 ,500 BTU's per minute to the oil cooler and transmission case for dissipation to the atmosphere.
On an overall basis, automatic transmissions and automatic transmission fluids have been highly successful commercially. They are used in a vast majority of passenger cars, and the drivers expect and receive perfect performance.
The automatic transmission fluids used in trucks, buses and tractors, with only a few exceptions, are analogous to the passenger car products. They differ in two important respects-they use far less VI improver, being more like single grade motor oils, and more emphasis is placed on extreme pressure and wear-resistant properties. Because the operators of this type of equipment engage in preventive maintenance and because the transmissions themselves can be drained, flushed and refilled, excellent service is being obtained.
Industrial Lubricants
As a country that has continued a strong pattern of industrial growth during the last several decades, the United States has required the development of new and improved industrial lubricants. Machine, process and lubricant design have provided the basis for increased production rates of improved goods under operating conditions that were impossible earlier. This continuing improvement of machines, processes and industrial oils is essential if the needs for products of the future are to be satisfied.
The U.S. Department of Commerce Bureau of the Census has divided industrial oils into two groups in their surveys. * One group designated "Industrial Lubricating Oils" includes "industrial, marine and railroad oils intended primarily for lubrication purposes and including oils sold for cutting purposes." The second group "Industrial Other Oils" includes "products derived primarily from petroleum and having a viscosity of more than 45 Saybolt Seconds
* U.S. Department of Commerce/Bureau of the Census, Sales of Lubricating and Industrial Oils and Greases 1969 (January 7, 1 97 1 ) .
30
at 100°F and intended for processing, testing, or other non-lubricating use and which are sold by the gallon and excludes solvents, asphalts, petroleum chemicals, etc."
The 1969 Bureau of the Census survey reported the total U.S. domestic sales of industrial oils as 1 , 1 23,202 thousand gallons, just slightly higher than the sales of automotive oils. In the 10-year period 1 960-1969, industrial oil sales grew 56 percent compared to 1 1 percent for automotive oils for the same period.
Industrial oils are formulated to perform a broad range of functions under a variety of operating conditions. The major functions provided include lubrication, friction modification, heat transfer, dispersancy and rust prevention. These and other functions are provided in today's industrial oils over a wide range of temperatures, pressures and operating lives. The base fluids for these products range from petroleum-derived oils to emulsions and synthetic fluids designed for the specific application. The fluids' performance functions are modified as required for each application by the addition of chemical additives.
Hydraulic fluids illustrate the continuing advances in industrial oil technology. Machine development in recent years has featured higher operating speeds, temperatures and pressures. In large machine tools, the lubricant must provide controlled friction characteristics to assure accurate positioning of the work piece and cutting or forming tool. The sophisticated hydraulic systems used in many complex machine tools also require very clean and stable fluids to avoid clogging or sticking of precision hydraulic controls. New hydraulic oils have been designed to meet these requirements.
Fire resistant hydraulic fluids have also been developed for high pressure hydraulic equipment operating near open flames or molten metal ignition sources. These lubricants range from flame resistant phosphate esters to oil and water emulsions and are very effective in preventing serious fires that can result when conventional oils are sprayed from a broken line or hose in the presence of an ignition source. Many coal mines are now shifting to these fire resistant hydraulic fluids in underground mining equipment for improved safety.
Improvements have also been provided in metal working fluids. Cutting fluids have been formulated to allow higher cutting speeds and extended tool life. Machining operations requiring a large amount
of cooling frequently use emulsions of soluble oils, compounded to provide lubrication of the cutting operation and antirust protection to the work piece over a wide range of concentrations in easily prepared emulsions. Additives containing sulfur and/or chlorine are also frequently used to improve cutting oil performance.
Sulfurized sperm oil and chlorinated sperm oil have been used in a wide variety of industrial and automotive lubricants. Sperm oil is a product of the sperm whale, and, when this species was placed on the list of endangered species by Congress, additive companies developed sperm oil substitutes, and the U.S. petroleum industry reformulated their product lines to eliminate the use of additives based on sperm oil.
In a similar manner, the industry is cooperating in the identification and elimination of chemical additives suspected or known to be toxic or carcinogenic. These actions are especially important in industrial oil applications where the user has frequent exposure to the oil or its products. Thus, industrial lubricants are providing increased safety with improved performance.
Greases
Greases are basically gels and are composed of lubricating oil in a semi-rigid network of a gelling agent such as soaps, clays and, more recently, totally organic substances. The simplest view of the way greases work is that the gel serves as a reservoir for the oil which is slowly drawn out of the gel to provide continuous lubrication of the working parts of mechanical devices. To a large degree, grease improvements have followed the pattern of lubricating oil. Base oils and additives are selected to give maximum resistance to heat and oxidation and to provide antirust and extreme pressure lubricating properties. A thorough investigation of thickening agents has made it possible to select those which provide the proper balance of cost and resistance to heat, water and mechanical degradation. In addition, the grease manufacturing process itself has undergone extensive development to ensure the maintenance of high and uniform quality products.
Since 1 946, improvements have been made in the three types of components of a grease: thickener, fluid and additives. New thickeners introduced include modified clays, polyureas, barium, calcium, aluminum, and lithium complex soaps, sodium
terephthalamate, and dyes. All of these are multipurpose in that they are both water resistant and high melting. Although lithium soap greases were discovered during World War II, they (especially lithium hydroxystearate) have reached prominence since 1 946 and in 1971 constituted over 50 percent of the volume of grease sold in the United States.
The improvements in fluids have been largely in the synthetic oils. Examples are silicones, fluorinated silicones, diesters and polyesters, fluorocarbons and, most recently, synthetic hydrocarbons. These generally permit the grease to operate over a broader temperature range but, because of their high cost, are of principal interest to aviation and aerospace, although lately an increasing amount has been used in severe industrial and even automotive applications.
The improvement in additives has largely been a byproduct of research aimed primarily at additives for automotive and aviation oils. However, the grease formulator faces a more complex task than does the lubricating oil formulator because the gelling agent is frequently found to be incompatible with the additives that are commonly used in lubricating oils, the incompatibility resulting either in a loss of function of the additive or in the degradation of the mechanical properties of the grease.
Improved greases have brought about many changes in the industrial field, and electrical motors are a good example. At a temperature of 300°F, bearing life has increased from 250 hours to 4,000 hours due to improved greases. This has made possible the continuing trend toward more compact but hotter running (Class F) motors and sealed-for-life bearings. The growing emphasis on environment and safety has also demanded quieter running electric motor bearings. This has been primarily a challenge to bearing manufacturers, but they have become more conscious of the noise contribution due to grease (even though grease noise usually decreases after initial running of the bearing) and are considering noisiness in selecting greases. Grease noise seems to be related to both type of additives and thickening system.
In the automotive field, the need for improved chassis greases has been brought about through extension of warranty periods and of recommended chassis lubrication intervals. Likewise, and in view of rising labor and capital costs, users of mobile equipment are demanding superior greases to allow them to reduce frequency of lubrication without endangering their operations or equipment. More recently,
3 1

innovations in the automotive industry due to safety and environmental considerations are causing many bearings to run under higher temperature conditions, and this results in a need for more heat-stable greases. Examples are wheel bearings next to disc brakes and under-the-hood bearings such as those for alternators and fans.
Advances in lubricating grease technology have been largely paced by the needs of aircraft in the past and are now being influenced by the requirements of missiles, rockets and spaceships. These applications represent the most severe requirements and are the targets used in much of the research on new types of grease thickeners, fluids and additives. The aircraft greases of today are expected to operate at temperatures from - 100°F to 600°F and at bearing speeds of up to 50,000 RPM, to be corrosion inhibited, to possess high oxidation stability and high load-carrying capacity, and to generate very low torque at extremely low temperatures.
Although there is no single aircraft grease which will fulfill all the requirements outlined above, there has been a trend in the past few years on the part of the military to consolidate their grease specifications, and this has resulted in their demand for fewer, but much higher quality, greases. An example of such consolidation is MIL-G-8 1 322A (Grease Aircraft, General Purpose, Wide Temperature Range) grease which is designed to operate at temperatures between - 65 °F and 400°F and has required use of the recently developed synthetic hydrocarbon base fluids.
Commercial aviation has benefited by grease innovations brought about by the military, but this market must temper its requirements with economic considerations.
In summary, recent years have brought quality improvement in greases for a wide range of uses. However, opposing trends have caused grease production to remain fairly constant over the last several years. The general use in industrial activity and output of machinery has been counterbalanced by the extended lubrication intervals made possible by improved grease quality. Companies reporting in the National Lubricating Grease Institute (NLGI) Survey indicated a total U.S. 1971 grease production of 439,341 ,000 pounds. The survey illustrated the trend toward increased production of superior greases such as non-soap (organic or modified clay), lithium, and complexes of aluminum, calcium and lithium at the expense of the older, but less versa-
32
tile, conventional calcium, sodium and aluminum soap greases.
Specialty Products
In the present context, specialty products are defined as encompassing hydrocarbon solvents (both saturated and aromatic types), process and extending oils, and petroleum-derived waxes. During the past several years, the field of specialty products has undergone drastic changes. Since these products generally are oriented toward a relatively few large volume industrial consumers rather than a myriad of small individual users, specifications tend to be dictated, on a custom basis, by a particular industry's needs. Many of these industrial needs are evolving rapidly in response to advancing technology and the growing variety of specialty products is a reflection of this changing business environment.
In today's market, specialty products are frequently tailored to fit a particular customer's specifications and needs. Therefore, it is difficult to delineate changes which are likely to occur in future demands for product quality and composition. In general, the trend has been moving toward higher quality products of greater purity which meet more exacting and more detailed specifications. Technological advances in such fields as surface coatings and dry cleaning are likely to perpetuate this trend. A further, and perhaps overriding, factor is the impact of existing and impending governmental regulations applicable to specialty products, especially solvents.
Petroleum Solvents Previously, solvents were divided into two groups
-those that are mixtures of saturated hydrocarbons and those rich in aromatics. This chemical classification still exists, of course, but more and more frequently the designations "exempt" and "nonexempt" are being used. These adjectives refer to whether or not a given solvent composition is subject to regulation by any of the numerous state environmental conservation laws similar to the initial Rule 66 first promulgated by the Los Angeles County Air Pollution Control District.
The areas most plagued with air pollution problems consist of the Gulf Coast, the Central and Eastern Atlantic Coast, much of California and all major urban areas. Regulations concerning solvent usage reflect this fact because today one-third of the states, those most troubled by air pollution, have

laws governing the use and photochemical reactivity of petroleum solvents. Today's regulations focus on aromatic solvents which contain elements known to undergo photochemical reactions in the atmosphere leading to smog; these are the so-called non-exempt (from regulation) solvents. On the other hand, paraffinic and naphthenic solvents are relatively inert with respect to atmospheric photochemical reactions, and this class of solvents constitutes the exempt category. Future regulations, without a doubt, will focus increasingly on exempt solvents as control of non-exempt compositions becomes virtually absolute. Indeed, Los Angeles County now is proposing to begin regulation of the previously exempt solvents.
Surface coatings represent the largest single end use for hydrocarbon solvents, and in no area of solvent usage is the impact of new technology greater than this one. For example, in 1 965 about 50 percent of interior paints were water-based; today, three-fourths of all interior paint used is waterbased. This trend will continue. Historically, users of exterior paints have not accepted water-based products as readily as users of interior coatings, but in 1 965 25 percent of exterior paints were water-based while today that figure has doubled. In the future, increasing numbers of paint formulations will be captured by aqueous systems . Quite recently, the previously impenetrable markets for gloss paints and high-gloss enamels have been invaded successfully by water-based products.
Solvents employed in industrial coatings also are undergoing changing demands due to government regulations and evolving technology. Large industrial users of organic solvents are facing requirements to either recover or incinerate volatilized solvents, and this factor markedly increases the costs associated with use of petroleum-derived solvents. In those facilities having suitable solvent recovery or incineration facilities, aromatic solvents will continue to be used. For other installations, however; continued pressure wiii be exerted to minimize aromatics levels in solvents, and this demand will require greater use of extraction and/ or hydrogenation facilities in refining operations. In many applications, hydrocarbon solvent systems for industrial coatings are being supplanted by new technologies such as powder coatings or electro-coated finishes. Over the long term, this current trend seems likely to continue.
Another large end use of petroleum-derived sol-
vents is printing ink. Printers, too, are confronted with the requirement to reduce or eliminate evaporative emissions, and this pressure is felt keenly because aqueous printing inks have not found wide acceptance in the industry. The demand for large volumes of organic solvents which has existed historiqlly in the dry cleaning industry is likely to continue, although future demand will reflect the growing practice of solvent recovery. Small dry cleaning establishments frequently use halogenated organic solvents such as perchloroethylene, while large central dry cleaners rely on hydrocarbon solvents. The demise of small neighborhood dry cleaning firms and the growing centralization which is characteristic of this industry represents a factor tending to increase the demand for petroleum solvents. This trend is amplified by the growing practice of dry cleaning institutional linens rather than laundering them as was formerly done.
Process oils and extending oils are relatively static with regard to demand and composition. New light-colored rubbers and polymers accentuate the need for color-stable extending oils, and this requirement poses a dilemma because highly aromatic extending oils, desired for their high solvency, are generally more prone to discoloration than paraffinic products. Although naphthenic extending oils represent a good compromise between solvency and color stability, the use of such naphthenic oils is limited by the dwindling domestic supply of the appropriate crudes.
Waxes At one time, wax was regarded as a waste material
and was cracked to yield gasoline and other fuel products. Large amounts are still processed in this manner. However, the growth of the paper industry has developed new markets for paraffin wax, while developments in waterproofing, impregnation of electrical equipment and other allied uses have resulted in an increased demand for microcrystalline waxes. These two types of wax are produced from entirely different feed streams.
Paraffin wax is separated from paraffinic distillate and is subsequently purified to produce a fully refined wax. Prior to 1 940, most paraffin wax was recovered by pressing and filtration, producing slack wax which was purified by sweating (slow heat treatment) and further filtration. Fully refined wax is essentially free of oil and has been rendered tasteless, odorless and stable to light and heat. Since
33

World War II, solvent extraction techniques have been developed and now replace the pressing operation in the production of slack wax, which is further processed to either scale wax or fully refined wax. Although several grades of paraffin wax are produced, physical and chemical properties of this product are very similar. The exact properties of a particular grade are a function of its end use. A very high percentage of paraffin wax is used in the field of paper coatings. Other uses are in the manufacture of pharmaceuticals, cosmetics, candles and rubber compounding.
Microcrystalline wax can be separated from three sources as motor oil wax, residual microcrystalline wax and tank-bottom wax. In contrast to paraffin wax, no two grades of microcrystalline wax are alike. This difference results from a variation in both crude source and processing techniques. Of the three types of microcrystalline wax, that produced from the residu.al of a crude refined for lubricating oil is of significant commercial importance. The residual microcrystalline wax is the least like paraffin. Its color varies from black to white, and it is tough, ductile and flexible over a wide range of temperatures. In these characteristics, these waxes closely resemble such natural waxes as beeswax and spermaceti. The lamination of paper products is the largest single use of the microcrystalline waxes. Other uses are waterproofing, electrical equipment coatings, rubber compounding and applications where they replace either vegetable wax or beeswax.
The wax industry was affected in the early 1960's by the widespread use of synthetic polymer coatings on paper products, such as milk and juice containers. As coatings of polyethylene extrusion resins replaced wax in many markets, the demand for wax in paper and board coating declined substantially over the period of a few years. The recovery of the wax industry which has occurred is due primarily to the development of new wax-modifying synthetic resins. These blends are less expensive than straight plastic coatings and have more desirable properties than wax alone. These wax-resin blends are harder and more flexible, adhere better, have better gloss and more resistance to water vapor and grease, and do not flake. The resin additives currently in use include ethylene-ethyl acrylate copolymer and ethylene-vinyl acetate copolymer.
Although synthetic resins have taken a large share of the wax market in the past few years, other promising uses for this product are developing. Wax pro-
34
ducers are investing in a substantial research effort for product improvement. One recent use for wax is in wax-impregnated corrugated containers . These cartons are replacing the metal-bound wooden boxes used to ship poultry and fresh vegetables. Other areas of expected growth are waxed paper and frozen food containers. Besides improving products, wax producers have launched an extensive promo� tional campaign intended to inform customers of the technical advances made recently in wax formulations and modifications.
Asphalt Asphalt has been used by man throughout re
corded history and is still the least expensive and perhaps most versatile adhesive and waterproofing material known. It is found in the heaviest fraction of certain crude oils. In some cases, a satisfactory asphalt (meeting recognized specifications) may be obtained by simple steam-vacuum distillation of the crude. In other cases, it will be necessary to blend the residues of two or more different crudes. In certain cases, the distillation residue will contain fewer asphaltenes and more resinous and oily constituents than is desirable or necessary. This can be adjusted by air-blowing or blending and air-blowing. Although asphalt is essentially a natural product of petroleum, its chemical and physical characteristics can be varied considerably by crude selection, blending and processing.
In 197 1 , U.S. asphalt consumption was 32,270,000 tons, amounting to 4.3 percent of the crude oil run to stills. About 80 percent of this asphalt was consumed in paving, 1 4 percent in roofing, and 6 percent in various other uses. In 1945, the asphalt consumption was 5.0 million tons, divided among paving (68 percent) , roofing (22 percent) and miscellaneous (10 percent).
The constantly growing consumption of asphalt has been the result of continuously improved methods of using asphalt, particularly in road construction and maintenance. Asphaltic cements, liquid asphalts and asphalt emulsions used for highway and road paving meet a wide variety of criteria necessary to do a good job. This has been proved by the fact that, of the 1 ,660,000 miles of paved roads in the United States in 197 1 , 93 percent contained an asphalt binder compared to 7 percent with portland cement binder. Recent technology has been developed to the point where "deep-strength" asphalt highways can be built for less money and perform

better with less maintenance than comparable concrete highways.
This improved construction has been achieved concurrently with improvement in asphalt specifications. The quality level of asphalt sold by the industry is determined primarily by specifications set by state and federal government agencies. During the past decade there has been much activity among specification writers to develop specifications tests and limits to ensure that asphalts from a wide variety of sources can be used successfully in road construction. This has resulted in a new generation of specifications just now being established which attempt to improve uniformity of pavement densification (through grading by asphalt viscosity at 140°F rather than by penetration at 77°F) and eliminate asphalts of unacceptably poor durability (through heat-aging and ductility tests). At the same time, these specifications attempt to improve lower temperature resistance to cracking by eliminating asphalts of very poor temperature-viscosity susceptibility.
In recent years, better construction procedures for placement of asphalt pavements have been developed. The use of self-propelled pneumatic tire rollers has been one of the biggest contributions to better compaction of asphalt concrete highways. Electronic controls have been developed for full automation of the asphalt pavement mixing plants. Numerous electronic methods have been developed for control of depth, leveling, etc. , on asphalt pavers. User agencies have pioneered the construction of asphalt pavements by the "thick lift" operation. This construction method consists of placing from 5 to 1 8 inches of paving material in one operation rather than placement of multiple layers of 1 .5- to 3 .0-inch thicknesses. This method results in much more rapid construction and considerable reduction in cost. Other benefits are better compaction and density. Another development in paving construction that has added to the safety of roads is the design of more skid resistant surfaces by the use of thin overlays of asphalt and selected aggregates . This design is commonly known as "open graded mix."
The asphalt paving industry has not been untouched by the demands of environmental consideration. Governmental agencies are beginning to put restrictions on the types of solvents used in asphalt cutbacks. Mix plants have had to install sophisticated and expensive trapping systems to minimize dust blown to the atmosphere from the aggregate dryer. These restrictions are accelerating the use of paving
methods based on asphalt emulsified in water in which non-dried aggregate may be used.
An accelerating trend which has been increasing the amount of asphalt used per mile of pavement is the "full depth" concept in which an extra thickness of asphalt concrete is substituted for the greater thickness of compacted aggregate used in older type construction. Among other advantages, this system of construction conserves the Nation's supply of good aggregates which has already become scarce in certain areas. The acceptance of this and other advancements in asphalt paving design has been made easier by the development of rational methods of pavement design resulting from considerable recent activity on the part of governmental, institutional and private research agencies.
The second largest usage of asphalts is in roofing, and asphalt roofing is expected to be used on 75 percent of the 26 million new homes expected to be built within the next 10 years. Quality in roofing asphalt is maintained chiefly by the judicious selection of crudes plus modification by air-blowing. Asphalt technologists work closely with shingle manufacturers in modifying asphalt qualities to meet the changing demands in the roofing industry. New and expanding uses for asphalt, aside from roofing and road construction, are the lining of reservoirs, canals, swimming pools and sewage lagoons for seepage control. Asphalt is also being used for the facing of dams and river banks for erosion control and the construction of asphalt-stabilized breakwaters, seawalls, groins, etc., for the control of sea currents.
To meet the increased demand for asphalt, the industry has increased capacity by installing additional seasonal tankage, by adjusting crude runs and by providing additional plant yield by installing inline blending and solvent extraction facilities. Special barges and tankers have also been constructed for economical long-distance transportation facilities to ease the local shortage situations. It has been an ever growing challenge for the industry to maintain its asphalt supplies and quality in the face of other demands on the asphalt portion of the crude barrelthe increased requirement for low-sulfur residual fuel and expanding the use of coker processes for production of catalytic cracker feed.
Now research is under way toward finding further uses for this versatile material as an extender in polymer-asphalt systems. Thermosetting and thermoplastic compositions may well result, with enhanced properties for use as special coatings, cement and
35

adhesives. Alone or in combination with polymers, asphalt will continue to be widely used by the Nation's building and highway industries. Very promising re-
36
sults have also been obtained in the use of asphalt in soil stabilization and as a moisture barrier in sandy soil.

Chapter Two
Refining Techniques
Since World War II, major changes have taken place in refinery processing. Entirely new processes, many employing catalysts, have been introduced and perfected while older thermal processes have almost disappeared.
This chapter traces the flow of crude oil and its fractions through the modern refinery. It starts with desalting, which removes fouling and corrosive contaminants, and follows with atmospheric and vacuum distillation, which separates the crude into various fractions. The trend toward replacement of the older thermal conversion processes of cracking, visbreaking and coking by catalyst systems is described. The newer processes include catalytic cracking and hydrocracking. This same trend toward catalytic processes is seen in the rapid growth of catalytic reforming, alkylation and isomerization which are used to produce high octane components for gasolines.
Hydrotreating processes, also employing catalysts, are shown to be growing rapidly in application to remove sulfur and nitrogen compounds and to improve odor, color and stability of gasoline and other fuels. In addition, desulfurizing of whole crude or wide boiling fractions of crude for the express purpose of producing low-sulfur heavy fuel oil is gaining in importance.
The final finishing, treating and blending techniques used in the modern refinery to ensure highest product quality are outlined. Also contained in this chapter is a description of the refining of .lubricating oils, including growth patterns of the various techniques employed.
Major Refinery Processing Steps
Desalting Broadly speaking, desalting involves elimination
of water-soluble, corrosive contaminants from crude oil. Deposition of salt and corrosion resulting from these contaminants causes a decrease in heat transfer rates by fouling and promotes the formation of coke deposits in refinery processing equipment. Modern desalting practice also reduces oil pollution in process condensate water. Such condensate is used in the desalting process to provide necessary dilution water for dissolving contaminants from the crude oil. At the same time, the crude oil extracts the dispersed oil and other oil-soluble contaminants from the condensate, thus eliminating one source of waste water pollution.
Crude oil desalting capacity has increased significantly since 1 945 and is likely to continue to increase, chiefly because of a change in the pattern and character of worldwide crude development and exploration which has resulted in the refining of increasing quantities of salt-contaminated crude. Essentially the same desalting processes (chemical treatment, electrical treatment and combinations of the two) are being used today as were used in 1945.
The technological and economic advantages of two(or multi-) stage configurations were applied in the later portion of this period.
The extensive use of desalting by the refining industry has contributed to producing petroleum products at a lower cost in two ways. First, lower fuel costs are realized by operating at higher heat transfer coefficients with clean equipment; second, less corrosion and fouling of equipment has meant longer processing intervals between mechanical overhauls.
37

During the 1973-1985 period, U.S. petroleum desalting capacity is expected to increase at the same rate as the amount of crude oil processed. Essentially all of the crude run in 1985 will be desalted prior to processing. New desalting plants will consist of large multiple-stage units using a combination of thermal and electrical techniques. Some minor improvements in chemicals and equipment may occur, but there should be little or no change in capital costs of desalting equipment (dollars per daily barrel of oil processed) after correcting for inflation. However, the increased utilization of this equipment will increase total refinery capital requirements.
Distillation Distillation is the first step in the refining of de
saltc:d crude oil. Therefore, as the amount of oil refined has increased during the period since World War II, so has the amount of crude oil distilled. Distillation capacity has more than doubled during this period, with the overall trend in equipment toward larger, more highly automated crude distillation units of increased complexity. Whereas the capacity of the average atmospheric distillation unit built in 1945 was about 20,000 barrels per day, several units with capacities in excess of 1 50,000 barrels per day were operating in 1 972. This increased size has resulted in a lower cost per unit capacity. During the same period, both process and mechanical design improvements (new tray designs) have resulted in better separation efficiency and increased operating flexibility.
With high-boiling stocks, significant decomposition by thermal cracking begins at about 800°F and, for this reason, heavy crude oil fractions must be distilled at reduced pressure. The economic incentive for converting more of the residual crude fraction to gasoline, heating oil and jet fuel has promoted increasing use of vacuum distillation. Since 1 945, vacuum distillation has been widely used to augment the yield of catalytic cracking feedstocks. In 1 972, total vacuum distillation capacity corresponded to 35 percent of atmospheric distillation capacity. The trend has been toward larger capacity vacuum distillation towers (units of over 50,000 barrels per day capacity in 1972 compared to units of less than 1 0,000 barrels per day in 1945). Design improvements include better fractionation (more, larger, better designed trays), improved control of recycle streams (better reflux operation), and more effective equipment for minimizing entrainment of
3 8
heavy asphalt and metal contaminants. The control of entrainment in vacuum operations has become increasingly important because of the heavier feedstocks being processed and because of the great importance of minimizing contaminants in heavy distillate catalytic cracking feedstocks. A very small fraction of these undesirable constituents can poison catalysts and reduce gasoline yields in downstream cracking units to a marked degree.
Current atmospheric distillation capacity is about 1 3 million barrels per day. Vacuum distillation capacity is about 4.9 million barrels per day and will likely increase proportionately, although the advent of fuel oriented refineries will probably slow the trend of increasing ratio of vacuum distillation capacity to crude capacity.
Deasphalting Deasphalting refers to a low temperature process
which uses solvents such as propane to remove the heavier boiling components from a vacuum residuum leaving a higher quality gas oil for catalytic cracking or lube processing feedstock. Three major developments in deasphalting since 1945 are in the number of units in service, the types of feedstock being processed and the mechanical design of the processing equipment. The number of plants in service has grown severalfold during this period. Although deasphalting continued to be popular as a process for lube oil manufacture, an increasing number of units were built for treating catalytic cracking feedstocks during the 1945-1 965 period. The process is useful for making cracker feedstocks because it can partially demetalize high-boiling stocks without subjecting them to cracking temperatures. Because the higher boiling fractions of crude oil generally contain high concentrations of metal contaminants, deasphalting makes it possible for the refiner to crack even deeper into a barrel of crude oil. Capital cost per unit of charge for deasphalting has remained about constant since 1 945 . The relative economics of coke and coker products value versus asphalt, deasphalted gas oil and heavy fuel oil value, as well as the type of crude (primarily sulfur content) being processed, will be the major considerations in any future installations of deasphalting units.
Thermal Cracking Prior to World War II, thermal cracking of gas oil
was a major source of gasoline. However, this process started to decline in importance as soon as
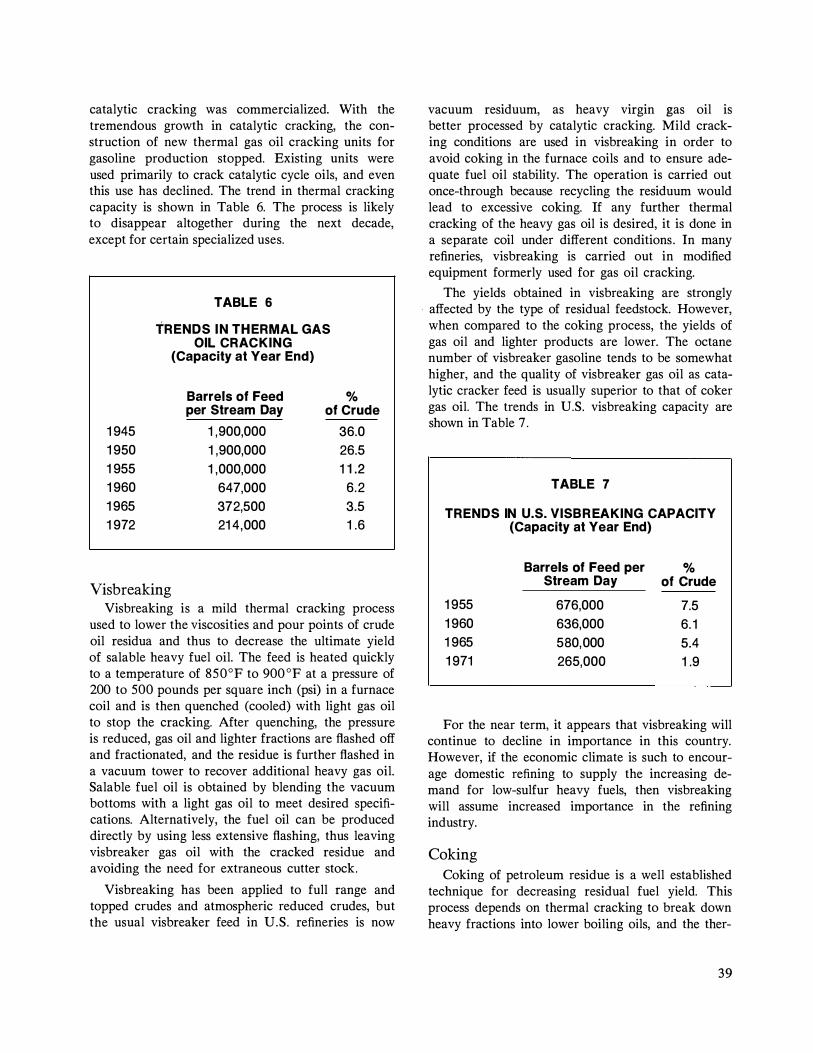
catalytic cracking was commercialized. With the tremendous growth in catalytic cracking, the construction of new thermal gas oil cracking units for gasoline production stopped. Existing units were used primarily to crack catalytic cycle oils, and even this use has declined. The trend in thermal cracking capacity is shown in Table 6. The process is likely to disappear altogether during the next decade, except for certain specialized uses.
TABLE 6
1RENDS I N THERMAL GAS OIL CRACKING
(Capacity at Year End}
Barrels of Feed % per Stream Day of Crude
1 945 1 950 1 955 1 960 1 965 1 972
Vis breaking
1 ,900,000 1 ,900,000 1 ,000,000
647,000 372,500 21 4,000
36.0 26.5 1 1 .2
6.2 3.5 1 .6
Visbreaking is a mild thermal cracking process used to lower the viscosities and pour points of crude oil residua and thus to decrease the ultimate yield of salable heavy fuel oil. The feed is heated quickly to a temperature of 850°F to 900 °F at a pressure of 200 to 500 pounds per square inch (psi) in a furnace coil and is then quenched (cooled) with light gas oil to stop the cracking. After quenching, the pressure is reduced, gas oil and lighter fractions are flashed off and fractionated, and the residue is further flashed in a vacuum tower to recover additional heavy gas oil. Salable fuel oil is obtained by blending the vacuum bottoms with a light gas oil to meet desired specifications. Alternatively, the fuel oil can be produced directly by using less extensive flashing, thus leaving visbreaker gas oil with the cracked residue and avoiding the need for extraneous cutter stock.
Visbreaking has been applied to full range and topped crudes and atmospheric reduced crudes, but the usual visbreaker feed in U.S. refineries is now
vacuum residuum, as heavy virgin gas oil is better processed by catalytic cracking. Mild cracking conditions are used in visbreaking in order to avoid coking in the furnace coils and to ensure adequate fuel oil stability. The operation is carried out once-through because recycling the residuum would lead to excessive coking. If any further thermal cracking of the heavy gas oil is desired, it is done in a separate coil under different conditions. In many refineries, visbreaking is carried out in modified equipment formerly used for gas oil cracking.
The yields obtained in visbreaking are strongly · affected by the type of residual feedstock. However,
when compared to the coking process, the yields of gas oil and lighter products are lower. The octane number of visbreaker gasoline tends to be somewhat higher, and the quality of visbreaker gas oil as catalytic cracker feed is usually superior to that of coker gas oil. The trends in U.S. visbreaking capacity are shown in Table 7.
TABLE 7
TRENDS IN U.S. VISBREAKING CAPACITY (Capacity at Year End}
Barrels of Feed per % Stream Day of Crude
1 955 676,000 7.5 1 960 636,000 6. 1 1 965 580,000 5.4 1 971 265,000 1 .9
For the near term, it appears that visbreaking will continue to decline in importance in this country. However, if the economic climate is such to encourage domestic refining to supply the increasing demand for low-sulfur heavy fuels, then visbreaking will assume increased importance in the refining industry.
Coking
Coking of petroleum residue is a well established technique for decreasing residual fuel yield. This process depends on thermal cracking to break down heavy fractions into lower boiling oils, and the ther-
39

mal decomposition is continued until a solid residue (coke) remains. At first, coking was carried out as a batch process in which reduced crude or other heavy oil was heated and decomposed by direct fire in horizontal vessels equipped with condenser towers. After volatile products had been driven overhead, the hot coke was allowed to cool and was then removed manually by laborers who entered the still. Labor, fuel and repair costs were high in this process and more economical processes were later developed that operate continuously.
Delayed coking, which is still the predominant process, was commercialized in 1930. In this process, the feed is heated rapidly in a furnace to a temperature of 900°F or higher and is then discharged into large insulated vertical drums where it remains while cracking occurs from the contained heat. Temperature and pressure in the drums are in the ranges of 775 °F to 900°F and up to 90 psi (usually about 30 psi) . Vapors of gas oil and lighter fractions leave the coke drum and pass into the fractionating system, while heavy fractions remain behind and gradually decompose into lighter products and coke. The highest boiling distillate portion of the fractionator product is commonly recycled to the reaction section. Continuous operation is achieved by using two or more drums in rotation, the cycle for each being on the order of 1 to 3 days. When a drum is full of coke, it is switched off -stream and replaced by another. The original technique for removing the coke involved winding a cable in the drum before filling and withdrawing it afterward with a winch to break the coke bed into lumps. Coke still adhering to the walls of the drum was then removed manually, and the cable was rewound for the next cycle. After several years, this technique was replaced by hydraulic decoking, wherein high-pressure water jets cut the mass into lumps and fragments that fell out of the bottom of the drum.
The continuous fluid coking process was announced in 1 953, and the first commercial unit was brought on-stream by the end of the following year. In this process the heavy feed is cracked by contacting it with a fluidized bed of coke particles at a temperature in the range of 900°F to 1 ,050°F and at essentially atmospheric pressure. Coke formed by decomposition of the feed is deposited on coke particles already in the bed. Vapors are removed overhead through a cyclone separator that returns suspended coke particles to the bed. Heat required by the process is supplied by circulating a stream of
40
fluidized coke to a burner vessel where a portion is burned with air to maintain the vessel temperature at about 1 , 100°F. A stream of heated particles is then returned to the reactor to maintain the coking temperature. Net coke produced in the process is withdrawn from the system. If desired, it can be transported to storage as a fluid in pipes by the use of a suitable medium (steam, gas, etc.).
The latest development in coking is a process which combines fluid coking with coke gasification to convert about 98 percent of normal crude residuum into liquid and gaseous products. This process has its greatest advantage in the processing of highsulfur, high metal-content crude oils. The liquid products from this process are low in metals and can be more readily hydrotreated to produce high quality fuel oils or feedstocks. Approximately 95 percent of the total sulfur in the coker feed can be recovered as elemental sulfur through conventional sulfur recovery processes. This process is most likely to be used in future processing schemes where high-sulfur crude is the primary feedstock and high cost fuel is an incentive to convert low quality coke to a usable fuel.
Coking yields vary widely with the nature of the feed and are also influenced by the amount of recycling and by other conditions. The maximum yield of catalytic cracker feed is obtained by operating with little or no recycling and at low pressure, but the gas oil thus produced has a higher end point. The combination of vacuum distillation and coking of vacuum residue produces products of higher quality as compared to the direct coking of an atmospheric resid. This procedure results in increased yields of better quality catalytic cracker feed and also minimizes the yield of coker naphtha, which is of poor quality.
·
Coker gas oil is somewhat inferior in quality to virgin gas oil of the same boiling range from the same crude, but is much superior to residuum because metals and large condensed-ring nuclei in the coker feed end up largely in the coke. Coker naphtha tends to be relatively high in unsaturates and sulfur content. The research octane number typically ranges from 60 to 70 for paraffinic feeds to as high as 80 for highly naphthenic feeds.
Approximately 25 percent of all petroleum coke produced is used as fuel. The other major use is in the manufacture of carbon electrodes for the aluminum or other electrometallurgical industries. Certain feedstocks produce coke of higher quality which

TABLE 8
TRENDS I N U.S. COKING CAPACITY (Capacity at Year End)
Barrels of Feed per Stream Day Tons of % Coke per
Batch Delayed Fluid Total of Crude Stream Day
1 950 9,400 1 955 28,200 298,800 1 3,800 340,800 3.8 1 0,900 1 960 1 7,300 365,700 1 02,500 485,500 4.6 1 6,900 1 965 7,000 530,000 1 08,200 645,700 6.0 23,000 1 972 824,800 1 48,200 973,000 7.1 35,000
can be used for steel furnace electrodes and other specialized uses. Coke is also the major raw material for making synthetic graphite and is used in ore sintering operations and in the manufacture of silicon carbide and other chemical industry uses. The export market continues to play an important role in coking capacity expansion. However, export markets for high-sulfur coke may be limited in the future as more stringent sulfur regulations are imposed by consuming countries.
Trends in U.S. coking capacity are shown in Table 8. Coking has probably reached its peak percentage capacity relative to crude runs. In the last 1 7 years, coking capacity had more than doubled due to the lack of demand for residual fuel oil, a condition fostered by the abundant supply of cheap natural gas. Coke production had also increased faster than coker capacity due to the increased use of vacuum distillation for increasing gasoline production and the resulting production of heavier coker feedstocks. These trends are likely to be reversed in the next several years due to the expected increase in demand for heavy fuel oils brought about by shortages of natural gas and restrictions on the use of highsulfur coal.
Coking will continue to be an important process in refining for many years, but new installations will be dependent on the relative product slate and market for that refinery. The new combination process of fluid coking and coke gasification should be especially attractive for refineries designed to process heavy, high-sulfur crude oils, and further develop-
ments can be expected to this and other processes which will produce low-sulfur fuel oil and gas from high-sulfur crudes.
Catalytic Cracking This process continues to be the most important
conversion process within the refining industry in terms of capacity and gasoline production. During the 1945-1972 period, U.S. catalytic cracking capacity has increased steadily to its present level of 4,575 thousand barrels per stream day (MB/SD) based on fresh feed.
In this process, the cracking reactions take place in contact with hot catalyst in order to increase the rate and selectivity of the cracking reaction and to improve the product yield distribution. The combined mixture of catalyst and hot oil vapors are moved from the point of contact to a large reactor vessel through a transfer line (riser) at temperatures of 900°F to 1 ,000°F. In the reactor, continued contact between the catalyst and oil vapors increases the total conversion of heavy feed to lighter products. The catalyst is then separated from the vapors, passed through a stripper to disengage any remaining oil vapors, and then discharged into another large vessel called a regenerator. The oil vapors from the reactor are transferred to a fractionator for separation into various boiling range products. During the time the catalyst is in contact with the oil, a certain amount of coke is deposited on the catalyst as a result of the decomposition of the oil into lighter fractions. In order to reactivate the catalyst so that it may be re-
4 1

used, it is necessary to bum off the coke. Sufficient air is introduced into the regenerator to support combustion at a controlled rate, and the hot ( 1 , 150°F to 1 ,250°F) regenerated catalyst is then withdrawn and contacted with more feed to repeat the cycle. Although the combustion is controlled, it is not complete and a large amount of carbon monoxide is present in the flue gas.
A wide range of products is produced by this process. Yields of fuel gas, C3 and C4 fractions including both saturated and unsaturated components, a full boiling range gasoline fraction, and a distillate or light cycle oil fraction of 600°F to 650°F are produced in varying quantities depending on the severity of the operation. A fraction boiling from approximately 600°F to 750°F may be recycled or withdrawn, depending on various parameters. The heaviest fraction of product, commonly referred to as slurry oil or decant oil, is normally withdrawn to prevent excess coke production, but a small stream containing catalyst fines from a final settling operation is normally returned to the process.
Both the reactor and regenerator contain a bed of fluidized dust-like catalyst which has the flow characteristics of a liquid. The regenerator bed is fluidized by the air used to bum off the coke from the catalyst while the reactor bed is fluidized by the hot oil vapors. In most cases, the catalyst is maintained in a fluidized state throughout the entire system.
Of the many important technological and mechanical advances made in catalytic cracking since the end of World War II, a major one is the development of new zeolitic cracking catalysts. The greater activity and selectively of the new zeolitic catalysts give higher yields of valuable products than the old natural clay or synthetic silica-alumina catalysts. Although the crystalline zeolite cracking catalysts have only been used commercially since 1 962, most of the currently operating fluid catalytic cracking units are using one or more types today, and use of the older catalysts represents only 1 0 to 1 5 percent of total volume. In addition to the improvement in yield structure, the zeolite catalysts have also been responsible for increased unit capacity. Reduction in coke make and gas yield have eliminated critical constraints due to mechanical equipment limitations, thereby allowing charge rates to be increased proportionately. Also, lower recycle rates are desirable with the new catalysts, and fractionation equipment can handle more fresh feed as a result.
42
Prior to development of the zeolite catalyst, a significant advance was the introduction of the high alumina-base (25-percent Al203 catalyst which gave superior attrition resistance. This material has been phased out rather rapidly in order to take advantage of the zeolitic catalyst.
Major improvements have been made in the catalyst flow and handling equipment especially in the fluid catalyst units. Other advances have been made in the direction of designing for maximum heat economy, minimum catalyst attrition, improved process control and less wear of mechanical equipment. A process modification has been two-stage (transfer-line) cracking which utilizes dual reactors operating at different cracking conditions.
The paramount objective in the modem U.S. refinery has been, and continues to be, conversion of the heavy end of the barrel into gasoline and other distillate products to meet changing market requirements. Therefore, the trend in catalytic cracking has been to feed even heavier, less valuable gas oils, and to operate at higher temperatures to achieve increased conversion and improvement of gasoline octanes.
Another design trend has been to recover much of the energy from the regenerator flue gas through flue gas expander turbines and carbon monoxide boilers. Expanders depressure the regenerator gas through a turbine, recovering most of the power required to drive the blower for the regenerator air supply. The boilers have a carbon monoxide combustion furnace for converting the carbon monoxide in the stack gas to carbon dioxide, using the heat generated for producing steam or for preheating oil feed to the reactor. Adding stages along with improved design has resulted in very high efficiency cyclone separators for removing catalyst fines from the regenerator stack gas. These cyclones have been very effective in abating air pollution from catalyst dust, except for areas where the most stringent air pollution regulations have been in effect.
The mechanical reliability of catalytic cracking units has been greatly improved since 1945-units now operate from 2 to 3 years between major maintenance shutdowns. The service factor for present units is about 96 percent (only 1 month out of 24 is the unit down for maintenance). Mechanical design improvements made during the past two decades have made possible the building of much larger cracking units. Although the average unit built at the end of World War II had a throughput capacity
of about 1 5 MB/SD, catalytic crackers are presently being constructed with capacities of from 80 to 100 MB/SD. These large units, in addition to having lower operating costs and higher efficiency, have been a major factor in reducing capital cost per barrel of capacity. Catalytic cracking capacity will increase in proportion to crude capacity in refineries where the product objective is light fuels and gasoline.
In refineries where a major product objective is heavy fuels, catalytic cracking, like other heavy oil conversion processes, will decline in importance.
The development of the third and fourth generation of very active zeolite type catalysts has renewed interest in converting old units to and designing new units for transfer line or riser crackin.f only. The high olefin and gasoline yields and reduction of coke and dry gas make this type of operation much more attractive than the combination riser I dense bed cracking. There is also a trend to higher reactor temperatures of 975 °F to 1 ,000°F, which results in a higher clear octane number for the catalytic cracked gasoline which is a big advantage for refineries facing the phaseout of TEL.
The fluid catalytic cracking process has some unique atmospheric pollution problems, i.e., catalyst and carbon monoxide discharges from the regenerator. Refiners on the West Coast have long been under severe regulatory pressure to minimize the catalyst and CO emissions. This was accomplished usually by burning the CO in an external boiler or combustion chamber and installing tertiary catalyst collection systems, electrical and/ or cyclone type, external to the regenerator. With the passage of the National Environmental Policy Act thus ensuring at least uniform minimum nationwide effluent standards, it can be expected that all refineries probably will have to comply at some future date with regulations similar to the current West Coast standards.
One new trend that is being considered as a possible solution to the CO emission problem is the concept of total burning of the coke in the regenerator, thus eliminating the need for external CO combustion equipment. This requires operating the regenerator at 1 ,400°F and with about 2- to 3-volume-percent oxygen concentration in the exit gas. Changes in regenerator metallurgy are required as well as additions to heat recovery equipment. In many cases, such changes may prove to be a more economical solution than external CO furnaces.
The overall higher oxygen (02) usage to achieve
complete combustion will result in a reduction in coke burning potential of a regenerator which operates at maximum air rate as limited by blower capacity or regenerator gas velocity. This reduction will amount to some 25 to 30 percent, depending on factors such as the C02/CO ratio and hydrogen in coke. Consequently, unless catalyst selectivity is improved to a similar extent, unit capacity or conversion will fall. One method of achieving a balance is to include riser cracking modifications which will tend to reduce coke lay-down and result in lower air requirements.
Sulfur dioxide emissions from catalytic cracking flue gases can be reduced by hydrodesulfurization of the cracking unit feed. Catalytic cracking feed hydro·· treating has been practiced to improve the yield of high demand products rather than to control sulfur emissions. However, this secondary result will make hydrotreating more important in the future for reducing emissions.
Hydrocracking Hydrocracking represents one of the oldest cata
lytic processes for hydrocarbon conversion. While it was originally employed in Germany in 1927 to convert lignite into gasoline and later to convert petroleum residues into distillate fractions, the first commercial hydrocracking installation in this country was operated in the late 1930's for the production of aviation gasoline.
Early applications of hydrocracking used extremely high pressures and were very costly to operate. Years of independent research by the petroleum industry were required to bring hydrocracking technology to its present level.
The hydrocracking process consists basically of mixing hydrogen with hydrocarbon feed at elevated pressures, heating the mixture and contacting ' with catalyst in a fixed bed or ebullient bed system consisting of one or more reactors in series or parallel. Provision is made for recycling hydrogen-rich gas and unconverted hydrocarbon. Most hydrocrackers operate within the range of 500°F to 800°F and 500 to 3 ,000 psi. This process scheme has many similarities to the catalytic reforming of naphtha; however, considerably higher pressures are employed.
There are a variety of catalysts which can be employed in the hydrocracking process, such as sulfided nickel supported on a silica-alumina cracking catalyst and noble metals on silica-alumina. Considerable work has been done to improve general
43

catalyst performance and develop catalyst combinations · for specific process applications. Hydrocracking catalyst development has reached the point where many units are designed and operated on 2-year regeneration cycles, affording as high as 98-percent on-stream efficiency.
Hydrogen must be furnished to the hydrocracking unit from an external source, often the off -gas from catalytic reforming operations. Normally, the hydrogen requirements for hydrocracking vary from 1 ,000 cubic feet ( 1 MCF) per barrel for light feeds to 3 MCF per barrel for heavy feeds. Should other hydrogen-consuming processes expend the reformer hydrogen in a given refinery, hydrogen must be purchased or manufactured by a separate facility to meet the hydrocracking requirements. This process is covered in a subsequent section of this report.
Hydrocracking is a most versatile of refinery processes, being able to process a wide variety of feeds into a large number of lower molecular weight products. Table 9 lists a number of applications for hydrocracking which are presently used by refiners. It is noted that the majority of applications call for maximum gasoline production. The original units processed feeds with an end point of about 700°F. Hydrocracking technology has now been developed to the point where feeds with end points of 1 , 100°F
or higher can be processed successfully. Within these boiling ranges, all kinds of straight-run and cracked distillates are being successfully hydrocracked.
In the early 1 960's, several small hydrocracking units of 3 to 8 MB/SD capacity were installed. Successful operation of these units aroused the interest of the refining industry such that, by 1966, five U.S. licensors were offering hydrocracking processes, and 1 5 units with a combined capacity of over 200 MB/SD had been installed.
Between 1 966 and 197 1 , hydrocracking capacity increased at the rate of 27 percent per year, but the increase was only 14 percent in 1971 and is projected to be only 4 percent in 1972. Completion of construction on a single new 35 MB/SD plant in 1 972 will be the only increase to currently installed capacity of 839 MB/SD.
The heavy emphasis on hydrocracking capacity in recent years was to maintain a balance between the production of gasoline and middle distillate fuels. Gasoline demand was increasing at a more rapid rate than middle distillate, and the hydrocracking process proved a valuable method of converting distillates to gasoline. In addition, some refinery expansion projects utilized hydrocracking as a supplement to fluid catalytic cracking by including var-
TABLE 9
APPLICATIONS OF HYDROCRACKING
Charge Stock
Naphtha Kerosine Straight-Run Diesel Atmospheric Gas Oi l Natural Gas Condensates Vacuum Gas Oi l
44
Propane Deasphalted Gas Oil Catalytical ly Cracked Heavy Cycle Oi l Catalytically Cracked Light Cycle Oi l Coker Disti l late Coker Heavy Gas Oi l Residuum
Products
Propane and Butane (LPG) Gasol ine Gasol ine and/or Jet Fuel Gasol ine, Jet Fuel and/or Distil lates Gasol ine Gasol ine, Jet Fuel and/or Disti l lates Gasoline, Jet Fuel and/ or Disti l lates Gasol ine and/or Dist i l lates Gasoline Gasol ine Gasol ine and/or Disti l lates Gasoli ne, Jet Fuel and/or Disti l lates
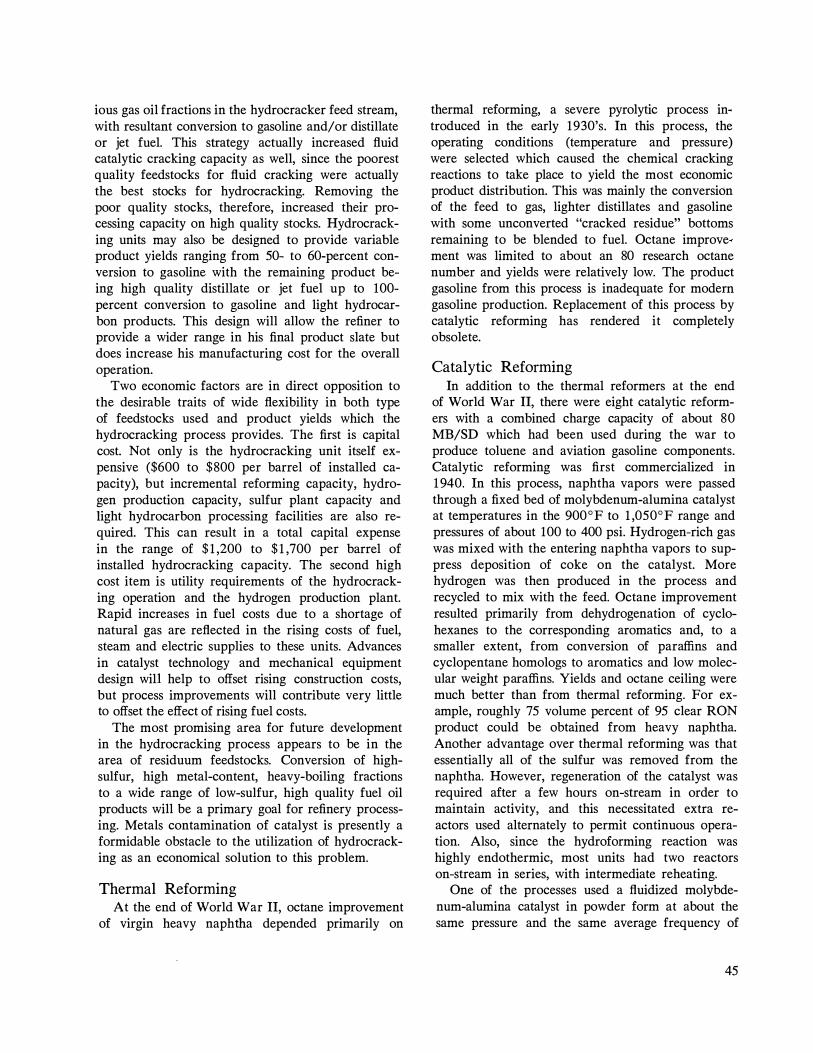
ious gas oil fractions in the hydrocracker feed stream, with resultant conversion to gasoline and/ or distillate or jet fuel. This strategy actually increased fluid catalytic cracking capacity as well, since the poorest quality feedstocks for fluid cracking were actually the best stocks for hydrocracking. Removing the poor quality stocks, therefore, increased their processing capacity on high quality stocks. Hydrocracking units may also be designed to provide variable product yields ranging from 50- to 60-percent conversion to gasoline with the remaining product being high quality distillate or jet fuel up to 100-percent conversion to gasoline and light hydrocarbon products. This design will allow the refiner to provide a wider range in his final product slate but does increase his manufacturing cost for the overall operation.
Two economic factors are in direct opposition to the desirable traits of wide flexibility in both type of feedstocks used and product yields which the hydrocracking process provides. The first is capital cost. Not only is the hydrocracking unit itself expensive ($600 to $800 per barrel of installed capacity), but incremental reforming capacity, hydrogen production capacity, sulfur plant capacity and light hydrocarbon processing facilities are also required. This can result in a total capital expense in the range of $ 1 ,200 to $ 1 ,700 per barrel of installed hydrocracking capacity. The second high cost item is utility requirements of the hydrocracking operation and the hydrogen production plant. Rapid increases in fuel costs due to a shortage of natural gas are reflected in the rising costs of fuel, steam and electric supplies to these units. Advances in catalyst technology and mechanical equipment design will help to offset rising construction costs, but process improvements will contribute very little to offset the effect of rising fuel costs.
The most promising area for future development in the hydrocracking process appears to be in the area of residuum feedstocks. Conversion of highsulfur, high metal-content, heavy-boiling fractions to a wide range of low-sulfur, high quality fuel oil products will be a primary goal for refinery processing. Metals contamination of catalyst is presently a formidable obstacle to the utilization of hydrocracking as an economical solution to this problem.
Thermal Reforming At the end of World War II, octane improvement
of virgin heavy naphtha depended primarily on
thermal reforming, a severe pyrolytic process introduced in the early 1930's. In this process, the operating conditions (temperature and pressure) were selected which caused the chemical cracking reactions to take place to yield the most economic product distribution. This was mainly the conversion of the feed to gas, lighter distillates and gasoline with some unconverted "cracked residue" bottoms remaining to be blended to fuel. Octane improve� ment was limited to about an 80 research octane number and yields were relatively low. The product gasoline from this process is inadequate for modem gasoline production. Replacement of this process by catalytic reforming has rendered it completely obsolete.
Catalytic Reforming In addition to the thermal reformers at the end
of World War II, there were eight catalytic reformers with a combined charge capacity of about 80 MB/SD which had been used during the war to produce toluene and aviation gasoline components. Catalytic reforming was first commercialized in 1 940. In this process, naphtha vapors were passed through a fixed bed of molybdenum-alumina catalyst at temperatures in the 900°F to 1 ,050°F range and pressures of about 100 to 400 psi. Hydrogen-rich gas was mixed with the entering naphtha vapors to suppress deposition of coke on the catalyst. More hydrogen was then produced in the process and recycled to mix with the feed. Octane improvement resulted primarily from dehydrogenation of cyclohexanes to the corresponding aromatics and, to a smaller extent, from conversion of paraffins and cyclopentane homologs to aromatics and low molecular weight paraffins. Yields and octane ceiling were much better than from thermal reforming. For example, roughly 75 volume percent of 95 clear RON product could be obtained from heavy naphtha. Another advantage over thermal reforming was that essentially all of the sulfur was removed from the naphtha. However, regeneration of the catalyst was required after a few hours on-stream in order to maintain activity, and this necessitated extra reactors used alternately to permit continuous operation. Also, since the hydroforming reaction was highly endothermic, most units had two reactors on-stream in series, with intermediate reheating.
One of the processes used a fluidized molybdenum-alumina catalyst in powder form at about the same pressure and the same average frequency of
45

regeneration as in the fixed bed process. However, the fluid process was cheaper to build (particularly in the larger sizes) and simpler to operate, but gave slightly poorer yields than the fixed bed process. The superior performance was due to continuous operation, uniform temperature in the reactor, and elimination of the thermal cracking that is unavoidable in the preheater and inlet end of the reactor in fixed bed units.
Other developments involved moving bed processes in which a chromium-alumina or cobalt molybdenum-alumina catalyst was continuously circulated through separate reaction and regeneration zones. Naphtha and hydrogen-rich recycle gas were processed at 100 to 400 psi pressure, and the circulating catalyst was regenerated continuously at an average frequency of about once every 6 to 20 hours.
In 1 949, a significant improvement was made by the introduction of platinum-on-alumina catalyst in fixed bed reactor units. Less carbon is produced with platinum than with the non-noble metal systems used previously, and units could run for many months without the need for catalyst regeneration. Whereas with the molybdenum and chromium catalysts octane improvement was dependent wholly on aromatic production by dehydrogenation of naphthenes, the dual function nature of the acid-metal platinum catalyst was able to increase aromatic formation by the cyclization of paraffins. This gave an increase in yield for a given octane number.
In a multi-reactor system using platinum catalyst, basic reactions take place. In the first reactor, the
dehydrogenation of naphthenes to aromatics is paramount. In the second reactor, isomerization of fivecarbon ring naphthenes to a six-membered ring structure with subsequent dehydrogenation to aromatics occurs. In the third and any succeeding reactors, the most important reactions are the dehydrocyclization of paraffins to aromatics and the hydrocracking of paraffins to low molecular weight saturates. High temperatures and low pressure favor the dehydrogenation and cyclization reactions leading to the formation of aromatics and high yield. The yield-reducing hydrocracking of paraffins is favored by high pressure. The drive to improve yields by lowering pressure led to the development of cyclic regenerative processes since the lower pressure operation also leads to increased coke formation. In these lower pressure units, a swing reactor and regeneration system is provided allowing frequent reactor regenerations without shutting down. The coke formed at the low pressure conditions is removed by burning under controlled conditions, and the catalyst in all reactors is thus maintained at high activity.
The next major advance in catalytic reforming technology came in 1969 with the introduction of bimetallic catalyst. The advantage of the bimetallic over platinum-only catalyst lies in its tolerance for coke deposit. Whereas previous catalysts experienced a large drop in activity with a very low coke level, the bimetallics can maintain activity with much higher carbon contents. With the improved activity maintenance, there is also an improvement in selectivity which allows existing units to run at
TABLE 1 0
USE O F CURRENT CATALYST TYPES I N CATALYTIC REFORMERS
Capacity (B/SD as of January 1 , 1 972) Percent of Total Capacity
Type Reformer Conventional Bimetallic Conventional Bimetallic
Semi-Regeneraitve 1 ,420,995 874,787 44.8 27.6
Cycl ic 743,373 23.4
Other 80,844 49,1 26 2.6 1 .6
46

TABLE 1 1
TRENDS I N DOMESTIC NAPHTHA REFORMING CAPACITY (Capacity at Year End in MB/ SD-Percent on Crude)
Catalytic Reforming
Thermal Nonplatinum Reforming Catalysts
Year End % on Year End % on Capacity Crude Capacity Crude
1 945 370 7.0 80 1 .5 1 950 500 7.0 85 1 .2 1 955 370 4.1 1 43 1 .6 1 960 1 75 1 .7 38 0.4 1 965 40 <0.4 23 0.2 1 971
lower pressure or higher severity without reduction in the cycle length between regenerations. The use of bimetallic catalysts is shown in Table 10.
Current catalytic reformers are classed by the type of regeneration system used. Semi-regenerative units have three or more fixed bed reactors and usually operate for 6 to 1 2 months after which they are shut down for catalyst regeneration, usually in situ.
Cyclic regenerative processes have an extra reactor and a separate regeneration system allowing frequent catalyst regenerations without the need for shutdown. More recently, continuous catalyst regeneration units have been introduced. In these, the catalyst is continuously withdrawn, regenerated and returned to the reactor system. Where severities of 100 RON clear or above are required, the cyclic or continuous regenerative processes have the advantage, but at lower severities, and especially for units in the 10 MB/SD capacity range, semi-regenerative units using bimetallic catalyst are still competitive.
Hydrogen has always been a useful byproduct of catalytic reforming, but its importance is heightened by the rapid growth in hydrotreating capacity primarily to meet the need for low-sulfur fuel. Fortunately, the trend toward higher severity operation combined with the use of improved catalyst will make more hydrogen available and at least partially meet the demand.
Platinum Catalysts Total
Year End % on Year End % on Capacity Crude Capacity Crude
80 1 .5 1 < 0.1 86 1 .2
778 8.7 921 1 0.3 1 ,91 7 1 8.2 1 ,955 1 8.6 2,060 1 9.2 2,083 1 9.4 3,1 69 23.1 3,1 69 23.1
The growth in catalytic reforming capacity since 1945 is illustrated in Table 1 1 . With the prospect of lower lead levels, reforming capacity should grow at least as fast as crude capacity with perhaps an upsurge occurring if there is a need to reform naphtha from catalytic cracking.
Catalyst improvements have dominated the history of reforming and are expected to have an equal impact in the future. Higher activity catalysts with improved selectivity can be expected principally stemming from the development of new promotors for bimetallic and multi-metallic catalysts.
Polymerization Catalytic polymerization reached a peak capacity
around 1 960, but its use has decreased steadily and rapidly since that time (see Table 1 2) . The process represented one means of converting unsaturated C3 and C4 hydrocarbons into a liquid of good research octane quality in the gasoline boiling range.
The poor motor octane of the polymer product and the improved quality and yields achieved from alkylation of the C3-C4 fraction have combined to render catalytic polymerization an obsolete process. No new plants are likely to be built, and those still in operation will be phased out as alkylation capacity is increased.
47
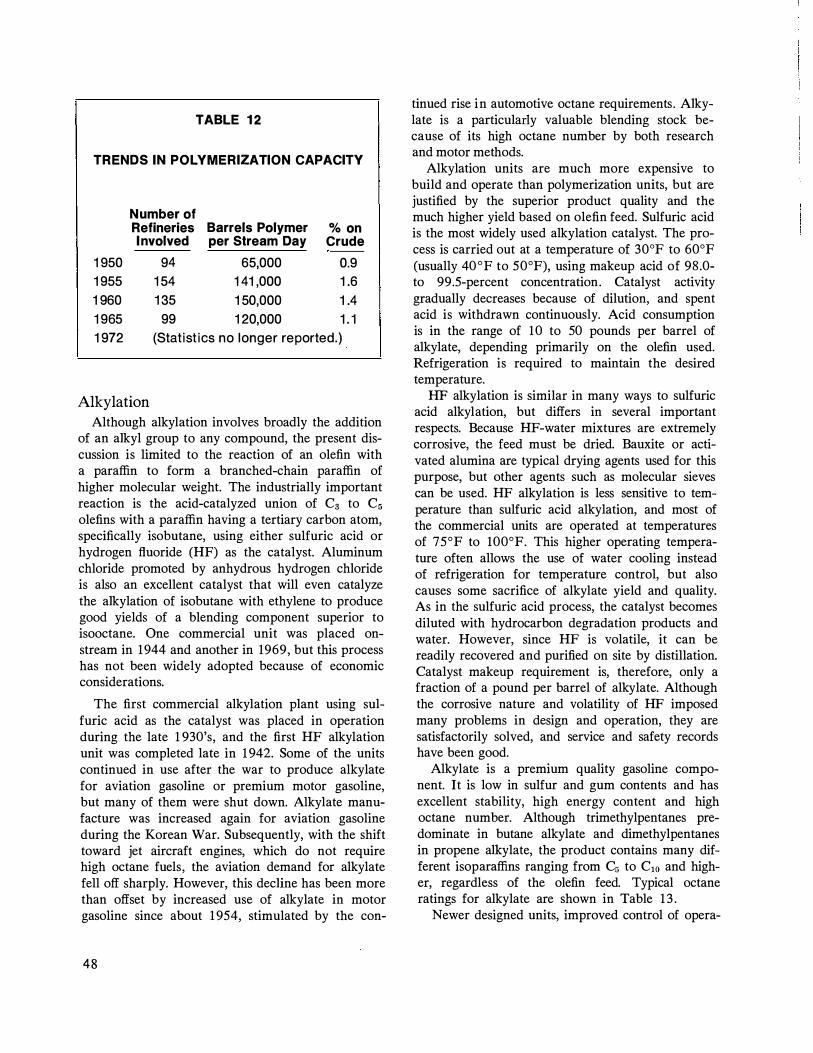
TABLE 1 2
TRENDS IN POLYMERIZATION CAPACITY
Number of Refineries Barrels Polymer o/o on I nvolved per Stream Day Crude
1 950 94 65,000 0.9 1 955 1 54 1 41 ,000 1 .6 1 960 1 35 1 50,000 1 .4 1 965 99 1 20,000 1 . 1 1 972 (Statist ics no longer reported.)
Alkylation
Although alkylation involves broadly the addition of an alkyl group to any compound, the present discussion is limited to the reaction of an olefin with a paraffin to form a branched-chain paraffin of higher molecular weight. The industrially important reaction is the acid-catalyzed union of C3 to C5 olefins with a paraffin having a tertiary carbon atom, specifically isobutane, using either sulfuric acid or hydrogen fluoride (HF) as the catalyst. Aluminum chloride promoted by anhydrous hydrogen chloride is also an excellent catalyst that will even catalyze the alkylation of isobutane with ethylene to produce good yields of a blending component superior to isooctane. One commercial unit was placed onstream in 1944 and another in 1969, but this process has not been widely adopted because of economic considerations.
The first commercial alkylation plant using sulfuric acid as the catalyst was placed in operation during the late 1 930's, and the first HF alkylation unit was completed late in 1 942. Some of the units continued in use after the war to produce alkylate for aviation gasoline or premium motor gasoline, but many of them were shut down. Alkylate manufacture was increased again for aviation gasoline during the Korean War. Subsequently, with the shift toward jet aircraft engines, which do not require high octane fuels, the aviation demand for alkylate fell off sharply. However, this decline has been more than offset by increased use of alkylate in motor gasoline since about 1 954, stimulated by the con-
48
tinued rise in automotive octane requirements. Alkylate is a particularly valuable blending stock because of its high octane number by both research and motor methods.
Alkylation units are much more expensive to build and operate than polymerization units, but are justified by the superior product quality and the much higher yield based on olefin feed. Sulfuric acid is the most widely used alkylation catalyst. The process is carried out at a temperature of 30°F to 60°F (usually 40 °F to 50°F), using makeup acid of 98 .0-to 99.5-percent concentration. Catalyst activity gradually decreases because of dilution, and spent acid is withdrawn continuously. Acid consumption is in the range of 10 to 50 pounds per barrel of alkylate, depending primarily on the olefin used. Refrigeration is required to maintain the desired temperature.
HF alkylation is similar in many ways to sulfuric acid alkylation, but differs in several important respects. Because HF-water mixtures are extremely corrosive, the feed must be dried. Bauxite or activated alumina are typical drying agents used for this purpose, but other agents such as molecular sieves can be used. HF alkylation is less sensitive to temperature than sulfuric acid alkylation, and most of the commercial units are operated at temperatures of 75°F to 100°F. This higher operating temperature often allows the use of water cooling instead of refrigeration for temperature control, but also causes some sacrifice of alkylate yield and quality. As in the sulfuric acid process, the catalyst becomes diluted with hydrocarbon degradation products and water. However, since HF is volatile, it can be readily recovered and purified on site by distillation. Catalyst makeup requirement is, therefore, only a fraction of a pound per barrel of alkylate. Although the corrosive nature and volatility of HF imposed many problems in design and operation, they are satisfactorily solved, and service and safety records have been good.
Alkylate is a premium quality gasoline component. It is low in sulfur and gum contents and has excellent stability, high energy content and high octane number. Although trimethylpentanes predominate in butane alkylate and dimethylpentanes in propene alkylate, the product contains many different isoparaffins ranging from C5 to C10 and higher, regardless of the olefin feed. Typical octane ratings for alkylate are shown in Table 1 3 .
Newer designed units, improved control of opera-

TABLE 1 3
TYPICAL OCTANE RATINGS FOR DIFFERENT TYPES OF ALKYLATES
Octane Ratings
Resarch, Clear
+3 ml TEL/ Gallon
Motor, Clear
+3 ml TEL/ Gal lon
Olefin Used
Propene Butenes Pentenes
89- 91 92- 96 88- 90
1 00-1 04 1 03-1 09 1 00-1 02
87- 90 92- 95 87- 89
99-1 01 1 00-1 04 98-1 00
tions, and various additives have made it possible to reduce acid consumption significantly in the sulfuric acid units. Improvements have also been realized in both processes in alkylate yield and quality. Trends in U.S. alkylation capacity during the last 20 years are shown in Table 1 4. The figures for the early years are probably less reliable than those in the remainder of Table 1 4 because locations and capacities of alkylation units were not publicized prior to about 1 954.
Alkylation capacity will continue to be installed in light fuels refineries where catalytic cracking is the major heavy oil conversion process. The combined capacity for both sulfuric acid (H2S04) and HF units is presently 822 MB/SD. In the last several years, there seems to be a swing to the HF process over the sulfuric process, as shown in the following tabulation:
Added Capacity
HF (B/SD) H2S04 (B/SD)
197 1 17,000 9,000 1972 3 1 ,000 16,000
Three factors probably account for this: (1) lower investment and operating costs, (2) more flexibility in olefins processed, and (3) lower acid consumption. The octane level of the HF alkylation product, however, is somewhat lower.
One ethylene alkylation plant was recently installed in conjunction with a major ethylene capacity expansion. More interest in this process might occur due to the phaseout of TEL. Ethylene alkylate has some favorable and unique blending properties in lead free gasolines.
Continued emphasis will be placed on propylene and butylene alkylation due to favorable economic incentives in both leaded and unleaded gasolines. The need for high octane components in tomorrow's unleaded gasolines will undoubtedly widen the applications of this process to include more ethylene
TABLE 1 4
1 945 1 950 1 955 1 960 1 965 1 971
TRENDS IN U.S. ALKYLATION CAPACITY* (Capacity at Year End, Barrel of Alkylate per Stream Day)
Sulfuric Acid HF P rocess Process Total
1 05,000 (31 } 64,000 ( 9} 1 69,000 1 05,000 (29} 23,000 ( 9) 1 28,000 1 95,000 (45) 59,000 (1 7) 254,000 322,000 (65} 1 02,000 (38) 424,000 41 0,000 (67) 1 40,000 (54) 550,000 555,000 267,000 822,000
* Number of refineries involved are shown in parentheses.
Total Capacity % on Crude
3.2 1 .8 2.8 4.0 5.1 6.0
49
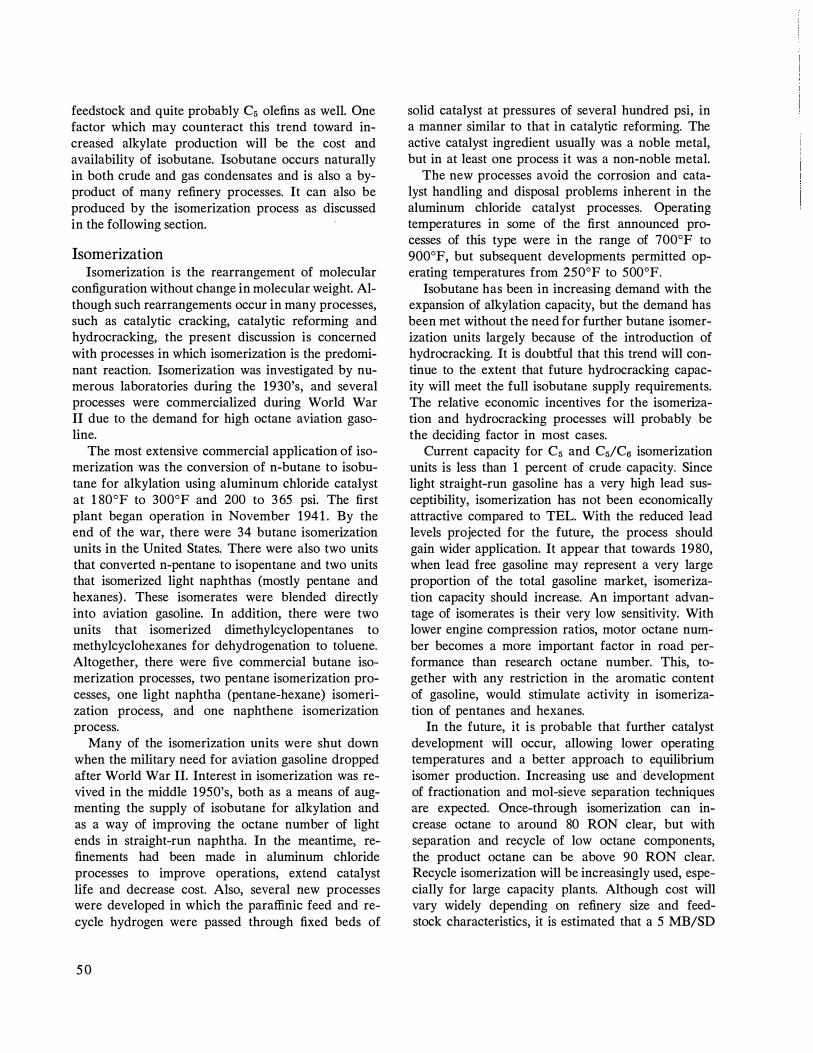
feedstock and quite probably C5 olefins as well. One factor which may counteract this trend toward increased alkylate production will be the cost and availability of isobutane. Isobutane occurs naturally in both crude and gas condensates and is also a byproduct of many refinery processes. It can also be produced by the isomerization process as discussed in the following section.
Isomerization Isomerization is the rearrangement of molecular
configuration without change in molecular weight. Although such rearrangements occur in many processes, such as catalytic cracking, catalytic reforming and hydrocracking, the present discussion is concerned with processes in which isomerization is the predominant reaction. Isomerization was investigated by numerous laboratories during the 1930's, and several processes were commercialized during World War II due to the demand for high octane aviation gasoline.
The most extensive commercial application of isomerization was the conversion of n-butane to isobutane for alkylation using aluminum chloride catalyst at 1 80°F to 300°F and 200 to 3 65 psi. The first plant began operation in November 194 1 . By the end of the war, there were 34 butane isomerization units in the United States. There were also two units that converted n-pentane to isopentane and two units that isomerized light naphthas (mostly pentane and hexanes) . These isomerates were blended directly into aviation gasoline. In addition, there were two units that isomerized dimethylcyclopentanes to methylcyclohexanes for dehydrogenation to toluene. Altogether, there were five commercial butane isomerization processes, two pentane isomerization processes, one light naphtha (pentane-hexane) isomerization process, and one naphthene isomerization process.
Many of the isomerization units were shut down when the military need for aviation gasoline dropped after World War II. Interest in isomerization was revived in the middle 1950's, both as a means of augmenting the supply of isobutane for alkylation and as a way of improving the octane number of light ends in straight-run naphtha. In the meantime, refinements had been made in aluminum chloride processes to improve operations, extend catalyst life and decrease cost. Also, several new processes were developed in which the paraffinic feed and recycle hydrogen were passed through fixed beds of
5 0
solid catalyst at pressures of several hundred psi, in a manner similar to that in catalytic reforming. The active catalyst ingredient usually was a noble metal, but in at least one process it was a non-noble metal.
The new processes avoid the corrosion and catalyst handling and disposal problems inherent in the aluminum chloride catalyst processes. Operating temperatures in some of the first announced processes of this type were in the range of 700°F to 900°F, but subsequent developments permitted operating temperatures from 250°F to 500°F.
Isobutane has been in increasing demand with the expansion of alkylation capacity, but the demand has been met without the need for further butane isomerization units largely because of the introduction of hydrocracking. It is doubtful that this trend will continue to the extent that future hydrocracking capacity will meet the full isobutane supply requirements. The relative economic incentives for the isomerization and hydrocracking processes will probably be the deciding factor in most cases.
Current capacity for C5 and C5/C6 isomerization units is less than 1 percent of crude capacity. Since light straight-run gasoline has a very high lead susceptibility, isomerization has not been economically attractive compared to TEL. With the reduced lead levels projected for the future, the process should gain wider application. It appear that towards 1980, when lead free gasoline may represent a very large proportion of the total gasoline market, isomerization capacity should increase. An important advantage of isomerates is their very low sensitivity. With lower engine compression ratios, motor octane number becomes a more important factor in road performance than research octane number. This, together with any restriction in the aromatic content of gasoline, would stimulate activity in isomerization of pentanes and hexanes.
In the future, it is probable that further catalyst development will occur, allowing lower operating temperatures and a better approach to equilibrium isomer production. Increasing use and development of fractionation and mol-sieve separation techniques are expected. Once-through isomerization can increase octane to around 80 RON clear, but with separation and recycle of low octane components, the product octane can be above 90 RON clear. Recycle isomerization will be increasingly used, especially for large capacity plants. Although cost will vary widely depending on refinery size and feedstock characteristics, it is estimated that a 5 MB/SD
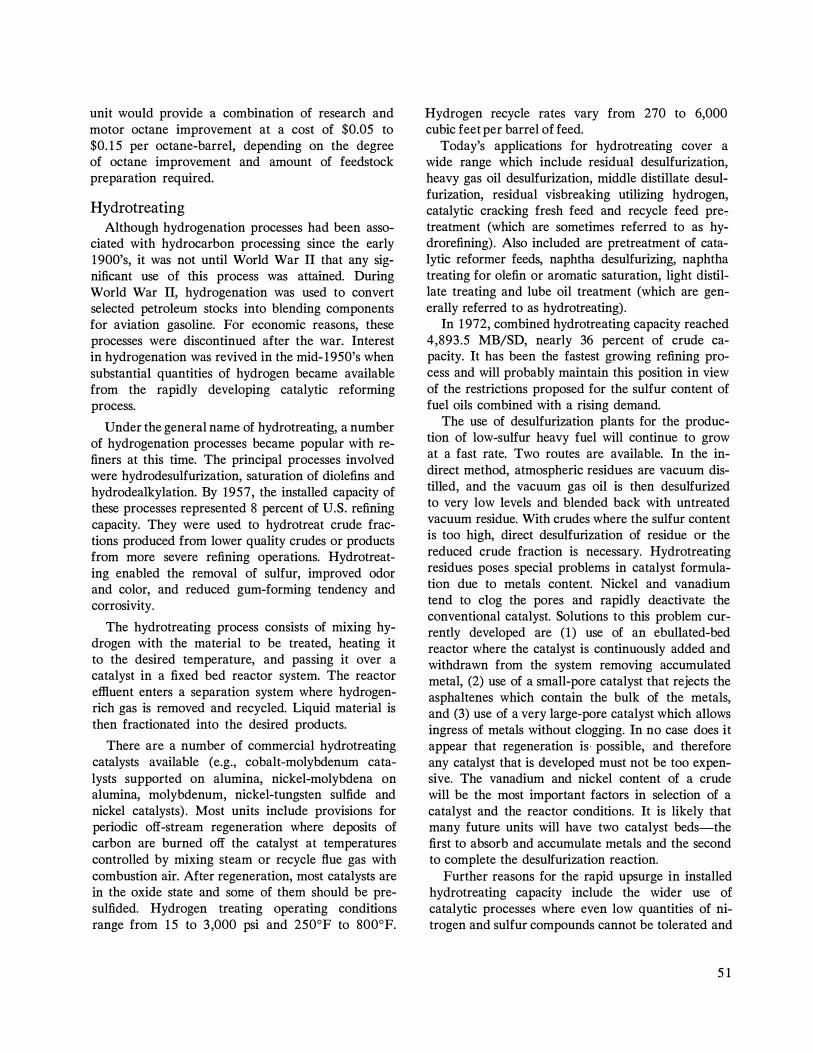
unit would provide a combination of research and motor octane improvement at a cost of $0.05 to $0. 1 5 per octane-barrel, depending on the degree of octane improvement and amount of feedstock preparation required.
Hydro treating
Although hydrogenation processes had been associated with hydrocarbon processing since the early 1900's, it was not until World War II that any significant use of this process was attained. During World War II, hydrogenation was used to convert selected petroleum stocks into blending components for aviation gasoline. For economic reasons, these processes were discontinued after the war. Interest in hydrogenation was revived in the mid-1950's when substantial quantities of hydrogen became available from the rapidly developing catalytic reforming process.
Under the general name of hydrotreating, a number of hydrogenation processes became popular with refiners at this time. The principal processes involved were hydrodesulfurization, saturation of diolefins and hydrodealkylation. By 1957, the installed capacity of these processes represented 8 percent of U.S. refining capacity. They were used to hydrotreat crude fractions produced from lower quality crudes or products from more severe refining operations. Hydrotreating enabled the removal of sulfur, improved odor and color, and reduced gum-forming tendency and corrosivity.
The hydrotreating process consists of mixing hydrogen with the material to be treated, heating it to the desired temperature, and passing it over a catalyst in a fixed bed reactor system. The reactor eflluent enters a separation system where hydrogenrich gas is removed and recycled. Liquid material is then fractionated into the desired products.
There are a number of commercial hydrotreating catalysts available (e.g., cobalt-molybdenum catalysts supported on alumina, nickel-molybdena on alumina, molybdenum, nickel-tungsten sulfide and nickel catalysts) . Most units include provisions for periodic off-stream regeneration where deposits of carbon are burned off the catalyst at temperatures controlled by mixing steam or recycle flue gas with combustion air. After regeneration, most catalysts are in the oxide state and some of them should be presulfided. Hydrogen treating operating conditions range from 1 5 to 3 ,000 psi and 250°F to 800°F.
Hydrogen recycle rates vary from 270 to 6,000 cubic feet per barrel of feed.
Today's applications for hydrotreating cover a wide range which include residual desulfurization, heavy gas oil desulfurization, middle distillate desulfurization, residual visbreaking utilizing hydrogen, catalytic cracking fresh feed and recycle feed pre-:treatment (which are sometimes referred to as hydrorefining). Also included are pretreatment of catalytic reformer feeds, naphtha desulfurizing, naphtha treating for olefin or aromatic saturation, light distillate treating and lube oil treatment (which are generally referred to as hydrotreating).
In 1 972, combined hydrotreating capacity reached 4,893.5 MB/SD, nearly 36 percent of crude capacity. It has been the fastest growing refining process and will probably maintain this position in view of the restrictions proposed for the sulfur content of fuel oils combined with a rising demand.
The use of desulfurization plants for the production of low-sulfur heavy fuel will continue to grow at a fast rate. Two routes are available. In the indirect method, atmospheric residues are vacuum distilled, and the vacuum gas oil is then desulfurized to very low levels and blended back with untreated vacuum residue. With crudes where the sulfur content is too high, direct desulfurization of residue or the reduced crude fraction is necessary. Hydrotreating residues poses special problems in catalyst formulation due to metals content. Nickel and vanadium tend to clog the pores and rapidly deactivate the conventional catalyst. Solutions to this problem currently developed are (1) use of an ebullated-bed reactor where the catalyst is continuously added and withdrawn from the system removing accumulated metal, (2) use of a small-pore catalyst that rejects the asphaltenes which contain the bulk of the metals, and (3) use of a very large-pore catalyst which allows ingress of metals without clogging. In no case does it appear that regeneration is possible, and therefore any catalyst that is developed must not be too expensive. The vanadium and nickel content of a crude will be the most important factors in selection of a catalyst and the reactor conditions. It is likely that many future units will have two catalyst beds-the first to absorb and accumulate metals and the second to complete the desulfurization reaction.
Further reasons for the rapid upsurge in installed hydrotreating capacity include the wider use of catalytic processes where even low quantities of nitrogen and sulfur compounds cannot be tolerated and
5 1

the demand for higher quality refined products. Hydrotreating technology has reached an advanced stage, and catalyst development is continually improving to allow treatment of an increasing variety of both internal and finished refinery streams. Refiners are finding that extensive hydrotreating of internal streams can be economically justified to improve performance of their cracking or reforming units.
Hydrogen Production Late in the 1 950's, hydrogen was a surplus by
product from catalytic reforming. There was some consumption industrially by hydrotreating, but, in 1 9 6 1 , 50 percent of the hydrogen produced from reforming was burned as fuel. Today, as more and more processes consume hydrogen, less than 25 percent is burned. Due to numerous installations of hydrocracking, hydrodealkylation (such as toluene to benzene), ammonia manufacture and other petrochemical uses, hydrogen production has become a common refinery process.
The major sources of hydrogen are catalytic reforming, steam reforming and partial oxidation. The petroleum refiner normally utilizes all possible hydrogen from catalytic reforming before installing any process to manufacture hydrogen as a primary product.
Steam reforming is the mainstay of industry for producing hydrogen. It uses hydrocarbons from natural gas to naphtha as feed raw materials. The hydrocarbon is mixed with steam in excess of the chemical quantity required. It is then reformed over a nickel catalyst packed inside tubes in a furnace. The reformer effluent is a mixture of hydrogen, carbon oxides and excess steam. Plant sizes vary from 0. 1 to over 1 00.0 million cubic feet (MMCF) per day. Pressures vary from 50 to 400 psi and can be extended to 500 psi. Final product purity ranges from 90- to 98-percent hydrogen with methane being the major impurity.
Partial oxidation handles any hydrocarbon feedeven coke. It has considerable more flexibility than steam reforming. The feed is burned in a reactor to hydrogen and carbon monoxide. A small amount of steam can be used to control this highly exothermic reaction. Pure oxygen (99 percent) is usually used to sustain the combustion. Conventional plant designs range from 2 to 50 MMCF per day. Hydrogen purity is 98 to 99 percent at pressures from 50 to 500 psi. Even though this process has seen only limited use
52
in this country to date, the relative scarcity of natural gas and the demand for naphthas as substitute natural gas (SNG) plant feedstock should bring more emphasis to this process as a way of producing hydrogen from lower value feedstocks.
Many refiners have an alternate source of highpurity hydrogen available in limited quantities. Offgases from ethylene, butylene, acetylene and other units producing olefinic feedstocks provide hydrogen in the purity range of 30 to 50 percent. Other sources are tail gases from hydrotreating, hydrocracking and other hydrogen-consuming plants. This hydrogen can be purified up to over 90-percent purity required by most hydrogen-consuming processes. Cryogenics, adsorption on molecular sieves, palladium diffusion or polymer film diffusion can be used for purification. Cryogenics is favored in most refinery applications as it is basically a large volume process giving a high-purity product at a high recovery. To date, these processes have had very limited application, but the polymer film diffusion equipment appears to have increasing merit.
Although hydrocracking consumes a larger volume of hydrogen per barrel of feed than other processes, total hydrotreating and hydrodesulfurization processes require a substantial portion of total hydrogen requirements. Present and future requirements for low-sulfur fuel oils will require increased distillate hydrotreating and either residuum or reduced crude desulfurization and, therefore, increased hydrogen requirements. Increases in reforming capacity will provide marginal increases in hydrogen production, but refineries with hydrocracking processes will continue to require hydrogen generation plants. In some cases, even refineries without hydrocracking will require hydrogen plants to provide sufficient hydrogen for operating the extensive hydrotreating and hydrodesulfurization facilities necessary for producing lowsulfur fuels.
In summary, the use of hydrogen processing has increased in the past few years to the extent that many refiners consume all of the byproduct hydrogen from conventional operations. Direct manufacture of high-purity hydrogen is required for additional supply. Several commercial processes are available for hydrogen supply, and indicated future needs show that moderate growth in hydrogen processing will continue for some time to come.
Product Treating, Finishing and Blending In addition to the hydrotreating process previously

discussed, there are many other treating, finishing and blending steps required in petroleum refining.
As discussed in the first chapter, the product specifications of all refinery products have been steadily changing since World War II to improve the performance of these products in end use. As the equipment and machinery using petroleum products have become more sophisticated, so have the treatment and finishing techniques. Technology advances have improved the operating and economic aspects, resulting in a beneficial influence on blending as well as improvements in the uniformity of product quality. Usually, blending formulations are dictated by product volume requirements and product costs, and the treating and finishing steps are taken to assure that the blend meets specifications.
Sulfur and sulfur compounds constitute the most significant contaminants in crude oil fractions. Other foreign materials which create treating problems are oxygen compounds, nitrogen compounds and metal compounds of iron, vanadium, calcium, magnesium, aluminum, nickel, copper, sodium, potassium, arsenic and zinc.
Mercaptans (sulfur compounds) are one of the especially undesirable contaminants of crude oil and petroleum fractions. One of the oldest processes for removing mercaptans is caustic treating (i.e., washing with aqueous sodium hydroxide solutions). The use of this process is decreasing throughout the United States because of the chemical requirement costs and waste disposal problem it creates. Another process, acid treatment, has been virtually discontinued for economic reasons. One problem with these processes is that they are able to remove only light mercaptans, leaving the higher boiling mercaptans unaffected. Consequently, these heavier mercaptans have to be converted into odorless disulfides by a number of sweetening processes such as Doctor, copper chloride, hypochlorite, lead sulfide, air-inhibitor and air-solutizer processes.
Today only a very small percentage of light gasoline treating capacity is still utilizing some form of the Doctor treating process. Increasing use of a catalyst promoted process for the conversion of mercaptans to disul:fides is being applied to both light straight-run gasolines and cracked gasolines. This process has the additional advantage of eliminating the extraction of thiophenols by a caustic and the resultant disposal problem when using the air-inhibitor sweetening process for cracked gasolines. Copper chloride sweetening processes are still being
used, but the disadvantage to this process lies in the trace amounts of copper left in the treated gasoline. Additional inhibitors must be used to prevent the catalyzing effect of copper on gasoline deterioration.
Cracked petroleum stocks, such as catalytically cracked gasolines, can be sweetened by air-inhibitor processes, whereas the air-solutizer processes are able to treat all gasolines. In these processes, an inhibitor is added to the pre-washed gasoline which is then mixed with air and caustic in a line mixer. Hypochlorite sweetening is used for sweetening natural gasolines and solvent naphthas and for removal of trace mercaptans.
When the use of TEL as an antiknock agent became common in the late 1920's, processes to extract mercaptans from gasoline received strong attention, as all sulfur compounds reduce the effectiveness of the TEL. Caustic circulation with steam regeneration was first employed for this purpose. However, because of the limited solubility of higher boiling point mercaptans, caustic extraction was limited to about 80-percent removal. By using solutizing agents, the extraction efficiency was greatly improved.
With the changing requirements on TEL content in gasolines, less incentives will exist to treat gasoline for complete sulfur removal. However, restrictions of the sulfur content are expected. This will increase the need for treating processes to remove the sulfur from gasoline stocks containing higher sulfur levels.
By the late 1 960's, the need for precise control of gasoline quality and the incentives to improve operating efficiency had led to the use of linear programming techniques to guid� refinery operations and to the use of elaborate processing monitoring devices such as continuous boiling point analyzers, monitoring chromatographs and continuous flash and pour point analyzers. The increased utilization of this type of hardware has reduced the cost of both monitoring and complete automation systems to the point where they can be economically justified.
In-line blending, where components and additives are blended together continuously in a product line, is one of the significant developments in the refining industry which has greatly improved the operating efficiency of finishing operations and product quality control. This procedure has been made even more precise by the addition of automatic control and analyzing equipment, including digital control of individual stocks to give exact finished composition and continuous analyzers for octane quality, vapor pressure and distillation percentages. This degree of con-
53

trol allows excellent efficiency in minimizing the cost of product blends and quality control. It also results in much lower tankage requirements compared to older systems where 5 to 1 0 days of run-down storage is required for each base stock, and a similar amount might be required for finished blends. With a completely automatic system, only surge tanks of 1 or 2 days capacity are required for blending stocks, and many finished blends are pumped directly to the pipeline or through a single surge tank. A high percentage of all gasoline blended today is accomplished by in-line blending, and a significant percentage of these systems has some degree of automation.
The problems facing the refining industry with the requirements for low lead and unleaded gasolines will not reduce the need for precise automatic blending equipment. It will, however, severely limit the TEL, which provides the greatest flexibility in blending and makes possible minimum stock inventories. Whereas the addition of 3 grams per gallon of TEL to the normal gasoline blend will increase the research octane rating by 8 to 1 0 numbers, adding an additional 1 0 percent of high octane component such as 100 RON clear reformate would increase the octane · of a typical base blend about one number. The restriction or omission of TEL creates the problem not only of meeting octane but also of meeting other gasoline control specifications such as vapor pressure, distillation and end point. The extreme variations in composition of blends which may be required to meet octane specifications will, in many cases, result in violation of other specifications. On-line computer control of gasoline blending operations offers a means of effectively controlling this.
In order to protect against variations in blend stock quality which normally occur and to maintain blending capability when production of certain stocks is stopped due to shutting down individual process units for repairs, it will be necessary to maintain much larger inventories of unblended gasoline base stocks. Depending on the individual refinery blending facilities, it may also be necessary to maintain sizable inventories of finished product blends to assure on-specification supplies for final shipment. There is little doubt that the sizable reductions in product inventory achieved through the use of automated blending equipment will be negated to a large extent due to the restricted use of TEL.
Recent proposals have suggested that new gasoline volatility requirements would help to decrease the problems of meeting pollution requirements with in-
54
ternal combustion engines. Due to the restrictive nature of the proposed volatility requirements, many additional problems would occur in product segregation, precise blending control and large inventory requirements.
Lubricating Oil Refining During the 1945-1972 period, the quantity of lu
bricating oils produced annually in the United States has increased 67 percent as shown in Table 15 .
TABLE 1 5
GROWTH IN U.S. PRODUCTION O'F LUBRICATING OILS*
Annual Production of Lubricating Oils
Percent of Total
Million Equivalent Crude Barrels MB/D Processed
1 945 41 .9 1 1 4. 7 2.4 1 950 51 .7 1 41 .6 2 .5 1 955 55.8 1 52.9 2.0 1 960 59.4 1 62.7 2.0 1 965 62.9 1 72.3 1 .9 1 972 70.0 1 91 .8 1 .4
* API Petroleum Facts and Figures (1 959 and 1 965) ; Bureau of Mi nes, Monthly Petroleum Statements.
In general, the preferred lubricating oil is highly paraffinic or naphthenic, with low concentrations of aromatic constituents which reduce the ability of the oil to resist oxidation and deterioration. Wax also is undesirable because of its effect on oil flow characteristics at low temperatures. Supply of crude oils with suitable natural composition has historically been short and is declining. Nevertheless, quality of finished lubricating oils has been improved steadily by-
• Wider use of solvent extraction to remove aromatics
• Wider use of more efficient dewaxing processes • Development of catalytic hydrogen treating
processes to further control sulfur and nitrogen contaminants

• Development of improved chemical additives.
At present, 27 of the 48 U.S. lube oil refiners utilize solvent extraction with a total extraction capacity of 257 MB/D. Sulfuric acid treatment is also used for aromatics removal, but it entails many air, water and land pollution problems. Solvent extraction has, to a large extent, replaced the older acid treatment process.
Use of the chemical solvent methylethyl ketone has led to improved dewaxing processes capable of removal of all undesirable waxy constituents from lube oils. This process also has been applied to deoiling of waxes, replacing the older wax sweating process.
Hydrogen processing of lube oils grew rapidly as low cost hydrogen became available in refineries as a byproduct of catalytic reforming. This process replaces acid and/ or clay finishing, eliminates the pollution problems associated with acid and/ or clay finishing, and provides significantly higher yields of finished lube oil. Currently there are about 1 3 8 MB/D o f hydrogen processing capacity, comprising about 70 percent of total finished lube oil capacity.
A more severe hydrogen treating operation, termed hydrocracking, has been used recently to supplant solvent extraction. Hydrocracking adds flexibility in that it permits production of very high viscosity index lube oils from almost any crude oil, whereas solvent extraction is limited to certain special crude oils. Wider use of hydrocracking will largely be dependent on future lube oil viscocity index demands, availability of these or the lube crude oil types.
Although solvent extraction and hydrogen treating have improved the quality of finished lubes, most of the improvement in recent years has resulted from more effective chemical additives . Not only are additives used to supplement or reinforce well refined lube base stocks, but they also provide special characteristics such as detergency which are otherwise unobtainable. They also make it possible to extend the range of crudes acceptable for lube base stocks. Research has led to a better understanding of how chemical additives function, and the number of lube oil additives and additive combinations has increased greatly in recent years.
Engineering improvements in lube oil processing have included the following:
• More efficient contractors for solvent extraction of lube oils
• Larger size scraped chillers and larger size rotary filters in dewaxing processing
• Improved catalyst reactor mechanics in hydrogen processing
• Improved maintenance procedures which result in longer operating periods between unit shutdowns.
Because of improving technology, capital cost of new lube plants was constant for many years at about $ 1 0,000 per daily barrel of capacity. Over the last 5 to 7 years, inflation has increased this figure to about $ 1 5,000 per daily barrel of capacity.
Environmental Processes In the normal processing of crude oil to manu
facture numerous and varied high quality products, quantities of residual byproduct wastes are removed from the crude and must be properly handled for disposal. Other types of pollutants are generated by the refining processes, such as thermal and particulate discharges, and these too must be controlled. Since the mid-1 950's, the petroleum industry has been a leader in the application of environmental processes for the control of air and water pollution and the disposal of solid waste. The commitment of resources for protecting the environment has become more and more burdensome in recent years. Capital invested in pollution control facilities earns little or no return on investment, thereby making this capital nonproductive and unavailable for alternate profitable use. Some of these facilities are difficult to operate and maintain, thus requiring additional manpower resources, and elaborate testing and monitoring systems are required to achieve continuous effective results.
Atmospheric Pollution Control Processes The major potential refinery emissions which may
contribute to air pollution are sulfur compounds, hydrocarbons, nitrogen oxides, particulates, smoke and carbon monoxide. The character and quantity of refinery atmospheric emissions vary from refinery to refinery depending on crude capacity, type of crude, complexity of operations and measures employed to control emissions. Refinery air pollution control techniques have been developed which should permit refineries to operate in any community without constituting an air pollution problem. Most refinery emissions result from combustion, such as in providing power and heat for processing operations. These include combustion of fuel in boilers for steam generation, combustion of fuel in process heat-
55

ers, and combustion of coke during regeneration of cracking catalyst. The combustion of fuel in boilers and process heaters poses general problems (not specifically related to refineries) such as the presence in the combustion stack gas of sulfur oxides, nitrogen oxides and particulates which relate to the quality of the fuel burned. The combustion of coke from a catalyst is not unique to the petroleum industry, but it produces special problems, such as the formation of carbon monoxide and the entrainment of small catalyst fragments.
Sulfur Compounds
Nearly all refinery processes generate some gases which contain hydrogen sulfide or other sulfur compounds having low molecular weight. After processing to remove valuable components, these gases are used as fuel in process heaters and boilers. However, sulfur oxide emissions will result if sulfur compounds are not removed.
The most common technique for the removal of hydrogen sulfide in gases involves scrubbing the gases with an absorption agent, such as an aqueous amine solution. Hydrocarbon gas rich in hydrogen sulfide enters the bottom of an absorber column, and the lean amine solution enters at the top and contacts the gas countercurrently. The amine solution rich in hydrogen sulfide is regenerated by stripping the hydrogen sulfide with heat and/ or steam. The amine solution is then returned to the absorber. Hydrogen sulfide from the regenerator can be further processed to produce elemental sulfur.
Combustion of residual fuel oils in process heaters and boilers can be a significant source of sulfur oxide. Approximately 1 0 percent of the fuel used in U.S. refineries in 1 968 was residual fuel oils. This is equivalent to 39.9 million barrels of residual fuel oil, and at an estimated 1 . 7 5-weight -percent sulfur the emissions of sulfur dioxide would be 200,000 tons per year.
Hydrotreating of fuel oil for removal of sulfur compounds is an effective though costly process to keep sulfur out of furnace stack gases. In addition, processes are now available which will convert residuals to distillates and lighter products with procedures that permit removal of essentially all of the sulfur compounds. An example would be a gasification process which produces light gases, in the course of which sulfur is converted to a form that can be readily removed by the absorption process (amine, carbonate, etc.).
56
Sulfur dioxide em1sswns from catalytic cracking flue gases can be reduced by hydrodesulfurization of the cracking unit feed. Catalytic cracking feed hydrotreating has been practiced to improve the yield of high demand products rather than to control sulfur emissions. However, this secondary result will make hydrotreating more important in the future for reducing emissions.
Sour water strippers are a potential source of sulfur dioxide emissions if the stripped H2S is burned. Condensates, weak alkaline solutions and other aqueous solutions from refinery processes will normally be contaminated by hydrogen sulfide. Sulfides are detrimental to natural waters and must be removed from refinery waste waters. The most common procedure is to collect the streams and strip out the hydrogen sulfide with steam. The hydrogen sulfide can then be recovered in a system such as an amine absorption unit.
Hydrogen sulfide derived from the petroleum processes described earlier can be converted for sale as elemental sulfur using the Claus process. The Claus process is the most widely used method of producing sulfur from refinery hydrogen sulfide and is based on oxidation of approximately one-third of the hydrogen sulfide to sulfur dioxide which is then reacted with the remaining hydrogen sulfide in the presence of a catalyst to produce elemental sulfur.
Other processes are currently in various stages of development for removing sulfur compounds from sulfur plant tail gas and furnace stack gases. Applications of these new processes are expected to become more prominent as the technology evolves.
Hydrocarbons
Hydrocarbons are the products of a refinery, and there is an obvious economic incentive to prevent their loss to the atmosphere. Therefore, many air pollution control measures are employed as accepted good practice.
Emissions of hydrocarbon from tanks are controlled by (1) eliminating the vapor space in the tank by utilizing a floating roof, (2) utilizing a variable vapor space to allow for changes in pressure and liquid level with excess volumes going to a vapor recovery system, and (3) providing pressurized tanks for storing highly volatile hydrocarbons.
Mechanical seals have been developed as a superior method for minimizing hydrocarbon losses from pump and compressor shafts. Numerous potential sources for small emissions exist and can easily

be controlled at a satisfactory level. Pressure-relief valves can be manifolded to a flare system. Hydrocarbon fumes from air-blowing operations can be consumed by incineration in flares or furnaces.
Miscellaneous sources, such as leaking valves and pipe flanges, are readily controlled by periodic inspection and maintenance. Preventive maintenance programs which include good housekeeping techniques are essential in minimizing hydrocarbon emissions. In summary, adequate technology for control of hydrocarbon emissions from petroleum refineries is available.
Particulate Matter
The major potential sources of particulate matter emissions in modern refineries are catalytic cracking regenerators.
Fluidized catalyst is circulated through the reactor and regenerator. This catalyst is primarily composed of very small particles of silica and alumina, similar in composition and appearance to naturally occurring clays and sand. Coke accumulates on the catalyst in the reactor and is removed by controlled combustion in the regenerator at approximately 1 , 1 00°F to 1 ,200°F in order to restore catalyst activity. In a major cracking unit, 1 00 to 1 5 0 MCF per minute of flue gas will be vented following oxidation of the catalyst, which may be circulating through the unit at the rate of 50 tons per minute.
Normally, two-stage conventional cyclones are located within the regenerator vessel for catalyst recovery and recirculation. Flue gas from such twostage internal cyclones may contain about 200 pounds per hour of catalyst dust, depending on size, design and mechanical condition of the unit. This quantity can generally be reduced by use of an additional cyclone or an electrostatic precipitator which treats the flue gas before discharge to the atmosphere.
Third-stage cyclones of high efficiency have recently been installed in some refineries to enable economic recovery of energy from hot flue gases. Hot flue gases exiting from the regenerator to the thirdstage cyclone are passed through an expander turbine which powers an air blower supplying air to the regenerator or can be used to generate electricity. High efficiency removal of catalyst from the regenerator gases is essential since catalyst particles larger than 1 0 microns will erode the turbine blades. While the incentive for these systems has been the economic recovery of energy, the reduction in particulates emitted is also a benefit. A well designed three-
stage cyclone system, or the alternative utilizing an electrostatic precipitator, has an efficiency for recovering catalysts ranging up to 99.99 percent. Catalyst manufacturers are working toward making more attrition resistant catalysts to minimize the fines problem.
Smoke
Possible sources of smoke in refinery operations may be classified in three general categories: (1) process furnaces and boilers, (2) vent gas flares and (3) incinerators.
Furnaces and heaters should not be sources of undesirable levels of smoke. A large portion of the fuel utilized in the petroleum industry is natural gas, or the equivalent refinery gas manufactured in various processes, which is easily utilized without production of smoke. Whenever liquid fuels such as residual fuel oils are burned, adequate and relatively inexpensive equipment is available to prevent all but a minimal amount of smoke with good operating practices and maintenance. The shortage of natural gas will lead to increased liquid fuel burning. However, this should not affect smokeless operation noticeably.
Waste-gas vent flares can be a major source of smoke and are necessary as a safety measure to handle unexpected releases of vapor. Refining facilities produce relatively large volumes of hydrocarbon gases. Although the steady production of gas is sold or used within the refinery, large quantities of gas may be released from process units in emergencies such as compressor failure, excessive pressure in the units, line breaks or leaks, power failure or fires. Since the large surges of gas cannot be vented to furnaces or other enclosed burning equipment, wastegas vent flares are designed to safely dispose of these gases.
Smoke from these flares can result from an inadequate supply of air in the combustion zone. The most widely used technique to eliminate smoke is the injection of large quantities of steam into the combustion zone with uniquely designed flare tips. Recent techniques permit smokeless flare operation over a wide range of discharge rates.
Disposal of small quantities of oily wastes and sludges has been a continuing problem for refinery operations. The simplest method of disposal has been periodic burning which frequently produces large quantities of smoke. Development of new treating processes, such as hydrotreating, has greatly reduced
57
the production of waste-chemical sludges. In addition, newer alternative methods of disposal make it possible for most refineries to avoid burning waste materials or to burn them in a smokeless manner.
Oxides of Nitrogen
The major source of oxides of nitrogen in a refinery is from combustion of fuels in the various process heaters and boilers. Other sources are the relatively few internal combustion engines (such as drivers for compressors), flares and flue gases from the regeneration of catalytic cracking catalysts.
Refinery stack gas streams from combustion of fuels have low concentrations of nitrogen oxides and are not a significant problem under normal circumstances. A better understanding of the kinetics of the combustion reactions and the formation of nitrogen oxides has led to designs of furnaces and techniques of operation that produce less NOx. However, there is often a penalty in fuel consumption associated with these designs.
If control of nitrogen oxides from all stationary sources becomes mandatory, the control problem for the refining industry will be the same as that confronting all large stationary users of gaseous or liquid fuels.
Carbon Monoxide
The only significant source of carbon monoxide emissions in petroleum refineries is the catalytic cracking catalyst regenerator. Concentrations of carbon monoxide in regenerator flue gases may be in the range of 6 to 1 0 percent.
Carbon monoxide emissions from catalytic cracking units can be eliminated by incinerating the gases in waste-heat boilers or heaters at temperatures of 1 ,500°F to 2,000°F. The heat of combustion of the carbon monoxide and other combustibles and the sensible heat of the regenerator gas are recovered by generating steam or heating the oil charged to the cracking unit. The carbon monoxide is completely oxidized to carbon dioxide and traces of aldehydes, hydrocarbons and cyanides are destroyed.
Carbon monoxide boilers were originally developed as a means of improving the cost efficiency of the catalytic cracking process. Air pollution control is also a benefit. Essentially all major catalytic cracking units constructed in recent years have been equipped with carbon monoxide boilers or heaters. Numerous existing catalytic cracking units have been
58
equipped with carbon monoxide boilers on a profitable basis.
One new trend that is being considered as a possible solution to the CO emission problem is the concept of total burning of the coke in the regenerator, thus eliminating the need for external CO combustion equipment. This requires operating the regenerator at 1 ,400°F and with about 2- to 3-volume-percent oxygen concentration in the exit gas. Changes in regenerator metallurgy are required as well as additions to heat recovery equipment. In many cases, such changes may prove to be a more economical solution than external CO furnaces.
Water Pollution Control
Refineries are relatively small consumers of water -freshwater consumption of the refining industry is less than 0.25 percent of total U.S. consumptive use from natural resources. Water reuse practices have markedly reduced the total wastewater effiuent from the refining industry in the past 20 years. In the early 1 950's, refineries typically used 350 gallons of water per barrel of crude intake; by 1960 this figure had dropped to 175 gallons per barrel; today, some refineries have a water usage of less than 40 gallons per barrel of crude intake. Reuse schemes are helpful in reducing the demand for fresh water and conserving this natural resource, while at the same time reducing the capital and operating costs of waste treatment facilities. However, an overall increase in operating cost may result.
Crude oil contains salt and other matter which is normally removed by water washing to avoid corrosion or fouling of process equipment. Other process waters are used to wash traces of treating chemicals from product streams. Water used in pump glands and for flushing lines and other equipment in preparation for inspection and maintenance work may also be considered process water. Cooling tower blowdown, boiler blowdown, sanitary wastes and ballast also contribute to the total refinery effiuent.
Very effective methods have been developed to give proper treatment to each type of waste, which are broadly classified in three groups:
• Primary treatment-physical separation of oil and sediment
• Secondary treatment-removal of biodegradable dissolved organic material
• Tertiary treatment-removal of non-biodegradable, refractory, dissolved organics and inorganics.

Primary Treatment
Oil is the . most common pollutant found in refinery effluent water. The basic unit for recovering oil is the gravity oil-water separator. Oil and suspended solids may also be removed by flocculation and sedimentation or by dissolved air flotation. Consistent good results are sometimes difficult to achieve with flocculation and air flotation units, as variations in feed quality significantly alter the characteristics for stable flocculation and separation. Gravity separators are relatively simple in construction and operation, and since they usually provide necessary oil separation they are universally found in refineries as the primary treatment method.
Secondary Treatment
Treatment by biological oxidation is a well established procedure for removal of organic components dissolved in waste waters . The benefits to be gained from biological treatment of refinery wastes are varied and include reductions in oxygen demand, oil content and toxicity, and improvement in taste, odor and appearance.
Biological treatment depends on the use of bacteria and other organisms to metabolize waste. The same principles of biochemistry and microbiology apply to the treatment of refinery wastes that apply to the treatment of municipal or other organic wastes. Three forms of biological treatment most commonly used are activated sludge, trickling filters and aerated lagoons.
Activated Sludge: The activated sludge process is an aerobic biological treatment process in which organic impurities are removed by microorganisms suspended within an aeration tank into which oxygen is introduced by one of a variety of means. The microorganisms are maintained in the aeration tank by recycling activated sludge formed in this process. Organic matter is removed by oxidation and synthesis which produce new cellular material.
The basic process consists of an aeration tank followed by a clarifier in which activated sludge is removed and recycled to the aeration tank. As activated sludge builds up, it is necessary to "waste" some (remove it from the system for disposal). Water resulting from the process is clean and clear and the sludge removed is dried and incinerated or used for sanitary land fill. There are many variations of the activated sludge process, all of which depend on the same fundamental microbiological and biochemical processes.
Trickling Filters: A trickling filter is a bed of broken stone, coarse aggregate or plastic packing with some method of distributing waste uniformly over the surface. A gelatinous film of slime composed of aerobic organisms develops on the surface of the aggregate. As waste water trickles over the film, both dissolved and suspended matter is removed by absorption and then metabolized by the organisms. Air flows through the bed by convection and provides the oxygen needed to maintain aerobic conditions. The oxidized waste is clarified before discharge.
Trickling filters may be of the standard-rate type which operate on a once-through basis, or high-rate type which may operate on a once-through fashion or with recycle. These filters have proved ability to withstand relatively heavy shock loads and also have the advantage of producing less excess sludge for disposal than the activated sludge process. They are generally not capable of as high a degree of treatment as an activated sludge unit, but they have the ability to handle heavy loads in terms of pounds per day of oxygen demand.
Refinery trickling filters have been used as the sole biological treatment step, and they have also been used as "roughing" devices to even out the organic load prior to treatment by activated-sludge processes. Although initial cost is high and land requirements are large, maintenance and operating costs are low.
Aerated Lagoons: An aerated lagoon is a large pond requiring sufficient capacity to achieve 10 to 15 days residence time for the waste flow. In colder climates, longer residence times may be required to achieve a high degree of organic removal. Aerated lagoons require a great deal more space than either activated sludge or trickle filters. Power consumption for aeration is roughly equivalent to the power consumption needed for activated sludge.
A properly designed aerated lagoon is capable of the same level of biochemical oxygen demand removal as activated sludge units and is much less prone to upset from shock loadings. Constant mixing of the pond continuously strips C02 and creates enough surface turbulence to greatly decrease photosynthetic activity.
Aerated lagoons are generally followed by a polishing/settling pond to remove the solids from the outfall. Solids accumulations are minor, but some additional BOD can be removed by polishing and settling. Generally, aerated lagoons are the choice when
59

land space is available, a high degree of treatment is necessary, and operating costs are to be minimized.
Tertiary Treatment
The removal of refractory dissolved organics and inorganic chemicals from contaminated water by tertiary methods has been achieved with activated carbon, ion exchange, reverse osmosis and evaporation. Each of these processes has been developed and applied to the conversion of brackish water into drinking water. Selection of the type of unit to be used depends on the type and concentration of impurities to be removed.
Costs for construction and operation are quite high, and their justification has been based on the need to produce extremely high quality (drinking) water. At the present time, this expense has not been practical for the treatment of refinery effluent, and little application has been demonstrated for the use of tertiary treatment in the petroleum industry. However, with continued emphasis on improving the quality of the environment, several demonstration pilot units utilizing each process are in the proposal or testing stage in refinery effluent applications. As information becomes available regarding the longterm effectiveness of and the costs required for applying tertiary treatment to refinery effluent, the benefits for such treatment can be evaluated.
Solid Waste Disposal All crude oils contain some basic sediment which
is generally composed of a mixture of water, rust, iron sulfides, clay, sand, etc., produced with the crude or picked up in transit. Sediment either enters the waste system via the desalter or settles out in tanks, which must be periodically cleaned. Additional solids may enter the system in the raw water supply, from surface runoff, from water softening or other water treating operations, from boiler blowdown, from maintenance activities, and from periodic tank cleaning operations. Many of these wastes end up in the form of oily sludge withdrawn from the bottom of gravity separators. Additional oily solids result from auxiliary processes such as flocculation and sedimentation, air flotation, and recovered-oil treatment processes. Waste organic sludges from the various types of biological treatment processes can also be a major problem.
A variety of treatment methods are in use-refineries are now employing vacuum filtration, centrifuging and fluid-bed incinerators for separating and dis-
60
posing of oil sludge. Several types of solid wastes and the methods used to treat them are described in more detail in the following sections.
Sludges Containing Water and Solids
The main source of sludge containing water and solids is raw water treatment. It is best to handle this type of waste at its source to avoid contact with oil in the drainage system. If space is available, such sludges may be settled in ponds. Centrifugation is a more effective dewatering method, which leaves the solids in cakes that can be used for land fill.
A unique situation exists at units making petroleum coke. The usual practice is to remove the coke product by hydraulic jets from the large drums in which it is formed. The water so used may be clarified for reuse in a closed system, and the coke fines from the clarifier are usually pumped over the coke cars, serving to filter out the fines.
Sanitary landfill, if properly located, designed and operated, can be used for disposal of the solid wastes from refinery operations.
Sludges Containing Oil, Water and Solids
New methods are being developed to handle collected oily sludge. The use of centrifuges for refinery oily wastes is relatively recent. Oily sludges and emulsions can also be effectively handled by pressure or vacuum filtration. A precoat operation is usually required, and the continuous rotary vacuum filter is usually used. Precoat filtration is very effective and gives a cake of sufficient dryness to be used for landfill or fed to an incinerator. Both capital and operating costs are high.
Fluid-bed, rotary kiln and multiple-hearth incinerators can be used for oil sludges, but filtration or centrifugation is necessary to concentrate the waste.
Ponding has long been an economical method of sludge disposal. However, sludge ponds take up valuable space and eventually must be cleaned. It is becoming increasingly difficult to find satisfactory places to haul settled sludge from ponds. Some wastes are blended with natural soil to provide a mixture suitable for dikes, tanks foundations and landfill. At some locations, oily sludge is spread about 6 inches deep in disposal areas, dried and then blended with earth by cultivation. Disposal areas are rotated yearly to promote biodecomposition. Such dispersed dumping tends to provide complete disposal and does not progressively degrade the soil.
Another practice being employed is to spread

sludges thinly over a several-acre site within a refinery. Under normal conditions, such sludge beds decompose biologically within 1 year, with soil bacteria consuming the hydrocarbons. Several petroleum refiners are exploring the acceleration of such decomposition with bacterial seeding, and exploratory crop studies in laboratories show that this technique can substantially improve formerly contaminated soils.
Biological Solids
Excess biological solids are produced to some degree by most biological processes. If waste loads are low and the aeration time is extended so that en-
dogenous metabolism predominates, excess sludge will be at a minimum and may in fact be essentially in balance. Conversely, with high waste loading and short aeration, excess solids disposal can be a major problem.
Aerobic digestion of activated sludge can produce a stable material that can be spread on the ground without causing nuisance. Aerobic digestion for as little as 5 days can result in a 70-percent destruction of the active microbial mass and a 55-percent reduction in solids by weight. The process can be accomplished either in an aeration tank or aerated pond, followed by dewatering by conventional means.
61

Chapter Three
Refinery Efficiency
Introduction
During the 1 946-1969 period, average refinery operating costs increased from 74.6 to 1 37.0 cents per barrel. When corrected for inflation, overall operating costs have shown a slight increase to 80. 1
cents per barrel. Table 1 6 is a breakdown of these costs by major categories. These data show very clearly the areas of major efficiency improvements in the refineries. Efficiency improvements for the most part are reflected in lower labor costs, which have been held at about the same absolute level since 1955 even though wages (including fringe benefits) have increased approximately 80 percent
Purchased Fuel & Power
1 946 6.5 1 950 7.1 1 955 7.2 1 960 9.8 1 965 1 6.7 1 969 1 9.6 1 969 Adj usted
for l nflat ion:j: 1 1 .5
TABLE 1 6
AVERAGE OPERATING COSTS OF U.S. REFINERIES* (Cents per Barrel)
TEL, Mainte-Chemicals nance Total & Supplies Materials Labor
7.2 5.5 36.7 1 2.1 5 .7 41 .0 1 7.9 6.7 45.5 22.9 6.0 50.3 24.5 6.9 44.3 24.6 7.6 47.7
1 4.4 4.4 27.9
* API, Petroleum Facts and Figures (1 971 ) , p. 209.
Non-efficiency
Costst Total
1 8.7 74.6 24.1 90.0 31 .0 1 08.3 38. 1 1 27.1 30.1 1 22.5 37.5 1 37.0
21 .9 80.1
t Non-efficiency costs i nclude insurance, taxes, royalties, research, obsolescence and improvements, and i nterest on capitalization.
:j: Bureau of Labor Statistics, wholesale prices for all commodities; U.S. Department of Commerce, Bureau of the Census, Statistical Abstract of the United States ( 1 971), p. 333.
63
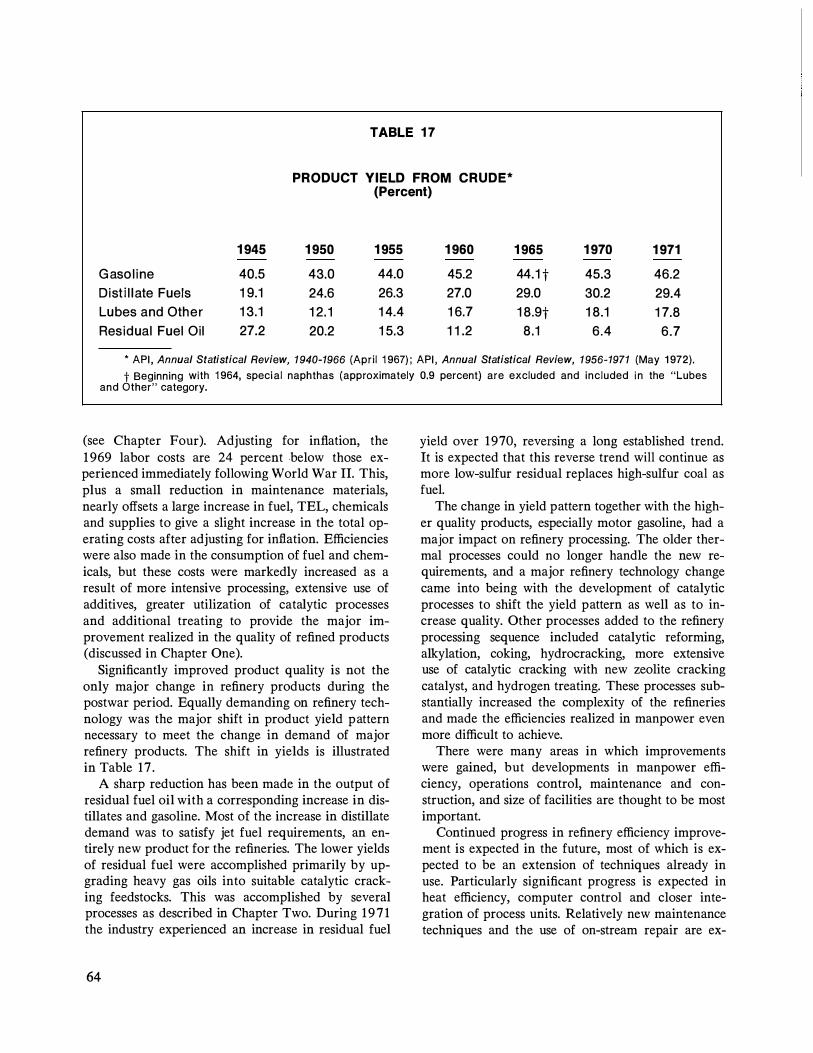
TABLE 1 7
PRODUCT YIELD FROM CRUDE* (Percent)
1 945 1 950 1 955 1 960 1 965 1 970 1 971
G aso l ine 40.5 43.0 44.0 45.2 44.1 t 45.3 46.2 Dist i l late Fuels 1 9.1 24.6 26.3 27.0 29.0 30.2 29.4 Lubes and Other 1 3. 1 1 2. 1 1 4.4 1 6.7 1 8.9t 1 8.1 1 7.8 Residual Fuel Oil 27.2 20.2 1 5.3 1 1 .2 8.1 6.4 6.7
* API, Annual Statistical Review, 1 940-1966 (Apri l 1 967) ; API, Annual Statistical Review, 1 956-1971 (May 1 972).
t Beginning with 1 964, special naphthas (approximately 0.9 percent) are excluded and included in the "Lubes and Other" category.
(see Chapter Four). Adjusting for inflation, the 1 969 labor costs are 24 percent below those experienced immediately following World War II. This, plus a small reduction in maintenance materials, nearly offsets a large increase in fuel, TEL, chemicals and supplies to give a slight increase in the total operating costs after adjusting for inflation. Efficiencies were also made in the consumption of fuel and chemicals, but these costs were markedly increased as a result of more intensive processing, extensive use of additives, greater utilization of catalytic processes and additional treating to provide the major improvement realized in the quality of refined products (discussed in Chapter One).
Significantly improved product quality is not the only major change in refinery products during the postwar period. Equally demanding on refinery technology was the major shift in product yield pattern necessary to meet the change in demand of major refinery products. The shift in yields is illustrated in Table 17 .
A sharp reduction has been made in the output of residual fuel oil with a corresponding increase in distillates and gasoline. Most of the increase in distillate demand was to satisfy jet fuel requirements, an entirely new product for the refineries. The lower yields of residual fuel were accomplished primarily by upgrading heavy gas oils into suitable catalytic cracking feedstocks. This was accomplished by several processes as described in Chapter Two. During 1 9 7 1 the industry experienced an increase in residual fuel
64
yield over 1970, reversing a long established trend. It is expected that this reverse trend will continue as more low-sulfur residual replaces high-sulfur coal as fuel.
The change in yield pattern together with the higher quality products, especially motor gasoline, had a major impact on refinery processing. The older thermal processes could no longer handle the new requirements, and a major refinery technology change came into being with the development of catalytic processes to shift the yield pattern as well as to increase quality. Other processes added to the refinery processing sequence included catalytic reforming, alkylation, coking, hydrocracking, more extensive use of catalytic cracking with new zeolite cracking catalyst, and hydrogen treating. These processes substantially increased the complexity of the refineries and made the efficiencies realized in manpower even more difficult to achieve.
There were many areas in which improvements were gained, but developments in manpower efficiency, operations control, maintenance and construction, and size of facilities are thought to be most important.
Continued progress in refinery efficiency improvement is expected in the future, most of which is expected to be an extension of techniques already in use. Particularly significant progress is expected in heat efficiency, computer control and closer integration of process units. Relatively new maintenance techniques and the use of on-stream repair are ex-

pected to find increasing application in the future and will contribute to further efficiency gains.
Manpower Efficiency Manpower is a major item in refinery costs as
shown in the "Total Labor" column of Table 1 6. Although wage increases (including fringe benefits) have been about 85 percent above inflationary trends, total labor cost has increased only by about 30 percent since 1 946 and has remained relatively constant for the past 1 5 years. This reflects a substantial improvement in manpower efficiency and has resulted in part from technological improvements. In addition to advances in refining technology, manpower efficiency was obtained also by improvements in the skill levels and utilization of individual workers. These include improvement of existing skills, retraining or the development of new skills, improved methods of identifying and deleting unnecessary job duties, and more effective organization of work forces. Manpower efficiency will be covered further in Chapter Four.
Operations Control Another factor which has improved the overall
efficiency of refineries is the improved methods of monitoring and controlling refining operations. These methods include process control, computer control and on-stream analysis.
Process Control Control developments that have had an influence
on refinery efficiency are methods of data presentation to the operators in control centers, the introduction and expanded use of electronic process control instruments, the use of special purpose control devices and techniques, and the availability of improved primary measuring elements.
Data presentation to the operators has been improved via the use of better designed control panels, the use of special data presentation devices, and the application of ergometric (human engineering) principles to improve the man/instrument interface. In 1 946, the density of recorders and controllers on a typical control panel was slightly over one per linear foot of panel with the large case instruments then in use. The advent of miniaturized recorders and controllers has permitted the design of control panels with as many as 1 2 instruments per linear foot. A n example of such a design is shown in Figure 7 . The data presentation
has also been improved on plants with computers through the use of such devices as the cathode ray tubes and teletypes to provide the operator with conventional process data, computed information, process diagrams, information tables, etc. The layout of instruments on the control panels has also been improved to aid the operator in plant operation. The instruments are logically located to permit quick association with the process.
The effect of all such data display developments has been to allow an operator to oversee an increasing number of measurements and control loops, thus enabling him to operate his equipment more effectively. In addition, improved coordination between the operations of adjacent process units results in improved overall stability of operations.
Improvement in control equipment was continued even further in the mid-1950's with the introduction of electronic process control instruments. Electronic instruments permit the use of long transmission distances, thereby opening the door to increased integration of process units and centralization of process control. The application of electronic instruments in the petroleum industry has increased to the point that presently electronic and pneumatic instruments are being installed in about equal numbers.
In implementing automatic process control, the feedback control loop, consisting of a single measurement controlling a single valve, essentially covers what was done for many years. Along with the knowledge of process and control dynamics came an appreciation that incentives for better control existed. Additionally, the trend toward increased integration between units in refinery design and operation increases the need for good control and for advanced control to maintain stability of operation of the integrated units. With heat integration, an upset or disturbance on one unit can be reflected and re-reflected rapidly to other units, thus demanding quick corrective action by the control system. The use of computers has advanced control techniques, and special purpose analog control devices have improved operating efficiency. For example, analog devices to compute internal reflux or feed heat input are used to improve the control of fractionation columns. Advanced control techniques such as feed forward control (prediction of required control action), multivariable control (manipulation of more than one control loop at a time), sample data control (for use with discontinuous primary measurements), and nonlinear control
65
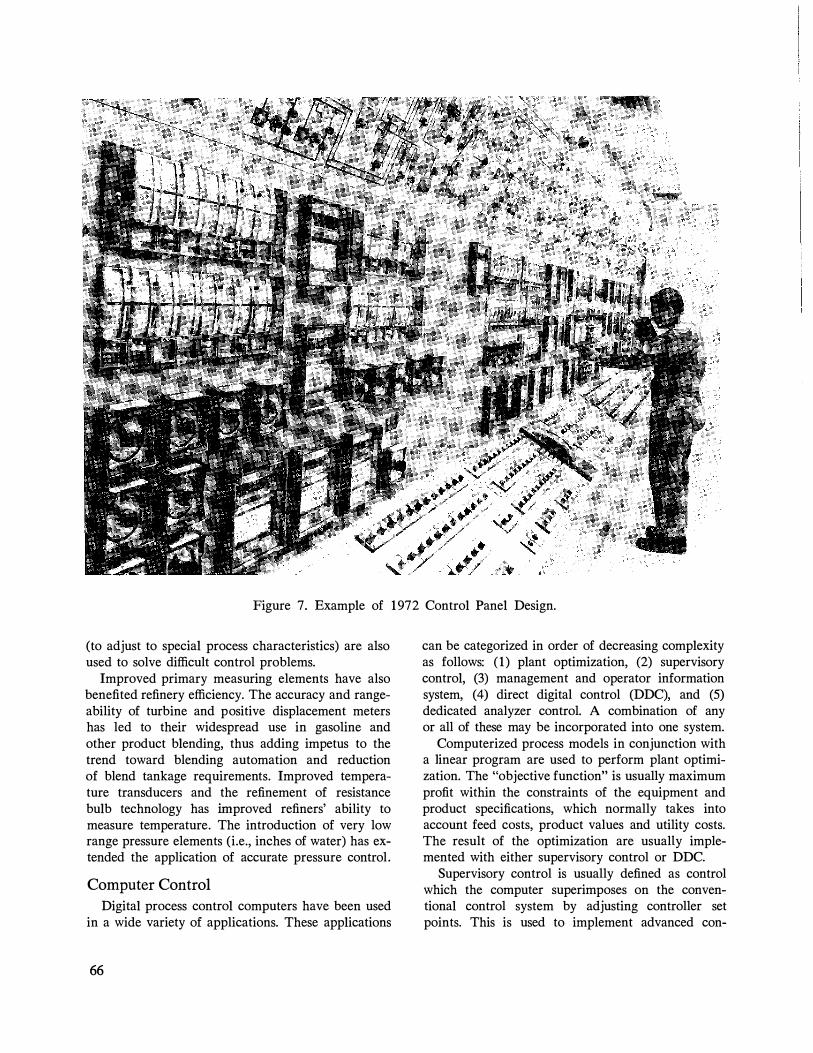
Figure 7. Example of 1972 Control Panel Design.
(to adjust to special process characteristics) are also used to solve difficult control problems.
Improved primary measuring elements have also benefited refinery efficiency. The accuracy and rangeability of turbine and positive displacement meters has led to their widespread use in gasoline and other product blending, thus adding impetus to the trend toward blending automation and reduction of blend tankage requirements. Improved temperature transducers and the refinement of resistance bulb technology has improved refiners' ability to measure temperature. The introduction of very low range pressure elements (i.e., inches of water) has extended the application of accurate pressure control.
Computer Control
Digital process control computers have been used in a wide variety of applications. These applications
66
can be categorized in order of decreasing complexity as follows: (1) plant optimization, (2) supervisory control, (3) management and operator information system, (4) direct digital control (DDC), and (5) dedicated analyzer control. A combination of any or all of these may be incorporated into one system.
Computerized process models in conjunction with a linear program are used to perform plant optimization. The "objective function" is usually maximum profit within the constraints of the equipment and product specifications, which normally takes into account feed costs, product values and utility costs. The result of the optimization are usually implemented with either supervisory control or DDC.
Supervisory control is usually defined as control which the computer superimposes on the conventional control system by adjusting controller set points. This is used to implement advanced con-

trol systems such as optimization, feed forward and multivariable control.
Process information, particularly variables which cannot be measured directly, can be displayed either on a television screen or written on a typewriter. Equipment for data presentation varies from one system to another. Custom operators' panels were used almost exclusively on earlier systems. However, for the past several years, the Cathode Ray Tube (CRT) has proved more versatile and seems to be receiving wide acceptance as an operator communication device. Plants can be controlled closer to more significant targets by presenting measured and calculated variables to the operators in a more meaningful format.
Replacement of conventional instruments with a computer (DDC) has achieved only partial success . Prior to 1 965, computer applications were of the optimizing and supervisory types. Starting in 1965, DDC entered the picture. Its failure to progress as rapidly as some had predicted can be attributed to (1) higher cost than expected, (2) continued reliability problems, ( 3 ) cost of backup requirements for reliability, and ( 4) slowness of general acceptance.
The use of dedicated systems for monitoring and control of process streams through the use of on-stream analyzers have increased considerably in the past several years, particularly in the area of on-stream analyzers data reduction.
Computer control can contribute to improved refinery efficiency by (1) providing more consistent and better control, (2) controlling to an economic optimum, and (3) converting process data into performance information and presenting it in an easily understood format. The use of computers has increased in recent history as indicated in Figure 8 . The absolute numbers may be somewhat approximate due to the difficulty of obtaining complete and accurate data from all sources. However, the shape of the curve in Figure 8 is undoubtedly correct. Articles on new construction in recent issues of the Oil & Gas Journal indicate that about 70 percent of the major revamps on grass roots refineries include a computer system.
On-Stream Analyzers On-stream analyzers are instruments located in
the process unit that continuously measure one or more components or properties of a refinery stream. In the mid-1 940's, developments in physical methods of analysis for laboratory use, such as infrared and
ultraviolent absorption, made their adaptation to on-stream use more feasible. In addition, technology, including the mass spectrometer, became available. As a result, a steady parade of on-stream analyzers was developed starting in the late 1940's and continuing today. In the early years of development, instruments for such measurements as viscosity, flash point and boiling points became available. The infrared and ultraviolet devices allowed some applications in which one component or a family of components were measured in a stream. In the late 1 950's, rapid advances in chromatography made possible the determination of one or more components of a stream with a single instrument. Recent chromatographic techniques have improved the analysis capability and speed, thereby permitting their application to closed loop control. Analyzers are now also available to measure such properties as liquid density, gas density, moisture, oxygen, pH, vapor pressure, refractive index, dielectric constant, boiling point, pour point, freeze point, hydrocarbon composition and electrical conductivity. Improved analyzer reliability and sample system design have also permitted more frequent analyzer closed loop control.
A significant point in on-stream analyzers is that they are largely developed by petroleum and petrochemical processors, whereas conventional measuring and controlling instruments are largely the products of instrument manufacturers. The reasons for this are the small number of analyzers of any one type that the market will absorb and the high cost of development which can exceed $250,000 per analyzer. This makes the gamble less attractive for an instrument company. The incentive for the processor is process operation improvement, which shows up as greater throughput, more product from a given feed, higher quality or less cost. This has reduced costs per unit of production. Usually, the analyzers are licensed to instrument companies in order to recoup some of the development costs.
The usefulness of on-stream analyzers stems from the fact that the usual measurements of temperature, pressure, flow and level do not directly give the information an operator needs, such as a product's quality. The analyzer makes as close a direct measurement of what the operator needs as is practicable with current technology.
Most U.S. refineries use analyzers. The larger, more complex refineries may have on the order of 200 analyzers. In 1966, the installation rate of
67
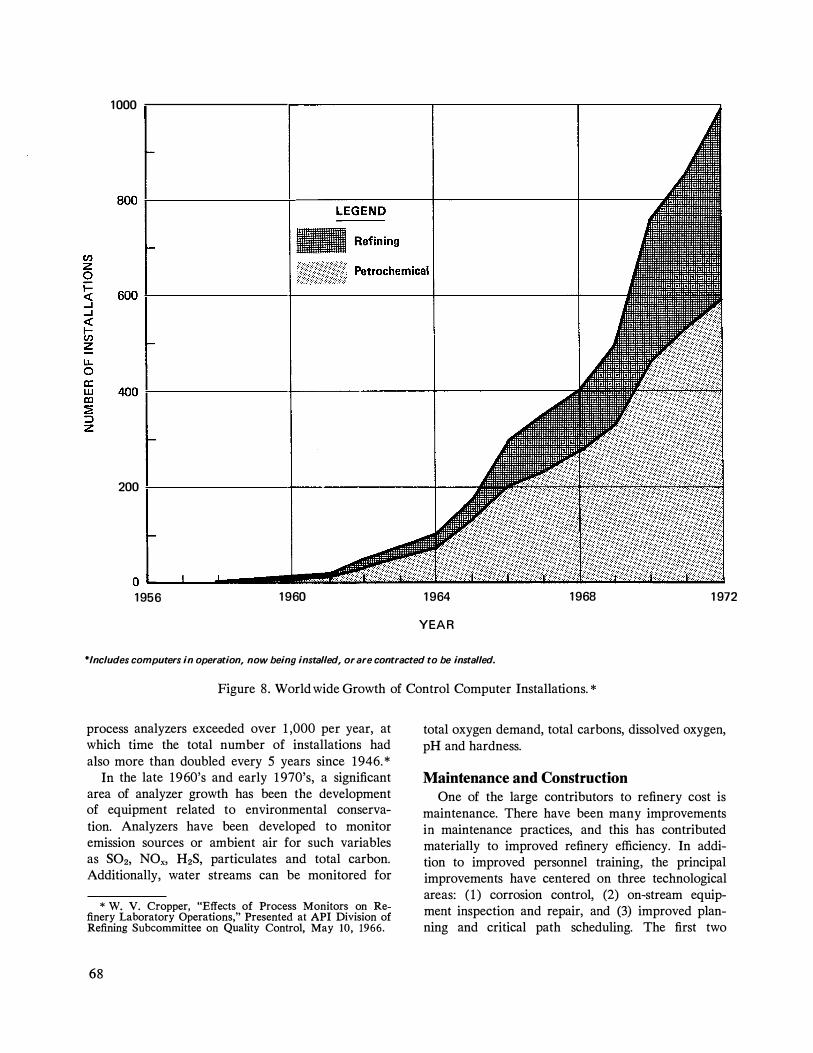
1000
200
1956 1960 1964 1968 1972
YEAR
*Includes computers in operation, now being installed, or are contracted to be installed.
Figure 8. World wide Growth of Control Computer Installations. *
process analyzers exceeded over 1 ,000 per year, at which time the total number of installations had also more than doubled every 5 years since 1946. *
In the late 1960's and early 1 970's, a significant area of analyzer growth has been the development of equipment related to environmental conservation. Analyzers have been developed to monitor emission sources or ambient air for such variables as S02, NOx, H2S, particulates and total carbon. Additionally, water streams can be monitored for
* W. V. Cropper, "Effects of Process Monitors on Refinery Laboratory Operations," Presented at API Division of Refining Subcommittee on Quality Control, May 10, 1966.
68
total oxygen demand, total carbons, dissolved oxygen, pH and hardness.
Maintenance and Construction One of the large contributors to refinery cost is
maintenance. There have been many improvements in maintenance practices, and this has contributed materially to improved refinery efficiency. In addition to improved personnel training, the principal improvements have centered on three technological areas: (1) corrosion control, (2) on-stream equipment inspection and repair, and (3) improved planning and critical path scheduling. The first two

improvements have permitted large increases in run lengths and safer plant operation. The third has reduced the downtime and cost of periodic plant overhauls. Each of these improvements will be described in more detail in the following sections.
Corrosion Control
Control of corrosion has been one of the primary means of achieving long runs in many of the operating units of a refinery. This is probably best illustrated in crude still operations. In the late 1930's, as refiners began to process high-sulfur crudes containing high concentrations of salt, principally sodium, magnesium and calcium chloride, a typical crude still run was often less than 1,000 hours. Today, even though the crude quality is lower, a crude unit may run for 1 to 3 years between turnarounds.
Corrosion rates were first reduced by injection of caustic for neutralization of the acids present in overhead streams. Then ammonia supplanted caustic and came into widespread use in the 1940's, although caustic continued in use in the crude charge. The salt content of crudes continued to increase, from levels of 20 to 50 pounds per 1,000 barrels to levels of 75 to 1 25 pounds. Therefore, in the early 1950's, desalting of crude oils by electrostatic precipitation was adopted, which not only reduced the amount of corrosive acid formed, but also significantly reduced fouling in the crude preheat exchangers.
However, it was not until corrosion inhibitors came into use in the mid-1950's that corrosion was brought under control. These organic amine chemicals, generally added in amounts from 2 to 6 parts per million, were credited with an incremental 50-to 95-percent reduction in corrosion over results with ammonia and desalting alone.* By 1960, the industry was spending about $ 1 .00 per thousand barrels of crude oil for inhibitors. t
Together with these measures, selective use of metal alloys has resulted in further improvement. Monel replaced steel in the upper trays, shell and overhead lines of the gasoline column. Cast iron
* R. J. Hafsten. and K. R. Walston, "Use of Neutralizers and Inhibitors to Combat Corrosion in Hydrocarbon Streams," Proceedings of the A merican Petroleum Institute, I955.
t D. L. Bums, R. L. Hildebrand and Paul D. Thomas "Corrosion Inhibitors in Refinery Process Streams," Pro�
ceedings of the A merican Petroleum Institute, 1960.
run-down coolers which had been plagued with selective "graphitization" corrosion gave way to shell and tube condensers using admiralty brass or Monel tubes. Type 410 ( 1 2-percent chromium) stainless steel has virtually eliminated sulfur corrosion in the pumps, vessels and towers handling reduced crude in the 500°F to 800°F temperature range. Type 3 16 stainless steel resists corrosion caused by naphthenic acids present in some crudes.
During the 1960's, further improvements in crude still efficiency were made by such efforts as twostage desalting and caustic additions to the desalted crude oil. Shorter turnarounds (i.e., less downtime) have been achieved by better maintenance planning and parallel heat exchange to permit on-stream cleaning and maintenance.
In other units of a typical refinery, corrosion also has created obstacles to long runs although to a lesser degree than in crude stills. In catalytic cracking equipment, alloys and wear resistant refractory materials are the principal tools to prevent equipment failure. However, corrosion inhibitors and water washing serve to prevent failures in the gas handling equipment.
Catalytic reformers which were built extensively in the 1950's were unexpectedly plagued with iron sulfide scale formation which caused plugging of the catalyst reactor beds. In the presence of high temperature hydrogen at hydrogen sulfide levels previously considered low (under 0.5 percent), a voluminous flaky sulfide scale formed. Hydrodesulfurizers were built shortly thereafter to remove 95 percent of the sulfur from the reformer feed. The hydrogen sulfide problem was then shifted to the desulfurizer units where it was effectively combatted by the use of stainless steels in the feed-hot eflluent exchange and corrosion inhibitors in the stripper overhead streams.
Hydrocrackers with accompanying hydrogen plants started operating in the mid- 1960's. In general, the potential problems with hydrogen sulfide/hydrogen corrosion in hydrocrackers have been controlled successfully with alloys previously employed for this corrosion problem. However, an ammonium hydrosulfide/water corrosion problem developed in the cold eflluent (particularly in air coolers) which has required either high wash water rates or the application of nickel base alloys. The steam-methane reformer hydrogen plants have experienced severe carbon dioxide/water corrosion on some carbon steel components. However, chromium and nickel-chrom-
69
ium alloys have been used successfully where carbon dioxide/water corrosion has occurred.
On-Stream Equipment Inspection Thorough inspection and repair of equipment has
been a major factor in achieving the high safety standard of refineries. Until the early 1950's, inspection of refinery equipment was done only when the unit was shut down. Then the inspector would determine equipment condition by visual examination wherever he could, calipering for wall thickness of piping and heater tubes where these were opened and internal measuring of corrosion of vessel walls by reference to "bench mark" bars of stainless steel previously attached to the wall. Not only were these methods time consuming for the inspector, but also many craftsmen would be involved in breaking connections, dropping valves, unplugging furnace tube headers, etc. As a result, turnarounds were long and frequent.
Today, nondestructive testing techniques enable the inspector to do much of his inspection while the units are on-stream. This can then make longer runs possible by allowing operation to the safe limiting thickness. For example, the run length of one refiner's fluid catalytic cracking units has increased from an average of 1 year to present runs of over 3 years. The ability to perform on-stream inspection has led to revisions in equipment layout at the process unit to allow taking portions out of service for maintenance without shutting down the whole operation. Turnarounds are also shortened by making it possible to plan better the maintenance and inspection required during unit downtime.
Inspection of piping is the critical problem, not only because there are literally miles of it even on a single refinery unit, but also because the corrosion and wear rates are usually higher than in pressure vessels and heat exchangers. No element of piping, however small, can be ignored since failures have occurred at orifice taps, flanges, threaded connections, nipples and couplings. For on-stream measurement of pipe thickness, radiographic methods or ultrasonic testing are most frequently used.
Cobalt 60 and iridium 1 92 radioactive sources are commonly used for on-stream inspection of piping. The radiographic source is positioned on one side of the pipe with film on the opposite side. Pipe wall thickness is determined by measuring the image on the film using a known correction factor. Radiography is also used to determine malfunction
70
of equipment, such as valve internal damage and column tray failure.
The ABC controls and licenses the use of these radioactive sources, and operators must take certain precautions to safeguard those in the area from the radiation hazard. These requirements have led most refiners to rely on specialist contractors for this work.
Ultrasonic instruments determine pipe wall thickness by the principle of introducing high frequency sound waves into the metal and measuring either the mechanical resonant frequency which varies with the thickness (resonance principle) or the pulse-echo technique which measures the time for return of a pulsed signal from the opposite wall (reflection principle). Current instruments display the thickness values on an oscilloscope or direct-reading dial which makes them quick and easy to use.
Thickness measurement with ultrasonic instruments can be very rapid. Readings are not affected by internal fluids and deposits, and there is no radiation hazard. Measurements have been made on hot pipes of up to 1 , 1 50°F using water-cooled transducers and special high temperature couplants. However, extremely cold pipes present a problem in that frost or ice interferes with good contact.
Cracks in magnetic steels can be revealed by magnetizing the material causing an iron powder to preferentially adhere to the crack. Use of this nondestructive technique is widespread during turnarounds but is occasionally used during a run, for example, to inspect for fatigue cracks in reciprocating compressor discharge piping while on-stream. Cracks in nonmagnetic materials can be revealed by dye penetrant examination.
Ultrasonic instruments can also be used for crack and flaw detection in welds and plates. Because of the attenuating effect that subsurface discontinuities have on the back reflection of sound waves, some refiners have used ultrasonics to determine hydrogen fissuring of steel, grain boundary melting in aluminum and abnormal grain size in furnace headers. This usage requires suitable flaw standards and usually involves more training in the use of the instrument.
The inspector can determine the corrosion rate in the pipe or vessel indirectly through the use of inverted probes which change in electrical resistance with corrosion. These are monitored on an intermittent basis and are used extensively to gauge

the effect of neutralization and inhibitors in corrosion control.
Other on-stream inspection methods include temperature measurement of pipe and vessels using fusible crayons or contact radiation pyrometers. Optical pyrometers are widely used to monitor tube wall temperature in steam methane reformer heaters and pyrolysis heaters where overheating can result in limited service life.
Temperature sensitive paints can be applied to external surfaces of internally insulated equipment. A change in color indicates deterioration or failure of insulation.
The ideal inspection instrument would combine the see-through ability of the radiation methods with the direct-reading features of the ultrasonic instruments, ideally reading out on a television screen the radiographic image of the part, together with numerical thickness measurement, without the necessity for time consuming film exposure and development. Elements of these techniques are already in limited use by industry, such as television imaging of ultrasonic test signals and pulsed X-ray motion pictures. Combining these developments into a practical tool would be a boon to the refinery inspector.
Critical Path Scheduling
Increasing use is now being made of critical path scheduling approaches in refinery maintenance and construction planning. The two basic versions of these techniques are the Program Evaluation and Review Technique (PERT) and the Critical Path Method (CPM). PERT was developed some 15 years ago to improve planning, scheduling and control of complex military projects, and CPM was independently developed at about the same time for major civilian construction activities. Several variations have evolved from CPM and PERT. Some of these are specifically tailored to the problems of refinery construction and turnaround and incorporate added features such as computer scheduling of manpower to reduce peak requirements. Properly selected and applied, these methods serve to enforce a systematic, logical and disciplined approach to planning and carrying out major projects. In refinery operations, these methods can lead to reduced elapsed time and more efficient use of manpower and materials. In consequence, they can help to cut the cost for building a refinery or major addition or accomplishing a refinery turnaround and
can lead to improved refinery returns by getting the facility on-stream faster.
Quantifying the cost reductions achieved through critical path scheduling over conventional methods is not easy because of the many factors that influence any one specific turnaround. Figures of 20-to 25-percent time and cost reduction for a turnaround have been reported. Such figures do not include the value of the added productive capacity that results from the added on-stream time.
A good start has been made in the use of these tools in turnaround and construction planning and scheduling. Present trends indicate that their use is being extended in these fields. The use of CPM for other planning and scheduling tasks is being advocated and receiving increasing attention.
Size of Facilities
The petroleum refining industry, in its continued post World War II effort to reduce unit capital and operating costs, continues to build operating units and complete grass roots refineries of ever increasing capacity, utilizing larger single train equipment, based on the principle that it costs less to build and operate one unit double the size of two smaller units. Based on data presented in Figure 9, U.S. refinery throughput has risen by a factor of 240 percent during the 1945-1971 period, during which the number of operating refineries has dropped by 33 percent, increasing the size of the "average" refinery from 12,400 barrels per day to 41 ,500 barrels per day.
This rapid increase in output of petroleum products provided a vehicle for building increasingly larger facilities, coupled with the fact that many refineries replaced small, inefficient units and refineries with larger facilities in the 1960's, principally to gain the aforementioned operating economies of "scale."
Improved field welding techniques, metallurgy and equipment reliability; larger capacity rigging equipment; and process improvements have all contributed to making the larger size units of today possible. Figure 10 illustrates the trend to larger units, depicting maximum announced sizes of crude and catalytic cracking units as they were built. However, it should be noted that, whereas the size of the "average" refinery has increased markedly in recent years indicative of concentrating operations in fewer refineries, the size of individual units and throughput
71

>-<( Cl
a: w 0.. en ...J w a: a: <( IXl z 0 :::i ...J
::2:
>-<( Cl
a: w 0.. en ...J w a: a: <( IXl Cl z <( en ::J 0 J: 1-
en w
a: w z
u. w a: u. 0
12
10
8
6
4
50
40
30
20
10
400
350
� 300 IXl ::2: ::J z
250
---
L /
f-�
v
v ..........,. ---
/ U.S. CRUDE RUNS
��
1- v ,_,..
AVERAGE RE FINERY THROUGHPUT v 1-
� .--- ----
I-
_/ v
� v
OPERATING RE FIN ERIES IN U.S.
1945 1950 1955 1960
YEAR
1965 1970
SOURCE: API, Petroleum Facts and Figures (1971), p. 135; U.S. Bureau of Mines, Mineral Industry Surveys: "Crude Petroleum, Petroleum Products, and Natural Gas Liquids: 1971," Petroleum Statement, Annual (1971); "Petroleum Refineries in the United States and Puerto Rico," Petroleum Refineries, Annual (January 1972); "Crude Petroleum, Petroleum Products, and Natural Gas Liquids," Petroleum Statement, Monthly (January 1973).
Figure 9 . Increase in Refinery Throughput-1945- 1 97 1 .
72
1975
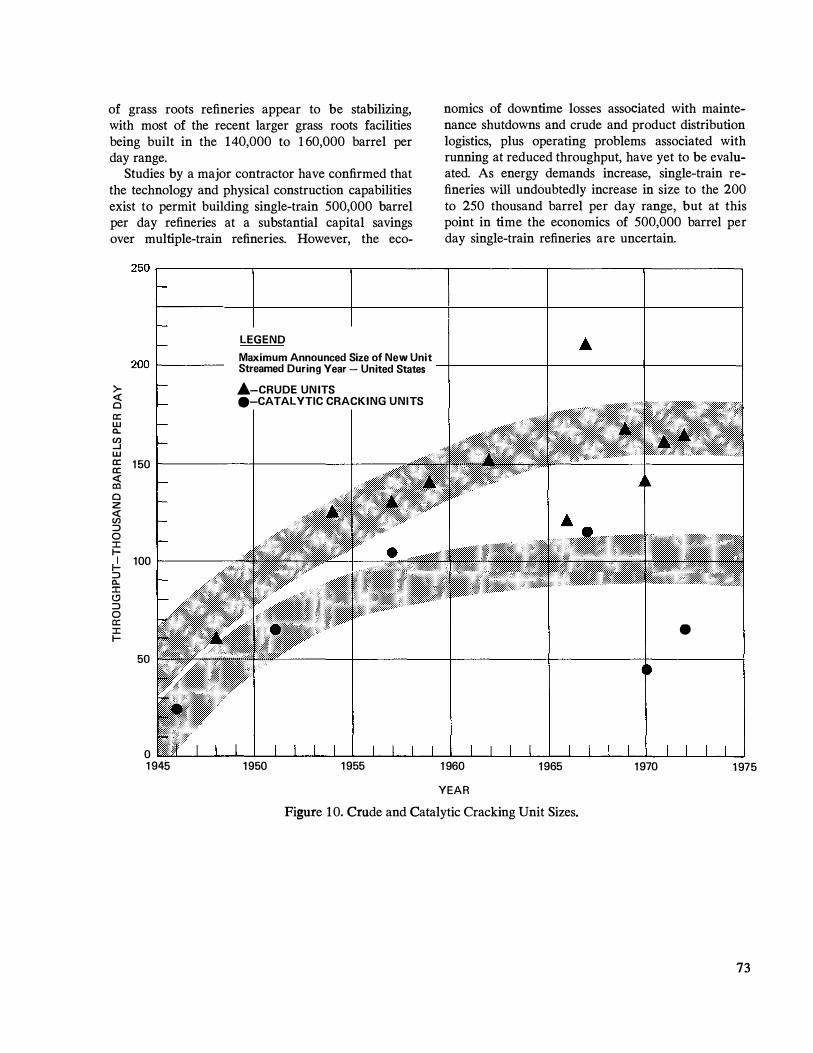
of grass roots refineries appear to be stabilizing, with most of the recent larger grass roots facilities being built in the 140,000 to 1 60,000 barrel per day range.
Studies by a major contractor have confirmed that the technology and physical construction capabilities exist to permit building single-train 500,000 barrel per day refineries at a substantial capital savings over multiple-train refineries. However, the eco-
nomics of downtime losses associated with maintenance shutdowns and crude and product distribution logistics, plus operating problems associated with running at reduced throughput, have yet to be evaluated. As energy demands increase, single-train refineries will undoubtedly increase in size to the 200 to 250 thousand barrel per day range, but at this point in time the economics of 500,000 barrel per day single-train refineries are uncertain.
250r-----------,-----------.-----------.------------.-----------.-----------.
><( Cl a: w c..
� w
LEGEND
Maximum Announced Size of New Unit Streamed During Year - United States --1-------+------+-------1 ·-CRUDE UNITS ·-CATALYTIC CRACKING UNITS
� 150 1-------+-------l----<( co Cl z <( en ::::> 0 ::c t� 100 r------, ::::> c.. ::c (!) ::::> 0 a: ::c t-
50
0 1 945 1950
•
1955 1 960 1965 1970 1 975
YEAR Figure 10. Crude and Catalytic Cracking Unit Sizes.
73
Chapter Four
Refinery Personnel
Changing technology in the refining industry has had a significant impact in the area of personnel. The dramatic advances in equipment, instrumentation and materials, together with the steadily increasing pace of technological and process development and new techniques in training and work measurement and control, have resulted in a new generation of major changes in the refining industry.
Employment Trends The constant drive for larger, more economical
units has had a great influence on both the number of personnel required per barrel of refining capacity and the qualifications and duties of these employees. As modern units began replacing old, smaller units and longer runs, improved materials of construction and on-stream inspection materialized, a strong trend developed toward reducing the total number of refinery employees. The installation of these new units specifically designed to make use of the latest advances in equipment and control techniques has obviously been a major factor in significantly reducing labor requirements per barrel of capacity.
Table 1 8 indicates the substantial decrease in employment which took place in the petroleum refining industry from 1950 to 1 965. This trend toward reduced employment levels, primarily as a result of the advent of modern refining technology, stabilized during the mid-1960's and has not been evident since that time.
The employment decline between 1950 and 1 965 is most pronounced among operating employees where manpower requirements were reduced by
:-:.-�
more than 35 percent, even though refinery output increased by approximately 60 percent during the same period. There are, however, extenuating factors which tend to bring 1965 total employment related to refining into closer balance with earlier figures. One factor is that there has been major growth in the use of outside special services. Many refineries now make extensive use of such outside services to provide assistance in areas in which they previously considered it desirable to maintain their own competence. The long-range result of these moves has been to level out individual company employment by reducing major peaks and valleys. This has also significantly reduced costs by eliminating the burden of maintaining full peak manpower to handle all problems, and in some cases it has improved performance by making specialists available to handle certain types of nonrepetitive jobs. Examples in-elude analytical laboratories, computer program-ming groups, computer service bureaus, contract engineering and construction firms, contract maintenance firms, leased equipment maintenance firms, metallurgy consultants and environmental control consultants.
Also, there has been some shift of employees from refinery operations to similar jobs in petrochemical operations (e.g., large ethylene plants), sometimes occurring within the same plant area. These personnel are counted statistically on a different list.
As noted previously, the general trend toward lower employment levels has not continued for the past several years. Indeed, total refining employment actually increased 3.4 percent between 1965 and 1971 , while operating employment remained essentially unchanged during the same period.
This recent experience would indicate that any
75

TABLE 1 8
TRENDS IN PETROLEUM REFINING EMPLOYMENT*
All Employees Operating Employeest
Number Reduction Number Reduction of Employees Since 1 950 of Employees Since 1 950 (Thousands) (Percent) (Thousands) (Percent)
1 950 1 85.4 1 40.3 1 960 1 77.2 4.4 1 1 2.8 1 9.6 1 965 1 48.1 20.1 88.7 36.8 1 966 1 48.2 89.3 1 967 1 47.9 89.6 1 968 1 50.1 91 .7 1 969 1 44.n 85.2t 1 970 1 53.4 1 7.3 89.9 35.9 1 971 1 53.1 89.9 1 972 1 50.8 89.2
* Bureau of Labor Statistics, Employment and Earnings (Published Monthly).
t Bureau of Labor Statistics defines operating employees to include all hourly paid classifications up to and including working foremen.
:j: Figure is low due to industry strike activity.
manpower reduction made possible by the introduction of larger capacity, more highly automated units will be at least offset by the additional requirements of expanded facilities such that net employment levels may well remain relatively constant or even expand slightly in the future.
Regardless of the movement of overall employment levels, it is clear that the industry is beginning a major replacement of the refinery work force. In the postwar period, the industry accomplished a major decrease in personnel by absorbing losses from deaths, retirements and resignations without bringing in any significant number of new employees. As a consequence, the age of the average refinery worker has climbed steadily-today in the older refineries the average age is from 50 to 55 years. The resultant need to replace substantial numbers of employees over the next 5 to 10 years will provide the industry with an opportunity to introduce new training methods and new work practices to reach
76
a new high in development of the skill and flexibility of the refinery worker.
Personnel Skills Required
In a 1969 study, the NPC gave comprehensive breakdowns of major categories as of mid-1 967 for the petroleum industry, including petroleum refining.* Grouping the 12 skill givisions reported gives a picture of the industry as shown in Table 19.
While there may be some adjustment in the relative skill mix in the future, there is no reason to believe that it will not remain relatively constant. Adjustments, if any, will likely occur in the management, engineering and professional and technician categories at the expense of the craftsmen and semi-skilled and unskilled groups. The operations support area of providing information to refinery managements on such key decisions as what crudes
* NPC, Skills and Occupations of People in the United States Oil and Gas Industries ( 1 969 ) .

TABLE 1 9
BREAKDOWN OF SKILLS FOR THE PETROLEUM INDUSTRY
1967 Major Skills (Percent)
Management, Engineering and P rofessional 25
Technicians 4
Operators 21 Craftsmen 20 Other Semi-Ski l led and Unski l led
Employees 30
Total 100
to run, what changes in unit operating variables to make, what products to produce, and where to best invest new capital has become more important and complex. Professionals and highly trained technicians may increasingly be required in these areas. The introduction of modern technology to refining operations requires more highly trained operators who have a better understanding of the processes they are controlling, but it should not materially affect the percentage of these operators. Technological changes, coupled with increased efficiencies in the utilization of available manpower, may result in some percentage reduction among the maintenance, semi-skilled and unskilled employee groups.
New instrumentation has also been reflected in refinery personnel changes. While much has been written on refinery automation and its effect on manpower requirements, it has also brought about the need for highly skilled technicians. Computers require programmers, operators and specially qualified maintenance personnel. Chromatographs, infrared analyzers, end point analyzers, vapor pressure analyzers, octane comparators and other types of on-stream analytical equipment have been responsible for a new breed of instrument men with a sound knowledge of electronics.
The trend in refineries toward larger units with fewer employees per barrel of capacity requires a new and higher level of skill on the part of opera-
tors. They must have a greater understanding not only of the refining process but also of the physical plant and equipment. Delay or uncertainty in solving complex problems can mean costly rerunning or even expensive shutdowns and repairs. Accordingly, today's refineries have established appropriate hiring standards and instituted training programs designed to provide operators with the necessary skills. No longer are refinery equipment inspectors "hammer and tong" men. On-line inspection techniques include everything from X-ray equipment to ultrasonic leak detectors.
Refinery maintenance and maintenance planning groups are likewise becoming more skilled. By the use of better planning and such aids as critical path scheduling techniques, their efforts are being more efficiently utilized than ever. Major unit turnarounds have been shortened and manpower requirements lessened. Even craft groups have begun to be trained and used in areas that combine to some degree the traditional skills of two or more crafts. They are becoming more flexible in handling groups of related assignments instead of a narrow field of craft specialization. Typical skill-related craft groups could be the following:
• Metal workers-boilermakers, ironworkers and pipe fitters
• Machinery-machinists, millwrights and tool rooms
• Electrical and instrument-electricians and instrument men
• General services-heavy equipment operators, insulators, painters, carpenters and laborers.
Average Hourly Rates
The average hourly earnings of operating workers in petroleum refineries are higher than those in all other manufacturing industries. Payment for fringe benefits in the petroleum industry also exceeds the average of all manufacturing industries. Table 20 and Figure 1 1 show a comparison of the average hourly earnings and fringe benefit payments of operating workers in the U.S. refining industry compared with the average earnings of all manufacturing workers during the 21-year period 195 1 through 1 97 1 .
Thus, over the last two decades, total average earnings in the petroleum industry have consistently been about 35 percent above the average of all manufacturing industries. Table 2 1 indicates the labor costs as a percent of the total operating costs of U.S. refineries for the 1 946-1969 period.
77

TABLE 20
AVERAGE HOURLY EARNINGS OF OPERATIN G WORKERS-1951 -1 971 * (Dollars)
Petroleum Industry All Manufacturing Industries
Hourly Fringe Hourly Fringe Earnings Benefitst Total Earnings Benefitst Total
--
1 951 2.09 0 .464 2.55 1 .56 0.289 1 .65 1 955 2.47 0.61 0 3.08 1 .86 0 .377 2.24 1 959 2.99 0.836 3.83 2.1 9 0.530 2.72 1 963 3.32 0.904 4.22 2.46 0.653 3.1 1 1 967 3.77 1 .1 82 4.95 2.83 0.783 3.61 1 971 4.82 1 .641 6.46 3.57 1 .1 88 4.76
• Bureau of Labor Statistics, Employment and Earnings Statistics for the United States 1909-1970; U.S. Chamber of Commerce, Fringe Benefits (Published Biannually).
t Includes vacations, holidays, pension, life insurance, hospitalization insurance, rest periods, social secu rity, etc.
TABLE 21
LABOR COSTS AS A PERCENT OF TOTAL OPERATIN G COSTS OF
U.S. REFINERIES-1 946-1 969*
1 946 49.2 1 950 45.6 1 955 42.0
. 1 960 39.6 1 965 36.2 1 969 34.8
* API , Petroleum Facts and Figures (1 971 ) .
Even with the highest average hourly earnings for production workers, the petroleum refining industry has been able, through advancements in technology, expenditures of capital and the more efficient utilization of manpower, to reduce the percentage of labor costs to the low of 34.8 percent in 1969.
Productivity During the past 24 years, the productivity in the
78
U.S. petroleum refining industry, expressed as the number of barrels of refinery output per production worker man-hour, has increased substantially. The primary sources of this increase have been advancements in technology enabling construction of units having high throughputs, long run-lengths, extensive use of automatic control instruments, and improved methods of work measurement and control. Larger, more complex plants have also substantially increased the capital investment per worker necessary to construct modern refining facilities. The improvement realized in productivity in the 1947-1970 period is shown in Table 22. Data prior to 1947 are not available. The capital requirements to accomplish this improvement in productivity are noteworthy.
The data in Table 22 show that investment has approximately tripled since 1947 and that labor consumption per barrel of output has been reduced approximately one-third during the same period. Total industry investment is now over $140,000 per worker, or about $1 ,000 per daily barrel of throughput.
Occupational Health and Safety Historically, the health and safety programs for
refinery employees always have been an important aspect of the operation and maintenance of refinery facilities. Concern with employee safety has been

7
TOTAL
6 LEGEND
Petroleum Industries
a: 5
- - - All Manufacturing Industries HOURLY :J
0 � TOTAL
::c
a: UJ 0.. en 4 a: <( ...J ...J 0 0
I 3 en (9 z
z a: <( 2 UJ
FRINGE BENEFITS
- - -
0 1950 1955 1960 1965 1970
YEAR
SOURCE: Bureau of Labor Statistics, Employment and Earnings Statistics for the United States 1 908-1970; U.S. Chamber of Commerce, Fringe Benefits (Published Biannually).
Figure 1 1 . Average Hourly Earnings of Operating Workers-1951-197 1 .
demonstrated over the years b y maintaining a high level of emphasis in such key areas as development of safe work practices, elimination of unsafe conditions and safety training of employees. In regard to health, general surveys have been performed periodically at petroleum refineries to assess the potential for exposure to materials which may be hazardous to employee health. Numerous detailed studies also have been conducted by industrial hygienists and/ or medical personnel to determine if health problems exist in conjunction with refinery operations.
The health and safety programs have been structured around an ongoing, day-to-day relationship between the employee and his immediate supervisor. The supervisor has the primary responsibility for ensuring that employees are informed regarding precautions to be followed for the specific work under
his supervision. He is vested with authority to detect, correct and eliminate work procedures or conditions which might adversely affect employee· health and safety. The full cooperation of each employee is essential to the success of this program, and employees are encouraged to contribute suggestions or submit questions to supervision when they feel that a potential health or safety problem exists. Furthermore, each employee is expected to know and observe health and safety rules, to utilize available safeguards and protective equipment, and to stay alert to his own health and safety as well as that of his fellow employees.
Support in health and safety matters is provided for refinery supervision by specialists who have primary responsibility for developing and coordinating the overall program. The refinery organizations nor-
79

TABLE 22
PRODUCTIVITY AND INVESTMENT IN THE U.S. PETROLEUM INDUSTRY -1 947-1 970*
Total I nvestment Total Refinery I nvestment Refinery Total when Refinery Output per Output Refinery Adjusted to Production per Production (Million Investment 1 970 Dollars Workers Worker Worker Barrels) (Million $) (Million $) (Thousands) (Barrels/Year) (1 970 $)
1 947 1 ,923 3,600t 6,257t 1 46 1 3, 1 71 42,856
1 950 2,1 90 4,600t 7,420t 1 40 1 5,600 53,000 1 955 2,857 6,000 8,700 1 36 21 ,007 63,971
1 960 3,1 1 9 8,400 1 1 ,01 2 1 1 3 27,600 97,451 1 965 3,527 9,525 1 1 ,725 89 39, 1 89 1 31 ,742
1 970 4,390t 1 2,725 1 2, 725 90 48,778 1 41 ,389
* API, Petroleum Facts and Figures (1 971 ) ; Bureau of Labor Statistics, Employment and Earnings Statistics for the United States 1 909-1970; Chase Manhattan Bank, Capital Investments of the World Petroleum Industry (Published Yearly); Bureau of Mines, Petroleum Statement, Annual (Published Yearly) ; Bureau of Labor Statistics, Handbook of Labor Statistics (Published Yearly).
t Includes some investment in petrochemicals; separate investment data for refineries excluding petrochemicals not available prior to 1 955.
:j: Preli minary.
mally are staffed with employees who have extensive experience in either refinery operations or engineering. Therefore, they are knowledgeable concerning potential health and safety problems in the work place. As a result of this prior work experience and their training and experience as health and safety specialists, they are better equipped to be responsive to the health and safety concerns of the employees. These refinery personnel normally are supported by a corporate staff of safety, industrial hygiene and · medical professionals.
Refinery health and safety programs have been supplemented by the establishment of employee health and safety committees, which have provided an additional forum where supervisory and operating employees have meaningful discourse on employee health and safety. These committees function primarily in three areas: (1) conducting inspections of the work place for unsafe procedures and conditions, (2) submitting recommendations where action is considered desirable to eliminate potential health or safety problems, and (3) providing additional opportunity for employees to submit sugges-
80
tions concerning health and safety problems. The technical knowledge required to operate a
highly sophisticated and complex business while handling extensive quantities of flammable and toxic materials is a fundamental part of the petroleum refining industry safety program. The effectiveness of this program has been demonstrated year after year as the industry consistently operates with fewer disabling injuries than the average rate for all major industries. The latest National Safety Council data compared the number of disabling injuries per million man-hours worked in major industries for 197 1 . The frequency rate of disabling injuries for the petroleum refining industry was 4.5 1 as compared to 9.37 for the average of all industry.
Figure 12 shows the injury experience of industry for the 1961-1971 period and illustrates the decline in refinery frequency rates as compared to the increase for all industries reporting to the National Safety Council. Individual refineries have operated 10 million man-hours with only one or two disabling injuries, and one refinery has logged 1 1 million manhours without an injury.

Advancing industry technology requires large numbers of technically trained professional employees whose experiences are broadened by working with professional societies, consensus standards organizations and governmental agencies. The knowledge and skill of these professionals include: ( 1 ) the capabilities of the employees, (2) the limitations of the equipment, (3) the reactivity of the chemical or mechanical processes, and (4) the use and potential hazards of petroleum products to provide safer working conditions for employees and customers.
For example, modern petroleum refinery facilities are operated from master control centers with modern instrumentation that includes alarms, control devices and automatic shutdown devices. Thus, fewer employees control highly sophisticated equipment under safer conditions with less physical effort and exposure. The technical knowledge and inspection
10
* w 1-<( a: 8
>-(.) z w ::::> 0 w a: u.. >-a: ::::> 6 ..., z
4
1960 1965
* Disabling injuries per million manhours of work
techniques used by professional engineers and highly trained inspectors also result in safer operation of modern plant facilities. Ultrasonic equipment that can spot small defects in metal up to 6 inches thick is used to inspect operating equipment for corrosion. In addition, gamma ray techniques are used to examine refinery pressure equipment with the resulting radiographs analyzed to detect internal problems or to measure pressure retaining thicknesses within a hundredth of an inch. These modern inspection techniques are used as part of a planned, orderly procedure to maintain close on-stream surveillance of equipment. These techniques, in conjunction with alloy metals that resist corrosion and the use of corrosion inhibitors, increase the safe, reliable operation of process equipment.
Refineries have excellent emergency equipment, employees are given extensive training in emergency
A LL INDUSTRY
PETROLEUM REF I N I N G
1970
YEAR
SOURCES: National Safety Council, Work Injury Rates (1971 and 1972); API, Facts and Figures ( 1971).
Figure 12. Frequency Rate of Disabling Injuries-1961-1971 .
8 1
procedures, and professional personnel are available to provide emergency medical assistance. For example, in most cases, expensive and sophisticated fire trucks and other portable fire extinguishing equipment are available for refinery use, as opposed to burdening municipal fire departments for equipment and personnel. The old chemical foams used for hydrocarbon fires are being replaced by the latest extinguishing agents, such as mechanical air foam, subsurface foam, aqueous film forming foam, dry chemical agents and halogenated agents. In addition, the emergency crews are trained in the latest firefighting techniques by actually fighting various types of fires under controlled conditions at refinery, industry and university training grounds.
The effectiveness of this emergency equipment is enhanced by use of intra-refinery radio networks and a broad range of personnel protective equipment. For example, protective equipment has been developed to permit employees to work safely at temperatures up to 2,000°F, in atmospheres which may be contaminated by acid, caustic or other hazardous chemical compounds, or in locations with high noise levels. Fresh-air breathing equipment is available to protect emergency personnel in oxygen-deficient or excess atmospheres or in areas where hazardous
82
chemical substances or physical agents may be present.
Additional important influences on refinery health and safety programs are the state and federal safety and health regulations promulgated pursuant to the Occupational Safety and Health Act (OSHA) of
1 970. As a result of this legislation, the Secretary of Labor established a compliance organization, issued safety and health standards, inspects the work place, issues citations for alleged violations, and may assess penalties for noncompliance. The Act also established the National Institute for Occupational Safety and Health (NIOSH) which develops safety and health guidelines for issuance by the Department of Labor and which may enter any facility for the purpose of conducting health hazard evaluations at the request of either the employee or the employer. Legally, industry is obligated to provide each employee with work conditions which are free from recognized safety and health hazards that might cause physical harm to the employees. This includes compliance with all safety and health standards that may be promulgated by OSHA. The effect of these actions on industry practices is discussed in greater detail in Chapter Seven of this report.
Chapter Five
Storage and Transportation
Storage
About 2 to 3 months' supply of crude oil and petroleum products is normally maintained in storage by the industry to provide the working stocks to operate an efficient distribution system. In many instances, it is customary to accumulate stocks in anticipation of peak demand periods-fuel oil is stored in late summer and fall to supply high demands in the winter while gasoline is accumulated in late winter and spring to satisfy summer requirements. Storage is also provided to counteract potential weather interference with supply-extra storage for winter is installed in northern Great Lakes terminals that may be closed to tanker deliveries by ice.
While various forms of storage such as wooden tanks and earthern pits were once common, steel tanks have long been the main form of petroleum storage. However, changes in storage technology have been taking place as the industry searches for more economical, safer and cleaner ways to store the necessary inventory of crude and products. New forms of tankage, such as underground caverns and refrigerated storage, have appeared since 1945, and continued improvements in design and construction of steel tanks have taken place.
Steel Tanks While welded tanks had become the standard by
the end of World War II, improvements in materials, design and construction techniques have helped to keep the cost of storage down while improving its quality. Higher strength steels have made possible larger tanks-the largest now constructed has a
capacity of more than 1 million barrels. Development of field X-ray techniques, which made high quality field weld inspection possible, has led to use of high-joint efficiency in design and hence to savings in metal required for a given tank. The development of internal floating roofs for cone-roof tanks has enhanced the ability of steel storage to conserve the products stored. Also, highly superior exterior and interior protective coatings have been developed to reduce the effects of corrosion. In addition, developments in the area of foundation technology resulting in more accurate prediction of total and differential settlement, coupled with tank structural design techniques, have led to safer, more economical designs that minimize the possibility of tank failure.
Underground Storage
Volatile products such as propane and butane have come into widespread use for motor gasoline components, heating fuels and petrochemical feedstocks. Future growth in areas of SNG manufacture is also anticipated. These changes have prompted the industry to develop economical means of storing these products. Since propane and butane have high vapor pressures at atmospheric temperatures, high-pressure storage vessels or refrigerated tanks can be used for storing these products. However, technological advances have led to alternate storage systems which can handle the problem better and more economically. One method has been to store these materials as liquids under pressure in caverns in the earth's crust, i.e., in a situation not wholly unlike that in which nature has produced them. Large caverns, up to 2 million barrels, have been produced. Most of these have been formed by leaching of salt beds or domes. In areas where suitable salt layers are not available,
83

caverns have been mined in limestone, shale and granite. In addition, some naturally porous media such as depleted oil and gas sands or water sands are being used.
In the case of service station design, underground tanks of conventional steel design have traditionally been used for small volume bulk storage. More recently tanks of fiberglass reinforced plastics have become available for underground use as a solution to corrosion problems.
Refrigerated Storage
A second method of storing the highly volatile products such as propane and butane and even liquefied natural gas (LNG) is to cool them sufficiently so that they are liquid at atmospheric pressure and can be stored in low-pressure vessels of appropriate design. A number of basic types of vessels for this purpose have been designed: insulated single and double walled aboveground steel vessels of up to 600,000 barrels capacity and frozen earth pits with capacities up to 500,000 barrels. For the aboveground case, appropriate steels and insulations are used to construct storage tanks in which the evaporation losses are acceptably low. In the frozen pits, a refrigeration system is used to freeze the soil surrounding the pit into an impermeable layer. The cold liquid then maintains the soil frozen. In both types of storage, the evaporation of a portion of the liquefied gas serves to chill the remainder of the liquid. Many times, refrigeration plants are provided to recondense the evaporating vapors while, in other cases, the vapors are fed directly into a gas transmission system.
Automation
Major savings in the operation of tank farms in refineries and terminals have come about through application of automatic and remote supervisory control systems. By their very nature, storage facilities are spread over large areas with many men required to gauge tanks and to operate valves and pumps if everything is done manually. Such installations lend themselves to improvement through installation of remote reading gauges and remote controls for operating valves and pumps. The industry has been eager to increase efficiency and reduce costs, and consequently automation has been and is being widely applied to tank farm operation. The use of tank farm control computers to monitor tank move-
84
ments, set alarms and prepare inventory reports is ever increasing.
Conservation The industry has realized that significant amounts
of the product can be lost through evaporation of crude or light products in storage. Prior to W odd War II, the value of reflective paint in reducing tank temperatures had been recognized but not widely adopted before 1 940 since adequate paints were not available. Floating roof tanks, in their more primitive forms, had been introduced, and open storage was already disappearing.
After World War II, the trend toward product conservation was greatly accelerated. Tank designs were improved and adequate paints developed. New vapor conservation systems were introduced for cone roof or other fully covered tanks, and in some cases compressors were installed to recover vapors from the storage tanks. While the floating roof tank had already been introduced for storage of volatile crudes and products, it was not nearly as highly developed at the end of the war as it is today. Better flotation systems, drains and edge seals have been introduced in the last 20 years. Some of these, such as tube type edge seals which fill the gap between the tank shell and floating roof, have depended on the postwar development of new materials of superior quality. Steel, aluminum and plastic floating roofs are now in common use as internal roofs installed inside cone roof tanks. In addition to floating roofs, vapor conservation systems have been developed to conserve products both during storage and while trucks are being loaded.
There are a number of general types of conservation systems available today. The simplest type, the gas holder, provides a variable volume vapor space so that vapors can be displaced into the space as tanks are filled or emptied or with variations in volume due to temperature changes.
Other vapor conservation systems utilize pressure, refrigeration, absorption or a combination of these processes to reliquify the vapor and subsequently return them to a storage tank or product stream. In most instances, the cost of this type vapor conservation system is debited to conservation rather than justified by the value of recovered product. Governmental regulations regarding vapor conservation are becoming more widespread, and undoubtedly new legislation will come about which will widen the use of this type system.
Product Quality Preservation The rise in the use of aviation fuels following
World War II imposed new demands on storage facilities. Aviation turbine fuel must be delivered in much cleaner form than was required for prewar aviation products. New storage technology had to be developed to ensure product quality. Fully coated internal floating roof tanks have been used for this service. Additionally, the use of dual tankage systems to allow product settlement has helped preserve quality.
Distribution Systems This section includes development in all parts of
the product supply system from refinery storage tank to the customer, with the exception of specific means of transport which are discussed in subsequent sections. Pipelines and tankers are not discussed in this report.
Aircraft Fueling Systems The development and installation of modem fuel
supply systems for the Nation's aviation industry has been essential to the growth of that industry. At the end of World War II, practically all aviation fuel was delivered both to airports and to airplanes by truck. The largest aircraft then in commercial service, the DC-4, required only 1 ,500 gallons per fueling; mobile truck type airport fuelers had capacities of about 2,500 gallons. Today, jet aircraft such as the Boeing 747, Lockheed's L-101 1 and the Douglas DC-10 can require 30,000 to 40,000 gallons at a single fueling while fuelers have grown to 10,000 gallons. Future aircraft such as supersonic transports could require 40,000 to 50,000 gallons. Not only have the quantities per airplane fueling increased radically, but the number of flights has also vastly increased. A large fleet of trucks would have been required, both on the road for transport to the airports and at the airports for fueling, if technology had not been developed to provide large volume high speed fueling. In addition, the cost of aviation fuel (which is approaching half the direct operating cost of a transport aircraft) would be higher.
The large volume supply problem has been solved by utilization of pipeline systems. Currently, most major airports are or are being connected directly to one or more refineries or major supply terminals by pipeline. The Air Force has said that the use of pipelines has reduced cost of fuel delivery by 14 percent
through 1966 even though the volume has increased by 44 percent.* Pipelines are an economical transportation system, and their use avoids large numbers of trucks being added to already crowded highways. At many airports, hydrant fuel systems, much like a fire main system, have been installed beneath the aircraft loading and service areas. Thus, instead of the conventional fueler truck, only a small hose and filter cart is required to fuel the aircraft. Hydrant mains are fed by pumps located in the normally remote storage area. Using this type of equipment, large volumes of fuel can be delivered at high rates to the aircraft with a minimum of equipment at the plane and a minimum of traffic in the vicinity of the plane. Some hydrant systems were built for piston engine aircraft in the early 1950's, but the method was not widely adopted until the advent of jet transportation coupled with new, modern airports designed to efficiently handle increasingly larger air traffic requirements.
In addition to the problems created by the large volumes of fuel handled, jet engines are more sensitive to fuel cleanliness than were their predecessors, the gasoline engines. Dirt and water (which may form ice crystals) can clog or erode the fuel nozzles in the jet engine. These effects are compounded by the large quantities of fuel consumed in short time periods. Efficient separating and filtering equipment has been developed to remove both water and solid matter, and it provides the primary component in ensuring fuel's cleanliness. It is customary to filter into and out of the airport storage and again at the hydrant cart as the fuel is loaded into the aircraft. Effective field test methods have been developed so that positive assurance of fuel cleanliness at the final loading can be rapidly obtained.
Product Blending Automatically controlled in-line blending of re
finery components to produce specification products was introduced about 1950. Modern control technology and recent advances in computerization and instrumentation are causing a new revolution in blending practice. Blenders are now being used both for blending within refineries and for direct blending into pipelines. Other uses of the same technology include blending of special products such as solvents directly into the delivery truck.
Motor gasoline blending is the major use for product blending. Stream analyzers have been developed
* "Air Force Saves Millions by Use of Product Pipelines," Pipe Line News ( 1966), p. 17.
85

to assure constant product quality. The use of heavy fuel oil in-line blenders is a more recent development.
The primary objective of in-line blending is to reduce inventory and tankage requirements. Components rather than finished products can be stored and then blended as required. New regulations regarding lead will increase incentives for optimizing blending practices due to the reduced flexibility which results from the need to segregate leaded from unleaded products.
Bulk Terminal Operations Automation has also come to the bulk products
terminal. Systems are now in use which permit a truck driver to safely perform all the necessary functions at the loading rack to obtain products and handle basic accounting services. Normally he will identify himself (card readers or key locks), and automatic controls will record his presence and respond to his stated request for product by opening the proper valves and starting the proper pumps after first checking to ensure the load is authorized. The system will record the quantities issued to the driver and many times will provide the invoice or bill of lading which accompanies the delivery. The advent of modern solid state electronics has greatly stimulated this development. Additionally, such systems are being tied into corporate data processing and information systems so that much of the accounting associated with terminal transactions can be done by machine.
Package Goods Handling Although sometimes obscured by the great tech
nological effort expended on the manufacture and supply of the large volume bulk products, many improvements in the methods of transport and supply of packaged petroleum products such as oils and greases have been made in recent years.
As roads, trucks and communications have improved, it has been possible to use larger central warehouses which yield the economies attendant to smaller total inventory and better stock control. Frequently, it is possible to locate the central warehouse adjacent to the packaging plant, and further economies can be achieved by integrating the operation of the warehouse with the packaging plant.
Through the use of computer technology, the warehousing operation (one of the most labor-intensive operations in the petroleum industry) can be automated to keep track of what is received into a ware-
86
house and provide instructions as to where items should be stored. Orders are also processed through the computer which can provide information as to where items are stored and the proper loading sequence for the delivery vehicle. Also, a random access inventory system instead of an assigned space for each item can reduce warehouse space requirements by up to 30 percent.
A technical innovation of recent years which has had an impact in this area is the development of containerization. In a form employed by several companies, the containers are the two halves of a large semitrailer van. The two halves are separately loaded and then locked together to form a single semitrailer. A large tractor unit then delivers the unit to one or two bulk depots which have no local stocks of packaged goods. This long haul is usually made at night when the highways are less congested. At the local depot, the large van is broken into its two halves, each of which becomes a semitrailer van which a smaller tractor unit can handle. Deliveries are than made direct from the half-van to the customers.
Improvements in packaging techniques and in packages have also contributed to the continued low cost of petroleum products. For example, typical well designed canning lines in the late 1940's had speeds of about 200 cans per minute. Speeds of 600 cans per minute are now common, and systems handling 1 ,000 cans per minute are being installed. A variety of automatic machines has been developed to assist in handling these high rates of output. Machines which unload cans from boxes, load cans into boxes, and stack boxes on pallets without direct operator attention are in widespread use.
Newer installations receive incoming empty cans on bulk pallets. The cans are then automatically depalletized, fed to filling and sealing equipment and then to a case packer which forms a carton from a flat blank around a double tier of cans (usually 24 cans total), resulting in a better performing shipping carton.
Improvements in steel quality and in tolerances in manufacture of steel sheet have permitted decreases in the thickness required for both drums and cans. This reduces the cost of the container and its weight which in turn reduces shipping cost. Fiber drums and cans (referred to as composite cans) are providing further savings and improvements on this score. Blow molded and thermoformed plastic cans and, more recently, the flexible pouch concept, may

provide further packaged distribution improvements in the future. Shrinkwrapping, whereby plastic film is used to wrap small containers, is another relatively new innovation which can reduce damage and speed up deliveries of petroleum specialty products.
Industry-wide standardization of both drums and drum closures has contributed greatly to economy in packaging and shipping. Drum-handling machinery can be standardized, and a standardized drum cleaning and reconditioning industry has arisen. Drums can now be sold on a nonreturnable basis. When the customer is finished with a drum, he sends it to a reconditioner who then returns it to standard condition and can supply it to a wide selection of packagers.
Computer Application One of the more rapidly developing technological
areas with increasing impact on distribution systems is that of mathematical models coupled with high speed computing.
The logistical problems of the petroleum industry lend themselves to linear modeling techniques. The numerous supply and demand points, many alternative "routes" and variable economic incentives combine to necessitate the use of sophisticated techniques for system optimization.
Linear programming is the most widely used mathematical technique. As applied to the cost of resource allocation, the objective is to optimize the assignment of scarce resources in a manner which can minimize costs. The linear program provides a method of systematic search for the optimum or best combination of these resources and their end use.
Linear programming techniques are also being used to solve a problem common to all large oil companies-the assignment of demands to supply points. The assignments are made on the basis of two criteria: costs from each supply to each demand and the capacity of each supply point.
In addition to linear programming (an optimizing technique) and data processing, simulation of transportation systems can be used to test facilities capabilities. Random events (storms, equipment failures, etc.) can be included in simulations of transportation facilities. By analyzing a series of runs and providing variations in facilities between runs, a satisfactory facility design can be determined.
One of the prime requirements for the successful use of these logistical optimization programs is an information system to provide accurate up-to-date input data. Computers are now being used exten-
sively to compile, maintain and update transportation rates and records of performance. These are used in monitoring the efficiency of transportation facilities as well as in providing input to other systems. For example, tank car inventory programs provide traffic management with keynote reports listing tank cars which have remained idle for extended periods. This type of exception reporting provides the opportunity for significant returns from better utilization of existing facilities through electronic data processing.
Mathematics has been used to help predict and schedule the distribution systems. The degree-day system for home fuel oil delivery scheduling is widely used. Similar and more sophisticated forecasting systems are being developed for predicting demands of other customers such as service stations.
Computer oriented mathematical models are also being used to establish inventory requirements, production schedules and warehouse locations. Further uses of computer technology will undoubtedly come about in the future.
Transportation Three specific modes of transportation-tank
trucks, barges and rail tank cars-are discussed in this section. As mentioned previously, pipeline and tankers are not discussed in this report.
Tank Trucks During the last 30 years, petroleum delivery trucks
have evolved from gasoline powered 1 ,200 gallon tank trucks and 3,000 to 4,500 gallon tractor trailers to diesel tractors pulling 8 ,000 gallon and larger single and double trailers. Aviation fuelers have changed more radically-from 2,500 gallon tank trucks and 4,000 gallon tractor trailers to 8,000 and 10,000 gallon self -contained aircraft fueling service trucks. (However, much of the aircraft fueling load has been picked up by hydrant systems as discussed previously.)
In addition, the rental truck industry has made great strides in developing tank trucks that are readily converted from one service to another (i.e., gasoline to chemicals, LPG to ammonia, or even liquid to penetration grade greases or dry products). A truck cleaning industry has also arisen to assist the convertibility of the trucks.
The advances in equipment have been accomplished by balancing the design considerations of maximum payload and lightweight equipment against
87

heavy-duty components for long life, reliability and low maintenance cost. An added factor in the design of the vehicles has been consideration for utmost safety and compliance with the laws and regulations of the government bodies including noise and emission standards. These pollution control standards have had little effect on the basic designs for trucks to this point, although some horsepower increases may be necessary in the future to offset the effects of environmental control devices.
The legislative regulations covering vehicle size, weight and operating speeds have probably been the most significant change that has governed the design of new vehicles. Both length and weight restrictions have been liberalized as road and equipment technology has improved.
Design trends toward lighter weight materials have been commensurate with the increased allowable weights and sizes for trucks. The most significant
weight saving has been accomplished with the adoption of aluminum tankage. The elimination of nonfunctional skirting, meters and air eliminators and the use of simplified lightweight piping, valves and manifolds have all reduced the weight of the tanks, resulting in increased payload. Aluminum and other
lightweight components have become standard items offered by the tractor and chassis manufacturers. Additionally, engines, transmissions, axles, frames, cabs, brakes and tires are now manufactured of highstrength lightweight materials which again allow greater payload capacities.
The weight savings have had to be balanced against greater power, speed and safety requirements. Tractors have evolved from small gasoline engine units to diesel units capable of safely operating 70,000 pound
vehicles at current highway speeds. Diesel engines have demonstrated their effective
ness over gasoline engines through the reduction of road failures and lost time, lower operating costs, and increased life between overhauls. These economic gains in using diesels are, however, partially offset by the increased weight of the tractive units.
Safety has been constantly improved in the development of truck delivery equipment in the last 20 years. Suspensions and tank design have improved stability. Brakes, tires and power steering have been improved for greater safety and reliability in the operation of the vehicle. Additionally, antistatic additives to reduce static buildup during product loading are coming into use.
Improved efficiency has been accomplished by de-
88
signing faster loading and unloading systems. Large size piping, high capacity vents, quick-connect hose couplings and more efficient internal and unloading valves have resulted in deliveries of up to 600 gallons per minute on gravity unloading systems. Submerged loading and bottom loading have resulted in greater safety and vehicle utilization as well as reduced vapor losses.
In compliance with recently passed environmental control legislation, delivery equipment is now being developed to incorporate vapor recovery systems which will prevent the discharge of hydrocarbon vapors to atmosphere during the terminal loading and the service station unloading operations. Considerable efforts are also being put forth on the engines in the areas of exhaust emissions and noise levels. Designs are currently available that will meet exhaust smoke levels of less than No. 1 Ringelmann
and that will conform with interior and exterior noise level requirements.
Aviation fueler designs have changed even more radically. In the late 1940's, fuelers were used for servicing gasoline powered propeller aircraft at rates of up to 200 gallons per minute. The advent of jet aircraft radically changed fueling requirements. Pumping rates were increased to 600 gallons per minute and more recently to 1 ,000 gallons per minute for the new 747's, L-10 1 1 and DC-10 jumbo jets. Current delivery pressures range up to 50 psi. Use of two fuelers per aircraft is normal practice, and thus delivery rates of 2,000 gallons per minute are possible. Other considerations in the design have been fuel cleanliness, pressure regulation to prevent damage to aircraft tanks, fuel handling safety, maximum flexibility and safety in servicing the aircraft.
The large jet aircraft fuelers have evolved into 8,000 and 10,000 gallon capacity tanks mounted on three-axle chassis designed for operating with gross loads of up to 1 00,000 pounds. Power to drive and pump fuel was provided by gasoline and now diesel engines coupled to fully or semi-automatic transmissions.
The second generation of commercial jet aircraft serving smaller airports and of privately owned and operated business jets again has resulted in new designs of smaller fuelers of the 2,500 to 5,000 gallon capacity. These self-contained tank trucks utilize conventional truck chassis. However, again the pumping systems are designed for high flow rates, maximum flexibility and safety in servicing the smaller aircraft.

Together with the advances in equipment design there have evolved innovative changes in rate-making procedures to keep transportation costs at their lowest level commensurate with service. These include dedicated truck rates where the key to lower costs is greater utilization and incentive rates predicated on the gallons per day hauled by one unit of equipment which usually is permitted 24 hour pickup and delivery.
. Barges There are over 25,000 miles of navigable inland
waterways in the United States. Barge movements on these waterways represent a most important and probably most economical slice of the Nation's traffic, much of it moving less expensively than by pipeline or by 27,000 deadweight ton (DWT) tankers in coastwise trade. Some 1 6 percent of the Nation's total intercity freight, except ocean and air, moves by barge, and more than 25 percent of this barge traffic is crude oil and petroleum products. Despite increasing unit costs for labor and equipment, barge rates have remained reasonably constant by improvements in productivity which are attributable to technological advances.
Dramatic advances in the design and operation of towboats and tugs have been made since World War II. Just prior to the war, diesel powered towboats became prominent on the rivers. Modern propellerdriven diesel towboats have much more power in a more compact plant than the old steam stern-wheelers. Towboats with power plants as large as 1 ,200 horsepower (HP) were relatively uncommon during the war era. Today, the average towboat has about 3 ,200 to 4,800 HP, while the largest has more than 9,000 HP. The average boats push multi-unit tows of 15 ,000 to 25,000 tons, while the larger, more powerful boats can handle up to 50 barges with a total capacity as high as 60,000 tons. Individual barges will vary in capacity from about 1 ,000 to 3 ,000 tons.
A major technological breakthrough was the development of improved reduction and reversing gears. These gears made possible the use of high speed diesel engines which deliver more horsepower per unit weight than low speed diesels or steam engines. As a result, it has been possible to construct smaller, lighter and less expensive towboats with greater power.
Many other improvements taking advantage of the higher power available have been made. Kort nozzle
propulsion systems which improve propeller efficiency as much as 25 percent have been introduced. Hull shapes have been improved so that it is now possible to use 1 0-foot diameter propellers in channels that are only 9 feet deep. Controllable pitch propellers were tried as a means of attaining higher efficiencies at various speeds, but they have proved disappointing to date. Two speed gears are being utilized in lieu of controllable pitch propellers to obtain higher operating efficiencies when making long voyages in loaded and light conditions.
Flanking rudders and bow thrusters are being used to assist in controlling the larger tows made possible by the higher power towboats. The flanking rudders help maneuver the tow when the towboat is backing or moving astern. The bow thruster, most commonly a remote controlled power unit placed at the front end of the tow, helps to maneuver the tow which is often as long as 1 ,200 feet.
Higher powered towboats not only allow larger tows, but they also make increased speeds possible. Twenty-five years ago, average speeds were 3 to 4 miles per hour. Today, upstream speeds of 5 to 8 mph with maximum loads are not uncommon. The increased speed contributes to economy by increasing the annual carrying capacity of the equipment. Other measures to increase utilization of equipment have also been taken. Radar has been improved, and dual installations have assured that idle time due to fog or darkness will be kept to a minimum. Better ship-to-shore and ship-to-ship communications through the development of new electronic equipment and the single side band radio with its longer range have expedited movements. Crews have become more highly trained and skilled in utilizing the modern equipment aboard the towboat ensuring smoother operations. Midstream refueling from small fuel barges with their own tugs or towboats has saved time previously required to fuel the towboats. Retractable pilot houses on Illinois River towboats have made passage under low bridges in the Chicago area possible without changing towboats. Another important development is fast loading and discharge-integrated 10,000 to 25,000 ton express tows employ powerful pumps and large lines on board and/ or ashore to make loading or discharge of bulk commodities as rapidly as can safely be accomplished.
Advantage has been taken of modern automatic control techniques to ease the burdens of the pilots and to make possible safe dependable operation of
89

the tows and towboats with a minimum of manpower. Automatic steering devices, remote engine controls, and monitoring and warning devices have been developed. Depth finders and swing meters are in widespread use.
Economies have been achieved in some areas, chiefly New York Harbor, by utilizing 300 to 1 ,700 HP diesel propulsion units mounted directly on the barge. For short hauls, these self-propelled barges have proved very beneficial.
Along with the increase in power of the prime movers, barges have increased in size and improved in hydrodynamic design. At the end of World War II, standard barges were 175 by 26 feet or 195 by 35 feet; now they are 290 by 50 feet. In capacity, they have jumped from 1 ,000 tons to 3,000 tons. Along with the increases in length and breadth of the barges, improvements in the waterways have allowed using equipment of deeper draft, thereby providing greater tonnages.
The use of the integrated tow has become increasingly common since World War II ended. Integrated tows are made up so that the underwater portion of the string of barges forms a cleanly streamlined object. This minimizes the effect of water resistance and increases the efficiency of the tow. Older barges were double raked, i.e., both ends of the hull sloped upward. Modern barges, which are intended for use in integrated tows, are either single raked (sloped at one end and square at the other) or box barges (square at both ends) . The single raked barges are used on each end of the barge string, and the box barges are used in the middle. Capacity of the tow can readily be changed by increasing or decreasing the number of box barges. Capacity can be doubled or more by making up a tow of parallel strings of barges.
Barges to move products such as liquid methane at - 258°F, refrigerated ammonia at - 28°F, and molten sulfur at + 300°F have been put into service. Barges with organic, inorganic or metallic internal coatings and double hulls to handle sensitive products and chemicals have been built. There are also double hulled, dual purpose barges that carry one product in the inner hull on the outward trip and another product in the outer compartment on the return trip, thereby avoiding cleaning costs while eliminating empty return voyages.
Unmanned barges for ocean towing service are undergoing similar developments. Such barges towed by tugs vary in size and can be as large as 42,000 DWT carrying various petroleum products. Bulk
90
commodities such as cement and ore are carried in somewhat smaller barges.
Just as the equipment has improved, so have the waterways over which the barge traffic moves. These improvements in the waterway system have the biggest effect on increases in tonnages and reducing the cost of transportation. Continuous improvements in channel conditions and extensions of the navigable waterway system have been made. A notable current project is the simplification and expansion of the locks and dams on the Ohio River system, one of the Nation's busiest waterways. The system in being at the end of World War II consisted of 46 low-lift dams, each with a single 600 foot lock. It is being replaced by a system of 1 9 high-lift dams, each with dual locks-one 1 ,200 feet long, the other 600 feet long. The smaller number and larger size of the locks will reduce the voyage times, thereby decreasing the cost of barge transportation.
The general theme of improvements in barge technology has been the application of the most advanced engineering developments to reduce the unit cost of transportation within the limits of the waterway system. This has been achieved by increasing the speed and size of the tows and decreasing the manpower required to operate them by providing the mechanical and electrical devices to assist the men. Great effort is being expended to maximize the percentage of the time that the barges are moving loaded through the utilization of improved loading and discharge facilities on the docks as well as aboard the barges. This increased utilization has been important in keeping barge transportation costs low.
The trend toward increased utilization and development of specialized barges is expected to continue. Developments in the near future will include greater utilization of double skin tank barges and containment and recovery equipment to minimize effects to the environment.
Tank Cars The total quantity of petroleum product carried
in tank cars is estimated to have been relatively constant during the past 10 years. The tank car fleet maintains an importance in the overall transportation scheme because the cars are well suited to the movement of specialty products with relatively limited volumes (lubes, wax, distillate fuels, etc.) from various origins to diverse locations. Improvements in the technology associated with rail tank cars and their movement have been involved in lowering costs for

transportation of petroleum products. The average tank car capacity for all tank cars has increased from 10, 100 gallons in 1964 to 14,200 gallons in 1972.
Within the past 2 years, two successful petroleum unit trains transporting residual fuel oil to power generating stations have been placed in operation. These unit trains (one in Canada, the other in the South Jersey area of the United States, carrying 1 . 1 6 million gallons and 600,000 gallons per train, respectively) were selected over other alternatives for varying reasons including costs and construction times to be in service.
Size of rail tank cars has increased steadily since World War II. Car size has grown and carrying capacity has increased. Petroleum products formerly moved in 8 ,000 to 1 0,000 gallon capacity cars and now move, in many instances, in cars of capacities between 20,000 and 30,000 gallons. Practical liquefied gas car capacities have been stepped up from around 1 1 ,000 gallons to 30,000 to 33,000 gallons. A 50,000 gallon experimental car has found limited use in this latter category, but this car is largely unsatisfactory except as product storage because of its unwieldy size and poor handling characteristics.
Various means to improve payload and to lower construction cost have been adopted. Use of new materials, such as aluminum and high strength steels, has lowered the tare weight of the car, thus increasing the allowable payload. A raising of the required center of gravity has permitted the construction of large
volume cars of single diameter instead of having to use multiple diameters to achieve large volumes. The use of the tank body as the horizontal strength member of the car has eliminated the bulky underframe common in older cars, which, of course, lowers the empty car weight and raises the allowable payload.
The ability of tank cars to handle specialized cargoes has been greatly improved. Use of special materials or linings for tank bodies and interiors is growing. Cars have been built which are suitable for liquid hydrogen at very low temperatures and for molten sulfur at very high temperatures. While cars with internal heating coils have been common for some time, cars with coils welded to the outside of the tank body have been used with more frequency. These cars have the advantage of being heated while retaining smooth interiors which facilitate drainage. The tank car builders have taken advantage of the newer insulations to reduce the cost of handling extremely cold or hot products.
It is expected that the trend to specialized tank cars will continue. The particular utility to the petroleum industry of rail tank cars is an advantage that is shared in many ways with tank trucks. It is important that improvements continue to be made in the economy of railroad tank car use. Tank cars along with other rail equipment move only a small part of the time. Greater utilization of the cars would help to keep them competitive with other means of transport.
91

Chapter Six
Petroleum Products Demand
Products Demand Since World War II Petroleum products are an integral part of the
energy needed to produce and transport most of the products made throughout the Nation's economy. In 1970, these products accounted for over 40 percent of the total energy utilized in the United States. They are not only essential for maintaining the national security, but they, along with other energy sources, have also permitted the rise in industrial production which contributes to the growth and welfare of the people.
Since World War II, the demand for petroleum products has increased substantially. The total product demand has grown at an average annual rate of 4.7 percent per year through 1 970, and even during periods of economic recession it has shown an increase. In 1 946, the total oil demand was less than 5 MMB/D, but by 1 970 it had grown to 14.7 MMB/D, a 200-percent increase (see Table 23). The per capita consumption also shows a large growth, increasing from 530 gallons per year to 1 , 1 00 gallons per year as shown in Figure 1 3 .
There are many factors which have contributed to the increased demand for petroleum products, the two most important of which are the population growth and the industrial expansion. Population has increased from 142 million people in 1946 to almost 205 million people in 1 970, or a 44-percent increase, which is equivalent to 1 .5 percent per annum (see Table 24). The industrial expansion which took place during this period can be estimated by the growth rate of the Gross National Product (GNP) or the Federal Reserve Board (FRB) Index. The GNP
in 1946 was $3 1 3 billion, and it increased to $722 billion in constant 1 958 dollars-a growth rate of 3.7 percent-while the FRB index went from 60 to 176 during the same period-a 4.6-percent increase per year. The industrial growth, besides increasing the demand for petroleum products for industrial use, has also increased the per capita income from $ 1 ,500 in 1950 to $3,935 in 1 970 in actual dollars. This gain in per capita income comes partly from inflation, but it also contains actual gains in productivity which have come about through new technology and new equipment. The additional income and revised credit policies have allowed people to improve their standard of living where they can buy more cars, take more vacations, add more appliances to their homes, etc., all contributing to a greater demand for petroleum products.
The demand for gasoline, the major oil product, increased from 1 .9 MMB/D in 1946 to 5 .8 MMB/D in 1 970 (see Table 23). This is an increase of 20 1 percent, which is equivalent to a growth rate of 4.7 percent per annum. The per capita consumption of gasoline has increased from 207 gallons per person to 433 as shown in Figure 1 3 . This large change can be explained by the fact that the United States has become a nation on wheels. Eighty percent of the workers use an automobile to commute to and from work with one-fourth of them involved in car pools. Also, more than 80 percent of the vacationing public uses its own cars for transportation. It is estimated that almost one-half of all the automobile travel is for the purpose of earning a living. The family shopping, medical trips and other family business accounts for 30 percent, while the remainder is for family social and recreational activities.
The total miles traveled have almost increased in
93

TABLE 23
U.S. DOMESTIC PETROLEUM PRODUCT DEMAND BY USES*
(Thousand Barrels per Day)
Average Annual Increase (o/o)
1946/ 1960/ 1 946 1 950 1955 1960 1 965 1970 1971 1972 1 970 1 970
Gasoline Automotive 1 ,920 2,534 3,353 3,845 4,592 5,785 6,01 5 6,377 4.7 4.7 Aviation 35 108 1 32 1 61 1 20 55 49 45 1 .9 (14.6) Special
Naphthast 60 82 1 1 0 1 24 1 47 243 238 246 4.6 3.9 Total Gasoline 2,015 2,724 3,655 4,130 4,853 6,083 6,302 6,668 4.7 4.4
Jet Fuels Naph-Type 1 54 280 271 249 259 242 (1 .3) Kero-Type 91 333 718 751 803 1 6.6 Total Jet Fuels 154 371 604 967 1 ,010 1 ,045 9.9
Intermediates Kerosine (ex Jet) 244 323 320 271 267 263 249 235 0.3 (0.3) Distillate
Heating 406 646 978 1 ,1 95 1 ,304 1 ,439 1 ,435 5.4 2.0 Diesel 1 48 287 464 563 340:': 534 586 NA 9.5 Other Distil late 1 1 1 1 49 1 50 1 1 4 482 538 640 2.3 Total Distillate 665 1 ,082 1 ,592 1 ,872 2,126 2,512 2,661 2,913 5.7 3.4
Total Inter-mediates 909 1 ,405 1 ,912 2,143 2,393 2,775 2,910 3,148 4.8 3.0
Residual Oils Heating 1 36 199 236 342 428 51 1 500 NA 5.7 3.6 Other Residual 1 ,1 79 1 ,31 8 1 ,290 1 ,1 86 1 ,1 79 1 ,724 1 ,796 1 .6 7.9 Total Residual
Oils 1 ,315 1 ,517 1 ,526 1,528 1 ,607 2,235 2,296 2,529 2.2 6.8 Lubricants 96 106 1 1 7 1 1 7 1 29 1 36 136 1 44 1 .5 1 .1 Asphalt and
Road Oil 1 35 1 79 254 302 368 446 457 468 5.1 5.4 LPG
Chemical Use 20 41 97 1 96 343 556 575 1 4.9 1 0.1 Residential &
Commercial Use 49 1 32 1 83 275 31 2 494 500 NA 1 0.1 9.6 Other LPG 40 61 1 24 1 50 1 86 1 74 1 76 6.3 (1 .3) Total LPG 109 234 404 621 841 1 ,224 1 ,251 1 ,420 1 0.6 7.7
All Other 333 342 438 449 508 843 863 957 4.3 1 2.5 Total Domestic
Demand All Petroleum Products 4,912 6,507 8,460 9,661 1 1 ,304 14,709 15,225 16,379 4.7 5.4
Net I mports (42) 545 881 1 ,604 2,282 3,160 3,702 4,51 8 Net I mports as
Percent of Total Domestic Demand 8.3 1 0.4 1 6.6 20.2 21.5 24.3 27.6
* U.S. Bureau of Mines, Mineral Industry Surveys (Monthly and Annual Petroleum Statements; Annual Sales of Fuel Oil & Kerosine; Annual Sales of Liquefied Petro-leum Gases).
t 1965 and 1 970 include naphtha 400° for petrochemical use. Earlier years estimated at 3 percent of total gasoline demand.
:t: Diesel reporting was changed in 1968 to show only on and off highway use, excluding railroad, vessel, etc. Figures for 1965 and 1970 shown on that basis.
94
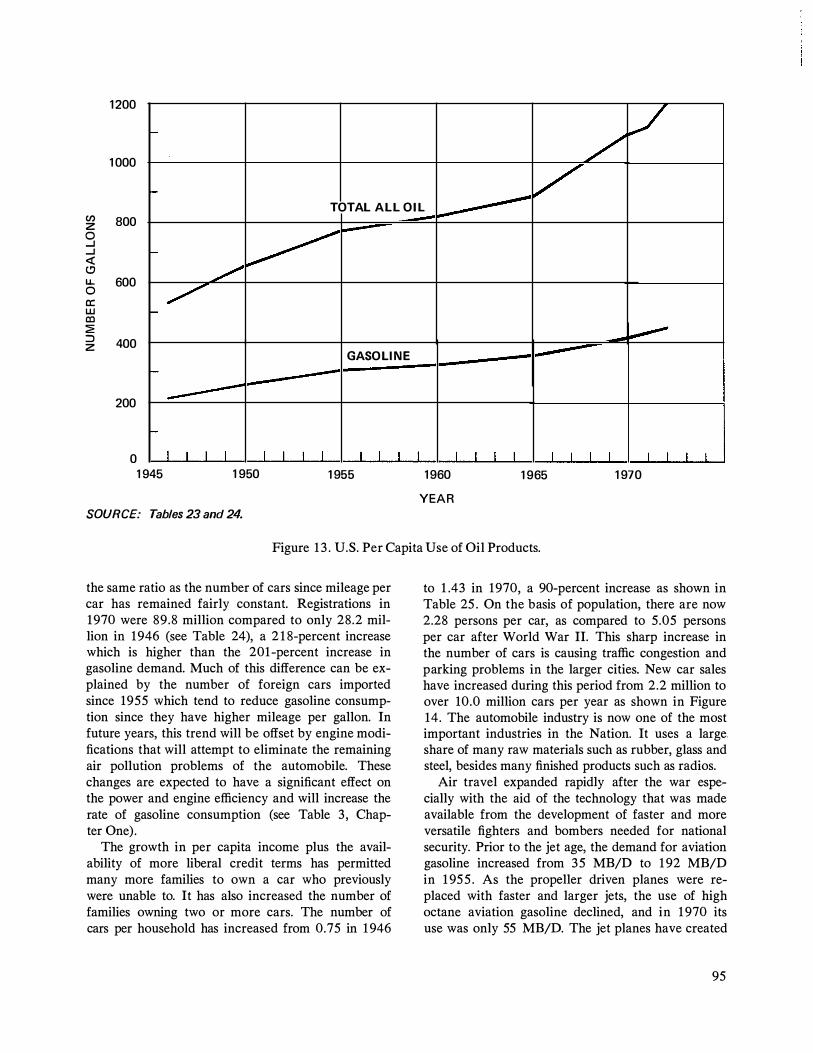
1200
1000
-
/ v
- / TOTAL A L L OIL ---------(/)
z 0 -' -' <( (!) LL 0 a: w CD 2: :J z
800
-
600
-
400
-
200
.... 0 1945
� �
� /
GASOLIN E
-----
I I I I I I I I I I I I 1950 1955
SOURCE: Tables 23 and 24.
1960
YEAR
I I I I 1965
-----
I I I I
�
I I I I 1970
Figure 1 3 . U.S. Per Capita Use of Oil Products.
the same ratio as the number of cars since mileage per car has remained fairly constant. Registrations in 1970 were 89.8 million compared to only 28.2 million in 1946 (see Table 24), a 2 1 8-percent increase which is higher than the 201-percent increase in gasoline demand. Much of this difference can be explained by the number of foreign cars imported since 1955 which tend to reduce gasoline consumption since they have higher mileage per gallon. In future years, this trend will be offset by engine modifications that will attempt to eliminate the remaining air pollution problems of the automobile. These changes are expected to have a significant effect on the power and engine efficiency and will increase the rate of gasoline consumption (see Table 3, Chapter One).
The growth in per capita income plus the availability of more liberal credit terms has permitted many more families to own a car who previously were unable to. It has also increased the number of families owning two or more cars. The number of cars per household has increased from 0.75 in 1 946
to 1 .43 in 1970, a 90-percent increase as shown in Table 25 . On the basis of population, there are now 2.28 persons per car, as compared to 5.05 persons per car after World War II. This sharp increase in the number of cars is causing traffic congestion and parking problems in the larger cities. New car sales have increased during this period from 2.2 million to over 10.0 million cars per year as shown in Figure 14. The automobile industry is now one of the most important industries in the Nation. It uses a large. share of many raw materials such as rubber, glass and steel, besides many finished products such as radios.
Air travel expanded rapidly after the war especially with the aid of the technology that was made available from the development of faster and more versatile fighters and bombers needed for national security. Prior to the jet age, the demand for aviation gasoline increased from 35 MB/D to 1 92 MB/D in 1 955 . As the propeller driven planes were replaced with faster and larger jets, the use of high octane aviation gasoline declined, and in 1 970 its use was only 55 MB/D. The jet planes have created
95

TABLE 24
FACTORS AFFECTING U.S. PETROLEUM PRODUCT DEMAND
United States 1 946 1950 1 955 . 1 960 1965 1970 1971 1972
Total Popu l ation (OOO's) 1 41 ,936 1 52,271 1 65,931 1 80,864 1 94,572 204,835 207,049 208,837
Per Capita I ncome Cu rrent $ 1 ,249 1 ,496 1 ,876 2,21 5 2,746 3,935 4,1 60 4,481
Constant 1 958 $ 1 ,81 0 2,027 2,1 57 2,507 3,043 2,940* 3,070*
GNPt Bi l l ion Cu rrent $ 21 1 285 398 504 676 976 1 ,050 1 ,1 52
Bi l l ion Constant 1 958 $ 31 3 355 438 488 61 8 722 742 790
FRB lndext (1 957-1 959 = 1 00) 60 75 97 1 09 1 47 1 76 1 76 1 88
(1 967 = 1 00) 45 59 66 89 1 07 1 07 1 1 4
Motor Veh ic le Reg is-tration (M i l l ions) 34.4 49.2 62.6 73.7 90.1 1 08.6 1 1 2.9 1 1 7.6§
Passenger Cars 28.2 40.3 52.0 61 .5 75.1 89.8 92.8 96.4§
Trucks and Buses 6.2 8.9 1 0.6 21 .2 1 5.0 1 8.8 20.1 21 .2§
* Calcul ated using GNP price deflator.
tG ross National Product-a measure of total goods and services produced by the Nation.
:j:Federal Reserve Board I ndex-a measure of the Nation's ind ustrial production.
§Estimated.
a need for an entirely different fuel for the aviation business with turbine fuel. Most commercial planes now use a kerosine base turbine fuel, and its consumption has increased from 333 MB/D to 7 1 8 MB/D in the last 5 years-a growth rate of 1 6.6 percent per annum. However, part of this growth was due to replacing other aviation fuels. Faster and larger commercial planes have continued to increase demands, along with a substantial increase in the number of private and business planes. In 1965, there were about 88,000 planes classified in the "general aviation" category. The U.S. air passenger miles were estimated at 104,000 million in 1 970 compared to only 10,700 million in 1950, yet air travel is still in the early stages of growth. The annual consumption of turbine fuel for 1 970 was only 54 gallons per person-enough for only two hours of flying time per year.
The demand for distillates showed a sharp increase after the war as home heating systems were
96
switched from coal to oil, a more convenient fuel. Between 1 946 and 1965, the postwar gain averaged 6.3 percent per year; however, the increase from 1965 to 1970 has only averaged 2.0 percent. The number of homes centrally heated with oil jumped from 2.7 million in 1946 to 1 1 .4 million in 1970. Many homes are also heated with space heaters, and in 1 965 it was estimated that almost one out of three homes was heated with gas.
With more buses and trucks using the expanded and improved highways of this country, the demand for diesel rose substantially. In the last 5 years diesel use on and off the highways went from 340 MB/D to 532 MB/D. Highway consumption more than doubled-in 1970 it was 408 MB/D compared to only 202 MB/D in 1965 .
The construction boom that followed the war added to the need for more residual fuels to heat all the new office buildings, apartment complexes and hotels that were built. The use of residual fuel for

TABLE 25
U.S. PASSENGER CAR GASOLINE DEMAND
1 946 1 955 1 965 1 970 1 975* Annual Passenger Car Gasol ine
Barrels per Person 4.9 7 .4 8 .6 1 0.3 1 2.6 Barrels per Household 1 9.2 27.4 29.3 33.6 39.6 Barrels per Passenger Car 1 6. 7 1 6.2 1 5.3 1 5.8 1 7.4
Number of Passenger Cars-Year End (Mi l l ions) 28.2 52.0 75.1 89.8 1 06.3
Persons per Car 5.1 3.2 2.6 2.3 2.0
Cars per Household 0.8 1 . 1 1 .3 1 .4 1 .7
Gasol ine Demand (M B/D per Bi l l ion $ GNP) 9.6 9.2 7.2 6.2 5.2
Population-Mid-Year (M i l l ions) 1 41 .9 1 65.9 1 94.6 204.8 21 4.8
*Estimated.
,1 2
1 0
CJ) a: <( (.) 8 u.. 0 CJ) z 0 6 ::i ...J
2 4
2 1 946 1 950 1 955 1 960 1 965 1 970
YEAR
SOURCE: Automobile Manufacturers Association, Inc., Automobile Facts and Figures (Detroit, 1966, 1971 and 1973).
Figure 14. New Passenger Car Sales.
heating increased from 1 3 6 MB/D in 1946 to 5 1 1 MB/D in 1 970. Total demand for other uses did not change until the past 5 years because of offsetting factors. Any increases in other uses were offset by the conversion of steam engines to diesel locomotives by the railroad. The residual fuels used by the rail-
roads declined from 275 MB/D in 1 946 to practically none in 1970. During the last 5 years, residual consumed for uses other than heating uses rose sharply-from 1 .2 MMB/D to 1 .7 MMB/D-a 7.9-percent increase per year. Most of this change can be attributed to the utility companies which
97
have been forced to use low-sulfur residuals (1) in place of coal to meet the new restrictions on sulfur emissions to the atmosphere and (2) in place of natural gas where supply is not adequate to keep up with the demands for electric generation.
Lubricating oils and greases have been so improved that their additional efficiency practically offsets the new demand. By 1 966 over 55 percent of the cars had a 30,000 mile chassis lubrication compared with about 20 percent in 196 1 . Also, most cars now only need oil changes every 4,000 to 6,000 miles versus the conventional 1 ,000 miles which was recommended in the early postwar years. Lubricating oil demand increased from 96 MB/D in 1946 to 1 3 6 MB/D in 1970-an average growth of only 1 . 5 percent per year.
The postwar highway construction program, including the federal interstate network, has maintained a strong demand for asphalts. Its use has increased from 1 3 5 MB/D to 466 MB/D in 1 970, exceeding 5 percent per year. Asphalt is also used extensively in building runways at airports and for roofing materials.
Another large volume product is LPG, and after jet fuels it has the highest overall growth rate. LPG has found considerable demand as a raw material for making petrochemicals and for space heating and cooling in commercial and residential buildings. Since World War II, the LPG growth rate has exceeded 1 0 percent per year in these two areas.
Future Projections to 1980 The requirements for refining capacity are re
lated to and dependent upon petroleum product demands. The NPC has recently made a comprehensive long-term projection of petroleum demand in the United States through 1985 .* These projections were used by the NPC Committee on Factors Affecting U.S. Petroleum Refining with some near-term adjustments.
In the Initial Appraisal, an assessment was made of total U.S. energy consumption by market sectors. The various fuel subcommittees applied their respective judgments in deciding what factors would affect demands for the particular fuel examined and took into account the probable supply of other fuels.
Future demand for petroleum products is therefore expected to grow at a rate of 5 .7 percent per year from 1971 to 1975, 2.7 percent per year from
* NPC, U.S. Energy Outlook: A n Initial Appraisal 1971-1985, Volume Two (November 1 97 1 ) .
9 8
1976 to 1980, and 3 .0 percent for the 198 1-1985 period. Total product demand is projected to be 19.8 MMB/D in 1975, 22.6 MMB/D in 1980 and 26.2 MMB/D in 1985.t The growth of two major products in transportation-gasoline and jet fuel-is shown in Table 26.
As in previous decades, gasoline will continue to be the principal petroleum product, and consumption will reach 8.4 MMB/D by 1980-a growth rate of approximately 3 .4 percent. Although the population growth is projected at a lower rate than that prevailing in the last 10 years, there are other factors which will tend to raise motor fuel demand. With higher pay, longer vacations, earlier retirement and longer life, people will have the opportunity to travel more. Also adding to the anticipated growth in domestic demand will be the engine modifications required to practically eliminate all of the automobile's air pollution problems. These changes are expected to decrease engine efficiency and increase fuel consumption as discussed in Chapter One.
The commercial turbine fuel demand is projected to continue to show sizable gains. A conservative growth rate of 5 .2 percent per year is projected for the decade. The rise in pleasure travel with the larger and more comfortable jets should be substantial both abroad and at home. It is anticipated that special fares, families traveling in groups, and higher incomes will permit and encourage such travel. Commercial turbine fuel demand is expected to reach 1 .2 MMB/D by 1980.
Distillate fuel consumption for home heating is not expected to grow appreciably as long as the use of gas and electrical beatings systems is able to expand. However, shortages of gas supply and electric generating capacity may accelerate the use of distillate in the home heating market somewhat.
Diesel fuel consumption continues to expand especially with the development of the interstate highway system which permits trucks and buses to travel a greater distance in a day. The growth rate of highway diesel consumption is approaching 1 0 percent per year. Other uses for diesel fuel such as stationary engines and railroads will have smaller gains. Slowdowns in the completion of nuclear or fossil-fueled electric generation facilities or dislocations in the conventional (coal or gas) fuel supply to existing electric power generators could throw a greater load on turbine fuel generated power for peak shaving
t NPC, Factors Affecting U.S. Petroleum Refining-A Summary (May 1973 ) , p. 15.
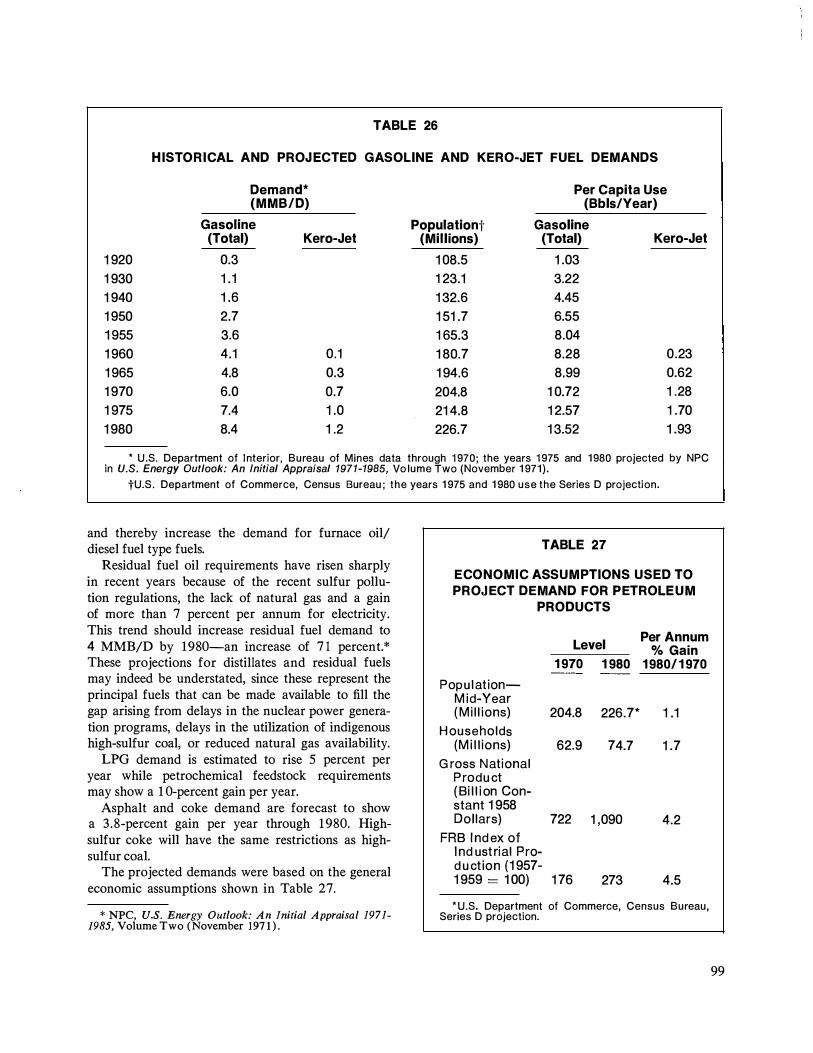
TABLE 26
H ISTORICAL AND PROJ ECTED GASOLINE AND KERO-JET FUEL DEMANDS
Demand* Per Capita Use (MMB/D) (Bbls/Year)
Gasoline Populationt Gasoline (Total) Kero-Jet (Millions) (Total) Kero-Jet
1 920 0.3 1 08.5 1 .03 1 930 1 . 1 1 23.1 3.22 1 940 1 .6 1 32.6 4.45 1 950 2.7 1 51 .7 6.55 1 955 3.6 1 65.3 8.04 1 960 4.1 0.1 1 80.7 8.28 0.23 1 965 4.8 0.3 1 94.6 8.99 0.62 1 970 6.0 0.7 204.8 1 0.72 1 .28 1 975 7.4 1 .0 21 4.8 1 2.57 1 .70 1 980 8.4 1 .2 226.7 1 3.52 1 .93
* U.S. Department of Interior, Bureau of Mines data through 1 970; the years 1 975 and 1 980 projected by NPC in U.S. Energy Outlook: An Initial Appraisal 1971-1985, Vo lume Two (November 1 971) .
tU.S. Department of Commerce, Census Bureau ; the years 1 975 and 1 980 use the Series D projection.
and thereby increase the demand for furnace oil/ diesel fuel type fuels.
Residual fuel oil requirements have risen sharply in recent years because of the recent sulfur pollution regulations, the lack of natural gas and a gain of more than 7 percent per annum for electricity. This trend should increase residual fuel demand to 4 MMB/D by 1980-an increase of 7 1 percent.* These projections for distillates and residual fuels may indeed be understated, since these represent the principal fuels that can be made available to fill the gap arising from delays in the nuclear power generation programs, delays in the utilization of indigenous high-sulfur coal, or reduced natural gas availability.
LPG demand is estimated to rise 5 percent per year while petrochemical feedstock requirements may show a 1 0-percent gain per year.
Asphalt and coke demand are forecast to show a 3 .8-percent gain per year through 1 980. Highsulfur coke will have the same restrictions as highsulfur coal.
The projected demands were based on the general economic assumptions shown in Table 27.
* NPC, U.S. Energy Outlook: An Initial Appraisal 1971-1985, Volume Two (November 197 1 ) .
TABLE 27
ECONOMIC ASSUMPTIONS USED TO PROJ ECT DEMAND FOR PETROLE U M
PRODUCTS
Level Per Annum
% Gain 1 970 1 980 1 980/ 1 970
Pop u l at ion-M id-Year ( M i l l ions) 204.8 226.7* 1 .1
H ouseholds (M i l l ions) 62.9 74.7 1 .7
G ross National P rodu ct ( Bi l l i on Con-stant 1 958 Dol lars) 722 1 ,090 4.2
FRB I nd ex of I nd ust rial Pro-d u ct ion (1 957-1 959 = 1 00) 1 76 273 4.5
*U.S. Department of Commerce, Census Bureau, Series D projection.
99

Chapter Seven
Technical Aspects of Government and Community Relations
National Defense
Petroleum is an essential requirement for any country to maintain a strong national defense system. This means not only an adequate supply of crude oil but also the refining capability and technical knowledge necessary to make the sophisticated products required for modem warfare.
Wartime Administration
In order to understand the refining industry's support of the Nation's defense programs, it is necessary to review briefly the program during World War II. When the war started, the future of the refining industry was uncertain. Normal methods of transporting crude and products were disrupted by the submarine attacks along the East Coast. Future military requirements for petroleum products were indefinite. For example, the initial goal for 1 00 octane aviation gasoline was set at 120 MB/D late in 1 94 1-a staggering figure considering that the production at that time was somewhat less than 40 MB/D. Three years later, the requirement for 1 00 octane gasoline was more than 600 MB/D.
The President designated the Secretary of the Interior as Administrator of the · Petroleum Administration for War (PAW) . PAW was staffed and, in a short time, companies made available to PAW their proprietary technical information. They pooled their facilities, technical information and products and,
under PAW direction, ran their refining activities as if they were component parts of one huge refinery. With such cooperation, production of petroleum products reached levels never before attained-levels without which the war might have been greatly prolonged.
Industry committees, such as the Aviation Gasoline Advisory Committee and the Technical Advisory Committee, held national and district meetings at which technical and operating developments were freely discussed. Technical subcommittees of the industry collected and analyzed operating data and presented to the industry recommendations and suggestions which were invaluable in maintaining an increasing production of 100 octane gasoline and its components. In addition, the petroleum refining engineering firms gave freely of their knowledge and manpower to increase the production of aviation gasoline. The whole program of aviation gasoline was an example of what teamwork can accomplish.
Postwar Reorganization
The government-industry cooperation in petroleum matters had been so effective during the war that officials of the U.S. Government wished to maintain it in peacetime. When President Truman issued the order terminating PAW in May 1946, he directed the Secretary of the Interior to establish a national council of petroleum industry representatives following the same general pattern in which the Petroleum Industry War Council operated so successfully. The Secretary of the Interior responded to this suggestion by establishing the National Petroleum Council to advise, consult and make recommendations to him on oil and gas matters when he so requested.
1 0 1
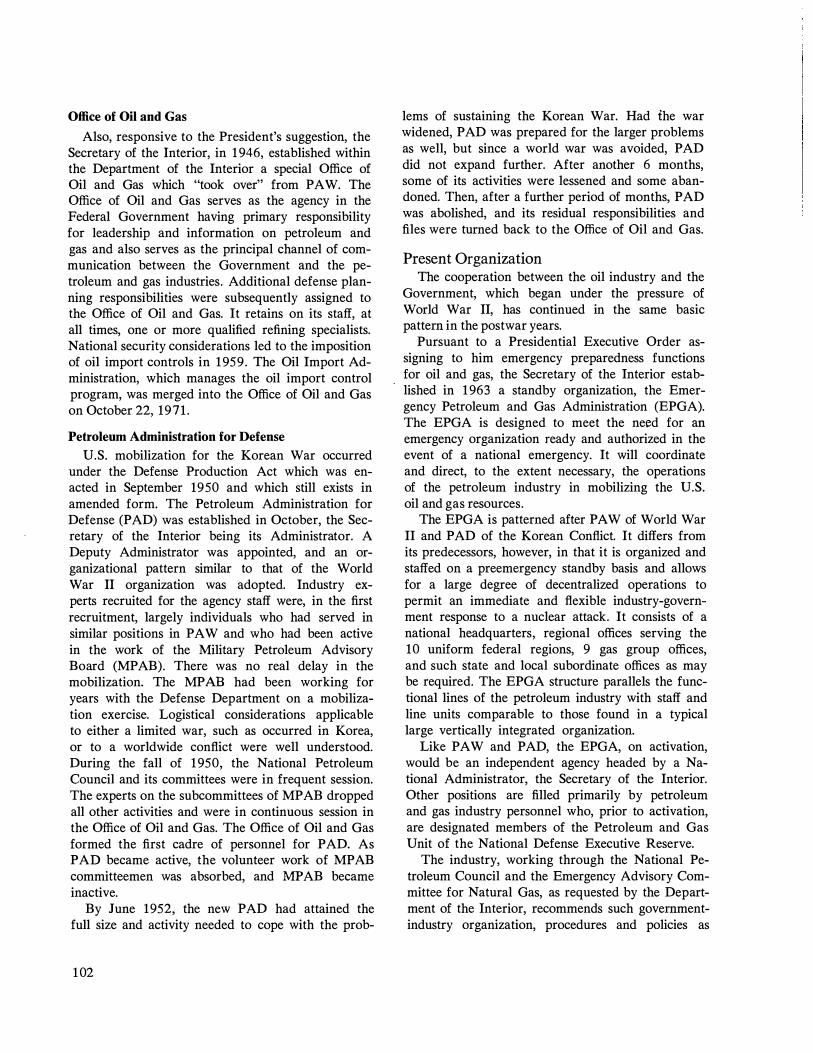
Office of Oil and Gas
Also, responsive to the President's suggestion, the Secretary of the Interior, in 1 946, established within the Department of the Interior a special Office of Oil and Gas which "took over" from PAW. The Office of Oil and Gas serves as the agency in the Federal Government having primary responsibility for leadership and information on petroleum and gas and also serves as the principal channel of communication between the Government and the petroleum and gas industries. Additional defense planning responsibilities were subsequently assigned to the Office of Oil and Gas. It retains on its staff, at all times, one or more qualified refining specialists. National security considerations led to the imposition of oil import controls in 1 959. The Oil Import Administration, which manages the oil import control program, was merged into the Office of Oil and Gas on October 22, 1971 .
Petroleum Administration for Defense
U.S. mobilization for the Korean War occurred under the Defense Production Act which was enacted in September 1950 and which still exists in amended form. The Petroleum Administration for Defense (PAD) was established in October, the Secretary of the Interior being its Administrator. A Deputy Administrator was appointed, and an organizational pattern similar to that of the World War II organization was adopted. Industry experts recruited for the agency staff were, in the first recruitment, largely individuals who had served in similar positions in PAW and who had been active in the work of the Military Petroleum Advisory Board (MPAB). There was no real delay in the mobilization. The MP AB had been working for years with the Defense Department on a mobilization exercise. Logistical considerations applicable to either a limited war, such as occurred in Korea, or to a worldwide conflict were well understood. During the fall of 1 950, the National Petroleum Council and its committees were in frequent session. The experts on the subcommittees of MP AB dropped all other activities and were in continuous session in the Office of Oil and Gas. The Office of Oil and Gas formed the first cadre of personnel for PAD. As PAD became active, the volunteer work of MP AB committeemen was absorbed, and MP AB became inactive.
By June 1952, the new PAD had attained the full size and activity needed to cope with the prob-
1 02
lems of sustaining the Korean War. Had ihe war widened, PAD was prepared for the larger problems as well, but since a world war was avoided, PAD did not expand further. After another 6 months, some of its activities were lessened and some abandoned. Then, after a further period of months, PAD was abolished, and its residual responsibilities and files were turned back to the Office of Oil and Gas.
Present Organization The cooperation between the oil industry and the
Government, which began under the pressure of World War II, has continued in the same basic pattern in the postwar years.
Pursuant to a Presidential Executive Order assigning to him emergency preparedness functions for oil and gas, the Secretary of the Interior established in 1 963 a standby organization, the Emergency Petroleum and Gas Administration (EPGA). The EPGA is designed to meet the need for an emergency organization ready and authorized in the event of a national emergency. It will coordinate and direct, to the extent necessary, the operations of the petroleum industry in mobilizing the U.S. oil and gas resources.
The EPGA is patterned after PAW of World War II and PAD of the Korean Conflict. It differs from its predecessors, however, in that it is organized and staffed on a preemergency standby basis and allows for a large degree of decentralized operations to permit an immediate and flexible industry-government response to a nuclear attack. It consists of a national headquarters, regional offices serving the 10 uniform federal regions, 9 gas group offices, and such state and local subordinate offices as may be required. The EPGA structure parallels the functional lines of the petroleum industry with staff and line units comparable to those found in a typical large vertically integrated organization.
Like PAW and PAD, the EPGA, on activation, would be an independent agency headed by a National Administrator, the Secretary of the Interior. Other positions are filled primarily by petroleum and gas industry personnel who, prior to activation, are designated members of the Petroleum and Gas Unit of the National Defense Executive Reserve.
The industry, working through the National Petroleum Council and the Emergency Advisory Committee for Natural Gas, as requested by the Department of the Interior, recommends such governmentindustry organization, procedures and policies as

would best meet the needs of a future war emergency. In 1964, the NPC examined the adequacy of the government plan of organization for an emergency and made 3 1 recommendations related to basic principles, organization structure, techniques of staffing and training, and clarification of relationships with other government departments so as to avoid conflict of authority. One of these recommendations was the preparation of detailed operating manuals covering the 20 divisions and staff offices of EPGA. This monumental task was completed by the NPC in 1967, enabling the Department of the Interior to distribute copies to key EPGA Executive Reservists and to government agencies. Included in this set of emergency operating manuals is one covering domestic refining operations.
Various other studies of a more specific technical nature, yet related to defense needs, were requested of the industry by the Department of the Interior. Studies of this type prepared by the NPC included : U.S. Energy Outlook ( 1 972) ; Capacity of Crude Oil
Gathering Systems and Deepwater Terminals ( 1970) ;
U.S. Petroleum Inventories and Storage Capacity
( 1 970) ; Skills and Occupations of People in the
United States Oil and Gas Industries ( 1969 ) ;
U.S. Petroleum and Gas Transportation Capacities
( 1 967) ; Critical Materials Requirements for Petro
leum Refining ( 1 966 ) ; Emergency Fuel Converti
bility ( 1 965) ; Civil Defense and Emergency Planning
for the Petroleum and Gas Industries ( 1964) ; Pe
troleum and Gas Industries Manpower Requirements
( 1963 ) ; and Maintenance and Chemical Require
ments for U.S. Petroleum Refineries and Natural
Gasoline Plants ( 196 1 ) . The refining segment of the industry plays a major role in cooperating with the Government to provide the technical advice, information and talent needed to meet more adequately the country's requirements whatever future emergency may arise.
Under emergencies short of war and under any domestic crisis (including a serious disruption in oil flow), the Office of Oil and Gas would implement and carry out any extraordinary measures relating to petroleum. If necessary, the Office of Oil and Gas would call on the Foreign Petroleum Supply Committee (FPSC) and the Petroleum Security Subcommittee. It would also coordinate with the National Fuel Board under the Office of Emergency Preparedness, the International Industry Advisory Body of the Organization of Economic Cooperation and Development, and NATO if the dis-
ruption was sufficiently severe that NATO decided to become involved. The FPSC consists of 2 1 petroleum companies and is called upon when necessary to help formulate and implement a specific "Plan of Action," responsive to the specific emergency. The Petroleum Security Subcommittee of FPSC has about 30 members selected and appointed on the basis of their individual ability. This subcommittee undertakes the preparation of classified studies which serve as the basis for oil and gas supply programs, including manpower and materials, if necessary. The Plan of Action and the Emergency Petroleum Supply Committee jointly created and implemented by industry and the Government in 1 967 are still in standby readiness. The authority for this type of action is the Defense Production Act and the Voluntary Agreement between the Federal Government and the participating companies.
The oil industry also has continued to offer its services to the Defense Department. The quality of petroleum products required by the military services has gone up each year, and it is still going up. These improvements have been achieved by informal cooperation between industry technical experts and their military counterparts. This cooperation has made it possible to achieve a balance between the quality desired and the ability of the industry to meet these higher standards at a reasonable cost. It is worthy of note that the petroleum industry is unique among the important suppliers of military requirements in that the research and development work necessary to meet military needs has been carried out almost entirely by the oil industry at its own expense. The major portion of this burden has been borne by the larger companies which have the research and the technical personnel necessary to develop the sophisticated products required by the military services. However, the smaller refiners have participated to a large extent, and many of them have become important suppliers of jet fuel. There are a number of smaller refiners which have been able to make an important contribution to the Defense Program in the development of certain specialty items, particularly lubricating oil. One of the smaller refiners today is the principal supplier of reference fuel which is used by the military services and by aircraft engine builders.
Safety and Health Regulations
Until recently, government regulation of indus-
1 03

trial safety historically has been a function of the state governments. The Federal Government had no general authority over industrial safety except in industries such as railroads and airlines which are engaged in interstate transportation.
The Federal Government, using its power in its capacity as a buyer, established safety regulations through the Walsh Healy Act effective May 20, 1969. Standards were based on the many safety codes, called consensus standards, which were prepared by experts in their particular field and which were already widely accepted in the industry (such as those published by the National Fire Protection Association, the American Standards Association, the American Petroleum Institute, the National Board of Boiler and Pressure Vessel Inspectors). The primary penalty connected with failure to meet these standards was the withdrawal of federal contracts or business from the offending company. The Walsh Healey enforcement organization monitored some of the many contractors and companies involved and found that the Act appeared to have little impact on industrial safety.
The Occupational Safety and Health Act of 1970 went into effect April 28, 1971 , for 57 million wage earners in establishments affecting interstate commerce. This Act empowers the Secretary of Labor to set safety and health standards for affected businesses and industries ; to conduct investigations to determine if employers have complied with these standards ; and, if violations are found, to issue citations to employers specifying the violations and giving them a reasonable time period to correct them and to impose penalties.
A strongly decentralized enforcement organization was established under the Department of Labor based on 10 regional headquarters and 46 areas. A cadre of compliance officers was recruited and trained early in 1 97 1 . Industrial hygienists from the Department of Health, Education and Welfare's newly formed division of National Institute of Occupational Safety and Health (NIOSH) are used to survey health hazards as well as to set up criteria for new health standards.
Construction standards were established on April 17, 1971 , and general occupational safety and health regulations largely based on consensus standards were published on May 29, 197 1 . In addition to these standards, a general duty clause requires that "each employer shall furnish to each of his employees employment and a place of employment which are
1 04
free from recognized hazards that are causing or are likely to cause death or serious physical harm to his employees." Fines are imposed for failure to meet these standards. Imprisonment can result if an employee is fatally injured as a result of a repeated violation.
The law requires that "each employee shall comply with occupational safety and health standards and all rules, regulations, and orders issued pursuant to this Act which are applicable to his own action and conduct." However, there are no provisions under the Act to fine or punish the employee for failure to comply, leaving it up to the employer to exercise discipline to enforce compliance.
Petroleum refining with its good safety record and with its historical general conformance with the consensus standards has had little difficulty in meeting these initial consensus standards. *
To achieve objective standards for environmental health, seven Commandments were set up by the Chairman of the Threshold Limits Committee of the American Conference of Government Industrial Hygienists (ACGIH) . The first four are pertinent to refinery operations and are as follows :
• Standards must be based on scientific facts. • All standards, guides, limits and so on, as well
as the criteria on which they are based, must be completely documented.
• A void the establishment of unnecessarily severe standards.
• Determine realistic levels.
The law provides for the Department of Labor to turn administration and enforcement of health and safety regulations back to the states when they have demonstrated that they have an effective plan and organization. This could, however, cause a problem for companies operating in more than one state in administering operations with differing standards unless a reasonable conformity of standards results.
Environmental Conservation No single item has had the broad effect on all of
the petroleum industry operation that pollution/ conservation has had since the combined joint industry effort in responding to the expanded demand for petroleum products during World War II. At certain points in time, society reaches an expressed or implied consensus as to the values it wishes to maximize or the goals it wishes to achieve. Similar to
* See Figure 12, Chapter Four.
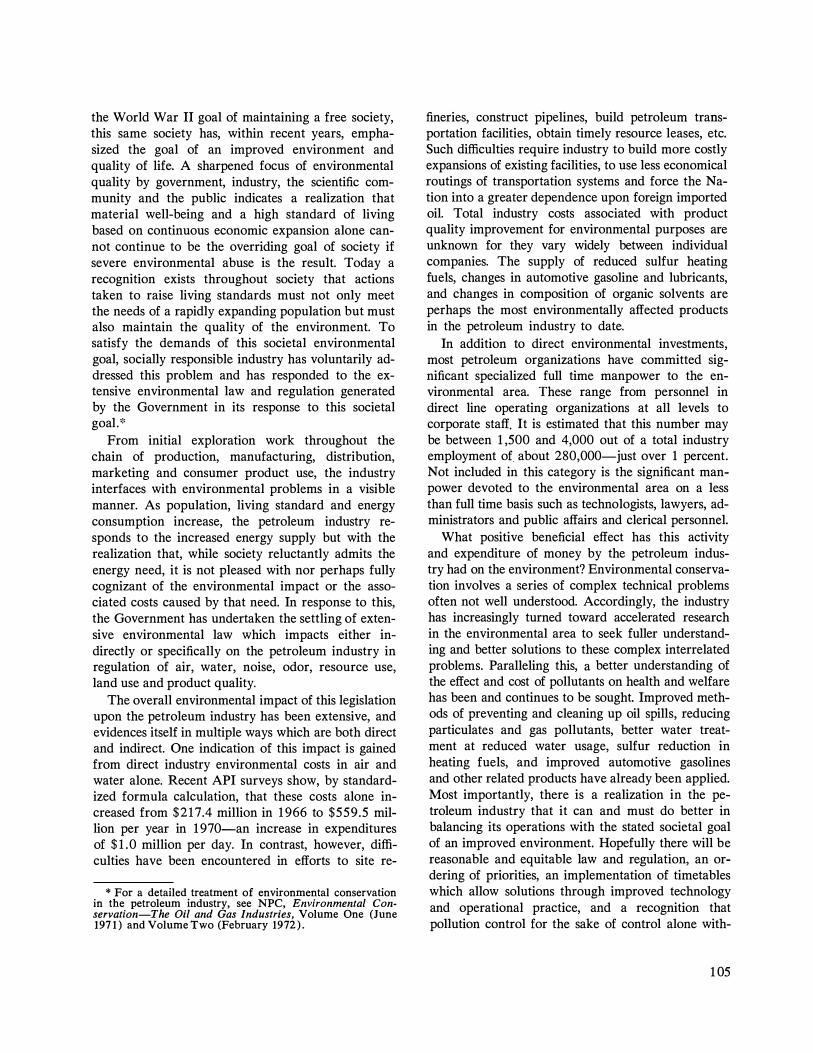
the World War II goal of maintaining a free society, this same society has, within recent years, emphasized the goal of an improved environment and quality of life. A sharpened focus of environmental quality by government, industry, the scientific community and the public indicates a realization that material well-being and a high standard of living based on continuous economic expansion alone cannot continue to be the overriding goal of society if severe environmental abuse is the result. Today a recognition exists throughout society that actions taken to raise living standards must not only meet the needs of a rapidly expanding population but must also maintain the quality of the environment. To satisfy the demands of this societal environmental goal, socially responsible industry has voluntarily addressed this problem and has responded to the extensive environmental law and regulation generated by the Government in its response to this societal goal.*
From initial exploration work throughout the chain of production, manufacturing, distribution, marketing and consumer product use, the industry interfaces with environmental problems in a visible manner. As population, living standard and energy consumption increase, the petroleum industry responds to the increased energy supply but with the realization that, while society reluctantly admits the energy need, it is not pleased with nor perhaps fully cognizant of the environmental impact or the associated costs caused by that need. In response to this, the Government has undertaken the settling of extensive environmental law which impacts either indirectly or specifically on the petroleum industry in regulation of air, water, noise, odor, resource use, land use and product quality.
The overall environmental impact of this legislation upon the petroleum industry has been extensive, and evidences itself in multiple ways which are both direct and indirect. One indication of this impact is gained from direct industry environmental costs in air and water alone. Recent API surveys show, by standardized formula calculation, that these costs alone increased from $217.4 million in 1 966 to $559.5 million per year in 1 970-an increase in expenditures of $ 1 .0 million per day. In contrast, however, difficulties have been encountered in efforts to site re-
* For a detailed treatment of environmental conservation in the petroleum industry, see NPC, Environmental Conservation-The Oil and Gas Industries, Volume One (June 197 1 ) and Volume Two (February 1972 ) .
fineries, construct pipelines, build petroleum transportation facilities, obtain timely resource leases, etc. Such difficulties require industry to build more costly expansions of existing facilities, to use less economical routings of transportation systems and force the Nation into a greater dependence upon foreign imported oil. Total industry costs associated with product quality improvement for environmental purposes are unknown for they vary widely between individual companies. The supply of reduced sulfur heating fuels, changes in automotive gasoline and lubricants, and changes in composition of organic solvents are perhaps the most environmentally affected products in the petroleum industry to date.
In addition to direct environmental investments, most petroleum organizations have committed significant specialized full time manpower to the environmental area. These range from personnel in direct line operating organizations at all levels to corporate staff. It is estimated that this number may be between 1 ,500 and 4,000 out of a total industry employment of about 280,000-just over 1 percent. Not included in this category is the significant manpower devoted to the environmental area on a less than full time basis such as technologists, lawyers, administrators and public affairs and clerical personnel.
What positive beneficial effect has this activity and expenditure of money by the petroleum industry had on the environment? Environmental conservation involves a series of complex technical problems often not well understood. Accordingly, the industry has increasingly turned toward accelerated research in the environmental area to seek fuller understanding and better solutions to these complex interrelated problems. Paralleling this, a better understanding of the effect and cost of pollutants on health and welfare has been and continues to be sought. Improved methods of preventing and cleaning up oil spills, reducing particulates and gas pollutants, better water treatment at reduced water usage, sulfur reduction in heating fuels, and improved automotive gasolines and other related products have already been applied. Most importantly, there is a realization in the petroleum industry that it can and must do better in balancing its operations with the stated societal goal of an improved environment. Hopefully there will be reasonable and equitable law and regulation, an ordering of priorities, an implementation of timetables which allow solutions through improved technology and operational practice, and a recognition that pollution control for the sake of control alone with-
1 05

out associated demonstrable benefits may, in the long run, be too costly for even all of society to bear.
Major Environmental Legislation Affecting the Petroleum Industry
In nearly all cases, federal law now forms the cornerstone of regulatory activity governing the petroleum industry's environmental activity. Much of the current federal law is implemented directly through state responsibility subject to checks, balances and approvals by federal agencies.
Historically, it is interesting to note that early pollution control legislation primarily left the states or other local bodies responsible for deciding what pollution standards were to be achieved and on what time schedule. While this drew attention to the problems of pollution, it created many different approaches towards solving these problems and resulted in non-uniformity and time delay. More recently, the Federal Government has recaptured the pollution control initiative by new and amended federal legislation which provides the Federal Government with the responsibility of criteria, standard and goal setting and the states with the responsibility of implementation of these requirements.
All of the present or proposed environmental legislation related to the petroleum industry does not have equal impact upon each segment of the industry. However, the refining and/or manufacturing activity seems to be directly affected by the legislation in a formidable manner. The major pollution control legislative measures are summarized in the following sections.
Air Legislation
The Clean Air Amendments of 1 970 is now the foundation for federal programs to improve the quality of the Nation's air. It aims at ambitious goals, contains far-reaching provisions, imposes stringent control requirements and decrees tight timetables. It alters significantly the strategy, tactics and severity of prior air pollution control programs and practices. These changes are affecting, sequentially, state governments, state and local regulatory agencies, industry, commerce and, ultimately, personal patterns of life.
The Clean Air Amendments of 1970 reaffirms the historical concept of state implementation and enforcement of air pollution control programs. It injects, however, the features of federal preemption of motor vehicle emission regulation and federal review
106
of state air pollution control programs. Federal approval will be granted only if certain prescribed conditions and requirements are met. Federal interv:ention and supervision of state programs is authorized if these requirements are not met.
The Clean Air Amendments of 1970 was signed into law by President Nixon on December 3 1 , 1970. Less than a month earlier, on December 2, 1970, EPA had been created as a result of the President's plan to reorganize federal environmental agencies. These two actions have reshaped this Nation's efforts to improve air quality, and they are presently beginning to exert influences on every segment of society.
The Clean Air Amendments of 1970 is often considered to be separate and apart from other environmental legislation. In fact, however, it is the fourth of a series of amendments to the original federal air pollution control law, the Clean Air Act of 1963.
The Clean Air Act of 1963 was the first important federal legislation in the field of air pollution and air conservation. Although at that time the nature, extent and urgency of the problem were highly uncertain, the Federal Government, by enacting this legislation, acknowledged that the problem existed and promulgated a public policy to protect and enhance the quality of the Nation's air resources. The Clean Air Act of 1963 established a federal program for research and development, provided for technical and financial assistance to the states, and instituted administrational procedures. It also set the theme for state implementation and enforcement of air pollution control and abatement programs.
This basic legislation was amended, broadened and strengthened by subsequent enactment of the Motor Vehicle Air Pollution Control Act of 1 965, the Clean Air Act Amendments of 1966, the Air Quality Act of 1967, and most recently the Clean Air Amendments of 1970.
If one follows the evolution of these four amendments, numerous trends and changes in governmental philosophy, strategy and tactics are apparent. Some of the more important are-
• Increasing knowledge and awareness of the nature, sources, extent and effects of air pollution
• The shift in emphasis from protection of property rights to protection of public health and welfare
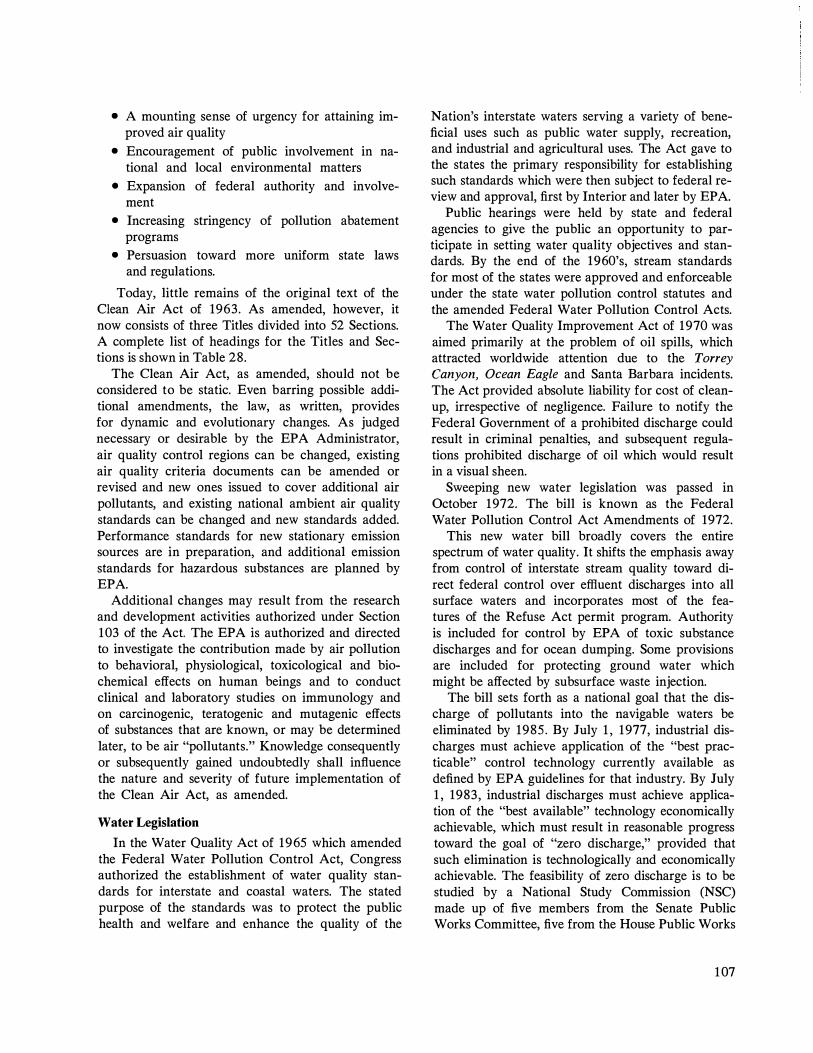
• A mounting sense of urgency for attaining improved air quality
• Encouragement of public involvement in national and local environmental matters
• Expansion of federal authority and involvement
• Increasing stringency of pollution abatement programs
• Persuasion toward more uniform state laws and regulations.
Today, little remains of the original text of the Clean Air Act of 1963. As amended, however, it now consists of three Titles divided into 52 Sections. A complete list of headings for the Titles and Sections is shown in Table 28.
The Clean Air Act, as amended, should not be considered to be static. Even barring possible additional amendments, the law, as written, provides for dynamic and evolutionary changes. As judged necessary or desirable by the EPA Administrator, air quality control regions can be changed, existing air quality criteria documents can be amended or revised and new ones issued to cover additional air pollutants, and existing national ambient air quality standards can be changed and new standards added. Performance standards for new stationary emission sources are in preparation, and additional emission standards for hazardous substances are planned by EPA.
Additional changes may result from the research and development activities authorized under Section 103 of the Act. The EPA is authorized and directed to investigate the contribution made by air pollution to behavioral, physiological, toxicological and biochemical effects on human beings and to conduct clinical and laboratory studies on immunology and on carcinogenic, teratogenic and mutagenic effects of substances that are known, or may be determined later, to be air "pollutants." Knowledge consequently or subsequently gained undoubtedly shall influence the nature and severity of future implementation of the Clean Air Act, as amended.
Water Legislation
In the Water Quality Act of 1965 which amended the Federal Water Pollution Control Act, Congress authorized the establishment of water quality standards for interstate and coastal waters. The stated purpose of the standards was to protect the public health and welfare and enhance the quality of the
Nation's interstate waters serving a variety of beneficial uses such as public water supply, recreation, and industrial and agricultural uses. The Act gave to the states the primary responsibility for establishing such standards which were then subject to federal review and approval, first by Interior and later by EPA.
Public hearings were held by state and federal agencies to give the public an opportunity to participate in setting water quality objectives and standards. By the end of the 1960's, stream standards for most of the states were approved and enforceable under the state water pollution control statutes and the amended Federal Water Pollution Control Acts.
The Water Quality Improvement Act of 1970 was aimed primarily at the problem of oil spills, which attracted worldwide attention due to the Torrey
Canyon, Ocean Eagle and Santa Barbara incidents. The Act provided absolute liability for cost of cleanup, irrespective of negligence. Failure to notify the Federal Government of a prohibited discharge could result in criminal penalties, and subsequent regulations prohibited discharge of oil which would result in a visual sheen.
Sweeping new water legislation was passed in October 1972. The bill is known as the Federal Water Pollution Control Act Amendments of 1972.
This new water bill broadly covers the entire spectrum of water quality. It shifts the emphasis away from control of interstate stream quality toward direct federal control over effluent discharges into all surface waters and incorporates most of the features of the Refuse Act permit program. Authority is included for control by EPA of toxic substance discharges and for ocean dumping. Some provisions are included for protecting ground water which might be affected by subsurface waste injection.
The bill sets forth as a national goal that the discharge of pollutants into the navigable waters be eliminated by 1985. By July 1 , 1977, industrial discharges must achieve application of the "best practicable" control technology currently available as defined by EPA guidelines for that industry. By July 1 , 1983, industrial discharges must achieve application of the "best available" technology economically achievable, which must result in reasonable progress toward the goal of "zero discharge," provided that such elimination is technologically and economically achievable. The feasibility of zero discharge is to be studied by a National Study Commission (NSC) made up of five members from the Senate Public Works Committee, five from the House Public Works
1 07
TABLE 28
TITLES AND SECTIONS OF
THE CLEAN AIR ACT OF 1 963 AS AMENDED
TITLE l-AIR POLLUTI ON PREVENTION AND CONTROL
Section 1 01 "Findi ngs and Purposes" Section 1 02 "Cooperative Activities and Uni
form Laws" Section 1 03 "Research, I nvestigation, Training,
and Other Activities" Section 1 04 "Research Relating to Fuels and
Vehicles" Section 1 05 "Grants for Support of Air Pol lution
P lanning and Control Programs" Section 1 06 "Interstate Air Qual ity Agencies or
Comm issions" Section 1 07 "Ai r Qual ity Control Regions" Section 1 08 "Ai r Qual ity Criteria and Control
Techniques" Section 1 09 "National Ambient Air Qual ity Stan
dards" Section 1 1 0 " I mplementation Plans" Section 1 1 1 "Standards of Performance for New
Stationary Sources" Section 1 1 2 "National Emission Standards for
Hazardous Air Pollutants" Section 1 1 3 "Federal Enforcement" Section 1 1 4 " Inspections, Monitoring, and Entry" Section 1 1 5 "Abatement by Means of Confer-
ence Procedure i n Certain Cases" Section 1 1 6 "Retention of State Authority" Section 1 1 7 "President's Air Qual ity Advisory
Board and Advisory Committees" Section 1 1 8 "Control of Pollution From Federal
Faci lit ies"
TITLE I I-EM ISSION STANDARDS FOR MOVING SOURCES
Section 201 "National Emission Standards Act"
Part A-Motor Vehicle Emission And Fuel Standards
Section 202 "Establ ishment of Standards"
Committee, and five members of the public appointed by the President.
The full impact of the new water bill will not be known until regulations are promulgated implementing its provisions, effluent guidelines are issued, and the NSC report has been completed.
Noise and Odor
Other than that part of the Walsh Healey Act which concerns the control of noise levels for occupational workers health, noise and odor from an
1 08
Section 203 "Prohibited Acts" Section 204 "I njunction Proceedings" Section 205 "Penalties" Section 206 "Motor Vehicle and Motor Vehicle
Engine Compliance Testing and Certification" Section 207 "Compl iance by Vehicles and En-
g ines in Actual Use" Section 208 "Records and Reports" Section 209 "State Standards" Section 21 0 "State Grants" Section 21 1 "Regulation of Fuels" Section 21 2 "Development of Low-Emission Ve-
h icles" Section 21 3 "Definitions for Part A"
Part 8-Aircraft Emission Standards Section 231 "Establ ishment of Standards" Section 232 "Enforcement of Standards" Section 233 "State Standards and Controls" Section 234 "Definitions"
TITLE I l l-GEN ERAL Section 301 "Administration" Section 302 "Definitions" Section 303 "Emergency Powers" Section 304 "Citizen Su its" Section 305 "Appearance" Section 306 "Federal Procurement" Section 307 "General Provision Relating to Ad-
ministrative Proceedings and Judicial Review" Section 308 "Mandatory Licensing" Section 309 "Policy Review" Section 31 0 "Other Authority Not Affected" Section 31 1 "Records and Aud it" Section 31 2 "Comprehensive Economic Cost
Studies" Section 31 3 "Additional Reports to Congress" Section 31 4 "Labor Standards" Section 31 5 "Separabi l ity" Section 31 6 "Appropriations" Section 31 7 "Savings Provisions"
environmental standpoint have in the past been controlled largely by local nuisance ordinances. The Clean Air Amendments of 1970, Title IV, required that a study and report to Congress be made on noise. While the Report to Congress was completed December 3 1 , 1971, no federal environmental noise legislation has yet emerged. That legislation which has been proposed to date would require federal agencies to establish noise emission standards for construction and transportation equipment, motors and engines, and for electric and electronic equipment.
A number of states and municipalities have set legal limits on noise, and many have recommendations on noise abatement. For example, New Jersey has enacted enabling legislation giving broad power to the State Department of Environmental Protection to adopt comprehensive noise regulations, and other localities are considering regulations under existing legislation to define acceptable maximum noise levels to be permitted for various land use categories.
Odor regulations are now emerging at local levels in several geographical areas. Many are based upon the receipt of a given number of complaints, but the San Francisco Bay Area Pollution Control District has recently proposed regulations specifying monitoring of emissions of specific compounds at ground level at the property line with maximum permissible levels being set at the odor threshold level, an exceptionally low level for a gas to be considered either an odor pollutant or a nuisance.
Resource aud Laud Use
While many federal and local laws govern resource and land use, the most significant recent federal legislation affecting these items is the National Environmental Policy Act of 1 969. This legislation created the Council on Environmental Quality and declared a national policy to encourage productive and enjoyable harmony between man and his environment ' to promote efforts to prevent or eliminate damage to the environment and biosphere and stimulate the health and welfare of man, and to enrich the Nation's understanding of ecological systems and natural resources. Under this legislation, a requirement is set forth that on each major federal action an environmental impact statement be made which is to include adverse environmental effects, alternatives to proved action, the relationship between short-term uses of man's environment and the maintenance and
enhancements of long-range productivity, and any irreversible or irretrievable commitments of resources. To date, the National Environmental Policy Act of 1969 has been copied by many states and used extensively in areas of siting of manufacturing facilities, location of pipelines and leasing of tracts for petroleum exploration and production.
Product Quality
With one exception most law affecting product quality has been set by local government or has been imposed indirectly by the Clean Air Amendments of 1 970. In their attempt to reduce sulfur oxides local areas have specified maximum sulfur contents of heating fuels. Approaches have been different with varying timetables making it difficult to maintain information on the current status of each of these regulations. The most recent comprehensive tabulation is given in an API publication and is reproduced as Appendix 3 . * The indirect law imposition on product quality has resulted from requirements set forth in the Federal Clean Air Amendments of 1970 which require states to meet national ambient air quality standards. In doing so, states may impose requirements which limit emissions during manufacturing processes and govern quality of fuel burned during such manufacturing processes.
One area of product quality control which does not come under local jurisdiction pertains to fuels used in motor vehicles. While federal control of vehicles emissions preempted state control under the Motor Vehicle Air Pollution Control Act of 1965 the Clean Air Amendments of 1970 provided fo; the option of federal control of fuels and additives used in such equipment. Under this provision motor fuel additives must be registered.
* API, Committee on Environmental Affairs; Fuel Sulfur Regulations-Federal, State, and Local (February 1973 ) .
1 09

Appendices

Appendix 1
Dear Mr. True:
United States Department of the Interior
Office of the Secretary
Washington, D.C. 20240
February 9, 1972
The increasing dependency of this Nation on imported supplies of petroleum, both crude and refined products, the sources of which vary considerably in reliability, is a cause for serious concern. At the same time the United States appears to be increasing its dependence on refining facilities and capabilities located outside this country. This growing proportion of foreign manufactured petroleum products which are necessary for the economic well-being and security of this Nation is also a matter of increasing concern.
I therefore request that the Council undertake, as a matter of urgency, a survey of the factors-economic, governmental, technological and environmental-which may affect the domestic refining industry's ability to respond to the demands for essential petroleum products that are made upon it. The Council should discuss those elements which are deemed essential to a healthy domestic refining industry. To the extent that petroleum belonging to other phases of petroleum supply and consumption impinge upon growth and technological capabilities of the refining segments, these should be included in the analysis.
Representatives of the Department of the Interior will consult with you in the near future to arrive at a detailed outline of the matters relative to this general request.
Mr. H. A. True, Jr. Acting Chairman National Petroleum Council 1 625 K Street, N.W. Washington, D.C. 20006
Sincerely yours,
/s/ HOLLIS M. DOLE Assistant Secretary of the Interior
1 13

Appendix 2
National Petroleum Council Committee on
Factors Affecting U.S. Petroleum Refining
Cochairman
Stephen A. Wakefield Assistant Secretary for Energy and Minerals U.S. Department of the Interior
Ex Officio
H. A. True, Jr. Partner True Oil Company
Robert 0. Anderson Chairman of the Board Atlantic Richfield Company
H. Bridges, President Shell Oil Company
Edward M. Carey, President New England Petroleum Corporation
I. H. Dawes, Director Clark Oil & Refining Corporation
Cortlandt S. Dietler, President Western Crude Oil, Inc.
J. C. Donnell II Chairman of the Board Marathon Oil Company
Chairman
Orin E. Atkins Chairman of the Board
Ashland Oil, Inc.
* *
Secretary
Vincent M. Brown Executive Director National Petroleum Council
Ex Officio
Robert G. Dunlop Chairman of the Board Sun Oil Company
*
B. R. Dorsey Chairman of the Board Gulf Oil Corporation
Charles W. Else, President Independent Refiners Association
of America
James W. Emison, Partner Oskey Gasoline & Oil Company, Inc.
Ernest B. Miller, Jr.*
Executive Vice President Getty Oil Company
Maurice F. Granville Chairman of the Board Texaco Inc.
* Replaces George F. Getty II (deceased June 6, 1973 ) .
1 15

Robert C. Gunness, President Standard Oil Company (Indiana)
Fred L. Hartley, President Union Oil Company of California
Leon Hess Chairman of the Board Amerada Hess Corporation
A. V. Hoffman, President National Petroleum Refiners Assn.
Herbert C. Johnson Chairman of the Board Consolidated Natural Gas Company
John A. Kaneb, President Northeast Petroleum Industries, Inc.
W. W. Keeler, Director Phillips Petroleum Company
C. B. McCoy Chairman of the Board and President E. I. du Pont de Nemours & Company, Inc.
Randall Meyer, President Exxon Company, U.S.A.
0. N. Miller Chairman of the Board Standard Oil Company of California
Henry A. Rosenberg, Jr., President Crown Central Petroleum Corporation
Robert V. Sellers Chairman of the Board Cities Service Company
Chas. E. Spahr Chairman of the Board The Standard Oil Company (Ohio)
Coordinating Subcommittee of the National Petroleum Council's
Committee on Factors Affecting U.S. Petroleum Refining
Chairman
George Holzman General Manager, Refineries Shell Oil Company
Assistant to the Chairman
Leonard A. Goldstein Manager, Special Projects Manufacturing Operations Department Shell Oil Company
Charles Barre Vice President, Refining Marathon Oil Company
George Bishop Vice President, Manufacturing Phillips Petroleum Company
Dr. Edgar N. Brightbill Assistant Director Purchasing Department E. I. du Pont de Nemours & Company, Inc.
Fred Dennstedt Vice President, Refining Exxon Company, U.S.A.
1 16
* *
Cochairman
Stephen A. Wakefield Assistant Secretary for Energy
and Minerals U.S. Department of the Interior
Secretary
Andrew A vramides Deputy Director National Petroleum Council
*
Cortlandt S. Dietler, President Western Crude Oil, Inc.
James W. Emison, Partner Oskey Gasoline & Oil Company, Inc.
Howard M. Joiner Vice President Supplemental Supplies Consolidated Gas Supply Corp.
A. W. Kusch, Vice President Manufacturing, Research and Engineering Atlantic Richfield Company

R. C. McCay Assistant to the President Texaco Inc.
Edward N. Marsh, Vice President Research and Engineering The Standard Oil Company (Ohio)
W. E. Perrine Executive Assistant to the President Ashland Oil, Inc.
John H. Rabbitt, Manager Industry Affairs Corporate Development Sun Oil Company
Facilities and Technology Task Group of the National Petroleum Council's
Committee on Factors Affecting U.S. Petroleum Refining
Chairman
George Bishop Vice President, Manufacturing Phillips Petroleum Company
Assistant to the Chainnan
E. W. Mills, Director Operations Analysis & Economic Evaluation Phillips Petroleum Company
R. K. Arzinger Refinery Manager Getty Oil Company
L. H. Corn, Director Process Engineering Gulf Oil Corporation
P. R. Coronado Operations Manager, Refining Division Marathon Oil Company
J. A. Graves Assistant Manager Supply Department Exxon Company, U.S.A.
* *
Cochairman
Eugene L. Peer Industrial Specialist-Refining U.S. Office of Oil and Gas Department of the Interior
Secretary
Marshall W. Nichols Economics Coordinator National Petroleum Council
*
David P. Handke, Manager Engineering Services The Standard Oil Company (Ohio)
A. S. Lehmann, General Manager Research Organization & Facilities Shell Development Company
Richard Nelson, Manager Planning and Economics Clark Oil & Refining Corporation
Charles M. Russell, Jr. Manager, Planning and Analysis Ashland Oil, Inc.
Economic and Environmental Task Group
of the National Petroleum Council's
Committee on Factors Affecting U.S. Petroleum Refining
Chairman
W. E. Perrine Executive Assistant to the President Ashland Oil, Inc.
Assistant to the Chainnan
Kenneth G. Brown Chappaqua, New York
1 17
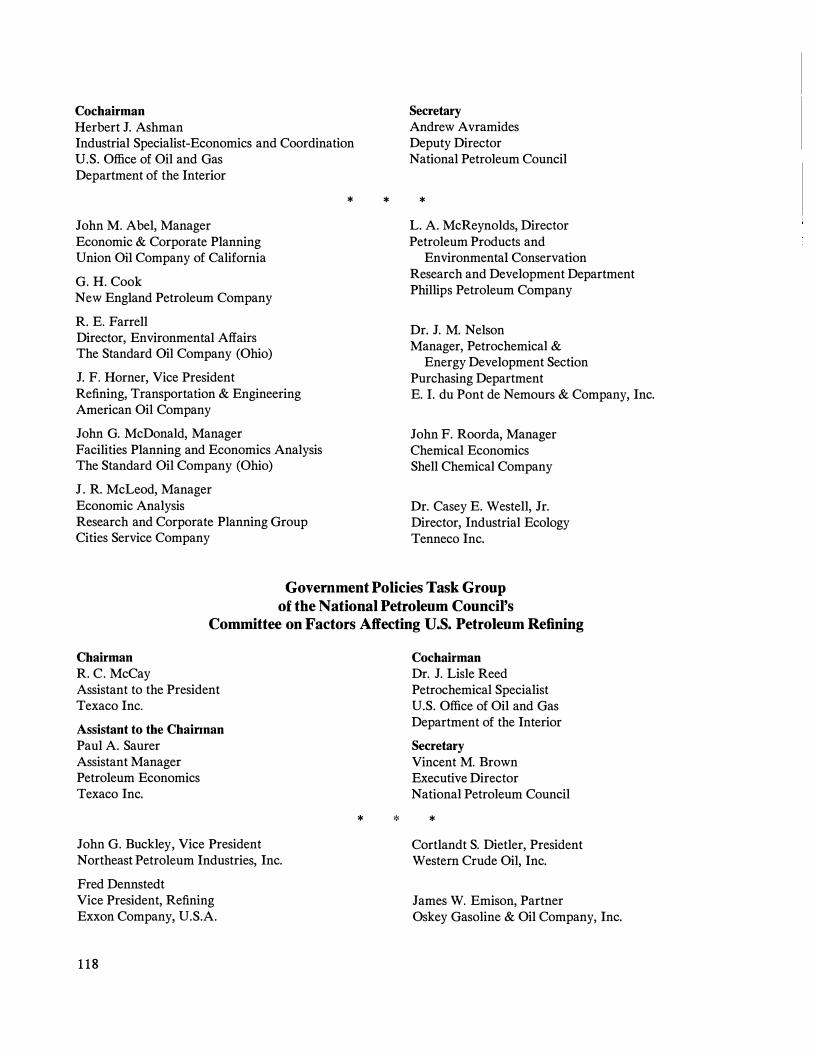
Cochairman
Herbert J. Ashman Industrial Specialist-Economics and Coordination U.S. Office of Oil and Gas Department of the Interior
John M. Abel, Manager Economic & Corporate Planning Union Oil Company of California
G. H. Cook New England Petroleum Company
R. E. Farrell Director, Environmental Affairs The Standard Oil Company (Ohio)
J. F. Horner, Vice President Refining, Transportation & Engineering American Oil Company
John G. McDonald, Manager Facilities Planning and Economics Analysis The Standard Oil Company (Ohio)
J . R. McLeod, Manager Economic Analysis Research and Corporate Planning Group Cities Service Company
* *
Secretary Andrew A vramides Deputy Director National Petroleum Council
*
L. A. McReynolds, Director Petroleum Products and
Environmental Conservation Research and Development Department Phillips Petroleum Company
Dr. J. M. Nelson Manager, Petrochemical &
Energy Development Section Purchasing Department E. I. du Pont de Nemours & Company, Inc.
John F. Roorda, Manager Chemical Economics Shell Chemical Company
Dr. Casey E. Westell, Jr. Director, Industrial Ecology Tenneco Inc.
Government Policies Task Group
of the National Petroleum Council's Committee on Factors Affecting U.S. Petroleum Refining
Chairman
R. C. McCay Assistant to the President Texaco Inc.
Assistant to the Chainnan
Paul A. Saurer Assistant Manager Petroleum Economics Texaco Inc.
John G. Buckley, Vice President Northeast Petroleum Industries, Inc.
Fred Dennstedt Vice President, Refining Exxon Company, U.S.A.
1 1 8
* *
Cochairman Dr. J. Lisle Reed Petrochemical Specialist U.S. Office of Oil and Gas Department of the Interior
Secretary
Vincent M. Brown Executive Director National Petroleum Council
*
Cortlandt S. Dietler, President Western Crude Oil, Inc.
James W. Emison, Partner Oskey Gasoline & Oil Company, Inc.

Howard M. Joiner Vice President Supplemental Supplies Consolidated Gas Supply Corporation
Donald C. O'Hara Executive Vice President National Petroleum Refiners Assn.
N. G. Payne Director of Import Supplies Western Hemisphere Petroleum Div. Continental Oil Company
John Savoy Economics and Industry Affairs Sun Oil Company
J. J. Simmons III Vice President Amerada Hess Corporation
S. E. Watterson, Jr. Assistant Manager Economics Department Standard Oil Company of California
Harry D. Williams Washington Counsel Ashland Oil, Inc.
1 19

Appendix 3
Federal, State and Local Fuel Sulfur Regulations *
State
Alabama
Alaska
Arizona
Arkansas
California
Sulfur Fuel Limit Effective
Portion of State Type Fuel Use (Wt. % ) Date
All Oi l New and Modified 1 .1 1 t 1 -1 8-72 Coal New and Modified 0.72t 1 -1 8-72
Class 1 Cou nties Oi l Existing 1 .1 1 t 1 -1 8-72 (Urban Areas) Coal Existing 0.72t 1 -1 8-72
Class 2 Counties on Existing 1 .39t 1 -1 8-72 (Rural Areas) Coal Existing 0.90t 1 -1 8-72 Note: 24 of 67 counties in Alabama have been designated Class 1 counties.
All Oi l Al l 1 .00§ 5-26-72 Coal Al l 0.85 \ \ 5-26-72
Al l
The only regulations adopted by the state require that ground-level S02 concentrations do not exceed the ambient air quality standards.
All
The only regulations adopted by the state require that ground-level so. concentrations do not exceed the ambient air quality standards.
Imperi al County Al l Al l 0.50 1 0-1 8-71
Lassen County Al l Al l 0.50 1 0- 1 -71
Los Angeles County Al l Al l 0.80 1 - 1 -65 0.50 1 - 1 -68
Monterey & Santa Cruz Counties Al l A l l 0.50 7- 1 -69
Orange County Al l Al l 0.50 1 2-23-69 Riverside County Al l A l l 0.50 5- 1 -70
San Benito County Al l Al l 0.50 7-1 9-71
San Bernardino County Al l A l l 0.50 1 1 -1 7-70
San Diego Al l A l l 0.50 7- 1 -71
*API, Committee on Environmental Affairs, Fuel Sulfur Regulations-Federal, State and Local (February 1 973).
121

Sulfur Fuel Limit Effective
State Portion of State Type Fuel Use (Wt. o/o ) Date
San Francisco Bay Area O i l A l l 0.60§ 1 1 - 5-71 Basin (Alameda, Contra Coal Al l 0.51 1 1 1 1 - 5-71 Costa, Marin, Napa, San F rancisco, San Mateo, Santa Clara, and portions of Solano & Sonoma Counties) San Luis Obispo County Al l Al l 0.50 5-26-71 Santa Barbara County Al l A l l 0.50 1 0-1 8-71 Tehema County Al l Al l 0.50 8-1 0-71 Ventura County Al l A l l 0.50 6- 1 -72
Colorado Al l O i l A l l 1 .00§ 2- 1 -72 Coal Al l 0.85 1 1 2- 1 -72
Note: Large fuel burning sources are l im ited to a maxi mum S02 emission of 5 tons per day. The 5-ton per day l imit does not apply if fuel sulfur levels are less than 0.30 wt. % § for oil or 0.25 wt. % I I for coal. Sources existing prior to 2-1-72 need not meet the 0.30 wt. % l imit for oil until 1 -1 -75.
Connecticut Al l Al l Al l 1 .00 9- 1 -71 0.50 9- 1 -72
Note: The Clean Air Commission wil l allow use of fuel with sulfur contents in excess of 0.50 wt. % unti l 4-1-73. Fuel supplier, however, cannot sell fuel with sulfur contents In excess of 0.50 wt. % after 9-1-72.
Delaware Al l Dis- Al l 0.30 1 - 1 -72 ti l l ate
New Castle County Al l < 500 M BTU/ hr. 1 .0 1 - 1 -72 >500 M BTU/ hr.
North of US 40 1 .0 1 - 1 -72 South of US 40 3.5 1 - 1 -72
Al l Al l 1 .0 1 - 1 -73
District of Al l Al l A l l 1 .0 7- 1 -69 Col umbia 0.5 7- 1 -75
Florida All O i l > 250 M BTU/ h r. , New 0.74t 1-1 8-72 Exist ing 1 .02t 7- 1 -75
Coal > 250 M BTU/ h r. , New 0.72t 1 -1 8-72 Exist ing 0.90t 7- 1 -75
Dade County (Miami) Al l Al l 1 .00 1 - 1 -70 Duval County Al l A l l 2.00 1 0- 1 -68 (Jacksonvi l le)
1 .50 1- 1 -69 1 .00 1 - 1 -70
Manatee County Oi l Al l 2.0 1 2- 3-68 0.20 1- 1 -70
Sarasota County Al l Al l 0.50 1 - 1 -69 0.20 1 - 1 -70
Note: Large fuel burning sources are l i mited by a maxi mum allowable S02 emission level ex-pressed in pounds per hour. The allowable level varies with size and l ocation of the facility and with stack height.
122

Sulfur Fuel Limit Effective
State Portion of State Type Fuel Use (Wt. % ) Date
Georgia A l l Al l < 1 00 M BTU/ h r. 2.50 3-1 3-72 > 1 00 M BTU/ hr. 3.00 3-1 3-72
Hawai i Al l Al l Util ities 1 .50 8- 1 -68 0.50 1 0- 1 -69
Idaho All No. 1 Al l 0.30 1 - 1 -73 No. 2 Al l 0.50 1 - 1 -73 Resid . Al l 2.50 1 - 1 -73
1 .75 1 - 1 -74 Coal All 1 .00 1 - 1 -73
I l l i nois All Dist. New 0.29 * * 4-1 4-72 Existing 0.29* * 5-30-75
Resi d . New, < 250 M BTU/ h r. 0.93t 4-1 4-72 > 250 M BTU/ hr. 0.74t 4-1 4-72
Existing 0.93t 5-30-75 Coal New,
<250 M BTU/ h r. 1 .08t 4-1 4-72 > 250 M BTU/hr. 0 .72t 4-1 4-72
Chicago, St. Louis, & Coal Existing 1 .08t 5-30-75 Peoria Regions Rest of State Coal Existing 3.60t 5-30-75
1 .08t 1 2-31 -78
Ch icago & Cook County Al l Space Heating, New 1 .00 7- 1 -70 Existing 2.00 7- 1 -70
1 .25 9- 1 -71 1 .00 9- 1 -72
I ndustry 2.00 7- 1 -70 1 .50 1 1 - 1 -70 1 .00 9- 1 -72
Util ities 1 .80 7- 1 -70 1 .00 1 - 1 -72
Mel rose Park Al l Al l 1 .00 1 2- 1 3-70
I nd iana Al l Fuel sulfur reguations for Indiana are based on the following equations:
s, _ 2.22 a h, - Om 0.75 n0.25
St = 1 7.0 Om -<J.aa where s, = allowable emissions, lbs. S02 M BTU
Om = equipment capacity rating, M BTU/hr. h, = stack height, ft. n = numbe r of stacks
a = plume rise factor, 0.67 for installations less than 1 ,000 M BTU/hr.
To determine the allowable fuel sulfur emissions use the most restrictive equation.
Lower l imit - 1 .2 lbs. S02 M BTU Oi l - 1 . 1 1 wt. % S (t)
Coal - 0. 72 wt. % S (:j:)
Compliance Dates: Chicago and Indianapolis Regions 7- 1 -73 Rest of State 1 - 1 -74
123
Sulfur Fuel Limit Effective
State Portion of State Type Fuel Use (Wt. % ) Date
East Chicago Oi l Space Heating, New 1 .66t 7- 1 -71 Existing 3.33t 7- 1 -71
1 .66t 7- 1 -72 Industry & Uti l ities 2.50t 7- 1 -71
1 .66t 7- 1 -72 Coal Space Heating,
New 1 .08t 7- 1 -71 Existing 2.1 6t 7- 1 -71
1 .08t 7- 1 -72 Industry & Util ities 1 .62t 7- 1 -71
1 .08t 7- 1 -72
Gary Oi l Space Heating, New 1 .66*t 6- 1 -72* Existing 3.33*t 6- 1 -72*
1 .66*t 6- 1 -73 I ndustry & Uti l ities 2.50*t 6- 1 -72*
1 .66*t 6- 1 -73 Coal Space Heating,
New 1 .08*t 6- 1 -72* Existing 2.1 6* t 6- 1 -72*
1 .08*t 6- 1 -73* I ndustry & Util ities 1 .62* t 6- 1 -72*
1 .08*t 6- 1 -73
Hammond Al l Al l 2.50 4-1 3-71 2.00 4-1 3-73 1 .50 1 0-1 3-74
I owa Al l Oi l A l l 1 .85t 1 - 1 -74 1 .39t 1 - 1 -75
Coal Al l 3.60t 1 - 1 -74 3.00t 1 - 1 -75
Kansas Al l Oi l Al l New I nd i rect 2.78t 1- 1 -72 .-
Heatin..[, > 250 M BTU/ h r.
Coal All New Indirect 1 .80t 1 - 1 -72 Heati n9J > 250 M BTU/ hr.
Kentucky N ote: Fuel sulfur regulations for Kentucky are expressed on a sliding scale based on size of the facil ity. Values for typical units are given below:
Al l O i l New, �1Q M BTU/ hr. 2.31t 4- 9-72 25 M BTU/ h r. 1 .67t 4- 9-72 50 M BTU/ hr. 1 .29t 4- 9-72 1 00 M BTU/hr. 1 .02t 4- 9-72 .:2: 250 M BTU/ hr. 0.74t 4- 5-72
124

Sulfur Fuel Limit Effective
State Portion of State Type Fuel Use (Wt. % ) Date
Coal New, < 1 0 1\it BTU/ hr. 2.40t 4- 9-72 25 � BTU/ h r. 1 .68t 4- 9-72 50 M BTU/ hr. 1 .32t 4- 9-72 1 00 fiil BTU/ hr. 1 .02t 4- 9-'72 ,2 250 fiil BTU/hr. 0.72t 4- 9-72
Priority I Regions Oi l Exist ing Same as New (Ashland, Ci ncinnati, See Note Henderson, Louisvil le, Coal Existing Same as New & Paducah Reg ions) See Note
Note: Existing facilities in Priority 1 Regions shall comply "no later than July 1 , 1977."
Priority I I Regions Oi l Exist in9.J_ (Appalachian, B luegrass, �1_Q M BTU/ hr. 2.31 t See Note & North Central Reg ions) 25 M BTU/ hr . 2.04t See Note
50 M BTU/ hr. 1 .85t See Note 1 00 M BTU/hr. 1 .71 t See Note 250 M BTU/hr. 1 .53t See Note ;;;::sao M BTU/ h r. 1 .39t See Note
Coal Exist in9.J.. -s;; 1Q M BTU/hr . 2.40t See Note 25 M BTU/ h r. 2.04t See Note 50 M BTU/hr. 1 .80t See Note 1 00 M BTU/ h r. 1 .62t See Note 250 M BTU/ hr. 1 .38t See Note > 500 M BTU/ hr. 1 . 20t See Note
Note: Existing facilities in Priority I I shall com-ply "no later than July 1 , 1 978."
Priority I l l Regions Oi l Existin9.z_ {South Central Region) �1 0_M BTU/ h r. 2.31 t See Note
1 00 M BTU/ h r. 2.1 2t See Note 1 ,000 M B.JU! hr. 2.00t See Note ::;::,1 0,000 M 1 .85t See Note
BTU/ h r.
Coal Exist in9.z_ -s;:_1 0_M BTU/ hr. 2.40t See Note 1 00 M BTU/hr. 2.22t See Note 1 ,000 M BTU / h r. 2 .1 6t See Note �1 0,000 M 2.1 0t See Note
BTU/ h r. Note: Existing facilities in Priority I l l Regions
shal l comply "no later than July 1 , 1 979."
Louisiana Al l Oi l 4.00§ 1 -30-72 Coal 3.40 1 1 1 -30-72
Maine Port land AQCR (Cumber- Al l Al l 1 1 - 1 -73 land, Sagadahoe, Oxford, & York Counties) Rest of State Al l Al l 2.50 1 1 - 1 -73 Note: Fuel with a sulfur content in excess of 1 .50 wt. % may be used in the Portland AQCR
during the period May 1 to November 1 , 1 974.
1 25
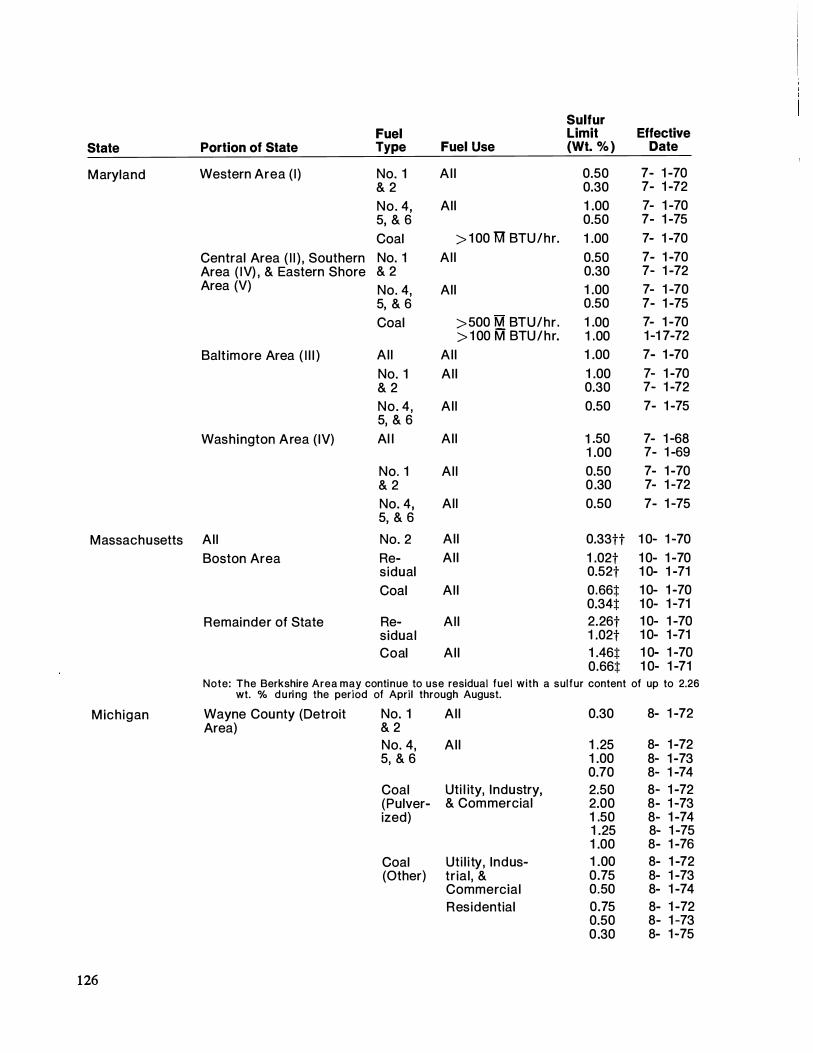
Sulfur Fuel Limit Effective
State Portion of State Type Fuel Use (Wt. % ) Date
Maryland Western Area (I) No. 1 Al l 0.50 7- 1 -70 & 2 0.30 7- 1 -72 No. 4, All 1 .00 7- 1 -70 5, & 6 0.50 7- 1 -75 Coal > 1 00 1iif BTU/hr. 1 .00 7- 1 -70
Central Area ( I I ) , Southern No. 1 Al l 0.50 7- 1 -70 Area ( IV) , & Eastern Shore & 2 0.30 7- 1 -72 Area (V) No. 4, All 1 .00 7- 1 -70
5, & 6 0.50 7- 1 -75 Coal > 500 M. BTU/hr . 1 .00 7- 1 -70
> 1 00 M BTU/hr. 1 .00 1 -1 7-72 Baltimore Area ( I l l ) Al l Al l 1 .00 7- 1 -70
No. 1 Al l 1 .00 7- 1 -70 & 2 0.30 7- 1 -72 No. 4 , Al l 0.50 7- 1 -75 5, & 6
Washington Area ( IV) Al l Al l 1 .50 7- 1 -68 1 .00 7- 1 -69
No. 1 Al l 0.50 7- 1 -70 & 2 0.30 7- 1 -72 No. 4, All 0.50 7- 1 -75 5, & 6
Massachusetts Al l No. 2 Al l 0.33tt 1 0- 1 -70 Boston Area Re- Al l 1 .02t 1 0- 1 -70
sidual 0.52t 1 0- 1 -71 Coal Al l 0.66t 1 0- 1 -70
0.34t 1 0- 1 -71 Remainder of State Re- Al l 2.26t 1 0- 1 -70
sidual 1 .02t 1 0- 1 -71 Coal Al l 1 .46t 1 0- 1 -70
0.66t 1 0- 1 -71 Note: The Berkshire Area may continue to use residual fuel with a sulfur content of up to 2.26
wt. % d u ri ng the period of April through August.
Michigan Wayne County (Detroit No. 1 Al l 0.30 8- 1 -72 Area) & 2
No. 4, Al l 1 .25 8- 1 -72 5, & 6 1 .00 8- 1 -73
0.70 8- 1 -74 Coal Uti l ity, Industry, 2.50 8- 1 -72 (Pulver- & Commercial 2.00 8- 1 -73 ized) 1 .50 8- 1 -74
1 .25 8- 1 -75 1 .00 8- 1 -76
Coal Uti l i ty, Indus- 1 .00 8- 1 -72 (Other) trial , & 0.75 8- 1 -73
Commercial 0.50 8- 1 -74 Residential 0.75 8- 1 -72
0.50 8- 1 -73 0 .30 8- 1 -75
126
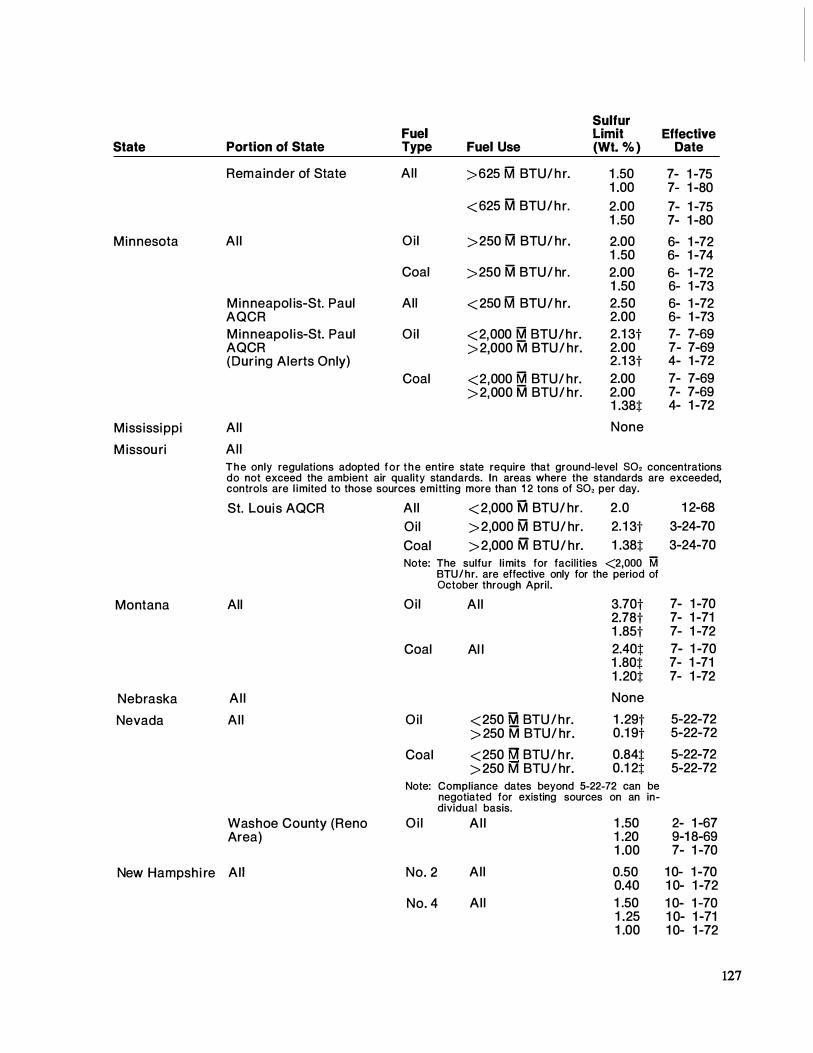
Sulfur Fuel limit Effective
State Portion of State Type Fuel Use (Wt. % ) Date
Remainder of State All > 625 M BTU/ h r. 1 .50 7- 1 -75 1 .00 7- 1 -80
< 625 M BTU/ h r. 2.00 7- 1 -75 1 .50 7- 1 -80
Minnesota Al l Oi l >250 M BTU/ hr. 2.00 6- 1 -72 1 .50 6- 1 -74
Coal >250 M BTU/ hr. 2.00 6- 1 -72 1 .50 6- 1 -73
Minneapol is-St. Paul All < 250 M BTU/ hr. 2.50 6- 1 -72 AQCR 2.00 6- 1 -73 Minneapol is-St. Paul Oi l <2,000 M BTU/hr. 2.1 3t 7- 7-69 AQCR > 2,000 M BTU/ hr. 2.00 7- 7-69 (During Alerts Only} 2.1 3t 4- 1 -72
Coal <2,000 M BTU/ hr. 2.00 7- 7-69 > 2,000 M BTU/ hr. 2.00 7- 7-69
1 .38t 4- 1 -72
Mississi ppi All None
M issou ri Al l The only regulations adopted for the entire state require that ground-level so. concentrations do not exceed the ambient air quality standards. In areas where the standards are exceeded, controls are l imited to those sources emitting more than 1 2 tons of so. per day.
St. Louis AQCR Al l < 2,000 M BTU/ hr. 2.0 1 2-68 Oil > 2,000 M BTU/ hr. 2. 1 3t 3-24-70 Coal > 2,000 M BTU/ hr. 1 .38t 3-24-70 Note: The sulfu r l i mits for facilities <2,000 M
BTU/ hr. are effective only for the period of October through April.
Montana All Oi l Al l 3.70t 7- 1 -70 2.78t 7- 1 -71 1 .85t 7- 1 -72
Coal Al l 2.40t 7- 1 -70 1 .80t 7- 1 -71 1 .20t 7- 1 -72
Nebraska Al l None
Nevada Al l Oi l <250 M BTU/hr. 1 .29t 5-22-72 > 250 M BTU/ hr. 0.1 9t 5-22-72
Coal <250 Kit BTU/ h r. 0.84t 5-22-72 > 250 M BTU / hr. 0.1 2t 5-22-72
Note: Compliance dates beyond 5-22-72 can be negotiated for existing sources on an in-dividual basis.
Washoe County (Reno Oi l A l l 1 .50 2- 1 -67 Area) 1 .20 9-1 8-69
1 .00 7- 1 -70
New Hampshi re Al l No. 2 Al l 0.50 1 0- 1 -70 0.40 1 0- 1 -72
No. 4 Al l 1 .50 1 0- 1 -70 1 .25 1 0- 1 -71 1 .00 1 0- 1 -72
127
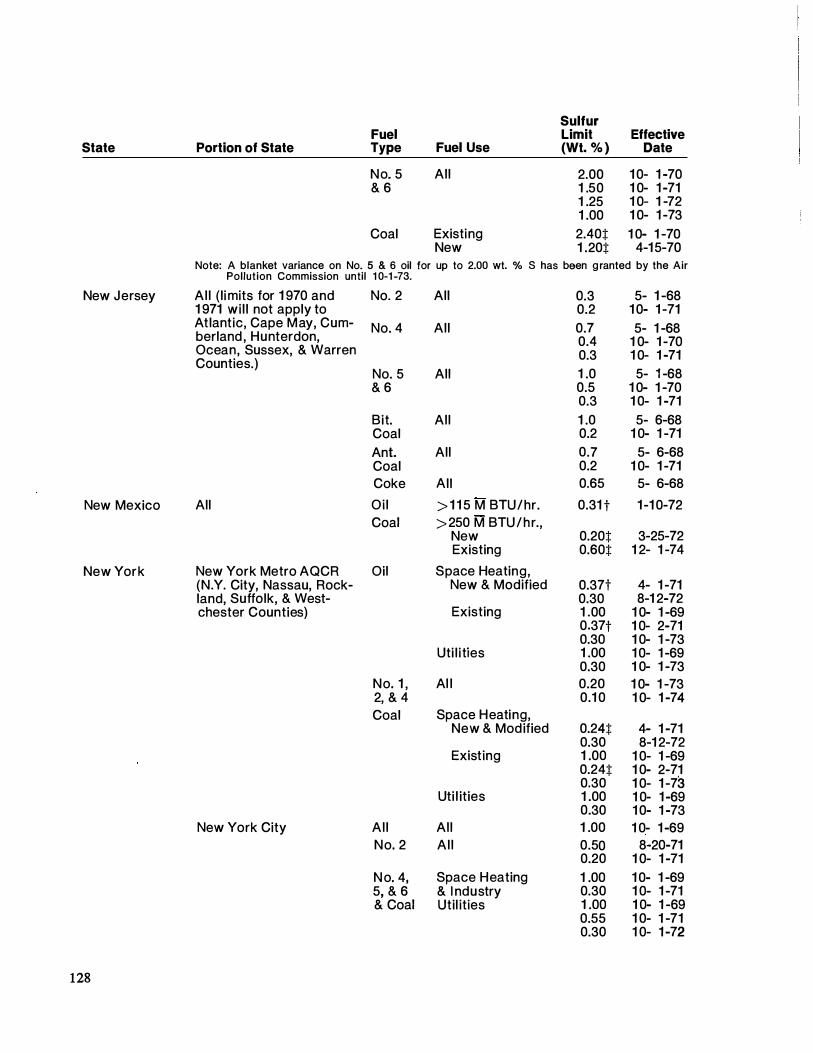
Sulfur Fuel Limit Effective
State Portion of State Type Fuel Use (Wt. % ) Date
No. 5 All 2.00 1 0- 1 -70 & 6 1 .50 1 0- 1 -71
1 .25 1 0- 1 -72 1 .00 1 0- 1 -73
Coal Existing 2.40t 1 0- 1 -70 New 1 .20t 4-1 5-70
Note: A blanket variance on No. 5 & 6 oil for up to 2.00 wt. % S has been g ranted by the Air Pollution Commission until 1 0-1 -73.
New Jersey Al l (li mits for 1 970 and No. 2 All 0.3 5- 1 -68 1 971 wi l l not apply to 0.2 1 0- 1 -71 Atlantic, Cape May, Cum- No. 4 All 0.7 5- 1 -68 berland , Hunterdon, 0.4 1 0- 1 -70 Ocean, Sussex, & Warren 0.3 1 0- 1 -71 Counties.)
No. 5 All 1 .0 5- 1 -68 & 6 0.5 1 0- 1 -70
0.3 1 0- 1 -71 Bit. All 1 .0 5- 6-68 Coal 0.2 1 0- 1 -71 Ant. All 0.7 5- 6-68 Coal 0.2 1 0- 1 -71 Coke All 0.65 5- 6-68
New Mexico All Oi l > 1 1 5 M BTU/hr. 0.31 t 1 -1 0-72 Coal > 250 M BTU/hr.,
New 0.20t 3-25-72 Existing 0.60t 1 2- 1 -74
New York New York Metro AQCR Oil Space Heating, (N.Y. City, Nassau, Rock- New & Modified 0.37t 4- 1 -71 land, Suffolk, & West- 0.30 8-1 2-72 chester Counties) Existing 1 .00 1 0- 1 -69
0.37t 1 0- 2-71 0.30 1 0- 1 -73
Uti l i ties 1 .00 1 0- 1 -69 0.30 1 0- 1 -73
No. 1 , Al l 0.20 1 0- 1 -73 2, & 4 0.1 0 1 0- 1 -74 Coal Space Heating,
New & Modified 0.24t 4- 1 -71 0.30 8-1 2-72
Existing 1 .00 1 0- 1 -69 0.24t 1 0- 2-71 0.30 1 0- 1 -73
Uti l ities 1 .00 1 0- 1 -69 0.30 1 0- 1 -73
New York City Al l All 1 .00 1 0- 1 -69 No. 2 Al l 0.50 8-20-71
0.20 1 0- 1 -71 N o. 4, Space Heating 1 .00 1 0- 1 -69 5, & 6 & I ndustry 0.30 1 0- 1 -71 & Coal Util ities 1 .00 1 0- 1 -69
0.55 1 0- 1 -71 0.30 1 0- 1 -72
128

Sulfur Fuel Limit Effective
State Portion of State Type Fuel Use (Wt. % ) Date
Oil > 500 Kil BTU/ h r. , Existing 0.35H 8-20-71 New 0.1 7tt 8-20-71
Coal > 500 � BTU/hr. , Existing 0.30§§ 8-20-71
0.1 5§ § 8-20-71 2.22t 1 - 1 -74
N iagara Frontier Oil Al l 1 .1 1 t 1 0- 2-75 AQCR (Niagara & Erie 2.40t 1 - 1 -74 Counties) Coal Al l 1 .68t 1 0- 2-74
1 .30 1 - 1 -77 Remainder of State Oi l Al l 3.05t 6- 1 -70
2.03t 1 - 1 -74 Coal Al l 2.40t 6- 1 -70
2.22t 1 - 1 -74 Note: In addition to existing state and local fuel sulfur regulations for New York, the Federal
EPA has proposed the following l i mits for certain portions of the state.
Central N.Y. AQCR Oi l Al l 1 .30 1 1 1 1 3-31 -74 (Cayuga, Cortland, Herki- 1 .00 1 1 1 1 7-31 -75 mer, J efferson, Lewis, Coal All 2.00 1 1 1 1 3-31 -74 M adison, Oneida, Onan-doga, and Oswego Counties) Genesee-Finger Lakes Oi l Al l 1 .30 1 1 1 1 3-31 -74 AQCR (Genesee, Living- 1 .00 1 1 1 1 7-31 -75 ston, Monroe, Ontario, Coal Al l 2.00 1 1 1 1 3-31 -74 Orleans, Seneca, Wayne, 1 .20 1 1 1 1 7-31 -75 Wyoming, and Yates Counties)
H udson Val ley AQCR Oi l Al l 1 .30 1 1 1 1 3-31 -74 (Albany, Columbia, 0.80 1 1 1 1 7-31 -75 Dutchess, Fulton, Greene, Coal Al l 2.00 1 1 1 1 3-31 -74 Montgomery, Orange, P utn.am, Renselaer, Sara-toga, Schenectady, and Schoharie Counties)
Southern Tier West Oi l Al l 1 .30 1 1 1 1 3-31-74 AQCR (Al leghany, Catta- 1 .00 1 1 1 1 7-31 -75 raugus, Chautauqua, Chemung, Schuyler, Steu-
2.00 1 1 1 1 ben, and Tompkins Coal Al l 3-31 -74 Counties) 1 .20 1 1 1 1 7-31 -75
U lster County Oi l Al l 0.80 1 1 1 1 7-31 -75 0.30 1 1 1 1 7-31 -75
Coal Al l 2.00 1 1 1 1 3-31 -74
North Carol ina Al l Oi l Existi ng 2.1 2t 7- 1 -71 1 .48t 7- 1 -80
New 1 .48t 7- 1 -71
Coal Existing 1 .38t 7- 1 -71 0.96t 7- 1 -80
New 0.96t 7- 1 -71
129

Sulfur Fuel Limit Effective
State Portion of State Type Fuel Use (Wt. % ) Date
North Dakota All Oil Al l 2.78t 7- 1 -70
Coal Al l 1 .80t 7- 1 -70 Ohio Priority I Reg ions Oi l New 0.92t 2-1 5-72
(Cleveland, N .W. Ohio, Existi ng 0.92t See Note Steubenvi l le, Toledo & Coal New 0.60t 2-1 5-72 Zanesvi l le Reg ions) Existing 0.60t See Note
Priority I I Regions (Day- Oi l New 1 .48t 2-1 5-72 ton, Marion-Mansfield, Exist ing 1 .48t See Note M arietta, Cincinnati , & Al l 0.92t 7- 1 -78 Youngstown Regi ons) Coal New 0.96t 2-1 5-72
Existing 0.96t See Note Al l 0.60t 7- 1 -78
P riority I l l Regions Oil New 2.96t 2-1 5-72 (Col umbus, Portsmouth , Existing 2 .96t See N ote Sandusky, & Wilmi ngton- Al l 0.92t 7- 1 -78 Chi l l icothe Reg ions) Coal New 1 .92t 2-1 5-72
Exist ing 1 .92t See Note Al l 0.60t 7- 1 -78
Note: All existing fuel burning sources shall comply with applicable fuel sulfur standards "as soon as practicable, but not later than J uly 1 , 1 975."
Cincinnati All Al l 1 .25 1 -22-69 1 .00 1 1 -22-72
Cleveland All New 1 .0 1 2-31 -71 Existing 2.0 1 2-31 -71
Greene, Clark, Miami , & Oi l Al l 3.70t 4-71 Montgomery Counties Coal Al l 2.40t 4-71
O klahoma All Oi l New & Mod ified 0.74t 7- 1 -72 0.28t 7- 1 -75
Coal New & Mod ified 1 .20t 7- 1 -72
Oregon All No. 1 Al l 0.30 7- 1 -72 No. 2 All 0.50 7- 1 -72 No. 4, Al l 2.50 7- 1 -72 5, & 6 1 .75 7- 1 -74 Coal Al l 1 .00 7- 1 -72 Oi l New & M..Qdified,
> 1 50 M BTU/ hr. 1 .29t 1 - 1 -72 > 250 M BTU/ hr. 0.74t 1- 1 -72
Coal New & Modified, > 1 50 fiA BTU/hr. 0.96t 1 - 1 -72 > 250 M BTU/ hr. 0.72t 1 - 1 -72
Pennsylvania P ittsburgh Area (Ai le- Oil < 2.5 fiil BTU/hr. 3.70t 3-1 9-72* gheny County, Beaver 2.5-50 M BTU/hr. 0.92t 3-1 9-72* Val ley, & Monongahela Val ley Air Basins) 50-2,000 M BTU/ hr. 3-1 9-72 * S.E. Pa. Air Basin (Bucks, In this size range, allow-
Chester, Delaware, Mont- able wt. % S is given
gomery, & Ph i ladel ph ia by t h e equation
A = 1 .57 E-<>.l< Counties) where A = al lowable wt. % S t
E = heat input, M BTU/hr.
1 30

State
Sulfur Fuel Limit Effective
Portion of State Type Fuel Use (Wt. % ) Date
> 2,000 Kil BTU/hr. 0.55t 3-1 9-73*
Coal < 2.5 Kil BTU/ hr. 2.40t 3-1 9-72*
2.5-50 M BTU/hr. 0.60t 3-1 9-72*
50-2,000 M BTU /hr. 3-1 9-72* In this size range, allow-able wt. % S is given by the equation A = 1 .02 E-<l.U where A = allowable w.1 % S (:j:)
E = heat input, M BTU/hr.
> 2,000 fVl BTU/ hr. 0.36t 3-1 9-72*
Al lentown-Bethlehem- Oi l <2.5 M BTU/ hr. 3.70t 3-1 9-72* Easton, Erie, Harrisburg, 2.5-50 M' BTU/ hr. 2.78t 3-1 9-72* J ohnstown, Lancaster,
50-2,000 M BTU/hr .. 3-1 9-72* Reading , Scranton-Wi l kes-Barre, & York Air In this size range, allow-
Basi ns able wt. % S is given by the equation A = 4.71 E--<>.l< where A = al lowable "Yl· % S t
E = heat input, M BTU/ hr.
> 2,000 M BTU/ hr. 1 .66t 3-1 9-72 Coal < 2.5 M BTU/ hr. 2.40t 3-1 9-72*
2.5-50 Kil BTU/ h r. 1 .80t 3-1 9-72* 50-2,000 fVl BTU/ hr. 3-1 9-72* In this size range, allow-able wt. % S is given by the equation
A = 3.06 E-<>.u where A = allowable wt. % S :j:
E = heat input, M BTU/hr.
> 2,000 M BTU/ hr. 1 .08t 3-1 9-72* Remai nder of State Oi l Al l 3.70t 3-1 9-72*
Coal Al l 2.40t 3-1 9-72*
Allegheny County Oi l Al l 2.32t 1 - 1 -70 (Pittsburg h Area}
250 M BTU/hr. 0.74t 6- 1 -72
250-2,000 M BTU/ hr. 6- 1 -72 For this size range, al-lowable wt. % S is given by the equation
A = 1 .57 E-<>.u where A = allowable Vi!· % S t
E = heat input, M BTU/hr.
2,000 M BTU/ h r. 0.55t 6- 1 -72 Note: Existing sources not in compliance with the Pennsylvania regulations on the effective
date can negotiate additional t ime for compliance through a variance procedure. Final compl iance shall be no later than July 1 , 1 975.
Coal Al l
<250 M BTU/ h r.
1 .50t
0.60t
1 - 1 -70
6- 1 -72
1 3 1

Sulfur Fuel Limit Effective
State Portion of State Type Fuel Use (Wt. % ) Date
250-2,000 M BTU/hr. 6- 1 -72 For this size range, al-lowable wt. % s is given by the equation
A = 1 .02 e-<>·"
where A = al lowable wt. % S :j: E = heat input, FA BTU/hr.
> 2,000 1iif BTU/ hr. 0.36t 6- 1 -72
Phi ladelphia No. 1 Al l 0.3 5- 1 -70 & 2 0.2 1 0- 1 -73 No. 4 Al l 0.7 5- 1 -70
0.4 1 0- 1 -72 0.3 1 0- 1 -73
No. 5 Al l 1 .0 5- 1 -70 & 6 0.5 1 0- 1 -72
0.3 1 0- 1 -73
Bit. Al l 2.0 5- 1 -70 Coal 1 .0 7- 1 -71
0.3 1 0- 1 -72
Ant. Al l 0.7 5- 1 -70 Coal 0.3 1 0- 1 -72
Rhode Island Al l Al l Al l 1 .00 1 0- 1 -71
South Caroli na All Oi l A l l 2.1 3t 7- 1 -72 1 .48t 7- 1 -77
Coal Al l 1 .38:1: 7- 1 -72 1 .20:1: 7- 1 -77
South Dakota Al l Oi l Al l 2.78t 7-1 0-73 Coal Al l 1 .80:1: 7-1 0-73
Tennessee All Oi l New 1 .25§ 1 -25-72 Existi ng 4.00§ 8- 9-73
1 .25§ 7- 1 -75 Coal New 1 .02 1 1 1 -25-72
Existing 3.40 1 1 8- 9-73 1 .02 1 1 7- 1 -75
Davi dson County Al l A l l 2.00 3- 1 -70 (Nashvi l le Area} Hami lton County Al l Al l 2.00 1 0-1 4-70 (Chattanooga Area}
Texas Al l Oi l A l l 0.88§ 3- 5-72 Coal Steam Generators 1 .80:1: 3- 5-72
Utah Al l Oi l Al l 1 .50 9-26-71 Coal Al l 1 .00 9-26-71
Vermont Al l All All 2.2 1 0- 1 -71 1 .5 1 0- 1 -72 1 .0 1 0- 1 -74
1 32
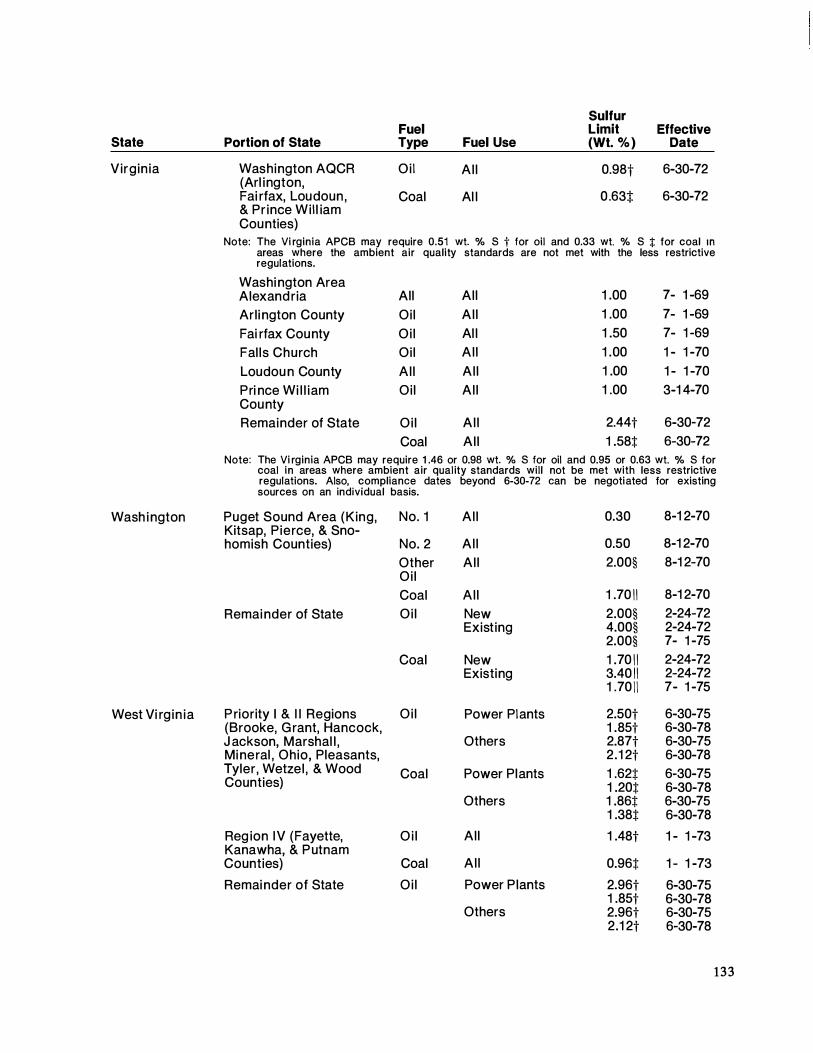
Sulfur Fuel Limit Effective
State Portion of State Type Fuel Use (Wt. % ) Date
Virgin ia Washington AQCR Oi l Al l 0.98t 6-30-72 (Arl ington, Fai rfax, Loudoun, Coal Al l 0 .63:j: 6-30-72 & Pr ince Wil l iam Counties)
Note: The Vi rginia APCB may require 0.51 wt. % S t for oil and 0.33 wt. % S :j: for coal m areas where the ambient air quality standards are not met with the less restrictive regulations.
Washi ngton Area Alexand ria All All 1 .00 7- 1 -69
Arli ngton County Oil Al l 1 .00 7- 1 -69 Fai rfax County Oi l Al l 1 .50 7- 1 -69 Fal ls Church Oil Al l 1 .00 1 - 1 -70 Loudou n County Al l Al l 1 .00 1 - 1 -70 Pri nce Wi l l iam Oil Al l 1 .00 3-1 4-70 County Remainder of State Oi l Al l 2.44t 6-30-72
Coal Al l 1 .58t 6-30-72 Note: The Vi rginia APCB may require 1 .46 or 0.98 wt. % S for oil and 0.95 or 0.63 wt. % S for
coal in areas where ambient air qual ity standards will not be met with less restrictive regulations. Also, compliance dates beyond 6-30-72 can be negotiated for existing sources on an individual basis.
Wash i ngton Puget Sound Area (King, No. 1 Al l 0.30 8-1 2-70 Kitsap, Pierce, & Sno-homish Counties) No. 2 Al l 0.50 8-1 2-70
Other Al l 2.00§ 8-1 2-70 Oi l Coal Al l 1 .70 1 1 8-1 2-70
Remai nder of State Oi l New 2.00§ 2-24-72 Existing 4.00§ 2-24-72
2.00§ 7- 1 -75 Coal New 1 .70 1 1 2-24-72
Existing 3.40 1 1 2-24-72 1 .70 1 1 7- 1 -75
West Vi rg in ia P riority I & I I Regions Oi l Power Plants 2.50t 6-30-75 (Brooke, G rant, Hancock, 1 .85t 6-30-78 J ackson, Marshal l , Others 2.87t 6-30-75 Mi neral , Ohio, Pleasants, 2 .1 2t 6-30-78 Tyler, Wetzel , & Wood Coal Power Plants 1 .62t 6-30-75 Counties) 1 .20t 6-30-78
Others 1 .86t 6-30-75 1 .38t 6-30-78
Reg ion IV (Fayette, O i l All 1 .48t 1 - 1 -73 Kanawha, & Putnam Counties) Coal Al l 0.96t 1 - 1 -73
Remai nder of State Oi l Power Plants 2.96t 6-30-75 1 .85t 6-30-78
Others 2.96t 6-30-75 2.1 2t 6-30-78
1 3 3
State
Wisconsi n
Wyomi ng
Sulfur Fuel Limit Effective
Portion of State Type Fuel Use (Wt. %) Date
Coal Power Plants 1 .92� 6-30-75 1 .20� 6-30-78
Others 1 .92� 6-30-75 1 .38� 6-30-78
Note: In addition to the l imits outlined above, the West Virgi nia APCC "strongly recommends" that the following fuel sulfur contents be met by fuel suppliers.
Oi l Al l 2.00 6-30-72 1 .50 6-30-75 0.50 6-30-78
Coal Al l 3.00 6-30-72 2.00 6-30-75 1 .00 6-30-78
Al l Dis- Standby Only 0.70 7- 1 -75 t i l l ate Re- Standby Only 1 .00 7- 1 -75 sidual Coal Standby Only 1 .50 7- 1 -75
Note: Standby Fuel is defined as a fuel normally used less than 15 days per year. In addition to the above, the state requi res that ground-level SO, concentrations do not exceed the ambient ai r quality standards.
Racine County Oi l Coal
Al l
A l l Al l
2.31 t 1 .50�
None
1 2-1 5-70 1 2-1 5-70
* API, Committee on Envi ronmental Affairs, Fuel Sulfur Regulations-Federal, State, and Local (February 1 973) ; compiled with the assistance of industry representatives and state petroleum organization personnel.
t No. 4, 5, & 6 Oi l-Regulation expressed as lbs. S or SO,/M BTU. Equivalent weight percent sulfur calculated using 1 8,500 BTU/ lb.
:j: Coal-Regulation expressed as lbs. S or SO,/M BTU. Equivalent weight percent sulfur calculated using 1 2,000 BTU/lb.
§ Oi l-Regulation expressed as parts per mil l ion SO, in the flue gas. Equivalent weight percent sulfur calculated using 25% excess air.
I ! Coal-Regulation expressed as parts per mi l lion SO, in the flue gas. Equivalent weight percent sulfur calculated using 25% excess air.
* *As proposed some time ago, but API was advised on February 1 , 1 973, that final action to adopt may be several months away.
tt No. 1 & 2 Oil-Regulation expressed as lbs. S or SO,/M BTU. Equivalent weight percent sulfur calculated using 1 8,500 BTU/ lb.
tt Oi l-Regulation expressed as parts per mil l ion SO, i n the flue gas. Equivalent weight percent sulfur calculated using 1 0% excess ai r.
§§ Coal-Regulation expressed as parts per mil l ion SO, in the flue gas. Equivalent weight percent sulfur calculated using 1 0% excess air.
1 1 1 1 Proposed.
1 34

Glossary
Glossary
additives-any materials incorporated in finished petroleum products for the purpose of improving their performance in existing applications or for broadening the areas of their utility.
�tlkylation-a refinery process for chemically combining isoparaffin with olefin hydrocarbons. The product, alkylate, has high octane value and is blended with motor and aviation gasoline to improve the antiknock value of the fuel.
ambient-a term usually referring to surrounding conditions.
amine-a class of organic compounds of nitrogen that may be considered as derived from ammonia (NHa).
analog computer-computer that operates with numbers represented by directly measured quantities .
antiknock-a quality to reduce autoignition knock in gasoline engines.
aromatic hydrocarbons-hydrocarbons characterized by unsaturated ring structures of the carbon atoms. Commercial petroleum aromatics are benzene, toluene and xylenes.
ash-the amount of nonvolatile material left after complete burning of the oil.
asphalt cement-a refined asphalt, or combination of refined asphalt and flux, of suitable consistency for paving purposes.
base oil-a refined or untreated oil used in combination with other oils and additives to produce lubricants.
biodegradable detergents-detergents susceptible to destruction by bacteria especially in sewage treatment plants.
blending-the process of mixing two or more oils having different properties to obtain a final blend having the desired characteristics. This can be accomplished "off-line" as a batch process or auto-
mated "in-line" as part of the continuous flow of a refinery.
bright stocks-high viscosity, fully refined and dewaxed lubricating oils produced by the treatment of residual stocks and used to compound motor oils.
carbon residue-the amount of carbonaceous material left after evaporation and pyrolysis of an oil.
catalytic cracking-a refinery process that converts a high boiling range fraction of petroleum (gas oil) to gasoline, olefin feed for alkylation, distillate, fuel oil and fuel gas by use of a catalyst and high temperature.
catalytic reforming-a catalytic process to improve the antiknock quality of low grade naphthas and virgin gasolines by the conversion of naphthenes (such as cyclohexane) and paraffins into higher octane aromatics (such as benzene, toluene and xylenes) . There are about 1 0 commercially licensed catalytic reforming processes, including fully regenerative and continuously regenerative designs.
cetane number-a term for expressing the ignition quality of a diesel fuel.
chelating agents-a metal deactivating additive that chemically combines with a metal to make it inactive. Especially useful where metals may be present in extremely small quantities.
clear octane-the octane number of a gasoline before the addition of antiknock additives such as TEL or TML.
cloud point-the temperature at which paraffin wax or other solid substances begin to crystallize out or separate from solution when an oil is chilled under specified conditions.
coke-the solid residue remaining after the destruc-
1 37

tive distillation of crude petroleum or residual fractions.
coking-distillation to dryness of a product containing complex hydrocarbons, which break down in structure during distillation, such as tar or crude petroleum. The residue of the process is coke.
compound-chemically speaking, a distinct substance formed by the combination of two or more elements in definite proportions by weight and possessing physical and chemical properties different from those of the combining elements.
conversion-the chemical change of one material into another through chemical processes such as cracking, polymerization, alkylation, hydrogenation and isomerization.
cracking-process carried out in a refinery reactor in which the large molecules in the charge stock are broken up into smaller, lower boiling, stable hydrocarbon molecules, which leave the vessel overhead as unfinished cracked gasoline, kerosines and gas oils. At the same time, certain of the unstable or reactive molecules in the charge stock combine to form tar or coke bottoms. The cracking reaction may be carried out with heat and pressure (thermal cracking) or in the presence of a catalyst (catalytic cracking).
crankcase "blowby"-engine combustion gases that do not leave the cylinder through the exhaust manifold but leak into the crankcase.
cryogenic fuel-a fuel that must be maintained at extremely low temperatures to remain liquid; i.e., liquefied hydrogen, methane, propane, etc.
cycle stock-unfinished product taken from a stage of a refinery process and recharged to the process at an earlier period in the operation.
deactivators-a chemical added to oils and fuels to suppress a reaction or make another chemical inactive.
deasphalting-process for removing asphalt from petroleum fractions, such as reduced crude. A common deasphalting process introduces liquid propane, in which the nonasphaltic compounds are soluble while the asphalt settles out.
desalting-removing calcium chloride, magnesium chloride and sodium chloride from crude petroleum.
desulfurization-the removal of sulfur or sulfurbearing compounds from a hydrocarbon by any one of a number of processes such as hydrotreating.
138
detergent-a substance having the properties of washing away undesirable substances through lowering of surface tension; wetting, emulsifying and dispersive action; foam formation. Soaps are natural detergents. In a lubricating oil, the property which prevents the accumulation of deposits in engine parts.
detergent additive-a substance incorporated in lubricating oils which gives them the property of keeping insoluble matter in suspension and preventing its deposition where it would be harmful. Such oils are referred to as detergent oils.
dilution-in motor oils in use, the contamination of oil in the crankcase with some of the less volatile portions of the fuel which have passed unburned into the crankcase.
dimer-a molecule formed by union of two simpler molecules, i.e., isobutane dimer is a combination of two molecules of isobutane.
diolefins-a type of open-chain, hydrogen-deficient hydrocarbons which oxidize easily in air and form gum in petroleum products during storage.
direct digital control (DDC)-a process control system using a computer connected directly to the process controls without using conventional control instruments for maintaining preset variables.
dispersant-an additive used to prevent lubricating oil impurities (usually oxidation products) from adhering to each other and forming sludge.
distillate-that portion of a liquid which is removed as a vapor and condensed during a distillation process. As fuel, distillates are generally within the 400° to 650° boiling range and include Nos. 1 and 2 fuel, diesel and kerosine.
distillation-the general process of vaporizing liquids, crude oil or one of its fractions in a closed vessel, collecting and condensing vapors into liquids.
electrostatic precipitator-a device used to separate particulate materials from a vaporous stream. Separation is made by electrically charging the solid particles which are then attracted to an electrode of the opposite charge while the vapors pass through without change. This device is commonly used to remove particulates from catalytic cracking unit flue gases.
emulsification-the phenomenon of fine dispersion of one liquid held in suspension in a second liquid in which it is partly or completely immiscible.
end point-the temperature at which the last portion of oil has been vaporized in ASTM or Engler distillation. Also called final boiling point. That

point at which titration or other chemical action is deemed complete.
engine oil-generic term applied to oils used for the bearing lubrication of all types of engines, machines and shafting and for cylinder lubrication other than steam engines. In internal combustion engines synonymous with motor oils, crankcase oils.
ergometrics-the study of human reactions to the physical environment to optimize the interaction between man, machine and the workplace.
extreme pressure lubricants (EP)-lubricants which have the property of imparting to rubbing surfaces the ability to carry appreciably heavier loads than would be possible with ordinary lubricants without excessive wear. This property is usually imparted by additives .
flare-a device for disposing of gases by burning. flash-the lowest temperature at which vapors from
an oil will ignite momentarily on application of a flame.
floating roof-special type of steel tank roof which floats upon the surface of the oil in the tank, thereby eliminating tank breathing and reducing evaporation losses.
flowers and sulfur-the element sulfur in a powder state. Sometimes called sulfur flour, sulfur flowers or brimstone.
flue gas expander-a turbine used to recover energy where combustion gases are discharged under pressure to the atmosphere. The pressure reduction drives the impeller of the turbine.
fractions-refiner's term for the portions of oils containing a number of hydrocarbon compounds but within certain boiling ranges, separated from other portions in fractional distillation. They are distinguished from pure compounds which have specified boiling temperatures, not a range.
fuel oils-any liquid or liquefiable petroleum product burned for the generation of heat in a furnace or firebox or for the generation of power in an engine. Typical fuels include clean distillate fuel for home heating and higher viscosity residual fuels for industrial furnaces.
gas oil-a fraction derived in refining petroleum with a boiling range between kerosine and lubricating oil.
gear oils-lubricating oils for use in standard transmissions, most types of differential gears, and gears contained in gear cases.
grease, lubricating-a solid to semifluid product of
the dispersion of a thickening agent in a fluid lubricant. Other ingredients may be added to impart special properties.
heat sink-a mass used to absorb heat. In jet aircraft the fuel may be used for this purpose.
heating oils-trade term for the group of distillate fuel oils used in heating homes and buildings as distinguished from residual fuel oils used in heating and power installations. Both are burner fuel oils.
heavy ends-the highest boiling portion of a gasoline or other petroleum oil.
hydraulic fluid-liquid of petroleum or nonpetroleum origin used in hydraulic systems. Low viscosity, low rate of change of viscosity with temperature, and low pour point are required characteristics.
hydrocracking-the cracking of a distillate or gas oil in the presence of catalyst and hydrogen to form high octane gasoline blending stocks.
hydrogenation-a refinery process in which hydrogen is added to the molecules of unsaturated (hydrogen-deficient) hydrocarbon fractions. It plays an important part in the manufacture of high octane blending stocks for aviation gasoline and in the quality improvement of various petroleum products.
hydrotreating-a treating process for the removal of sulfur or nitrogen from feedstocks by replacement with hydrogen.
hypoid gears-automotive differential gear system designed to lower the height of the passenger car by having the driveshaft pinion gear meet the axle gear at a point below the centerline. To mesh at this point, the gears must have teeth in a shape which resembles a hyperboloidal curve. This causes the teeth to slide together with high friction as they mesh which makes lubrication of this type gear very critical.
inhibitor-an additive substance which, when present in a petroleum product and prevents or retards undesirable changes taking place in the product, particularly oxidation and corrosion.
in-line blending-see blending.
isomerization-a refining process which alters the fundamental arrangement of atoms in the molecule. Used to convert normal butane into isobutane, an alkylation process feedstock, and normal pentane and hexane into isopentane and isohexane, high octane gasoline components.
isomers-in petroleum, different compounds composed of the same amounts of carbon and hydrogen
1 39

but differing in physical properties owing to variation in molecular structure.
kinematic viscosity-the absolute viscosity of a liquid (in centipoises) divided by its specific gravity at the temperature at which the viscosity is measured. See viscosity.
knock-the sound or "ping" associated with the autoignition in the combustion chamber of an automobile engine of a portion of the fuel-air mixture ahead of the advancing flame front.
lead-industry parlance for the motor fuel antiknock additive compound tetraethyl lead.
lead susceptibility-the increase in octane number of gasoline imparted by the addition of a specified amount of tetraethyl lead.
linear programming-instructing a computer in mathematical language to perform some action under certain conditions which is aimed at optimizing the objective function.
lithium-base grease-a lubricating grease prepared from lubricating oil and a lithium soap.
low-sulfur crude oil-crude oil containing low concentrations of sulfur-bearing compounds. Crude is usually considered to be in the low-sulfur category if it contains less than 0.5-weight-percent sulfur. Examples of low-sulfur crudes are offshore Louisiana, Libyan and Nigerian crudes. See also sweet crude.
lube stocks-refinery term for fractions of crude petroleum of suitable boiling range and viscosity to yield lubricating oils when further processed and treated.
mechanical seal-usually applied to the application of sealing a rotating shaft that extends into a vessel containing gas or liquid against escape to the atmosphere as in pumping with a centrifugal pump or mixing material in a vessel using a type of impeller. The seal is effected by having a stationary ring in the seal housing and a rotary ring affixed to the shaft. A spring arrangement keeps the two seal faces together.
mercaptans-compounds of sulfur having a strong, repulsive garliclike odor. A contaminant of "sour" crude oil and products.
metal deactivators-organic compounds sometimes added to gasoline to suppress or overcome the tendency of metal compounds in the gasoline to form gum. The metal compounds result from copper-treating the, gasoline or from other catalytic metals.
methyl ethyl ketone (MEK)-colorless liquid ob-
140
tained from petroleum derivatives. A component of a solvent used in dewaxing lubricating oils, also as a chemical intermediate.
presulfide-a step in the catalyst regeneration procedure which treats the catalyst with a sulfurbearing material such as hydrogen sulfide or carbon bisulfide to convert the metallic constituents of the catalyst to the sulfide form in order to enhance its catalytic activity and stability.
process unit-a separate facility within a refinery, consisting of many types of equipment such as heaters, fractionating columns, heat exchangers, vessels and pumps, designed to accomplish a particular function within the refinery complex. For example, the crude processing unit is designed to separate the crude into several fractions, while the catalytic reforming unit is designed to convert a specific crude fraction into a usable gasoline blending stock.
polymer-a product of the polymerization of normally gaseous olefin hydrocarbons to form high octane hydrocarbons in the gasoline boiling range.
polymerization-the process of combining two or more simple molecules of the same type, called monomers, to form a single molecule having the same elements in the same proportion as in the original molecule but having different molecular weights. The product of the combination is a polymer. The combination of two or more dissimilar molecules is known as copolymerization. The product of this combination is a copolymer.
pour depressant, pour point depressant-an additive which lowers the pour point of a lubricating oil. Also pour point inhibitor. Also used in furnace oils to improve low temperature flow and pumpability properties.
pour point-the lowest temperature at which an oil will pour or flow when chilled, without disturbance.
raffinate-in solvent refining, that portion of the oil which remains undissolved and is not removed by the selective solvent.
reference fuel-a standard fuel used in testing performance quality of fuel products.
refinery-see petroleum refinery.
refinery pool-an expression for the mixture obtained if all blending stocks for a given type of product were blended together in production ratio. Usually used in reference to motor gasoline octane rating.
refluxing-in fractional distillation, the return of part
of the condensed vapor to the fractionating column to assist in making a more complete separation of the desired fractions. The material returned is reflux.
reformate-the high octane product from reforming a naphtha.
reforming-the mild thermal cracking of naphthas to obtain more volatile products, such as olefins, of higher octane values or catalytic conversion of naphtha components to produce higher octane aromatic compounds.
Reid vapor pressure (RVP)-the method of measuring vapor pressure. See vapor pressure.
research octane number (RON)-an expression for the antiknock rating of a motor gasoline. Accepted as the guide to the antiknock qualities of fuels when vehicles are operated under conditions associated with low engine speeds.
residual desulfurization (RDS)-the removal of suifer-bearing compounds from topped crude or viscous residuums obtained in refinery operations.
residual fuel oils-topped crude petroleum or viscous residuums obtained in refinery operations. Commercial grades of burner fuel oils Nos. 5 and 6 are residual oils and include Bunker fuels.
riser cracking-applied to fluid catalytic cracking units where the mixture of feed oil and hot catalyst is continuously fed into one end of a pipe (riser) and discharges at the other end where catalyst separation is accomplished after the discharge from the pipe. There is no dense phase bed through which the oil must pass as all the cracking occurs in the inlet pipe (riser) .
road octane-a numerical value based upon the relative antiknock performance in an automobile of a test gasoline as compared with specified reference fuels. Road octanes are determined by operating a car over a stretch of level road or on a chassis dynamometer under conditions simulating those encountered on the highway.
SAE numbers-a classification of motor, transmission and differential lubricants to indicate viscosities, standardized by the Society of Automotive Engineers. They do not connote quality of the l'ubricant.
scale wax-the paraffin derived by sweating the greater part of the oil from slack wax. It contains up to 6 percent of oil. Also called crude scale.
shear-rate of shear is the ratio of flow rate or velocity (of a lubricant) to the clearance between two parallel surfaces moving in opposite directions.
For practical purposes, shearing stress may be considered as the pressure to cause flow and rate of shear as the rate of flow.
slack wax-soft crude wax obtained from pressing paraffin distillate or wax oiL
solid state electronics-low voltage electrical circuiting using transistor-type components. Very rugged and durable with no vacuum tubes or parts susceptible to vibration damage.
solvent-a substance, usually a liquid, capable of absorbing another liquid, gas or solid to form a homogeneous mixture.
solvent extraction-the process of mixing a petroleum stock with a selected solvent, which preferentially dissolves undesired constituents, separating the resulting two layers and recovering the solvent from the raffinate (the purified fraction) and from the extract by distillation.
sour crude-crude oil which (1) is corrosive when heated, (2) evolves significant amounts of hydrogen sulfide on distillation, or (3) produces light fractions which require sweetening. Sour crudes usually, but not necessarily, have high sulfur content. Examples are most West Texas and Middle East crudes.
stability-in petroleum products, the resistance to chemical change. Gum stability in gasoline means resistance to gum formation while in storage. Oxidation stability in lubricating oils and other products means resistance to oxidation to form sludge or gum in use.
stationary turbine fuel-fuel for industrial turbines as opposed to aircraft-type turbine engines .
stocks-petroleum in storage, both crude and refined products; includes crude awaiting processing and products awaiting transfer to the point of utilization.
succinimide-an organic compound combined with nitrogen used in the manufacture of lube oil additives. Chemically the compound is 2.5-diketopyrrolidine C4H502N.
sulfonates-a group of petroleum hydrocarbons resulting from treating oils with sulfuric acid. Used as synthetic detergents, emulsifying and wetting agents, and chemical intermediates.
surfactant-a substance which imparts emulsifiability, spreading, wetting, dispersibility or other surfacemodifying properties.
sweet crude-crude oil which (1) is not corrosive when heated, (2) does not evolve significant amounts of hydrogen sulfide on distillation, and
141
(3) produces light fractions which do not require sweetening. Sweet crude always has low sulfur content. Examples are offshore Louisiana, Libyan and Nigerian crudes.
sweetening-the process of improving petroleum products in color and odor by converting the undesirable sulfur compounds into less objectionable disulfides or by removing them by contacting the petroleum stream with alkalies or other sweetening agents.
synthetic detergents-liquid or solid materials capable of dissolving oily materials and dispersing or emulsifying them in water. Petroleum sulfonates are examples of synthetic detergents.
synthetic lubricants-a group of products, some of which are made from petroleum hydrocarbons, natural gas or refinery gases, which are used as oils or lubricating greases where heat, chemical resistance and other requirements can be better met than with straight petroleum products.
tricresyl phosphate (TCP) [PO(OC6H4CH3)a]-colorless to yellow liquid used as a gasoline and lubricant additive and plasticizer.
tetraethyl lead (TEL) [Pb(C2H5)4]-a volatile lead compound which is added in concentrations up to 3 cc. per gallon to motor and aviation gasoline to increase the antiknock properties of the fuel.
thiophosphates-lube oil additives formed by the combination of sulfur and phosphorus. Usually P2S5, phosphorus pentasulfide, sometimes called phosphoric sulfide, phosphorus persulfide or thiophosphoric anhydride. These additives are usually supplemented by more conventional additives, i .e., barium salts.
tetramethyl lead (TML) [Pb(CH3)4]-a highly volatile lead compound added to motor gasoline to reduce knock. May be used alone or in mixtures with TEL.
thermal cracking-a refining process which decomposes, rearranges or combines hydrocarbon molecules by the application of heat without the aid of catalysts.
topped crude-a residual product remaining after the removal, by distillation or other artificial means, of an appreciable quantity of the more volatile components of crude petroleum.
topping-the distillation of crude petroleum to remove the light fractions only.
total oxygen demand (TOD)-for aqueous effiuents, the sum of chemical and biological oxygen demand.
142
trace contaminants-impurities present in small concentrations.
trimer-a molecule formed by union of three simpler molecules of the same compound.
unsaturates-hydrocarbon compounds of such molecular structure that they readily pick up additional hydrogen atoms. Olefins and diolefins, which occur in cracking, are of this type.
vacuum distillation-distillation under reduced pressure, which reduces the boiling temperature of the material being distilled sufficiently to prevent decomposition or cracking.
vapor lock-the displacement of liquid fuel in the feed line and the interruption of normal motor operation, caused by the vaporization of light ends in the gasoline. Vaporization occurs when the temperature at some point in the fuel system exceeds the boiling points of the volatile light ends.
vapor pressure-the pressure exerted by the vapors released from an oil at a given temperature when enclosed in an airtight container. For motor gasoline a criterion of vapor-lock tendencies; for light products generally an index of storage and handling requirements.
virgin gas oil (VGO) desulfurization-the removal of sulfur-bearing compounds from hydrocarbon fractions boiling in the gas oil range and containing no cracked material.
virgin stock-oil processed from crude oil which contains no cracked material. Also called straight-run stock.
visbreaking-lowering or breaking the viscosity of residuum by cracking at relatively low temperatures.
viscosity-the measure of the internal friction or resistance of an oil to flow.
viscosity index-a scale showing the magnitude of viscosity changes in lubricating oils with changes in temperature.
volatility-that property of a liquid which denotes its tendency to vaporize.
water scrubber-a mechanical device usually applied to a gas containing particulate matter in which water is sprayed countercurrent into the stream. The water containing solids is usually sent to some means of separating the solids from the water.
wax-a term used loosely for any of a group of substances resembling beeswax in appearance and character and, in general, distinguished by their composition of esters of the higher alcohols and by their freedom from fatty acids.

yield-in petroleum refining, the percentage of product or intermediate fractions based on the amount charged to the processing operation.
zeolitic catalyst (fluid catalytic cracking)-catalyst is normally considered to be of two types: Natural clays can be used or a synthetic clay can be
chemically produced. Since the early 1960's, modern cracking catalysts contain a silica-alumina crystalline structured material called zeolite. This zeolite is commonly called a molecular sieve. The admixture of a molecular sieve in with the base clay matrix imparts desirable cracking selectivities.
143


