Factors controlling Cyanobacteria blooms in three Grand River Basin reservoirs during 2005 S.J. Guildford Department of Biology, University of Waterloo Waterloo, ON, N2L 3G1 Report to the Grand River Conservation Authority February 2006
Transcript
Factors controlling Cyanobacteria blooms in three
Grand River Basin reservoirs during 2005
S.J. Guildford
Department of Biology, University of Waterloo
Waterloo, ON, N2L 3G1
Report to the Grand River Conservation Authority
February 2006
Abstract
Limnological measurements were made at three reservoirs that flow into the
Grand River during the summer and fall of 2005 to help understand why intense blue
green algal (Cyanobacteria) blooms sometimes occur on these reservoirs. In September of
2004 a large cyanobacterial bloom on Belwood Reservoir caused considerable public
concern. In 2005, chemical, physical and biological measurements were made bi weekly
at a central deep station in Belwood, Conestogo and Guelph reservoirs. Detailed profiles
of thermal stratification and distribution of Cyanobacteria as well as other dominant algal
groups were obtained using a “FluoroProbe” spectral fluorometer. A fall cyanobacterial
bloom was again observed in 2005 on Belwood reservoir. While concentrations of total
phosphorus were low and similar in all three reservoirs during July and the first half of
August, an intense summer storm in late August caused complete vertical mixing in
Belwood reservoir and total phosphorus concentrations rose steeply and continuously
after that time. Mixing deepened the thermocline in Conestogo and Guelph reservoirs as
well but not as deeply and total phosphorus did not rise as dramatically in those two
waterbodies in the fall. Shallow surface stratification in September and early October in
combination with high total phosphorus concentrations contributed to the high
concentrations of Cyanobacteria in Belwood Reservoir. Fewer visits were made to
Conestogo and Guelph reservoirs in the fall but it appears that the highest concentration
of Cyanobacteria in Conestogo reservoir occurred in late September coincident with
highest total phosphorus and a strongly stratified water column. The results of this study
point to the importance of physical processes such as deep mixing and shallow
stratification as factors that may be useful predictors of intense cyanobacterial blooms.
2
Acknowledgements
This study was funded in part by the Grand River Conservation Authority. Other
funding was provided by an NSERC Discovery grant to S. Guildford. Sampling was
organized and carried out by A. Chiavaroli with assistance from several University of
Waterloo students including Sairah Malkin, Greg Silsbe, Tim Kuntz, Vicky Jackson,
Adel Talib and Wathiq Al-Rekaby. Laboratory analyses were supervised by Y. Kozlov
with assistance from S. Yakabowski and T. Kuntz. The University of Waterloo group
would like to extend sincere thanks to Sandra Cooke of the Grand River Conservation
Authority for initiating this study and to the superintendents and assistant superintendents
of the conservation areas; D. McFadden, M. Stanwyck (Conestogo), D. Strubb, C. Miner
(Belwood) and G. McMillan, R. Milne (Guelph) for their invaluable logistical support on
the lakes.
3
Table of contents
Abstract 2
Acknowledgements 3
Table of contents 4
List of figures 5
List of Appendices 6
Introduction 7
Methods 8
Results 10
Discussion 14
Summary and conclusions 15
References 16
Figures 17
Appendices 31
4
List of Figures Figure 1. Seasonal plots of Secchi disk depth, thermocline depth, light attenuation, mean PAR, and eutphotic depth in Belwood, Conestogo and Guelph Reservoirs and correlation between Secchi disk depth and light attenuation
17
Figure 2. Seasonal plots of total phosphorus, total dissolved phosphorus, particulate phosphorus, soluble reactive phosphorus and soluble reactive silica in the epilimnion and total phosphorus in the hypolimnion of Belwood, Conestogo and Guelph Reservoirs
18
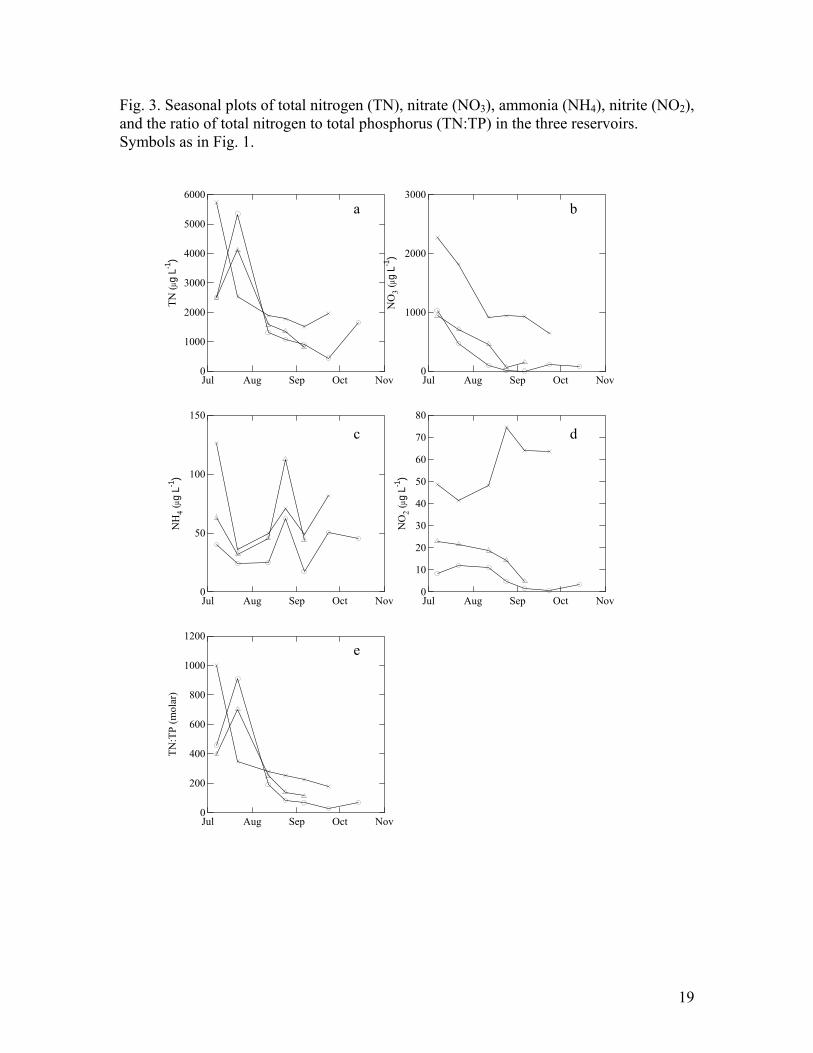
Figure 3. Seasonal plots of total nitrogen, nitrate, ammonia, nitrite and the total nitrogen to total phosphorus ratio in the epilimnion of Belwood, Conestogo and Guelph Reservoirs
19
Figure 4. Seasonal plots of total chlorophyll concentrations based on acetone extractions in the epi and hypoliminion samples from Belwood, Conestogo and Guelph Reservoirs
20
Figure 5. Seasonal plots of total chlorophyll and chlorophyll associated with Diatom, Cyanobacteria, Cryptophyte, Green algae and coloured dissolved organic matter at 2 m based on FluoroProbe profiles from Belwood, Conestogo and Guelph Reservoirs
21
Figure 6. Bar graphs of percent of total chlorophyll represented by Cyanobacteria, Cryptophyte, Diatom, Green alge and coloured dissolved organic matter at 2m in Belwood, Conestogo and Guelph Reservoirs based on FluoroProbe profiles
22
Figure 7. Linear regressions of total chlorophyll and cyanobacterial chlorophyll against total phosphorus and the total nitrogen to total phosphorus ratio. Linear regression of total chlorophyll and cyanobacterial chlorophyll
23
Figure 8. FluoroProbe profiles for Belwood Reservoir from July 5 to October 13, 2005
24
Figure 9. FluoroProbe profiles for Conestogo Reservoir from July 5 to September 22, 2005
27
Figure 10. FluoroProbe profiles for Guelph Reservoir from July 5 to September 5, 2005
29
5
List of Appendices Appendix 1. Secchi disk depth, light attenuation coefficient, euphotic depth, thermocline depth and mean PAR as a percent of surface light in Belwood, Conestogo and Guelph Reservoirs for 2005
31
Appendix 2. Soluble reactive phosphorus, total dissolved phosphorus, particulate phosphorus, total phosphorus, ammonia, soluble reactive silica, nitrate, nitrite, total nitrogen and the total nitrogen to total phosphorus ratio in epilinetic and hypolimnetic samples from Belwood, Conestogo and Guelph Reservoirs in 2005
32
Appendix 3. Total chlorophyll based on acetone extractions and from FluoroProbe profiles and Cyanobacteria, Diatom and Green alga chlorophyll and coloured dissolved organic matter at 2 m and from the hypolimnion of Belwood, Conestogo and Guelph Reservoirs in 2005
33
6
Introduction
Cyanobacteria are good competitors in phosphorus rich waterbodies for a variety
of reasons. All genera posses gas vesicles which allow them to regulate buoyancy. When
a water column is stable and turbulence is low, Cyanobacteria can position themselves in
the water column to acquire light or to avoid inhibiting light levels. Similarly,
Cyanobacteria can migrate to deeper depths to access nutrients that may be depleted in
the upper water column. Many genera have the capacity to fix atmospheric nitrogen (N)
which can provide a competitive advantage when N is low. Several genera build up high
biomass because they form colonies that are larger than the gape size of the resident
invertebrate grazer populations. A few species are capable of producing toxins. The most
common cyanotoxin is microcystin. Microcystin is an hepatotoxin which in high
concentrations causes liver damage and promotes tumour growth in organisms
chronically exposed to lower concentrations. Although it has not been demonstrated that
cyanotoxins are produced as a specific defence mechanism by Cyanobacteria, studies
have demonstrated that certain grazers appear to selectively avoid or reject toxic strains
of Microcystis.
Reports of cyanobacterial blooms have been increasing on some reservoirs on the
Grand River in the last few summers. This study was undertaken to try and determine if
there are particular environmental variables in these reservoirs that can be used as useful
predictors of these blooms and to determine steps that could be taken to prevent blooms.
This report documents the physical, chemical and biological measurements made at
Belwood, Conestogo and Guelph Lakes during the summer of 2005. The data are
7
summarized in graph format, briefly discussed and some conclusions made. All data are
tabulated in three appendices.
Methods
Study Lakes
Three reservoirs within the Grand River watershed, Conestogo, Belwood and
Guelph Lakes were selected for biweekly examination from July 6 through
September 22, 2005, with an additional visit to Belwood reservoir on October 13
following reports of a bloom. Logistical difficulties made it impossible to sample Guelph
Lake after Sept 5. Sampling stations at each lake were located at a central deep location,
where any temperature stratification would most likely be evident.
Limnological Characteristics
Water was sampled using a 5L Niskin bottle at two discrete depths, 20L was
collected from 2m below the surface (the epilimnetic sample) and 2L from 6-7m below
the surface (the hypolimnetic sample). In-situ profiles of fluorescence by pigment-
containing microorganisms were made using a FluoroProbe. These data were used to
determine the total chlorophyll fluorescence and bluegreen (cyanobacterial) fluorescence
along with three other algal groups (diatoms, green algae, cryptophytes). FluroProbe also
measures coloured dissolved organic matter (CDOM). The instrument is able to
discriminate between algal groups based on the unique combination of accessory
pigments each possess and their respective fluorescence spectra (Leboulangerm et al.
2002). The FluoroProbe was calibrated at the factory using pure cultures of algae. The
FluoroProbe field measurements are intended to provide detailed information about the
8
vertical distribution of algae and the relative proportion of the various algal groups. The
concentrations reported by the FluroProbe at 2 m in the epilimnion and at the depth of the
hypolimnion sample were compared to chlorophyll concentrations measured using
acetone extraction (see below). The Fluoroprobe logs temperature at the same time and
these temperature profiles were used to determine the depth of mixing which was taken
as the depth of maximum temperature change. Photosynthetically available radiation
(PAR) measurements were made throughout the water column using a CTD profiler. The
vertical light attenuation coefficient (kd) was calculated from the slope of depth versus the
natural logarithm of PAR. From this kd value, euphotic zone (Zeu) depth was calculated
by:
Zeu = ln100/kd
Mean water column intensity (Ī), as a percent of surface irradiance, was calculated as:
Ī = [(1 – e-kdZmix) / (kdZmix)] 100
Secchi disk depth was also measured as an indicator of water transparency. The pH at the
surface of the lakes was measured using a portable pH meter and portable logger.
Water Chemistry
Sample water was kept in dark bottles in insulated boxes from the time of
collection to the time of analyses in the laboratory which ranged from 4 to 7 hours.
Water was prefiltered through a 200 µm nytex mesh screen to remove larger grazers
before analyses. This fraction is referred to as the whole water sample (<200 µm). Whole
water from the 2 m and deep sample (usually 7 m) was analyzed for total phosphorus
(TP) and total nitrogen (TN) using the methods of Stainton et al (1977). Water from the
two depths was filtered through GF/F filters and the filters frozen and subsequently
9
analyzed for chlorophyll a using a passive extraction with 90% acetone. The extracts
were quantified by fluorometry on a Turner Designs 10-AU fluorometer that was
calibrated annually with pure chlorophyll a using the equations of Stainton et al (1977). A
second GF/F filter analyzed for particulate phosphorus (Part P) by persulfate digestion
(Environment Canada 19XX). Water collected on a precombusted GF/F filter was frozen
for particulate carbon C and N (Stainton et al 1977). Water that passed through the GF/F
filters was collected and analyzed for total dissolved phosphorus (TDP), soluble reactive
phosphorus (SRP), nitrate (NO3) and nitrite (NO2) (Stainton et al 1977). Ammonia (NH4)
was analyzed on water passed through a 0.2 µm polycarbonate filter using the
fluorometric method of Holmes et al (2002). Soluble reactive silica (SRSi) was measured
on water passed through a 0.2 µm polycarbonate filter (Stainton et al 1977).
Data analyses
Systat version 9 was used to perform regressions and to make most graphs. The
FluroProbe profiles were plotted using Excel.
Results
Physical conditions: Stratification and light
All three reservoirs were strongly stratified at about 6 m on July 6 (Fig 1 b and
Fig 8a, 9a and 10a). Two weeks later on July 21 surface temperatures were 2 to 4 degrees
warmer and the depth of stratification was shallower (Fig 1b. 8b, 9b, 10b). The surface
layer continued to warm and deepen to 7 m in Belwood and Conestogo reservoirs by Aug
11. The lakes were visited on Aug 23 around the time of a major summer storm and the
mixed layer deepened in all three lakes (Fig 1b). The individual temperature profiles (Fig
10
8d, 9d, 10d) indicate that the water column mixed completely in Belwood Lake but not
quite to the bottom in Conestogo and Guelph Lakes. In Belwood the surface temperatures
were actually lower than the deep waters due to the intense mixing. By Sept 5 the surface
waters were heating slightly and shallow stratification occurred in Belwood and Guelph
Lakes. Belwood and Guelph Lakes were strongly stratified at about 6 m on Sept 22. On
Oct 5, the surface waters of Belwood were very warm but most of the water column was
cooler and uniformly mixed (Figure 1b, 8g).
Light attenuation decreased over the summer in all three reservoirs as indicated by
the decreasing Secchi disk depth (1a), increasing light attenuation coefficient (1c), and
decreasing euphotic depth (1e). The mean PAR is the average amount of light in the
upper mixed layer of the water column. It is calculated from the light attenuation
coefficient and the mixed layer depth. In general mean PAR in the upper mixed layer of
all three lakes (Fig 1d) was high (over 15% of surface light), however on Aug 23 when
the water columns were deeply mixed the mean PAR was low, less than 10% of surface
light. The Secchi disk depth was highly correlated to the light attenuation coefficient (R2=
0.80, p=0.000, Fig 1f). This indicates that Secchi disk depth measurements could provide
reliable light attenuation information in the three lakes.
Chemistry
Total phosphorus (TP) in the epilimnion was relatively low (10 – 15 μg L-1) in all
three reservoirs in July and early August (Fig 2a). Epilimnetic TP increased dramatically
in Belwood following the deep mixing event around Aug 23. TP in the hypolimnion
increased gradually throughout the summer in all three reservoirs (Fig 2f). Particulate P
11
increased consistently in the epilimnion in all three reservoirs throughout the summer
(Fig 2c). Dissolved forms of P in the epilimnion were low initially and rose during late
summer and fall (Fig 2b, d). Soluble reactive silica, which is necessary for diatom
growth, was high and remained high in Belwood and Guelph reservoirs but decreased in
Conestogo reservoir in Sept (Fig 2e).
Total nitrogen (TN) and NO3 concentrations were very high in July in all the
reservoirs (Fig 3 a, b) but concentrations declined as the summer progressed. Ammonia
and NO2 concentrations were on average much lower and did not exhibit strong seasonal
trends (Fig 3 c, d) although the deep mixing event in late August resulted in increased
NH4 in the epilimnion. The decrease in TN coupled with increased TP contributed to the
consistent decrease in the ratio of TN:TP over the summer and fall in all three reservoirs
(Fig 3e).
Chlorophyll concentrations and algal groups
Total chlorophyll a concentrations were measured in epi and hypolimnetic
samples (Fig 4 a, b and Appendix 3). These concentrations were obtained by in vitro
acetone extraction and represent the total chlorophyll in the water at the depth of
sampling. Relative estimates of total chlorophyll and chlorophyll associated with four
major algal groups throughout the water column were obtained from in situ
Ferber, L.R., Levine, S.N., Lini, A., and Livingston, G.P. 2004. Do cyanobacteria
dominate in eutrophic lakes becasue they fix atmospheric nitrogen? Freshwater BIology
49: 690-708.
Giani, A., Bird, D. F., Prairie Y.T., and Lawrence, J. F. Empirical study of cyanobacterial
toxicity along a trophic gradient of lakes. Can. J. Fish. Aquat. Sci. 62, 2100-2109. 2005.
Huisman, J. and Hulot, F.D. 2005. Population dynamics of harmful cyanobacteria.
Springer, The Netherlands pp. 143-176.
Leboulanger C., Dorigo, U., Jacquet, S., Le Berre, B., Paolini, G., and Humbert, J.-F.
2002. Application of a submersible spectrofluorometer for rapid monitoring of freshwater
cyanobacterial blooms: a case study. Aquatic Microbial Ecology 30: 83-89.
Stainton, M.P., Capel, M.J., and Armstrong, F.A.J. 1977. The chemical analysis of
freshwater. 2nd ed. Can. Fish. Mar. Serv. Misc. Spec. Publ. 25: 180 p.
16
Fig 1. Measurements relevant to the light environment. a) Secchi disk depth, b) mixed depth (Zmix), c) light attenuation (Kd), d) mean PAR as a percent of surface light and e) the euphotic depth ( depth to which 1% of surface light penetrates) for the three reservoirs over the summer season. Belwood is represented by open circles, Conestogo by the symbol “X” and Guelph Lake by the open triangles. f) Secchi disk depth plotted versus the light attenuation coefficient.
Jul Aug Sep Oct Nov0
1
2
3
4
5
6
7
Secc
hi (m
)
Jul Aug Sep Oct Nov0.0
0.5
1.0
1.5
2.0
Kd(
m-1
)
Jul Aug Sep Oct Nov0
2
4
6
8
10
12
Z mix
(m)
Jul Aug Sep Oct Nov0
10
20
30
40
Mea
n PA
R (%
Sur
face
Lig
ht)
Jul Aug Sep Oct Nov2
3
4
5
6
7
8
9
10
11
Euph
o tic
Dep
th (m
)
0.4 0.8 1.2 1.6 2.0Kd (m-1)
1
2
3
4567
Secc
hi d
epth
(m)
R2 = 0.80, p = 0.000
a b
c d
e f
17
Fig. 2. Seasonal plots related to phosphorus and silica. 2a) total phosphorus (TP), 2b) total dissolved phosphorus (TDP), 2c) particulate phosphorus (Part P), 2d) soluble reactive phosphorus (SRP), 2e) soluble reactive silica (SRSi), and 2f) TP in the hypolimnion for the three reservoirs. Symbols as in Fig. 1.
Jul Aug Sep Oct Nov10
20
30
40
50
60
TP (μ
g L-1
)
Jul Aug Sep Oct Nov0
10
20
30
Part
P (μ
g L-1
)
Jul Aug Sep Oct Nov0
10
20
30
40
TDP
(μg
L-1)
Jul Aug Sep Oct Nov0
1
2
3
4
5
SRP
(μg
L-1)
Jul Aug Sep Oct Nov0
1000
2000
3000
SRSi
(μg
L-1)
Jul Aug Sep Oct10
20
30
40
TP (μ
g L-1
)
TP, Hypolimnion
a b
c d
e f
18
Fig. 3. Seasonal plots of total nitrogen (TN), nitrate (NO3), ammonia (NH4), nitrite (NO2), and the ratio of total nitrogen to total phosphorus (TN:TP) in the three reservoirs. Symbols as in Fig. 1.
Jul Aug Sep Oct Nov0
1000
2000
3000
4000
5000
6000
TN (μ
g L-1
)
Jul Aug Sep Oct Nov0
50
100
150
NH
4 (μg
L-1
)
Jul Aug Sep Oct Nov0
1000
2000
3000
NO
3 (μg
L-1
)
Jul Aug Sep Oct Nov0
10
20
30
40
50
60
70
80N
O2 (
μg L
-1)
Jul Aug Sep Oct Nov0
200
400
600
800
1000
1200
TN:T
P (m
olar
)
a b
c d
e
19
Fig 4 Extracted chlorophyll a in the epi and hypolimnion of the Belwood, Conestogo and Guelph reservoirs. Symbols as in Fig 1.
Jul Aug Sep Oct Nov0
10
20
30
40
50
Extra
cted
Chl
(μg
L-1)
Jul Aug Sep Oct0
10
20
30
Extra
cted
Chl
(μg
L-1)
Epilimnion Hypolimniona b
20
Fig 5. Estimates of total chlorophyll and the relative abundance of the main algal groups and coloured dissolved organic matter (CDOM) at the depth of 2 made using the Fluoroprobe. Symbols as in Fig. 1.
Jul Aug Sep Oct Nov0
10
20
30
FPro
be T
otal
Chl
(μg
L-1)
Jul Aug Sep Oct Nov0
5
10
15
20
FPro
be C
yano
Ch l
(μg
L-1)
Jul Aug Sep Oct Nov0
1
2
3
4
5
6
7FP
robe
Dia
tom
Ch l
(μg
L-1)
Jul Aug Sep Oct Nov0
2
4
6
8
10
12
FPro
b e C
rypt
o C
hl (μ
g L-1
)
Jul Aug Sep Oct Nov0
1
2
3
4FP
robe
Gre
en C
hl (μ
g L-1
)
Jul Aug Sep Oct Nov0.0
0.5
1.0
1.5
2.0
2.5
FPro
be C
DO
M C
hl (μ
g L-1
)a b
c d
e f
21
Fig. 6 Proportions of different algal groups at 2 m in the reservoirs over the sampling period as indicated by the Fluoroprobe spectral fluorescence measurements.
Jul Aug Sep Oct Nov0
10
20
30
40
50
60
70
80
90
100Pe
rcen
t
CyanobacteriaCryptophytesDiatomGreenCDOM
Belwood Lake
Jul Aug Sep Oct0
10
20
30
40
50
60
70
80
90
100
Perc
ent
CyanobacteriaCryptophytesDiatomGreenCDOM
Conestogo Lake
Jul Aug Sep Oct0
10
20
30
40
50
60
70
80
90
100
Perc
ent
CyanobacteriaCryptophytesDiatomGreenCDOM
Guelph Lake
22
Fig 7. a) Linear regressions between total P and total chlorophyll (open circles) and Cyanobacteria chlorophyll (X) from 2 m samples from all three reservoirs. b) same as a) but plotted against the TN:TP ratio and c) regression between total chlorophyll and Cyanobacterial chlorophyll at 2 m.
10 20 30 40 50 60Total P (μg L-1)
5
10
15202530
FPro
b e C
hl (μ
g L-1
)
Cyano ChlTot Chl
Total Chl R2 = 0.52, p = 0.001
Cyano Chl R2 = 0.62, p = 0.000
200 400 600 8001000
TN:TP (molar)
5
10
15202530
FPro
b e C
hl (μ
g L-1
)
Cyano ChlTot Chl
Total Chl R2 = 0.53, p = 0.001
Cyano Chl R2 = 0.63, p = 0.000
5 10 15 20 25 30
FProbe Chl (μg L-1)
4
8
1216
FPro
b e C
yano
(μg
L-1) Cyano vs Tot Chl R2 = 0.87, p = 0.000
a
b
c
23
Fig. 8. Fluoroprobe profiles for Belwood Lake. Tot = total chlorophyll, Cyano is chlorophyll associated with Cyanobacteria, Green is green algae, Diatom is diatoms, Crypto is cryptophytes, CDOM is coloured dissolved organic matter and Temp is temperature (degrees celsius). A.
Belwood Jul 6, 2005
0246810121416
0 1 2 3 4 5 6
Chl (ug/L)
Dep
th (m
)
12 13 14 15 16 17 18 19 20 21 22 23 24
Temperature (C)
Tot
Cyan
Green
Diatom
Crypto
CDOM
Temp
B.
Belwood July 21, 2005
02468
101214
0 5 10 15 20 25
Chl (ug/L)
Dep
th (m
)
19 20 21 22 23 24 25 26
Temperature (C)
Tot
Cyan
Green
Diatom
Crypto
CDOM
Temp
C.
Belwood Aug 11, 2005
02468
101214
0 4 8 12 16 20 24
Chl (ug/L)
Dep
th (m
)
18 19 20 21 22 23 24 25
Temperature (C)
Tot
Cyan
GreenDiatom
Crypto
CDOMTemp
24
Fig 8 cont. D.
Belwood Aug 23, 2005
02468
1012
0 4 8 12 16
Chl (ug/L)
Dep
th (m
)
21.7 21.8 21.9 22 22.1
Temperature (C)
Tot
Cyan
Green
Diatom
Crypto
CDOM
Temp
E.
Belwood Sept 05, 2005
0
5
10
15
0 15 30 45 60 75 90
Chl (ug/L)
Dept
h (m
)
20.5 21 21.5 22
Temperature (C)
TotCyanGreenDiatomCryptoCDOMTemp
F.
Belwood Sept 22, 2005
02468
1012
0 10 20 30
Chl (ug/L)
Dept
h (m
)
19.8 19.9 20 20.1 20.2 20.3
Temperature (C)
TotCyanGreenDiatomCryptoCDOMTemp
25
Fig 8 cont G.
Belwood Oct 13, 2005 Cast 1
02468
1012
0 10 20 30
Chl (ug/L)
Dep
th (m
)
14 15 16 17 18
Temperature (C)
TotCyanGreenDiatomCryptoCDOMTemp
26
Fig 9. Fluoroprobe profiles: Conestogo Lake A.
Conestogo Jul 6, 2005
0369
0 0.5 1 1.5 2 2.5
Chl (ug/L)
Dep
th (m
)
17 18 19 20 21 22 23 24
Temperature (C)
Tot
Cyan
Green
Diatom
Crypto
CDOM
Temp
B.
Conestogo July 21, 2005
02468101214
0 5 10 15 20 25
Chl (ug/L)
Dep
th (m
)
15 16 17 18 19 20 21 22 23 24 25 26
Temperature (C)
Tot
Cyan
Green
Diatom
Crypto
CDOM
Temp
C.
Conestogo Aug 11, 2005
02468
101214
0 4 8 12 16 20
Chl (ug/L)
Dep
th (m
)
19 20 21 22 23 24 25 26
Temperature (C)
Tot
Cyan
GreenDiatom
Crypto
CDOM
Temp
27
Fig. 9. cont. D.
Conestoga Aug 23, 2005
02468
101214
0 4 8 12 16
Chl (ug/L)
Dep
th (m
)
21 21.5 22 22.5
Temperature (C)
TotCyan
Green
DiatomCrypto
CDOMTemp
E.
Conestoga Sept 05, 2005
0
5
10
15
0 2 4 6 8 10 12
Chl (ug/L)
Dep
th (m
)
21 22 23 24 25 26
Temperature (C)
Tot
Cyan
Green
Diatom
Crypto
CDOM
Temp
F.
Conestoga Sept 22, 2005
02468
10
0 5 10 15 20
Chl (ug/L)
Dep
th (m
)
20.5 20.6 20.7 20.8 20.9 21
Temperature (C)
TotCyanGreenDiatomCryptoCDOMTemp
28
Fig. 10. Guelph Lake Fluoroprobe profiles, A.
Guelph Jul 6, 2005
0369
0 1 2 3 4 5 6
Chl (ug/L)
Dep
th (m
)
17 18 19 20 21 22 23 24
Temperature (C)
Tot
Cyan
Green
Diatom
Crypto
CDOM
Temp
B.
Guelph July 21, 2005
02468
0 2 4 6 8
Chl (ug/L)
Dep
th (m
)
22 23 24 25 26 27 28
Temperature (C)
Tot
Cyan
Green
Diatom
Crypto
CDOM
Temp
C.
Guelph Aug 11, 2005
02468
0 1 2 3 4 5 6
Chl (ug/L)
Dep
th (m
)
23 24 25 26
Temperature (C)
Tot
CyanGreen
DiatomCrypto
CDOMTemp
29
Fig. 10 cont. D.
Guelph Aug 23, 2005
02468
0 2 4 6 8 10
Chl (ug/L)
Dep
th (m
)
21.6 21.8 22 22.2 22.4
Temperature (C)
Tot
Cyan
Green
Diatom
Crypto
CDOM
Temp
E.
Guelph Sept 05, 2005
02468
0 2 4 6 8 10
Chl (ug/L)
Dep
th (m
)
21 21.5 22 22.5
Temperature (C)
Tot
Cyan
Green
Diatom
Crypto
CDOM
Temp
30
Appendix 1 Physical data
Station Sample Euph Therm Mean Station Station Date Time Depth Depth Secchi Kd Depth Depth PAR