JOURNAL OF CRITICAL REVIEWS ISSN- 2394-5125 VOL 7, ISSUE 17, 2020 636 Factors Effective on Customer Loyalty in the Mobile Telecommunications Industry: A Comparative Study of Iran and Iraq Parviz Kafcheh 1 , Kadhim Faraj Aref 2 , Aram Taher 3 , Bestoon Othman 4* 1 Assistant Professor of Business Administration, University of Kurdistan, [email protected]2 Assistant Professor of Management, Sulaimani Polytechnic University, Lecture at Kurdistan Technical Institute, [email protected] , [email protected]3 Department of Business Administration, Technical College of Administration, Sulaimani Polytechnic University, Kurdistan, Iraq, [email protected]4 Department of Business Administration, Koya Technical Institute, Erbil Polytechnic University, Erbil, Iraq. And Scientific Research and Development Center-Nawroz University-Kurdistan Regional, Iraq. Email: [email protected]Received: 10 April 2020 Revised and Accepted: 26 June 2020 Abstract: Nowadays in competitive marketing, companies have to supply customer demands to continue competing. Considering the various requirements and favorites of different customers and fixing them is necessary for manufacturing and services companies because the customers are the key to success of the companies and their absence will undoubtedly lead to the company’s failure. Loyal customers and their constant purchases will make the company successful and creates a competitive advantage for it, so the loyal customers are important for companies. The current study attempted to examine the effective factors on the loyalty of customers in the mobile communication industry in Iran and Iraq, and provide applied results for managers. This study was a descriptive research based on the purpose of applied research and it was a survey research based on the method of data collection and implementation. A questionnaire was used to collect data and its validity was confirmed by the professors of the management department. The sample of the society, due to its unlimited number, were selected 384 in Iran and 387 in Iraq, using the Cochran formula, and random sampling method was used in this study. SPSS and LISREL software’s were used to analyze the data and the collected data was normalized using the Kolmogorff-Smirnov test. Structural equation modeling was also used to test the hypotheses. Because of the normal data of the sample, Pearson correlation coefficient was used to determine the correlation between the existing factors and loyalty. The obtained results showed that there was a positive and significant effect between research variables. The results of Beta coefficient of LISREL software also indicated that the confidence to operator with 0.60 coefficient ranked first and gained the highest effect on the loyalty of customers in the mobile communication industry compared to other variables. Satisfaction with 0.54, company image with 0.46, the quality of perceived services with 0.40, and perceived cost of switching with 0.36 coefficient ranked from the second to fifth, respectively. Keywords: Confidence, Remaining customers, Mobile communication industry, Customers' loyalty I. Introduction The increase in regional and global competition in markets makes organizations turn to modern methods of competition for achievement of greater success in the long run. Today, the purpose of marketing is to manage customer demand and customer loyalty to an organization. Customer satisfaction is not sufficient for a company, which should make sure that satisfied customers are loyal as well. In general, the major, central point in marketing activities now is to maintain customers and increase their loyalty to the products or services of a company. Organizations are going through the era of customer-driven economy, where the market is actually governed by the customer. The competitive market has made organizations care more about customers and consider them and their satisfaction rather than mass production. Customer expectation, on the other hand, is constantly increasing,
Transcript
JOURNAL OF CRITICAL REVIEWS
ISSN- 2394-5125 VOL 7, ISSUE 17, 2020
636
Factors Effective on Customer Loyalty in the Mobile
Telecommunications Industry: A Comparative Study of
Received: 10 April 2020 Revised and Accepted: 26 June 2020
Abstract: Nowadays in competitive marketing, companies have to supply customer demands to continue
competing. Considering the various requirements and favorites of different customers and fixing them is necessary
for manufacturing and services companies because the customers are the key to success of the companies and
their absence will undoubtedly lead to the company’s failure. Loyal customers and their constant purchases will make the company successful and creates a competitive advantage for it, so the loyal customers are important for
companies. The current study attempted to examine the effective factors on the loyalty of customers in the mobile
communication industry in Iran and Iraq, and provide applied results for managers. This study was a descriptive
research based on the purpose of applied research and it was a survey research based on the method of data
collection and implementation. A questionnaire was used to collect data and its validity was confirmed by the
professors of the management department. The sample of the society, due to its unlimited number, were selected
384 in Iran and 387 in Iraq, using the Cochran formula, and random sampling method was used in this study.
SPSS and LISREL software’s were used to analyze the data and the collected data was normalized using the
Kolmogorff-Smirnov test. Structural equation modeling was also used to test the hypotheses. Because of the
normal data of the sample, Pearson correlation coefficient was used to determine the correlation between the
existing factors and loyalty. The obtained results showed that there was a positive and significant effect between
research variables. The results of Beta coefficient of LISREL software also indicated that the confidence to operator with 0.60 coefficient ranked first and gained the highest effect on the loyalty of customers in the mobile
communication industry compared to other variables. Satisfaction with 0.54, company image with 0.46, the
quality of perceived services with 0.40, and perceived cost of switching with 0.36 coefficient ranked from the
second to fifth, respectively.
Keywords: Confidence, Remaining customers, Mobile communication industry, Customers' loyalty
I. Introduction
The increase in regional and global competition in markets makes organizations turn to modern methods of
competition for achievement of greater success in the long run. Today, the purpose of marketing is to manage
customer demand and customer loyalty to an organization. Customer satisfaction is not sufficient for a company,
which should make sure that satisfied customers are loyal as well. In general, the major, central point in marketing activities now is to maintain customers and increase their loyalty to the products or services of a company.
Organizations are going through the era of customer-driven economy, where the market is actually governed by
the customer. The competitive market has made organizations care more about customers and consider them and
their satisfaction rather than mass production. Customer expectation, on the other hand, is constantly increasing,
and organizations are required to proceed further than primary customer needs by meeting their expectations and
to focus their attention on provision of loyalty through establishment of long-term, mutual, profitable
communication for both parties (Eid, 2016).
Customer loyalty is regarded as a key factor for organizations, and brings them profitability and success. To be
able to manage customer loyalty most properly, organizations must be able to communicate best with their
customers and identify their needs and desires (Ching et al., 2010). Customer loyalty is of great importance for
any service-providing organization. During the past ten years, concern for customer loyalty has increased
considerably, and customer loyalty is regarded today as an instruction for increasing income. This, however, is
perhaps considered as the first step in the evolution of customer orientation (Salari, 2007). Furthermore, the results
of several studies have demonstrated that companies and organizations increase their profitability by increasing the numbers of their valuable, top-ranked customers and their provision with efficient satisfaction. Given the
changing economic conditions, organizations and companies will need to seek a solution to maintain and develop
loyalty in their customers as soon as possible, and the solution is realized only through relationship marketing and
customer maintenance (Soleymani Besheli, 2016). Marketers should make it possible to improve and promote
customer loyalty more than before. The purpose of such a paradigm is to establish long-term relations with
beneficiaries and, most importantly, with customers, so that more customers are maintained, and fewer are lost,
and the contribution by the market and profitability in the organization in the long run is finally assured (Osman
et al., 2009; Yu, 2008).
II. Theoretical Framework
2.1 Customer Loyalty
Customer loyalty is a term used to refer to conditions where the customer is at a higher level of satisfaction, has
constant purchase, disregards the competitors, and praises the organization in others’ presence. Loyalty is
categorized into two distinct notions: brand preference, known as attitudinal loyalty, and market share, referred to
as behavioral loyalty. Loyalty is defined as the development of commitment in a customer to trade with a particular
organization and purchase goods and services frequently (Susanna H. and Larsson, 2004). However, there is also
a comprehensive definition according to which loyalty is used to refer to a powerful commitment to purchase a
superior product or service again in the future, such that the same brand or product is purchased despite the
potential influences and marketing efforts of the competitors (Othman et al., 2020; Cronin et al., 2000).
The first step for provision of loyalty is to identify the factors and stimuli providing loyalty among customers.
Customer loyalty is a fundamental notion affected by a variety of factors and conditions, different in effectiveness
from one organization to another and from one store to another given the business type. It is of great importance
to identify these factors accurately and to specify the effectiveness of each in helping managers to make correct decisions (Bahreynizade and Purdehghan, 2014). Turner and Wilson (2006) demonstrated that an attitudinally
loyal customer is less suspicious of negative information on the brand than one who is not loyal. Furthermore,
once loyalty to a brand increases, the income gained from loyal customers is remarkable and worthy of
examination most of the time (Matoos, 2009). Lost customers impose high operating costs to the supplier, since
the supplier has to make an investment for a new customer. Therefore, the ability to extend relations with
customers and to retain loyal ones will result in long-term success of the organization (Othman et al ., 2019; Wang
et al., 2007).
Marketing costs are reduced for an organization through customers made loyal for the following reasons.
1. Loyalty reduces customers’ learning costs particularly in service markets.
2. Customers’ positive word-of-mouth marketing enables the company to reduce its marketing costs.
1) Companies with large groups of loyal customers also hold great shares of the market.
2) Loyal customers are willing to spend higher prices for their favorite brands.
3) It is more costly to attract new customers than to retain the present customers, particularly when they are satisfied and loyal.
4) Loyal customers gain greater incomes for brands through increase in their purchases and their repetition.
5) The customers of a brand are resistant to competitors’ marketing strategies, and defend their favorite trade names.
6) In highly competitive markets, customer loyalty provides the brand with sustained competitive
advantages.
JOURNAL OF CRITICAL REVIEWS
ISSN- 2394-5125 VOL 7, ISSUE 17, 2020
638
7) Loyal, devoted customers pay less attention to extra information than others when purchasing things.
Moreover, they will ignore them more easily if encountered with problems with the products (Ebrahimi, 2012).
2.2 Satisfaction
Customer satisfaction involves a customer’s feeling about or attitude toward a product or service after using it.
Customer satisfaction is the major result of a marketer’s activity, functioning as a relationship between different
steps of consumer buying behavior. Satisfied customers are likely to continue repeating their purchase and also to recommend it to others (Othman et al ., 2019; Tronvoll, 2010). Satisfaction is the only value for a company that
causes positive financial outcomes. The results obtained through service management demonstrate that
development and coordination are determined to a large extent by loyalty, and behavioral loyalty is itself a direct
outcome of customer satisfaction (Morrisson, 2010). As approved by many pundits, customer satisfaction can be
defined as a result obtained from a comparison made by the customer between his expected performance before
purchase and the perceived actual performance and costs paid for (Khatab et al ., 2019b; Beerli et al., 2004).
2.3 Perceived Cost of Switching
According to the literature, factors that prevent customers from switching are classified in three general groups:
the costs of switching, interpersonal relations, and the attractiveness of the alternatives (Jones et al., 2002).
Customers examine competitive attractiveness at the time of probable switching by considering the benefit-cost
ratio (Kumar, 2013). Research has demonstrated that the quality of the perceived attractiveness considerably affects customer loyalty. Therefore, customers purchase a brand or service again according to their perceptions of
the attractiveness of the other alternatives given the competitive conditions. In many cases, a customer is loyal to
a brand or service since it is difficult to switch to another.
Jones et al. (2002) have classified the factors preventing switching broadly into two groups: interpersonal relations
and the attractiveness of the alternatives. Moreover, some researchers have added customer fatigue, categorized
as a type of artificial loyalty. Customer fatigue refers to the case of customers that may continue to cooperate with
the company even if they have numerous reasons for dissatisfaction. Colgate (2014), for instance, stated that a
very low percentage of financial institutions switch between businesses, which may indicate customer fatigue or
the factors preventing switching.
2.4 Trust
Schoorman et al. (2007) define trust as the tendency to depend on an exchange partner that the individual trusts.
Lymperopoulos et al. (2010) define trust as a psychological state consisting of the ratio of vulnerability acceptance
to the positive expectation behavior from others. Trust in a brand can be assumed as the security felt by the
consumer in his interactions with the brand, which is the basis of this perception and conception, and can meet
interests and comfort. This definition has a few components. Firstly, trust in a brand involves the idea that the
individual tends to put himself at risk, trusting the value commitment provided to him by the brand (Ahmad et al.,
2020; Sadq et al., 2020; Delgado and Baster, 2001).
2.5 Service Quality
The quality of any phenomenon is part of its nature, regarded as one of its components. It is difficult and
ambiguous to provide a precise description of the word quality (Khatab et al., 2019a). From the perspective of the
2000 quality system, quality is used to refer to all the features meeting customer needs; therefore, any product holding the features that meet customer needs is a quality product. It is not difficult to define and assess the quality
of products of physical nature, and their quality can be determined and assessed through specification of
quantitative standards for them. In the service sector, however, it is so difficult to address quality, where the
difficulty results from the particular features of service. These features follow.
Service is an intangible, invisible process.
Service is inseparable, in that it cannot be separated from its provider.
Service is variable, in that it is not bound by widespread standards, and even one individual provides his
service differently at two different times.
JOURNAL OF CRITICAL REVIEWS
ISSN- 2394-5125 VOL 7, ISSUE 17, 2020
639
Service is mortal, in that it is consumed as soon as provided, and cannot be saved for later use (Rashid
et al., 2019; Loveluck and Wright, 2000).
2.6 Corporate Image
The corporate image is an image of a company on its customers’ minds. It results from a process obtained from
the consumers’ ideas, emotions, and experiences with respect to the services provided by the company. These
emotions, experiences, and ideas reappear in the individuals’ memories, and a mental image of the relevant
company takes shape (Aydin and Özer, 2005). The corporate image is a conception of all beliefs, thoughts, and
impressions of a particular situation (Kadhim et al., 2020; Baloglu and Brinberg, 1997).
A favorable image should be planned and defined as accurately as the other marketing variables including brand, pricing, product, advertisement, distribution, etc. Before each imaging plan is implemented, a profound
examination of the available image of the company is required. For ensuring that a correct image is received by
the beneficiaries, the entire imaging plan should be coordinated, pursue the same issue and idea, and support a
unique message. Furthermore, since the corporate image is based on the beneficiaries’ perceptions, and is not
necessarily real, it has been suggested that regular feedback be provided for expression of the beneficiaries’ real
image of the company (Bandariyan, 2009).
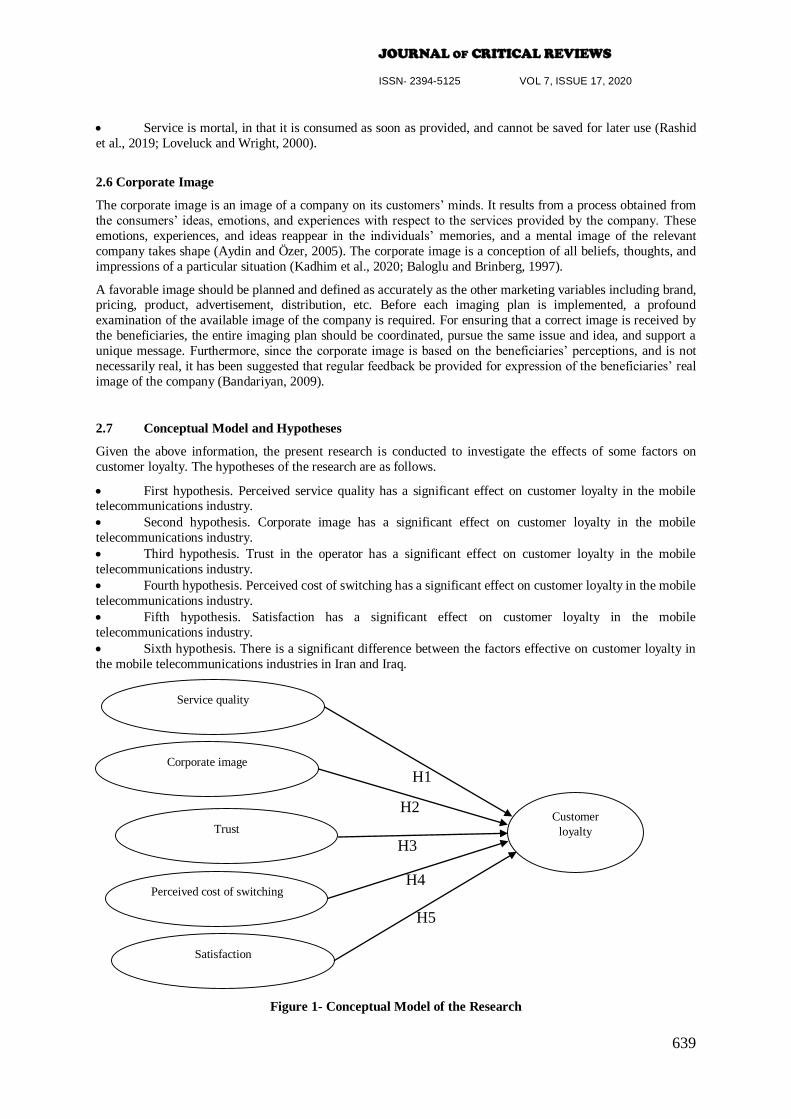
2.7 Conceptual Model and Hypotheses
Given the above information, the present research is conducted to investigate the effects of some factors on
customer loyalty. The hypotheses of the research are as follows.
First hypothesis. Perceived service quality has a significant effect on customer loyalty in the mobile telecommunications industry.
Second hypothesis. Corporate image has a significant effect on customer loyalty in the mobile
telecommunications industry.
Third hypothesis. Trust in the operator has a significant effect on customer loyalty in the mobile
telecommunications industry.
Fourth hypothesis. Perceived cost of switching has a significant effect on customer loyalty in the mobile
telecommunications industry.
Fifth hypothesis. Satisfaction has a significant effect on customer loyalty in the mobile
telecommunications industry.
Sixth hypothesis. There is a significant difference between the factors effective on customer loyalty in
the mobile telecommunications industries in Iran and Iraq.
Figure 1- Conceptual Model of the Research
Customer
loyalty
Service quality
Corporate image
Trust
Perceived cost of switching
Satisfaction
H5
H4
H3
H2
H1
JOURNAL OF CRITICAL REVIEWS
ISSN- 2394-5125 VOL 7, ISSUE 17, 2020
640
III. Methodology
The present research is categorized as a practical study in terms of purpose. It is of the correlational type in terms
of methodology. Moreover, this research is classified as a descriptive study in terms of data collection method
(research plan), describing the features of a sample and generalizing them then to the population. Descriptive
studies can in turn be of a number of types, and this one is considered as a survey. In a survey, the relationships
between variables are described, predicted, and analyzed. Furthermore, this research is a cross-sectional study in
terms of data collection time. A questionnaire has been used in this research as an instrument for data collection.
The research population under investigation consists of the customers of the Iranian and Iraqi mobile
telecommunications companies. In many practical areas, a researcher seeks to specify the parameters of the
society, but a direct access through a census of the population is impossible for him. In such conditions, samples of the population should unavoidably suffice the researcher to infer the parameters in question. A sample is a
smaller group from the population selected for observation and analysis. A certain induction can be made of the
characteristics of an entire population through an observation of the characteristics of a sample selected from the
population.
For obtaining a sample of Iranian and Iraqi mobile telecommunications industry customers in this research, the
random sampling method has been utilized, where each member of the population has the same chance of being
selected. There are several methods of sampling. One of them is to use the Cochran formula, which is as stated
below for an infinite population:
.
Based on the Cochran formula for an infinite population, a sample of size 384 is needed. For the purposes of the present research, the designed questionnaire has been distributed in Iran and Iraq, and the above Cochran formula
has been used for specification of sample size given that the populations in both countries have been infinite.
Sample size has been 384 people in Iran and 387 people in Iraq. The individuals in the samples are ones using one
of the operators available in Iran and Iraq.
Given that the present research is a practical field study, two methods as follows have been used for data collection.
The first method is that of examining documents. In this research, the theoretical framework and research
background have first been developed through reference to library resources, use of search engines in the relevant
Internet databases and cataloguing of the relevant documents. Databases such as ScienceDirect, Emerald,
ProQuest, ERIC, and ResNet have been used as English resources, and Iranian Research Institute for Information
Science and Technology, Scientific Information Database, Civilica, Modiryar, E-Modiran, MgtSolution, etc. have
been used as Persian resources. Other library resources for information collection include library research on books pertaining to research, accredited scientific journals, and domestic scientific-research journals. The second
method is the field method. The main data collection instrument in the survey step has been the questionnaire.
The designed questionnaire was randomly distributed in parts of Iran and Iraq.
IV. Findings
In this section, the researcher uses different methods of analysis to provide a solution to the developed problem
or to decide whether or not to confirm the hypothesis or hypotheses considered for the research. Therefore, it
should be noted that it is not sufficient to analyze the obtained data to find the answers to the research questions;
it is also necessary to interpret the data. The data should first be analyzed, and the results of the analysis should
then be interpreted. The information needed for the present research has been collected from the questionnaires
used for testing. This information was analyzed through the application of statistical tests appropriate to the research hypotheses in the SPSS 24 and LISREL 8.7 software environments. This section presents the collected
results and the analyses made of the data based on statistical inference using the appropriate statistical techniques
for confirmation or rejection of the research hypothesis. In this section, the collected data are first summarized
and classified using the indicators in descriptive statistics for description of the features of the sample. Then, the
descriptive statistics, including the means and standard deviations of the research variables, are provided. Next,
the hypotheses are confirmed or rejected using the inferential statistics indicators.
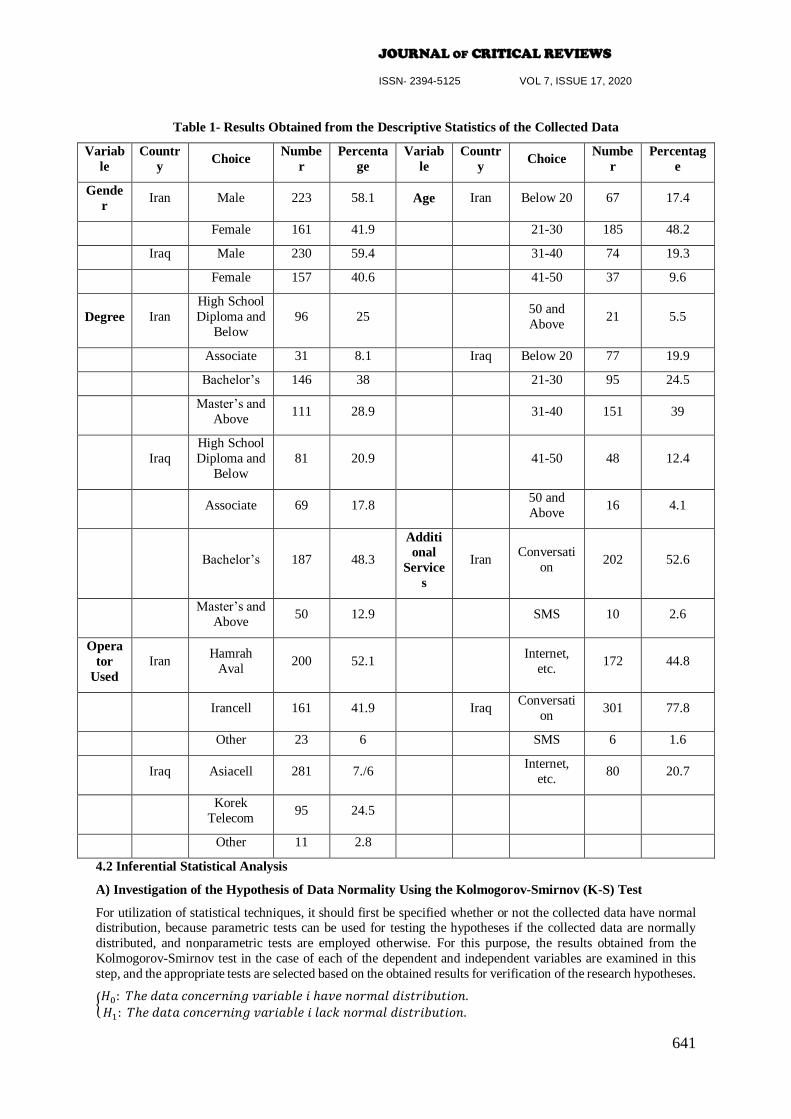
4.1 Descriptive Statistical Analysis
The results obtained from the collected sample are summarized in the following table.
JOURNAL OF CRITICAL REVIEWS
ISSN- 2394-5125 VOL 7, ISSUE 17, 2020
641
Table 1- Results Obtained from the Descriptive Statistics of the Collected Data
Variab
le
Countr
y Choice
Numbe
r
Percenta
ge
Variab
le
Countr
y Choice
Numbe
r
Percentag
e
Gende
r Iran Male 223 58.1 Age Iran Below 20 67 17.4
Female 161 41.9 21-30 185 48.2
Iraq Male 230 59.4 31-40 74 19.3
Female 157 40.6 41-50 37 9.6
Degree Iran
High School
Diploma and
Below
96 25 50 and
Above 21 5.5
Associate 31 8.1 Iraq Below 20 77 19.9
Bachelor’s 146 38 21-30 95 24.5
Master’s and
Above 111 28.9 31-40 151 39
Iraq
High School
Diploma and
Below
81 20.9 41-50 48 12.4
Associate 69 17.8 50 and
Above 16 4.1
Bachelor’s 187 48.3
Additi
onal
Service
s
Iran Conversati
on 202 52.6
Master’s and
Above 50 12.9 SMS 10 2.6
Opera
tor
Used
Iran Hamrah
Aval 200 52.1
Internet,
etc. 172 44.8
Irancell 161 41.9 Iraq Conversati
on 301 77.8
Other 23 6 SMS 6 1.6
Iraq Asiacell 281 7./6 Internet,
etc. 80 20.7
Korek
Telecom 95 24.5
Other 11 2.8
4.2 Inferential Statistical Analysis
A) Investigation of the Hypothesis of Data Normality Using the Kolmogorov-Smirnov (K-S) Test
For utilization of statistical techniques, it should first be specified whether or not the collected data have normal distribution, because parametric tests can be used for testing the hypotheses if the collected data are normally
distributed, and nonparametric tests are employed otherwise. For this purpose, the results obtained from the
Kolmogorov-Smirnov test in the case of each of the dependent and independent variables are examined in this
step, and the appropriate tests are selected based on the obtained results for verification of the research hypotheses.
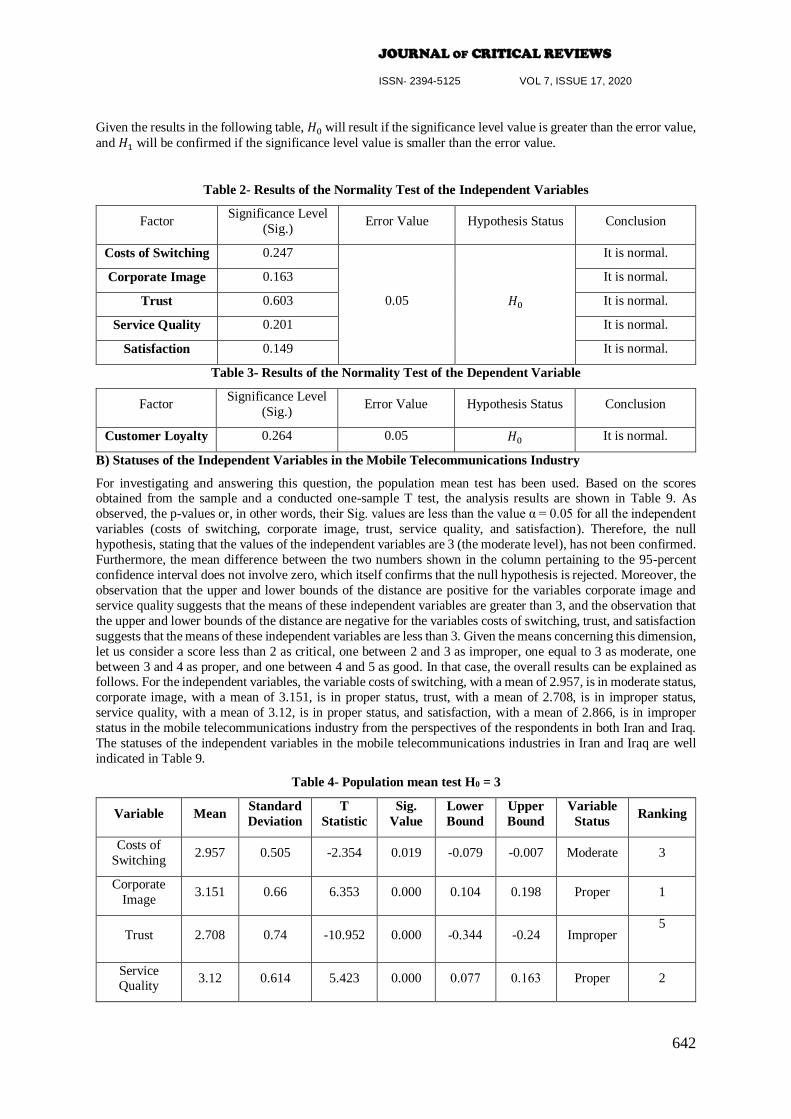
Given the results in the following table, 𝐻0 will result if the significance level value is greater than the error value,
and 𝐻1 will be confirmed if the significance level value is smaller than the error value.
Table 2- Results of the Normality Test of the Independent Variables
Factor Significance Level
(Sig.) Error Value Hypothesis Status Conclusion
Costs of Switching 0.247
0.05 𝐻0
It is normal.
Corporate Image 0.163 It is normal.
Trust 0.603 It is normal.
Service Quality 0.201 It is normal.
Satisfaction 0.149 It is normal.
Table 3- Results of the Normality Test of the Dependent Variable
Factor Significance Level
(Sig.) Error Value Hypothesis Status Conclusion
Customer Loyalty 0.264 0.05 𝐻0 It is normal.
B) Statuses of the Independent Variables in the Mobile Telecommunications Industry
For investigating and answering this question, the population mean test has been used. Based on the scores obtained from the sample and a conducted one-sample T test, the analysis results are shown in Table 9. As
observed, the p-values or, in other words, their Sig. values are less than the value α = 0.05 for all the independent
variables (costs of switching, corporate image, trust, service quality, and satisfaction). Therefore, the null
hypothesis, stating that the values of the independent variables are 3 (the moderate level), has not been confirmed.
Furthermore, the mean difference between the two numbers shown in the column pertaining to the 95-percent
confidence interval does not involve zero, which itself confirms that the null hypothesis is rejected. Moreover, the
observation that the upper and lower bounds of the distance are positive for the variables corporate image and
service quality suggests that the means of these independent variables are greater than 3, and the observation that
the upper and lower bounds of the distance are negative for the variables costs of switching, trust, and satisfaction
suggests that the means of these independent variables are less than 3. Given the means concerning this dimension,
let us consider a score less than 2 as critical, one between 2 and 3 as improper, one equal to 3 as moderate, one
between 3 and 4 as proper, and one between 4 and 5 as good. In that case, the overall results can be explained as follows. For the independent variables, the variable costs of switching, with a mean of 2.957, is in moderate status,
corporate image, with a mean of 3.151, is in proper status, trust, with a mean of 2.708, is in improper status,
service quality, with a mean of 3.12, is in proper status, and satisfaction, with a mean of 2.866, is in improper
status in the mobile telecommunications industry from the perspectives of the respondents in both Iran and Iraq.
The statuses of the independent variables in the mobile telecommunications industries in Iran and Iraq are well
Table 6- Results of Pearson’s Test of Correlation Between Different Factors and Customer Loyalty
Factor Loyalty
Correlation Coefficient Sig. N
Perceived Service
Quality 0.351 0.000 771
Corporate Image 0.418 0.000 771
Trust in the Operator 0.499 0.000 771
Perceived Cost of
Switching 0.105 0.000 771
Satisfaction 0.430 0.000 771
Given the results in Table 11, 𝐻0 will result if the significance level value is greater than the error value, and 𝐻1
will result if the significance level value is smaller than the error value. Based on the results in the above table,
since significance level is less than 0.01 for all the factors, 𝐻1 (the research hypothesis) is confirmed, and its
opposing hypothesis, stating that there is no relationship between the different factors and customer loyalty, is
rejected. As observed, there is a significant positive relationship between the above factors and customer loyalty
at the 99-percent level, and the correlation coefficient is 0.351 for perceived service quality, 0.418 for corporate
image, 0.499 for trust in the operator, 0.105 for perceived cost of switching, and, finally, 0.430 for satisfaction.
E) Hypothesis Testing Using Structural Equation Modeling
Structural equation modeling has been used for testing the research hypotheses and ranking them in terms of
effectiveness on the dependent variable. Structural equation modeling is a comprehensive approach for testing
hypotheses concerning the relationships between the observed and latent variables, sometimes referred to as
JOURNAL OF CRITICAL REVIEWS
ISSN- 2394-5125 VOL 7, ISSUE 17, 2020
644
covariance structure analysis, causal modeling, or LISREL. Azar (2002) also argues that one of the most
powerful, appropriate methods of analysis in behavioral and social science is multivariate analysis, as the models
are multivariate in such cases, and cannot be solved with a bivariate method (where one independent variable is
considered along with one dependent variable each time). Covariance structure analysis, or structural equation
modeling, is one of the major methods of analyzing complex data structures and one of the new methods for
investigation of causal relationships, equivalent to analysis of different variables, representing the simultaneous
effects of variables on each other in a theory-based structure. With this method, the acceptability of a theoretical
model in a particular population can be tested using correlational, non-experimental, and experimental data.
Structural equation modeling with the LISREL software has been used for assessment of the factors effective on
customer loyalty and specification of the coefficients of each. Covariance structure analysis, or structural equation modeling, is one of the major methods of analyzing complex data structures and one of the new methods for
investigation of causal relationships, equivalent to analysis of different variables, representing the simultaneous
effects of variables on each other in a theory-based structure. This method can be used for solving a multivariate
conceptual model, which cannot be solved using a bivariate method (where one independent variable is considered
along with one dependent variable each time). In other words, a structural model is simply an explanation of the
causal relationships among latent variables. The purpose of the model is to detect the direct and indirect effects
of exogenous latent variables on endogenous latent variables.
Diagram 1- Structural Model of the Research in Standard Estimation Mode (First to Fifth Research
Hypotheses)
JOURNAL OF CRITICAL REVIEWS
ISSN- 2394-5125 VOL 7, ISSUE 17, 2020
645
Diagram 2- Structural Model of the Research in Significant Figures Mode (First to Fifth Research
Hypotheses)
JOURNAL OF CRITICAL REVIEWS
ISSN- 2394-5125 VOL 7, ISSUE 17, 2020
646
Table 7- Results of Testing the (First to Fifth) Research Hypotheses Using the Structural Equation Model
Hypothesis Path Direction Path
Coefficient T Ranking
First Perceived service quality has a positive effect on customer
loyalty in the mobile telecommunications industry. 0.40 3/96 4
Second Corporate image has a positive effect on customer loyalty
in the mobile telecommunications industry. 0/46 4/04 3
Third Trust in the operator has a positive effect on customer
loyalty in the mobile telecommunications industry. 0/60 7/47 1
Fourth
Perceived cost of switching has a positive effect on
customer loyalty in the mobile telecommunications
industry.
0/36 2/67 5
Fifth Satisfaction has a positive effect on customer loyalty in the
mobile telecommunications industry. 0/54 6/55 2
Based on the structural equation model and the statistics available in Table 16, the first to fifth research hypotheses
were confirmed, since the path coefficient T of all the variables has been greater than 1.96, which causes all the hypotheses to be confirmed. It is observed that trust in the operator (with an effect size of 0.60 and a significance
figure of 7.47) has had the greatest effect on customer loyalty, and is ranked first among the variables. Satisfaction
(with an effect size of 0.54 and a significance figure of 6.55) is ranked second, corporate image (with an effect
size of 0.46 and a significance figure of 4.04) is ranked third, perceived service quality (with an effect size of 0.40
and a significance figure of 3.96) is ranked fourth, and, finally, perceived cost of switching (with an effect size of
0.36 and a significance figure of 2.67) is ranked fifth (last).
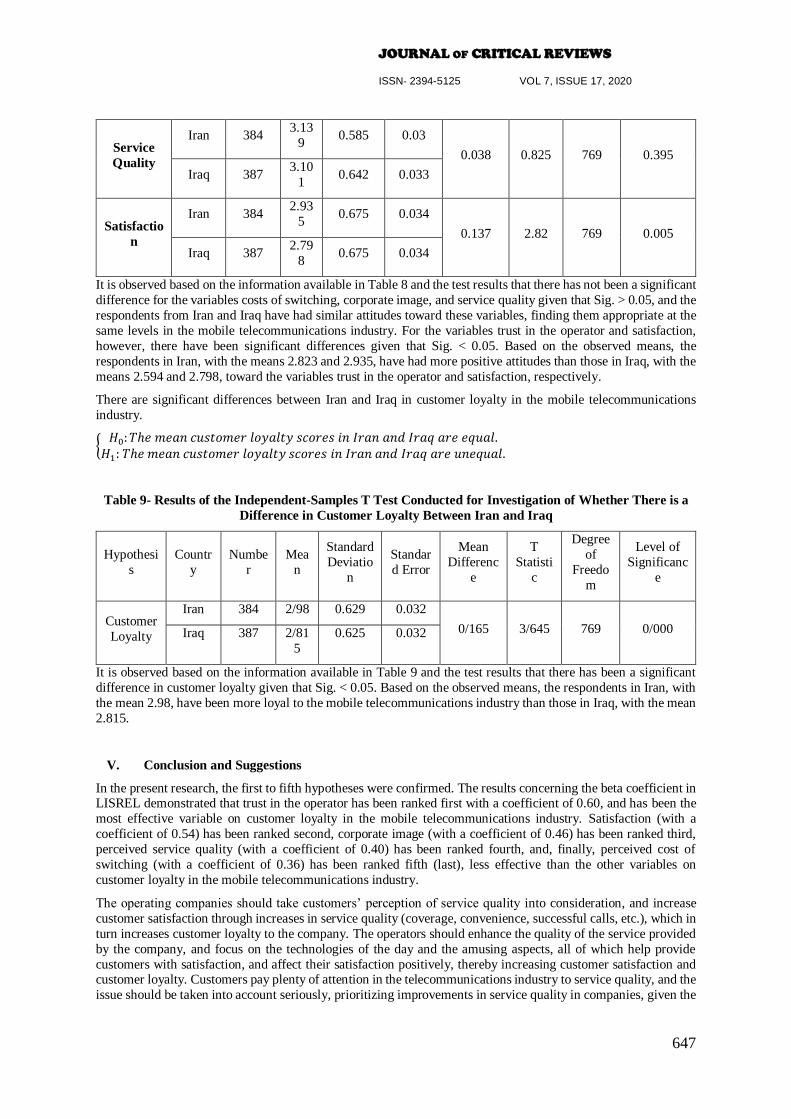
Sixth hypothesis. There is a significant difference between the factors effective on customer loyalty in the mobile
Table 9- Results of the Independent-Samples T Test Conducted for Investigation of Whether There is a
Difference in Customer Loyalty Between Iran and Iraq
Hypothesi
s
Countr
y
Numbe
r
Mea
n
Standard
Deviatio
n
Standar
d Error
Mean
Differenc
e
T
Statisti
c
Degree
of
Freedo
m
Level of
Significanc
e
Customer
Loyalty
Iran 384 2/98 0.629 0.032
0/165 3/645 769 0/000 Iraq 387 2/81
5
0.625 0.032
It is observed based on the information available in Table 9 and the test results that there has been a significant
difference in customer loyalty given that Sig. < 0.05. Based on the observed means, the respondents in Iran, with
the mean 2.98, have been more loyal to the mobile telecommunications industry than those in Iraq, with the mean
2.815.
V. Conclusion and Suggestions
In the present research, the first to fifth hypotheses were confirmed. The results concerning the beta coefficient in LISREL demonstrated that trust in the operator has been ranked first with a coefficient of 0.60, and has been the
most effective variable on customer loyalty in the mobile telecommunications industry. Satisfaction (with a
coefficient of 0.54) has been ranked second, corporate image (with a coefficient of 0.46) has been ranked third,
perceived service quality (with a coefficient of 0.40) has been ranked fourth, and, finally, perceived cost of
switching (with a coefficient of 0.36) has been ranked fifth (last), less effective than the other variables on
customer loyalty in the mobile telecommunications industry.
The operating companies should take customers’ perception of service quality into consideration, and increase
customer satisfaction through increases in service quality (coverage, convenience, successful calls, etc.), which in
turn increases customer loyalty to the company. The operators should enhance the quality of the service provided
by the company, and focus on the technologies of the day and the amusing aspects, all of which help provide
customers with satisfaction, and affect their satisfaction positively, thereby increasing customer satisfaction and customer loyalty. Customers pay plenty of attention in the telecommunications industry to service quality, and the
issue should be taken into account seriously, prioritizing improvements in service quality in companies, given the
JOURNAL OF CRITICAL REVIEWS
ISSN- 2394-5125 VOL 7, ISSUE 17, 2020
648
particular conditions of service companies, discussed in Section 2. Thus, customers can be made loyal to the
company, so that the competitive conditions are maintained for it.
A service provision company can acquire a powerful competitive position by presenting a positive image to
customers’ minds. Consideration of the activities of the company on the part of the senior managers of the
organization and care for meeting the needs and improving service provision causes a positive image of the
company to take shape in customers’ minds. Maintenance of the positive image of the company and customers’
positive perception of it should be taken into consideration. Thus, if a positive image is established of the company,
both the image persists in the customers’ perception, and the competitive advantage increases the future income
and profit of the company.
Furthermore, the following suggestions may be practical for success of a company:
increasing the geographical coverage of the cellphone operator so that more regions are covered by the
service
accelerating response to customer’s complaints
establishing a voice of the customer department and evaluating the performance of the department staff
via customers
offering an online billing system to increase customers’ trust in the operator
providing a variety of new services so that different customer needs are covered by the operator
participating in social activities admired by the society
emphasizing the staff’s innovation and creation of competitive advantage
utilizing a customer satisfaction survey system at the company
instructing the staff to behave well toward customers to obtain their satisfaction identifying different age groups’ needs, preferences, and motivations for continuing their contact with
the operator
considering different scores for loyal customers and offering incentives to subscribers that have attracted
customers to the organization by recommending the operator
considering plans for satisfying older customers as beneficial subscribers and establishing loyalty in them
by increasing the lengths of their contact with the organization
holding direct and indirect polls for identification of different subscribers’ expectations and realization
of their evaluations of the operator and its services
improving the subscriber complaint handling system for satisfaction of customers.
VI. References
[1]. Ahmad, N., Muhammad, H., Khizar, U., & Othman, B. (2020). The Effect of Electronic Word of Mouth Communication on Purchase Intention Moderate By Trust : A Case Online Consumer of Bahawalpur
Faculty of Technology Management and Business , University Tun Hussein Onn Malaysia , Faculty of
computer science and infor. International Journal of Advanced Science and Technology, 29(9), 4995–
5008.
[2]. Aydin, S., & Özer, G. (2005). The Analysis of Antecedents of Customer Loyalty in the Turkish Mobile
Telecommunication Market. European Journal of marketing, Vol. 39(7/8), 910-925.
[3]. Baloglu, S., & Brinberg, D. (1997). Affective Images of Tourism destinations. Journal of travel
research, Vol. 35, Issue, 4, pp. 11-15.
[4]. Bandariyan, R. (2009). Corporate Image: A Conceptual Framework for Strategic Planning. Tehran:
Institute for Trade Studies and Research. Volume 7, Issue 36, pp. 94-103.
[5]. Beerli A., Martin J.D., &Quintana A., (2004). A Model of Customer Loyalty in the Retail Banking Market. European Journal of Marketing, Vol. 38, No. 1/2, pp. 253-275.
[6]. Ching -Fu C., Fu -Shian Chen. (2010). Experience quality, perceived value, satisfaction and behavioral
Dimensions of Services Switching Costs and Managing Their Differential Strategic Outcomes. Journal
of Business Research, Vol. 56, pp. 441-50.
[13]. Kadhim Ghaffar Kadhim, Amran Harun, Bestoon Othman, Falah Saleem Falah, A. A. (2020). The Effect
of Corporate Social Responsibility Activities on Customer Satisfaction Towards Hypermarkets in Kuala Lumpur Malaysia. International Journal of Advanced Science and Technology, 29(9s), 3974–3988.
[14]. Khatab, J. J., Esmaeel, E. S., & Othman, B. (2019a). Dimensions of Service Marketing Mix and its
Effects on Customer Satisfaction : A Case Study of International Kurdistan Bankin Erbil City-Iraq. TEST
Engineering & Management, (4846), 4846–4855.
[15]. Khatab, J. J., Esmaeel, E. S., & Othman, B. (2019b). The Influence of Service Quality on Customer
Satisfaction : Evidence from Public Sector and Private Sector Banks in Kurdistan / Iraq. International
Journal of Advanced Science and Technology, 28(20), 865–872.
[16]. Kumar, V., Shah, D. (2013). Building and Sustaining Profitable Customer Loyalty for 22 Century.
journal of retailing, Vol. 80, pp. 317-331.
[17]. Loveluck, C. & Wirtz, J. (2010). Services Marketing: People, Technology, Strategy. New Jersey: World
Scientific Publishing. 8th Edition. [18]. Lymperopoulos, C., Chaniotakis, I. E., & Rigopoulou, I. D. (2010). Acceptance of Detergent-Retail
Brands: The Role of Consumer Confidence and Trust. International Journal of Retail & Distribution
Management, Vol. 38(9), 719-736.
[19]. Morrisson, O. and Huppertz, J. W. (2010). External Equity, Loyalty Program Membership, and Service
Recovery. Journal of Services Marketing, Vol. 24, No. 3, pp. 244-54.
[20]. Othman;, B. A. H. N. M. D. A. Z. M. S. (2020). The effects on customer satisfaction and customer loyalty
by integrating marketing communication and after sale service into the traditional marketing mix model
of Umrah travel services in Malaysia. Journal of Islamic Marketing, 11(2).
https://doi.org/10.1108/JIMA-09-2019-0198
[21]. Othman, B. A., Harun, A., Rashid, W. N., Nazeer, S., Kassim, W. M., & Kadhim, K. G. (2019). The
influences of service marketing mix on customer loyalty towards Umrah travel agents: Evi- dence from
Malaysia. Management Science Letters, 6, 865–876. https://doi.org/10.5267/j.msl.2019.3.002 [22]. Othman, B., Harun, A., Rashid, W., & Ali, R. (2019). The impact of Umrah service quality on customer
satisfaction towards Umrah travel agents in Malaysia. Management Science Letters, 9, 1763–1772.
https://doi.org/10.5267/j.msl.2019.6.014
[23]. Osman, H., Hemmington, N., & Bowie, D. (2009). A Transactional Approach to Customer Loyalty in
the Hotel Industry. International Journal of Contemporary Hospitality Management, vol. 21, No. 3, 239-
50.
[24]. Rashid, K. T. S., Ismael, D. A., Othman, B., & Ali, R. (2019). Dimensions of service quality and their
effects on achieving competitive advantage: An exploratory study of banking organizations in
Sulaimaniyah city-Iraq. International Journal of Psychosocial Rehabilitation, 23(2), 548–565.
https://doi.org/10.37200/IJPR/V23I2/PR190315
[25]. Sadq, Z. M., Ahmad, B. S., Sulaiman, V., Saeed, H., Othman, B., & Mohammed, H. O. (2020). The relationship between intellectual capital and organizational trust and its impact on achieving the
requirements of entrepreneurship strategy ( The case of Korek Telecom Company , Iraq ). International
Journal of Advanced Science and Technology, 29(02), 2669–2682.
[26]. Salari, Gh. (2007). Benefits and Costs of Customer Loyalty. Tadbir Monthly, Issue 150.
[27]. Schoorman, F. D., Mayer, R. C., & Davis, J. H. (2007). An integrative model of organizational trust:
Past, present, and future. Academy of Management Review, 32(2), 344–354.
[28]. Soleymani Besheli, A. (2016). Creativity in Banking Service Marketing. Tehran: Ettehad.
[29]. Susanna H. and Larsson, S. (2004). Managing Customer Loyalty in the Automotive Industry, Master’s
Thesis. Department of Business Administration and Social Sciences, Lulea University of Technology.
[30]. Tronvoll, B. (2010). Negative Emotions and Their Effect on Customer Complaint Behavior. Journal of
Service Management, Vol. 22 No. 1.
[31]. Turner, J. J. & Wilson, K. (2006). Grocery Loyalty: Tesco Clubcard and Its Impact on Loyalty. British Food Journal, Vol. 108 No. 11, pp. 958-64.
[32]. Wang, Y., Lin, H., & Tang, T. (2007). Determinants of User Acceptance of Internet Banking: An
Empirical Study. International Journal of Service Industry Management, 14 (5), 501-519.