+ All Categories
Home > Documents > Factors Influencing Customer Satisfaction or ...

Factors Influencing Customer Satisfaction or ...

Date post: 18-Dec-2021
Category:
Upload: others
View: 3 times
Download: 0 times
Share this document with a friend
29
Factors Influencing Customer Satisfaction or Dissatisfaction in the Restaurant Business Using AnswerTree Methodology Jinsoo Hwang, Ph.D. Student Hospitality Management and Dietetics Kansas State University 2050 Kerr Drive Apt. Q21 Manhattan, Kansas 66502, USA Cell: (415) 630-3198 Fax: (785) 532-5522 [email protected] Jinlin Zhao, Ph.D., Associate Professor School of Hospitality & Tourism Management Florida International University 3000 NE 151 Street, HM 336 North Miami, FL 33181 Cell: (305) 919-4540 Fax: (305) 919-4555 [email protected] Published in: Journal of Quality Assurance in Hospitality & Tourism, Volume 11, Issue 2 April 2010, pages 93 – 110. 1 brought to you by CORE View metadata, citation and similar papers at core.ac.uk provided by K-State Research Exchange
Transcript

Factors Influencing Customer Satisfaction or Dissatisfaction in the Restaurant Business

Using AnswerTree Methodology

Jinsoo Hwang, Ph.D. Student

Hospitality Management and Dietetics

Kansas State University

2050 Kerr Drive Apt. Q21

Manhattan, Kansas 66502, USA

Cell: (415) 630-3198

Fax: (785) 532-5522

[email protected]

Jinlin Zhao, Ph.D., Associate Professor

School of Hospitality & Tourism Management

Florida International University

3000 NE 151 Street, HM 336

North Miami, FL 33181

Cell: (305) 919-4540

Fax: (305) 919-4555

[email protected]

Published in: Journal of Quality Assurance in Hospitality & Tourism, Volume 11, Issue 2 April 2010, pages 93 – 110.

1

brought to you by COREView metadata, citation and similar papers at core.ac.uk

provided by K-State Research Exchange

Factors Influencing Customer Satisfaction or Dissatisfaction in the Restaurant Business

Using AnswerTree Methodology

ABSTRACT. In the restaurant business, customer satisfaction can be linked directly to

restaurant sales; thus, it is important to identify which perceived quality factors more strongly

affect customer satisfaction or dissatisfaction. The purpose of this study was to find differences

between satisfied and dissatisfied customers. The major analytical method used was

AnswerTree. As AnswerTree method allows the researcher to more effectively target exact

groups of people, it is a suitable analysis method to find differences between satisfied and

dissatisfied customer groups. Study results indicated three perceived quality factors (good value,

tasty food, and restaurant cleanness) most affected satisfied customers. On the other hand, three

perceived quality factors (good value, tasty food, and employees’ knowledge of menu) most

affected dissatisfied customers. Study results provide some meaningful information for

restaurateurs in making a marketing strategy.

KEYWORDS: Customer satisfaction, perceived quality, AnswerTree, CHAID

2

INTRODUCTION

Restaurants are one of the many businesses that affect economic growth in the U.S.

According to the National Restaurant Association (2009), with 945,000 restaurant locations

nationally, the restaurant industry's direct sales are $566 billion a year, or more than $1.55 billion

a day. Including the impact restaurants have on sales in related industries, the industry's overall

impact on the U.S. economy is $1.5 trillion a year (about 4 % of the U.S. gross domestic

product). To find the ideal marketing strategy, many restaurateurs have spent considerable time

and effort trying in order to sustain their status in a competitive restaurant market. Generally,

they consider that customer satisfaction is a crucial factor in their competitive fields. As

customer satisfaction could greatly affect predicting customer post-purchase behavior (Tam,

2000), the concept of customer satisfaction has become an important topic in many restaurants

and in academic research. Unfortunately, although there is no assurance that the customer will

make a return visit due to the intangible nature of services (Dube, Renaghan, and Miller, 1994),

customer satisfaction could become one of the most important factors for determining whether

customers have the intent of returning or not (Oh, 2000; Yüksel and Yüksel, 2002). Furthermore,

customer satisfaction can be linked directly to business sales (Baker and Crompton, 2000; Chow

et al., 2007; Heskett, Sasser, and Schlesinger, 1997; Mohsin, 2005; Zeithaml and Bitner, 2000).

Thus, if restaurant marketers know which perceived quality factors have the greatest impact on

restaurant customer satisfaction or dissatisfaction, they could have a good way to find the chief

element of success or failure in a restaurant’s management.

The aim of this study was to find differences between satisfied and dissatisfied customers

based on perceived quality. This research revealed which perceived quality factors more strongly

affect satisfied and dissatisfied customers in the restaurant business. Study results can help

3

restaurateurs to develop marketing strategies that can be successfully used by full-service

restaurant operators. Before we discuss the results of this study, we will review the literature

about customer satisfaction and perceived quality.

LITERATURE REVIEW

As customer satisfaction is the most important factors affecting service management, it is

important to marketers and scholars (Rust and Oliver, 1994). In fact, many researchers have

applied customer satisfaction to the service industry (e.g. Almanza, Jaffe, and Lin, 1994;

Andaleeb and Conway, 2006; Barsky and Labagh, 1992; Gabbie and O'Neil, 1996; James, 1995;

Johns and Tyas, 1996; Oh, 1999, 2000; Oliver, 1980, 1981). Furthermore, due to the influence of

customer satisfaction on repeat purchases and word-of-mouth recommendations, customer

satisfaction is deemed to be critical for all businesses (Berkman and Gilson, 1986; Yüksel and

Yüksel, 2002). Many scholars have defined customer satisfaction differently. According to Dube

et al., (1994), customer satisfaction is “an indicator of whether customers will return to a

restaurant” (p. 39), or “customer satisfaction is the leading criterion for determining the quality

actually delivered to customers through the product/service and by the accompanying servicing”

(Vavra, 1997, p. 8). Although many scholars suggest various definitions of customer satisfaction,

the definition proposed by Oliver (1980) has been mostly widely accepted (Pizam and Ellis,

1999). Many researchers have tried to verify the validity of this theory (e.g. Oliver and DeSarbo,

1988; Tse and Wilton, 1988). To summarize Oliver’s theory, customers are used to buying a

product or service with expectations based on previous experience. In other words, before they

buy the product or service, customers already have a certain level of expectation. And then, once

they buy the product or service, they compare the new one with the previous product or service.

4

At this time, confirmation or disconfirmation occurs. If the customer can accept the outcome

compared with his or her expectations, confirmation will occur. On the other hand, if the

customer cannot accept the outcome, disconfirmation will occur. There are two kinds of

disconfirmation, which are positive disconfirmation and negative disconfirmation. When the

outcome of the product or service is less than the customer expects, negative disconfirmation

will occur. On the other hand, when the customer feels better about the outcome than the

expectation, positive disconfirmation will occur. In summary, customer satisfaction occurs by

confirmation or positive disconfirmation of consumer expectations, and dissatisfaction occurs by

negative disconfirmation of consumer expectations.

According to Tam (2000), there is a close link between service quality and customer

satisfaction. As service quality is deemed a significant factor in increasing customer satisfaction

and loyalty, the significance of service quality has been studied by academics and practitioners

(e.g. Dukart, 1998; Leal and Pereira, 2003; Umbrell, 2003; Parasuraman, Zeithaml, and Berry,

1985, 1988, 1994). In addition, service quality has been well recognized for playing a crucial

role in improving organizational profits because it is directly related to customer satisfaction, and

customer loyalty (Baker and Crompton 2000; Leal and Pereira, 2003; Zeithaml and Bitner,

2000). In fact, numerous researchers have studied the measurement of service quality. The most

well known instrument for measuring service quality is SERVQUAL, which was introduced by

Parasuraman et al. (1988). Since its introduction, SERVQUAL has been widely applied in many

industries for measuring customer perceptions of service quality (Parasuraman, Berry, and

Zeithaml, 1991). Parasuraman et al. (1988) suggested that customer perceptions of service

quality can be measured by the gap between customer expectation and perceptions of

performance levels. SERVQUAL consists of five distinct dimensions with 29 specific operating

5

statements. The dimensions are: assurance (knowledge and courtesy of employees and their

ability to inspire trust and confidence), empathy (caring, individualized attention the firm

provides its customers), reliability (ability to perform the promised service dependably and

accurately), responsiveness (willingness to help customers and provide prompt service), and

tangibles (physical facilities, equipment, and appearance of personnel). Because it is a simple

and inexpensive instrument, SERVQUAL has been applied in various fields and provided

meaningful information (Heung, Wong, and Qu, 2000). However, SERVQUAL dimensions

should be necessary to remove or revise in particular different service areas (Carman, 1990).

Subsequently, Stevens, Knutson, and Patton (1995) designed a perceived quality scale,

DINESERV, by modifying SERVQUAL in order to apply it to the restaurant business. Although

DINESERV included some items to measure the atmospherics quality, they missed the factor of

food quality, which is one of the most important factors when assessing overall customer

experience in the restaurant (Kivela, Inbakaran, and Reece, 1999; Raajpoot, 2002). Carrying the

previous study a step further, Mohsin (2005) studied perceived quality that included the factor of

food quality based on SERVQUAL and DINESERV. In this study, we categorized four

perceived quality factors influencing customer satisfaction: service quality, food quality,

atmospherics, and other factors including price, parking space, and location.

RESEARCH METHODOLOGY

Data Collection and Questionnaire

The data used for this study were collected in Miami. Surveys were conducted from May

1 to May 31, 2007. Because 15 minutes is enough time to complete all questionnaires, surveys

commenced with a question saying whether respondents have 15 minutes or not. Furthermore,

6

survey did not allow to young people under the age of 18 to participate because of their lack of

knowledge about the subject. Finally we selected respondents who had visited a full-service

restaurant within the last one month. The selected full-service restaurants provided full table

services and the average guest check was at least $25 per person. Of the 414 questionnaires

collected, 24 were incomplete and were eliminated. As a result, a total of 390 questionnaires

were used in the data analysis.

The dependent variable was customer response in relation to level of satisfaction after a

dining experience. The dependent variable was composed of three groups: “agree,” “neutral,”

and “disagree.” Among the respondents (n=390), 84.36% (n=329) indicated that the experience

of visiting the restaurant was good (agree), 12.05% (n=47) of the respondents thought that the

restaurant was bad (disagree), and 3.59% (n=14) of them indicated “neutral.” The independent

variables were perceived quality factors that influence customer satisfaction. In this study, 18

items were mainly cited from the Mohsin (2005) study. Some new items were added from

Stevens et al. (1995). A total of 18 perceived quality factors were classified into four categories:

service-related attributes, food-related attributes, atmosphere-related attributes and other

attributes. Service-related attributes consisted of six measurement items: “The service was

prompt,” “Sauces, utensils, napkins, etc., were readily available on the table,” “The order was

correct and complete,” “Employees spoke clearly,” “Employees were friendly and courteous,”

and “Service employees had adequate product knowledge to make good suggestions for food.”

Food-related attributes included five measurement items: “The food quality was excellent,” “The

food temperature was good,” “The food was tasty,” “The drink was excellent,” and “The menu

had a good variety of items.” Atmosphere-related attributes included four measurement items:

“The employee uniform was appropriate,” “Restaurant had a good ambience,” “Restaurant was

7

clean,” and “The menu was easy to read.” Other attributes included “Restaurant had adequate

parking spaces,” “Location of the restaurant was convenient,” and “I received a good value for

my money.” The questionnaire was made of a seven-point Likert scale, and each scale item was

rated by asking respondents to indicate their level of agreement ranging from strongly disagree

(1) to strongly agree (7). To apply CHAID (Chi-square Automatic Interaction Detection)

analysis, researchers converted the seven-point scale into categorical variables (agree, neutral,

disagree). Even though respondents answered five or six on the seven-point scale, it could be

agreed that the information sufficiently ensured their positive response. As a result, in this study,

five, six, and seven points were converted into a positive response (agree). In contrast, one, two,

and three points converted into a negative response (disagree). Finally, four in the seven-point

scale was converted into a neutral response. The summary of data description is presented in

Table 1.

Insert Table 1

Data Analysis Method

The major analytical measurement was AnswerTree methodology. The purpose of this

study was to find important perceived quality factors that satisfied and dissatisfied customers

consider when dining at a full-service restaurant. As AnswerTree method allows the researcher

to more effectively target exact groups of people (2009), it is a suitable analysis method to find

differences between satisfied and dissatisfied customer groups. The purpose of the AnswerTree

method is to predict or sort the targeting variable (dependent variable) by dividing observation

(independent variable). As AnswerTree uses fixed rules to link between predictors (independent

8

variable) when determining splits, the researchers can easily understand the targeting

segmentations which will respond to the purpose of study (SPSS, 1998). Therefore, AnswerTree

has been applied in many fields. For instance, according to SPSS (2009), AnswerTree can

analyze data to:

• Know potential customers

• Find which customer groups buy specific products

• Identify which customers will most likely defect

AnswerTree method automatically provides the best tree structure on the basis of

variations of likelihood-ratio chi-square values when each independent variable is used for

constructing the tree (SPSS, 1998). The dependent variable can be sorted by the level of

whichever independent variable that has the strongest relationship with the dependent variable.

That is, the most important independent variable with a dependent variable can be the first node.

This process is done when one of three criteria is met from Berson, Smith, and Thearling (2000):

1. The segment contains only one record. (There is no other question that you can ask

to further refine a segment of just one.)

2. All the records in the segment have identical characteristics. (There is no reason to

continue asking further questions because all the remaining records are the same.)

3. The improvement is not substantial enough to warrant asking the question (p. 162).

AnswerTree has three decision-making options, which are CHAID (Chi Square

Automatic Interaction Detector), CART (Classification and Regression Trees), and QUEST

(Quick, Unbiased, Efficient, Statistical Tree) to find the targeting group using the tree structure.

Among the three decision-making options, since the categorical variable was applied for

analyzing data in this study, the CHAID method, which is fit to the categorical variable, was

9

used. Kass (1980) firstly developed the original CHAID algorithm for categorical dependent

variables. It was further extended to ordinal dependent variables by Magidson (1994). The

CHAID analysis is applicable to situations where all variables, independent and dependent

variable, are categorical. The dependent variable can have more than two categories. Since

CHAID algorithm is one of the most effective data mining methods, it has widely been applied

in the consumer research area (Chen, 2003; Haughton and Oulabi, 1997; Levin and Zahavi,

2001). All variables used in this study are categorical measurements with two or more

categorical levels. The stopping rules for AnswerTree analyses are a maximum tree depth of 3,

minimum number of case of 25 for a given node.

RESULT

Demographic Profile of Respondents

Descriptive statistics were used to present the characteristics of the respondents. A total

of 390 respondents were involved in this survey. Among the respondents (n=390), 203 (52.1%)

were male, and 187 (47.9%) were female. The majority of participants were White/Caucasian

(132, 33.8%), and 92 respondents (23.6%) were Hispanic. Finally, regarding their annual

household income, the highest percentage of respondents earned between $40,000 (33.1%).

Table 2 presents details on the gender, age, marital status, ethnicity and income.

Insert Table 2

AnswerTree Analysis Results

10

Figure 1 shows a general model of satisfied and dissatisfied groups. Before conducting

analysis, the researchers expected three groups (disagree, soso, agree) would be divided by

perceived quality variables. However, because “soso” group has small sample size (n=8), two

groups (agree and disagree groups) were classified by the perceived quality variables. In this

study, 12 nodes were used to explain perceived quality factors affecting satisfied and dissatisfied

groups.

Insert Figure 1

AnswerTree Analysis Results: Satisfied Group

Considering the results of the satisfied group (agree) in Figure 2, the first split was “I

received a good value for my money (agree)” (χ2=384.4955, d.f.=4; p=.000). In Node 3, 98.75%

(n=317) of respondents showed that the majority felt the “level of satisfaction” was good

whereas 0.31% (n=1) had negative feelings regarding the “level of satisfaction.” Node 3 was

divided into two groups: Node 7 and Node 8. The second pruning tree was based on the variable

of “The food was tasty (agree)” (χ2=30.5869, d.f.=2; p=.000). In Node 8, 99.35% (n=306) of

respondents agreed that “level of satisfaction” was good and the Node 8 was pruned into two

groups which were Node11 and Node 12. The last split was “Restaurant was clean (agree)”

(χ2=2.3481, d.f.=1; p=.1254). In Node 12, 99.63% (n=266) of respondents agreed that “level of

satisfaction” was good. That is, people who felt that the restaurant was clean agreed that the

“level of satisfaction” was good. However, in this case, the p-value is less than 0.05, so we can

not say that clean was an important factor in explaining the level of satisfaction. In summary of

11

the satisfied group, there were two descriptors. They were “I received a good value for my

money” and “The food was tasty.”

Insert Figure 2

AnswerTree Analysis Results: Dissatisfied Group

In the case of the results of the dissatisfied group (disagree) in Figure 3, the first split

was “I received a good value for my money (disagree)” (χ2=384.4955, d.f.=4; p=.000). 84.36%

(n=329) of respondents showed that they felt the “level of satisfaction” was good whereas

12.05% (n=47) had negative feelings regarding the “level of satisfaction.” Node 1 was then

divided into three groups: Node 4, Node 5, and Node 6. The second pruning tree was based on

the variable of “The food was tasty (disagree)” (χ2=64.5035, d.f.=4; p=.000). In Node 4, 97.73%

(n=43) of respondents disagreed with “level of satisfaction” was good, and Node 8 was pruned

into two groups, which were Node 9 and Node 10. The third split was “Service employees had

adequate product knowledge to make good suggestions for food (disagree, neutral)” (χ2=21.4884,

d.f.=1; p=.000). In Node 9, 100.00% (n=42) of respondents thought that “level of satisfaction”

was not good. That is, people who thought that “level of employees’ knowledge” was not good

agreed that “level of satisfaction” was bad. In summary of the dissatisfied group (disagree),”

there were three descriptors which were “I received a good value for my money”, “The food was

tasty”, and “Service employees had adequate product knowledge to make good suggestions for

food.”

Insert Figure 3

12

AnswerTree Analysis Results: Bar Graph

Figure 4 is a bar graph that summarizes the statistics as a graph. The bar graph allows

readers to figure out which node most represents the dependent variable showing variation of

each dependent variable. In this study, two groups in the dependent variables were classified by a

maximum tree depth of 3, minimum number of case of 25 for a given node. The bar graph of

AnswerTree showed that certain nodes most represent satisfied and dissatisfied groups,

respectively (Node 12: satisfied group, Node 9: dissatisfied group).

Insert Figure 4

AnswerTree Analysis Results: Gain Chart Results

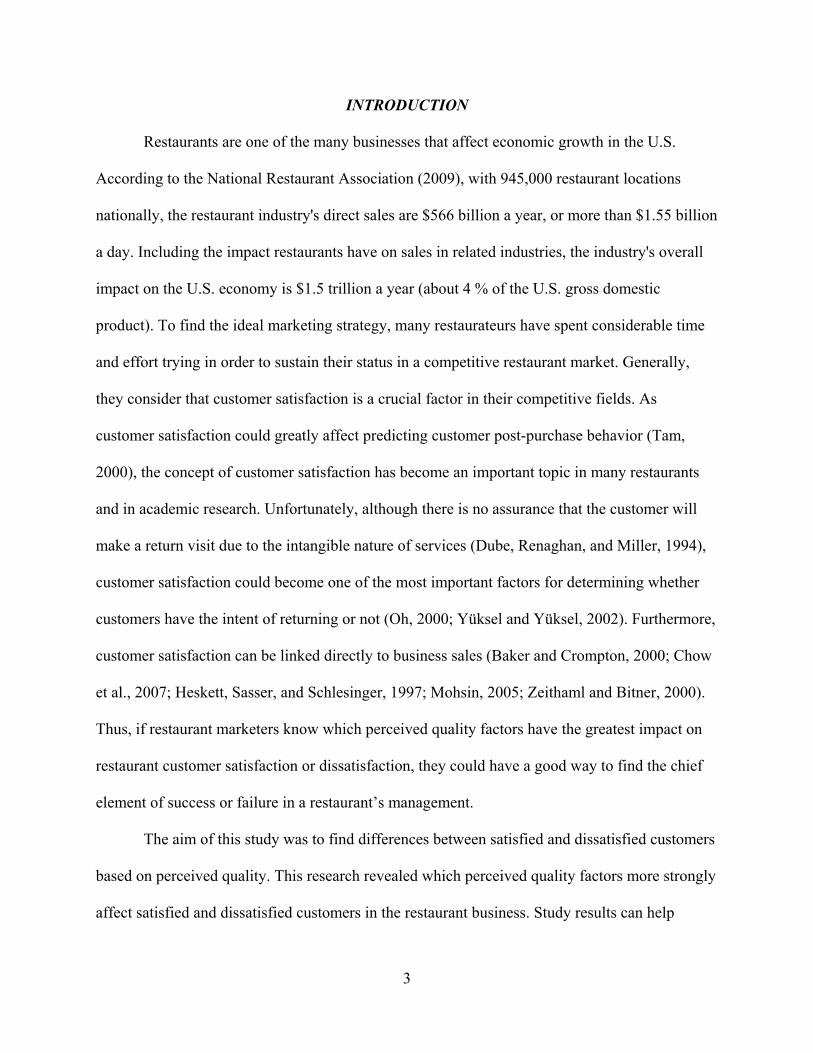
Table 3 presents a gain chart of the satisfied group. A gain chart is a table summarizing

the whole model with a description. As stated in the bar graph, certain nodes most represent

dependent variables on the graph. In the gain chart, we can know well what percentage each

node represents for the dependent variable. In the case of the satisfied group, the root node was

84.36% (n=77). Node 12 was computed by taking 99.62% (Gain: % computed from Node: N

divided by Resp: N) and then dividing it by 84.36% (root node). The results were 118.09%, the

index score for Node 12. Thus, nodes that had a gain index of over 100% were considered to be

groups showing a higher percentage of respondents with a higher satisfaction. In other words,

two variables (“I received a good value for my money,” “The food was tasty”) were important

factors in explaining the satisfied group.

13

Insert Table 3

Table 4 presents a gain chart of the dissatisfied group. In the case of the dissatisfied

group, the root node was 12.05% (n=77). Node 9 was computed by taking 100.00% (Gain: %

computed from Node: N divided by Resp: N) and then dividing it by 12.05% (root node). The

results are 829.78%, the index score for Node 9. That is, Node 9 (“I received a good value for

my money”: disagree, “The food was tasty”: disagree, “Service employees had adequate product

knowledge to make good suggestions for food”: disagree) represents a root node about 8.29

times. Thus, in the case of the dissatisfied group, three variables were important factors.

Insert Table 4

AnswerTree Analysis Results: Risk Chart

Table 5 shows a risk chart indicating the preciseness of classification. It is similar to the

percentage of classified respondents in the discriminant analysis. The risk estimate predicted the

risk incurred due to misclassification of the respondents in AnswerTree program. The less the

estimate, the more precisely classified was the model. Table 4 indicates a risk chart of “level of

satisfaction.” According to the results of the assessment of revisit intention, the risk estimate was

0.0384615. This means that the preciseness of classifying respondents on AnswerTree analysis

was 99.9615385%. That is, about 99.96% of the respondents were classified accurately on split

nodes.

Insert Table 5

14

DISCUSSION AND IMPLICATIONS

In today’s competitive business environment, customer satisfaction is the key to a

restaurant’s success (Chow et al., 2007; Heskett et al., 1997; Palmer, 2001). Especially because

of their significance in influencing post-purchase behavior (Tam, 2000), customer satisfaction

has long attracted the interests of many researchers. This study revealed that there were different

perceived quality factors in explaining customer satisfaction and dissatisfaction when using the

full-service restaurant. Among the respondents (n=390), 84.36% (n=329) indicated that the

experience of visiting the restaurant was good; on the other hand 12.05% (n=47) of the

respondents thought that the restaurant was bad and 3.59% (n=14) of them thought “neutral.”

Study results revealed that there were three descriptors which were ranked by the order of “I

received a good value for my money,” “The food was tasty,” and “Service employees had

adequate product knowledge to make good suggestions for food” to divide into satisfied and

dissatisfied groups. The first descriptor was “I received a good value for my money.” This result

could support previous studies (Jayanti and Gosh, 1996; Parasuranman et al., 1984; Zeithaml,

1988). They emphasized that high perception of perceived value leads to greater satisfaction, and

in turn, affects repurchase intentions. That is, high perception of perceived value triggers a

satisfying feeling. The second descriptor was “The food was tasty,” which was highly correlated

with satisfaction in this study. In other words, the restaurateur should pay more attention to taste

in food to enhance customer satisfaction, which finding is consistent with previous studies (Dube

et al., 1994; Witkowski, Ma, and Zheng, 2003). Finally the results also suggested that the level of

employees’ knowledge could be a critical factor that creates high satisfaction from restaurant

customers. Dissatisfied customers felt more dissatisfaction due to lack of employees’ knowledge.

15

According to Chow et al. (2007), service training is the key factor in increasing the ability of

employees to deliver good service and to satisfy customers' needs. Generally, because there is no

well-organized training system in the restaurant business except in well-known restaurants, some

employees have an imperfect knowledge of service, and therefore do not satisfy the customers.

From the managerial standpoint, although it costs a great deal to train employees, the restaurateur

should consider systematic training and also invest effort and time for the long-term view.

As “a high level of customer satisfaction leads to an increase in repeat patronage among

current customers” (Yüksel and Yüksel, 2002, p. 52), knowing which perceived quality factors

impact on customer satisfaction is important. In this research, AnswerTree indicated results of

significant and positive on the level of satisfaction based on perceived quality. Although it is

hard to say only perceived quality is enough to explain all customer satisfaction, it is necessary

in the competitive restaurant business. If restaurateurs are careless when measuring or focusing

on customer satisfaction, they can bring on business failures (Dube et al., 1994). That is, ignoring

customer satisfaction may cause lower customer satisfaction and reduced repeat business.

The following limitations for this research should be borne in mind. The data was

collected in the Miami area only. Thus, the findings might not be generalized to other areas.

Another limitation is that the results of this study cannot be applied in all services because the

focus is on restaurant services only. In addition, because its focus is on full-service restaurants

only, the findings must be applied to other restaurants, such as fast food restaurants or family

restaurants, with due caution.

REFERENCES

Almanza, B. A., Jaffe, W., & Lin, L. C. (1994). Use of the service attribute matrix to measure consumer satisfaction. Hospitality Research Journal, 17(2), 63-75.

16

Andaleeb, S. S., & Conway, C. (2006). Customer satisfaction in the restaurant industry: An examination of the transaction-specific model. Journal of Services Marketing, 20(1), 3- 11. Baker, D., & Crompton, J. (2000). Quality, satisfaction, and behavioral intentions. Annals of

Tourism Research, 27(3), 785-804. Barsky, J. D., & Labagh, R. (1992). A strategy for customer satisfaction. Cornell Hotel and

Restaurant Administration Quarterly, 33(5), 32-40. Berkman, H. W., & Gilson, C. (1986). Consumer behavior: Concepts and strategies, 3rd ed.

Boston: Kent. Berson, A., Smith, S., & Thearling, K. (2000). Building data mining applications for CRM.

McGraw-Hill.:USA. Carman, J. M. (1990). Consumer perceptions of service quality: An assessment of the SERVQUAL dimensions. Journal of Retailing, 66(2), 33-55. Chen, J. S. (2003). Market segmentation by tourists’ sentiments. Annals of Tourism Research, 30(1), 178-193. Chow, I. H.-s., Lau, V. P., Lo, T. W.-c., Sha, Z., & Yun, H. (2007). Service quality in restaurant

operations in China: Decision- and experiential-oriented perspectives. International Journal of Hospitality Management, 26(3), 698-710.

Dube, L., Renaghan, L. M., & Miller, J. M. (1994). Measuring customer satisfaction for strategic management. Cornell Hotel and Restaurant Administration Quarterly, 35(1), 39-47.

Dukart, J. R. (1998). Quality: Do you measure up?. Utility Business, 1(4), 32-38. Gabbie, O., & O'Neil, M. (1996). SERVQUAL and the Northern Ireland hotel sector: A

comparative analysis. Managing Service Quality, 6(6), 25-32. Haughton, D., & Oulabi, S. (1997). Direct marketing modeling with CART and CHAID. Journal of Interactive Marketing, 11(4), 42-53. Heskett, J. R., Sasser, W. E., & Schlesinger, L. (1997). The service profit chain: How leading

companies link profit and growth to loyalty, satisfaction, and value. Free Press, New York.

Heung, V. C. S., Wong, M. Y., & Qu, H. (2000). Airport restaurant service quality in Hong Kong: An application of SERVQUAL. Cornell Hotel and Restaurant Administration Quarterly, 41(3), 86-97.

James, L. W. (1995). Service encounter satisfaction: Conceptualized. Journal of Services Marketing, 9(1), 5-14. Jayanti, R. K., & Gosh, A. K. (1996). Service value determination: An integrative perspective. Journal of Hospitality & Leisure Marketing, 3(4), 5-25. Johns, N., & Tyas, P. (1996). Investigation of the perceived components of the meal experience,

using perceptual gap methodology. Progress in Tourism and Hospitality Research, 3(1), 15-26.

Kass, G. (1980). An exploratory technique for investigating large quantities of categorical data. Applied Statistics, 29(2), 119-127. Kivela, J., Inbakaran, R., & Reece, J. (1999). Consumer research in the restaurant environment,

Part 1: A conceptual model of dining satisfaction and return patronage. International Journal of Contemporary Hospitality Management, 11(5), 205-222.

Leal, R. P., & Pereira, Z. L. (2003). Service recovery at a financial institution. International Journal of Quality and Reliability Management, 20(6), 646-663.

17

Levin, N., & Zahavi, J. (2001). Predictive modeling using segmentation. Journal of Interactive Marketing, 15(2), 2-22. Magidson, J. (1994). The CHAID approach to segmentation modeling: Chi-Square automatic interaction detection. Advanced Method of Marketing Research, Blackwell, Cambridge

MA. Mohsin, A. (2005). Service quality perceptions: An assessment of restaurant and café visitors in

Hamilton, New Zealand. The Business Review, 3(2), 51-57. National Restaurant Association (2009). Restaurant Industry Overview. Retrieved from

http://www.restaurant.org/research/ind_glance.cfm Oh, H. (1999). Service quality customer satisfaction and customer value: A holistic perspective. Hospitality Management, 18(1), 67-82. Oh, H. (2000). Diners' perceptions of quality, value, and satisfaction: A practical viewpoint. Cornell Hotel and Restaurant Administration Quarterly, 41(3), 58-66. Oliver, R. L. (1980). A cognitive model of the antecedents and consequences of satisfaction decistions. Journal of Marketing Research, 17(11), 460-469. Oliver, R. L. (1981). Measurement and evaluation of satisfaction processes in retail settings.

Journal of Retailing, 5(7), 25-48. Oliver, R. L., & DeSarbo, W.S. (1988). Response determinants in satisfaction judgments. Journal of Consumer Research, 14(3), 495-507. Palmer, A. (2001). Principles of service marketing. McGraw-Hill, New York. Parasuraman, A., Berry, L. L., & Zeithaml, V. A. (1991). Understanding customer expectations

of service. Sloan Management Review, 32(3), 420-450. Parasuraman, A., Zeithaml, V. A., & Berry, L. L. (1985). A conceptual model of service quality

and its implications for future research. Journal of Marketing, 49(4), 41-50. Parasuraman, A., Zeithaml, V. A., & Berry, L. L. (1988). SERVQUAL: A multiple-item scale for measuring consumer perceptions of service quality. Journal of Retailing, 64(1), 12- 40. Parasuraman, A., Zeithaml, V. A., & Berry, L. L. (1994). Reassessment of expectations as a comparison standard in measuring service quality: Implications for further research. Journal of Marketing, 58(1), 111-124. Pizam, A., & Ellis, T. (1999). Customer satisfaction and its measurement in hospitality

enterprises. International Journal of Contemporary Hospitality Management, 11(7), 326-347. Raajpoot, N. A. (2002). TANGSERV: A multiple item scale for measuring tangible quality in

foodservice industry. Journal of Foodservice Business Research, 5(2), 109-127. Rust, R. T., & Oliver, R. L. (1994). Service quality: Insights and managerial implications from

the frontier, Sage, Thousand Oaks, CA. SPSS (1998). AnswerTree 2.0 User’s Guide, Retrieved from

http://www.uic.edu/classes/idsc/ids422/trees.pdf SPSS (2009). How decision tree results are different in AnswerTree. Retrieved from

http://www.spss.com/answertree/decisiontrees.htm Stevens, P., Knutson, B., & Patton, M. (1995). DineServ: A tool for measuring service quality in

restaurants. Cornell Hotel and Restaurant Administrative Quarterly, 36(3), 56-60. Tam, J. L. M. (2000). The effects of service quality perceived value and customer satisfaction on behavioral intentions. Journal of Hospitality & Leisure Marketing, 6(4), 31-43.

18

Tse, D., & Wilton, P. C. (1988). Models of consumer satisfaction formation: An extensive. Journal of Marketing Research, 25(2), 204-212.

Umbrell, C. (2003). Gold star service. American-Gas, 85(4), 14-16. Vavra, T. G. (1997). Improving your measurement of customer satisfaction: A guide to creating, conducting, analyzing, and reporting customer satisfaction measurement programs, ASQ

quality press. Witkowski, T. H., Ma, Y., & Zheng, D. (2003). Cross-cultural influences on brand identity

impressions: KFC in China and the United States. Asia Pacific Journal of Marketing and Logistics, 15(1/2), 74-88.

Yüksel, A., & Yüksel, F. (2002). Measurement of tourist satisfaction with restaurant services: A segment-based approach. Journal of Vacation Marketing, 9(1), 52-68. Zeithaml, V. A. (1988). Consumer perceptions of price quality and value: A means-end model and synthesis of evidence. Journal of Marketing, 52(3), 2-22. Zeithaml, V. A., & Bitner, M. J. (2000). Services Marketing: Integrating Customer Focus Across

the Firm, McGraw-Hill NY.

19

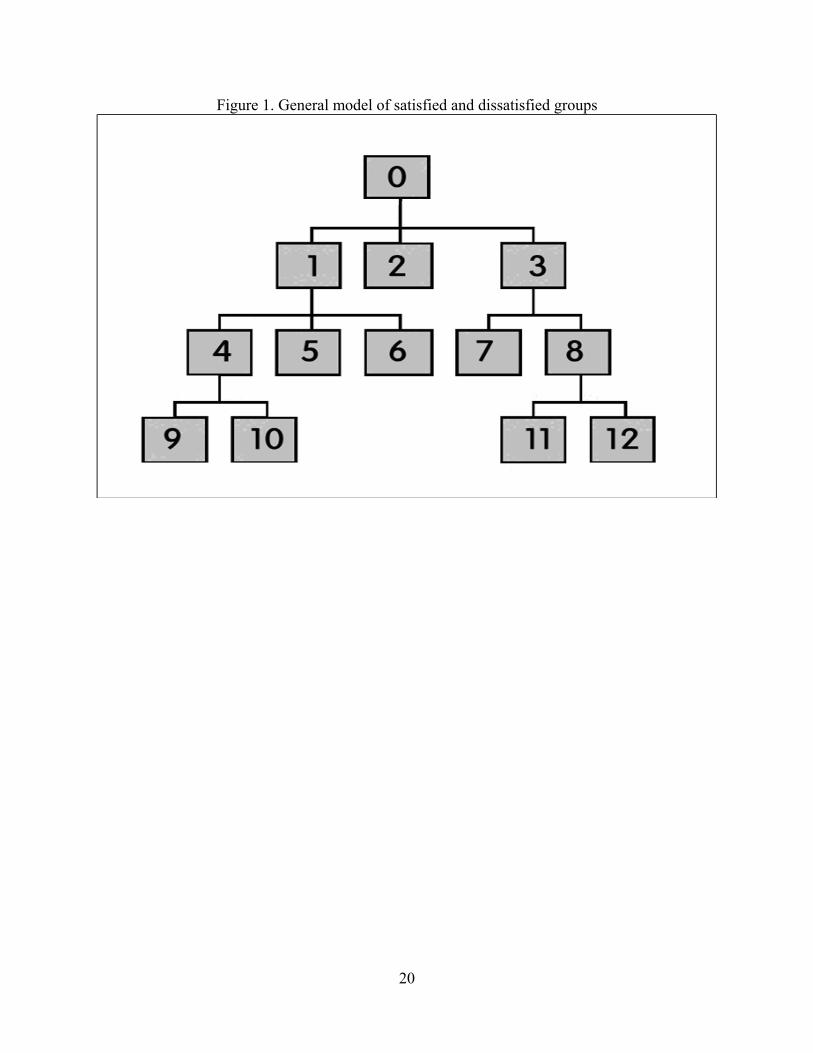
Figure 1. General model of satisfied and dissatisfied groups

20

Figure 2. The result of the satisfied group

21

Figure 3. The result of the dissatisfied group

22

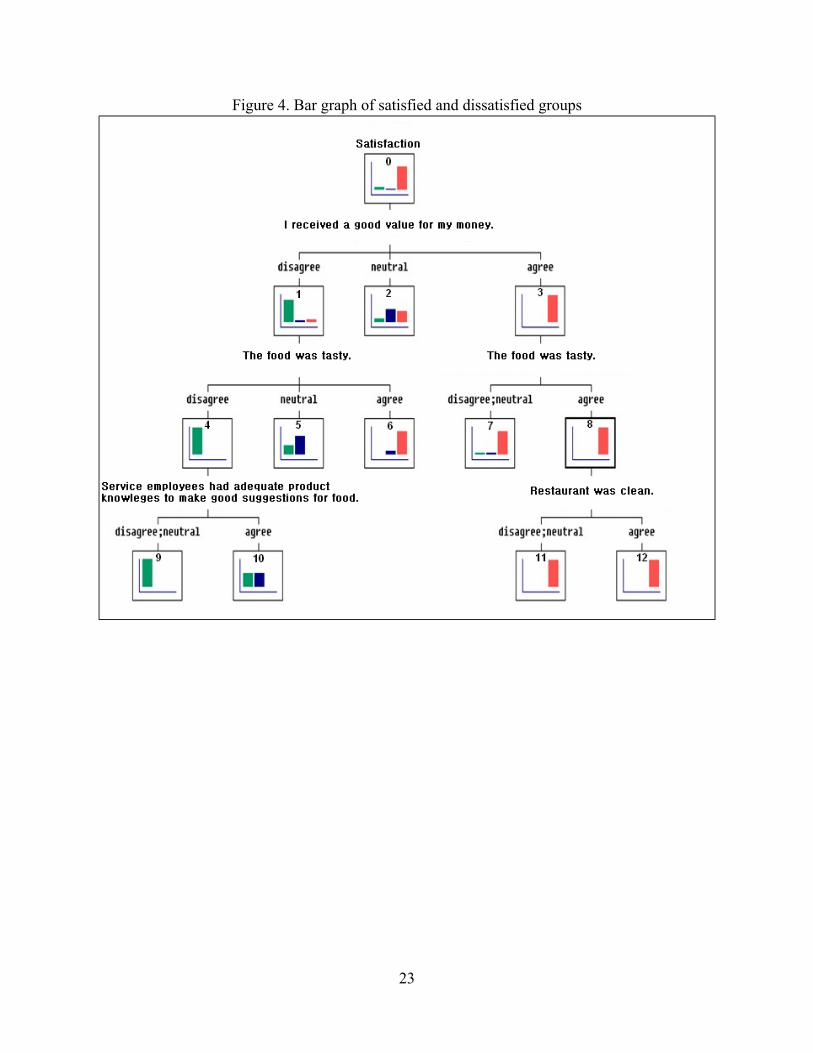
Figure 4. Bar graph of satisfied and dissatisfied groups

23

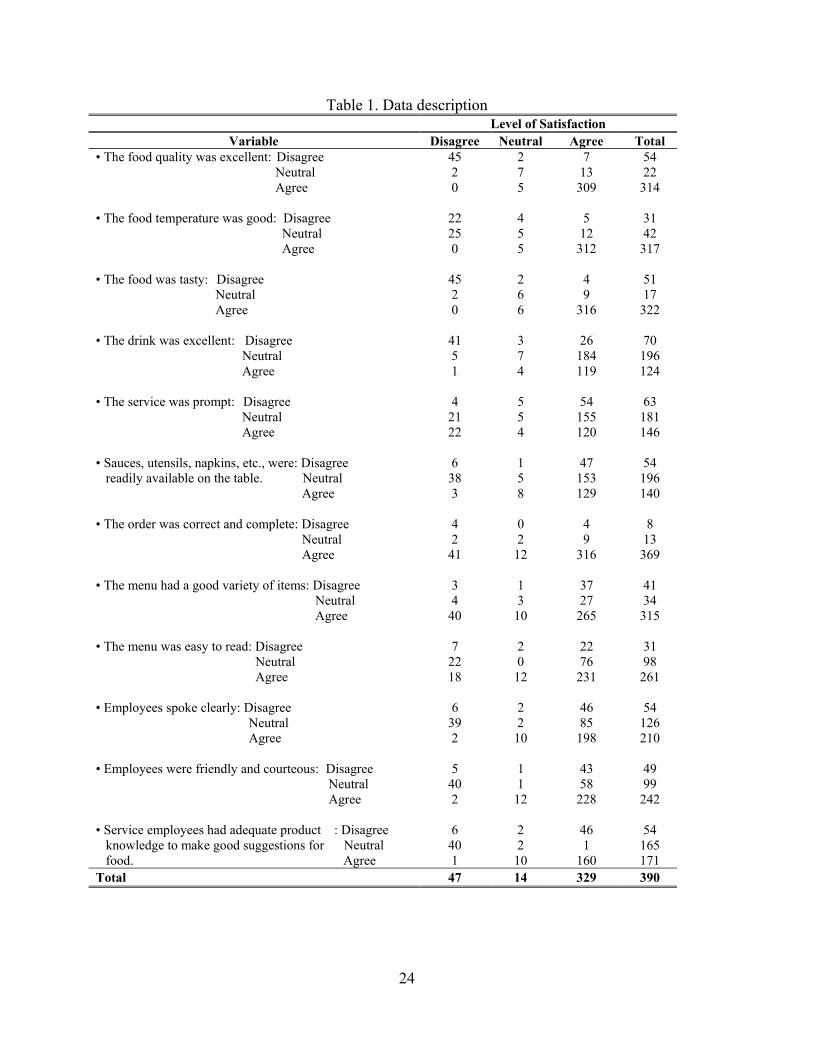
Table 1. Data description Level of Satisfaction Variabl e Disagree Neutral Agree Total

• The food quality was excellent: Disagree 45 2 7 54 Neutral 2 7 13 22 Agree 0 5 309 314 • The food temperature was good: Disagree 22 4 5 31 Neutral 25 5 12 42 Agree 0 5 312 317 • The food was tasty: Disagree 45 2 4 51 Neutral 2 6 9 17 Agr ee

• The drink was excellent: Disagree

0 6 316 322

41 3 26 70 Neutral 5 7 184 196 Agree 1 4 119 124 • The service was prompt: Disagree 4 5 54 63 Neutral 21 5 155 181 Agree 22 4 120 146 • readily available on the table. Neutral Sauces, utensils, napkins, etc., were: Disagree 6

38 1 5

47 153

54 196

Agree 3 8 129 140 • The order was correct and complete: Disagree 4 0 4 8 Neutral 2 2 9 13 Agree 41 12 316 369 • The menu had a good variety of items: Disagree 3 1 37 41 Neutral 4 3 27 34 Agree 40 10 265 315 • The menu was easy to read: Disagree 7 2 22 31 Neutral 22 0 76 98 Agree 18 12 231 261 • Employees spoke clearly: Disagree 6 2 46 54 Neutral 39 2 85 126 Agree 2 10 198 210 • Employees were friendly and courteous:: Disagree 5 1 43 49 Neutral 40 1 58 99 Agree 2 12 228 242 • knowledge to make good suggestions for Neutral Service employees had adequate product : Disagree

food. :Agree

6 40 1

2 2

10

46 1

160

54 165 171

Total 47 14 329 390

24

Table 1 (continued) Level of Satisfaction Variable Disagree Neutral Agree Total

• The employee uniform was appropriate: Disagree 6 2 7 15 Neutral 3 2 154 159 Agree 38 10 168 216 • Restaurant had a good ambience: Disagree 7 0 31 38 Neutral 2 8 18 28 Agree 38 6 280 324 • Restaurant was clean: Disagree 7 5 21 44 Neutral 2 3 13 18 Agree 38 6 284 328 • Restaurant had adequate parking spaces: Disagree 5 3 16 24 Neutral 2 3 64 69 Agree 40 8 249 297 • Location of the restaurant was convenient: Disagree 19 4 5 28 Neutral 3 3 59 65 Agree 25 7 265 297 • I received a good value for my money: Disagree 44 4 6 54 Neutral 2 7 6 15 Agree 1 3 317 321 Total 47 14 329 390

25

Table 2. Demographic profiles of the respondents Characteristics Frequency Percent (%)

Gender Female 187 47.9 Male 203 52.1 Age (Years) Below 30 144 36.9 31 – 40 124 31.8 40 - 51 78 20.0 Over 51 44 11.3 Marital status Single 154 39.5 Married 230 59.0 Widow / Widower 2 0.5 Divorced 4 1.0 Ethnicity Black/afro-American 80 20.5 White/Caucasian 132 33.8 Asian 82 21.0 Hispanic 92 23.6 Other 4 1.0 Income ($) Below 40000 129 33.1 41000 – 50000 114 29.2 51000 – 60000 26 6.7 61000 – 70000 28 7.2 71000 – 80000 27 6.9 Over 81000 66 16.9 Total 390 100.0

26

Table 3. Gain chart of the satisfied group Target variable: Important Factor; Target category: Agree

Node by Node Node Node: N Node: % Resp: N Resp: % Gain: % Index: %

12 267 68.46 266 80.85 99.62 118.09 11 41 10.51 40 12.16 97.56 115.64 6 7 1.79 6 1.82 85.71 101.60 7 13 3.33 11 3.34 84.61 100.30

27

Table 4. Gain chart of the dissatisfied group Target variable: Important Factor; Target category: Disagree

Node by Node Node Node: N Node: % Resp: N Resp: % Gain: % Index: %

9 42 10.77 42 89.36 100.00 829.78 10 2 0.51 1 2.13 50.00 414.89 5 3 0.77 1 2.13 33.33 276.59

28

29

Table 5. Risk chart of satisfied and dissatisfied groups Misclassification Matrix

Actual Category No Soso Yes Total

No 43 1 0 44 Soso 3 9 6 18 Yes 1 4 323 328

Predicted Category

Total 47 14 329 390 Resubstitution

Risk Estimate 0.0384615 SE of Risk Estimate 0.00973788


Recommended