FACTORS INFLUENCING PERFORMANCE OF YOUTH OWNED SMALL AND MEDIUM ENTERPRISES. A CASE OF MAARA SUB- COUNTY; THARAKA-NITHI COUNTY; KENYA AKWALU PETER THIS RESEARCH PROJECT REPORT IS SUBMITTED IN PARTIAL FULFILMENT OF THE REQUIREMENT FOR THE AWARD OF THE DEGREE OF MASTERS OF ARTS IN PROJECT PLANNING AND MANAGEMENT OF THE UNIVERSITY OF NAIROBI 2014
Transcript
FACTORS INFLUENCING PERFORMANCE OF YOUTH OWNED
SMALL AND MEDIUM ENTERPRISES. A CASE OF MAARA SUB-
COUNTY; THARAKA-NITHI COUNTY; KENYA
AKWALU PETER
THIS RESEARCH PROJECT REPORT IS SUBMITTED IN PARTIAL
FULFILMENT OF THE REQUIREMENT FOR THE AWARD OF THE
DEGREE OF MASTERS OF ARTS IN PROJECT PLANNING AND
MANAGEMENT OF THE UNIVERSITY OF NAIROBI
2014
ii
DECLARATION
This research project report is my original work and has not been presented for a degree or any
award in any other university.
Signature……………………………… Date………………………………
Akwalu Peter
L50/60885/2013
This research project report has been presented for examination with our approval as the
university supervisors.
Signature……………………………… Date………………………………
Dr. Cecilia Ritho.
Lecturer
Department of Agricultural Economics
University of Nairobi, Kenya
Signature……………………………… Date………………………………
Dr Chandi J. Rugendo
Lecturer
School of Continuing and Distance Education
Department of Extra Mural Studies
University of Nairobi, Kenya
iii
DEDICATION
This research project report is dedicated to my beloved wife Sabina Wairimu and my son
Bravine Gitonga who have given me love, support and encouragement. I also dedicate it to my
beloved parents, Mr. Cyprian Akwalu and Mrs. Esther Akwalu, for their both moral and
inspirational support.
iv
AKNOWLEDGEMENT
I would like to express my gratitude to the following for their various contributions that made
this Research Project report a success. My supervisors Dr Cecilia Ritho and Dr. Chandi J.
Rugendo for the guidance, encouragement and valuable advice in undertaking this Research
Project report since the inception. I would also like to appreciate my lectures who have taught
me at Nairobi University Meru extra mural Campus since the commencement of my master
degree programme. I also recognize the support of my colleagues Josephine Nzioka, Mutuma,
Nyaga, Faith and the entire 2012 Project Planning and Management class Meru Extra Mural
Campus for their support and companionship. May God bless you abundantly.
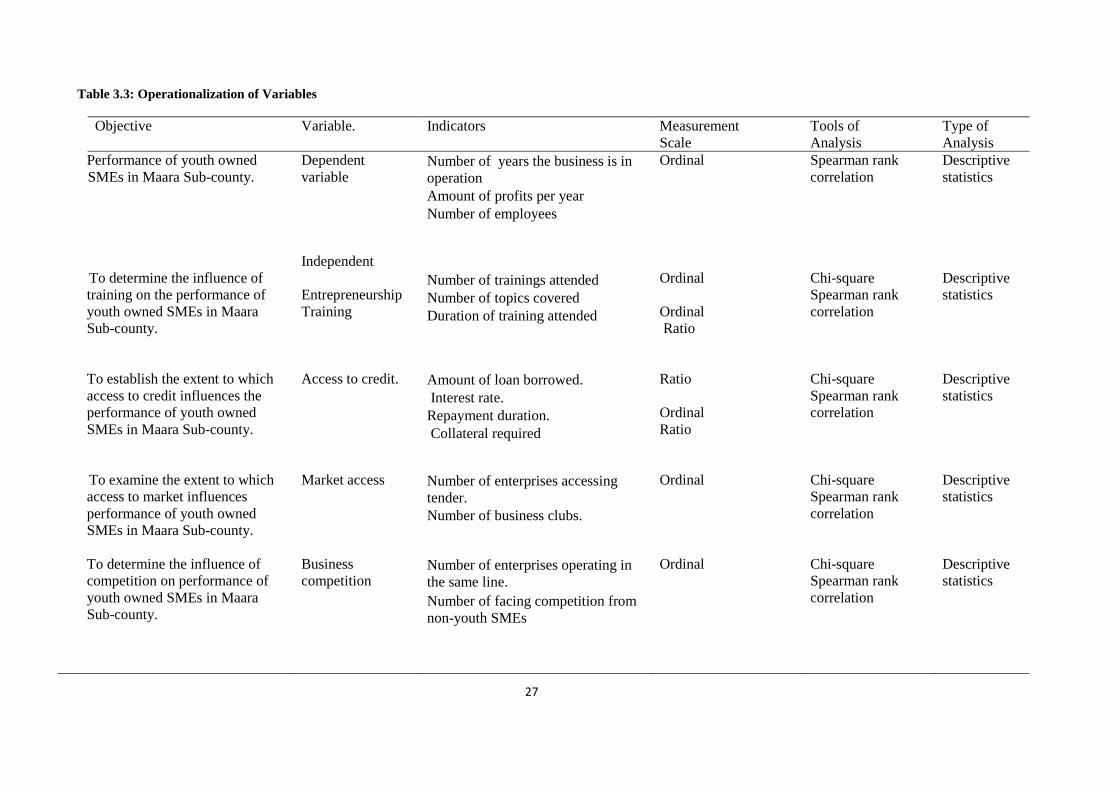
Table 3.3: Operationalization of Variables .............................................................................. 27
Table 4.1 Demographic information ........................................................................................ 28
Table 4.2 Duration of the training attended by respondents .................................................... 29
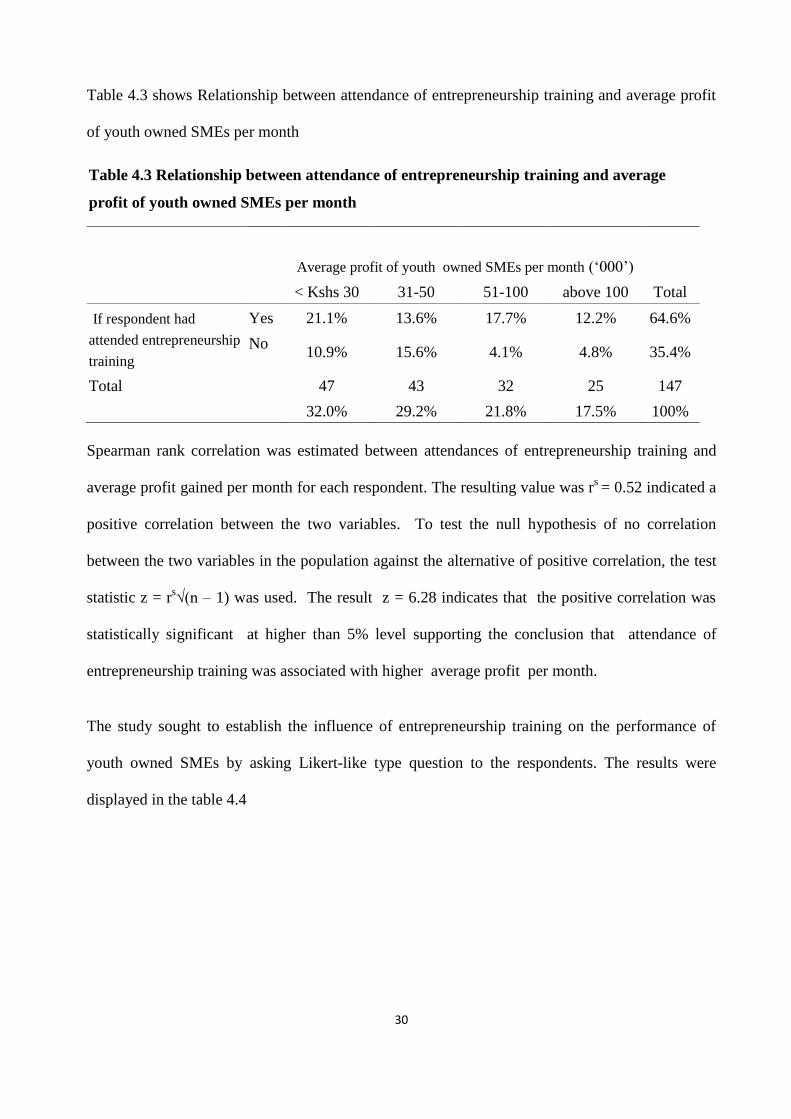
Table 4.3 Relationship between attendance of entrepreneurship training and average profit of
youth owned SMEs per month ................................................................................................. 30
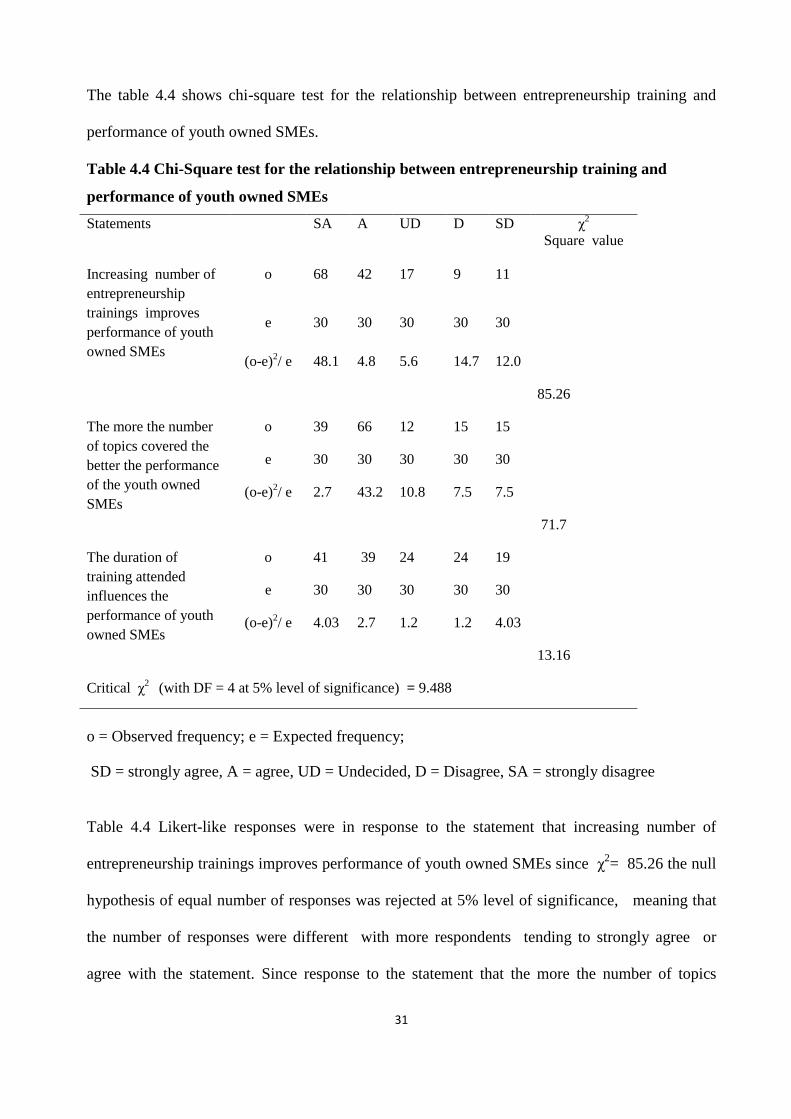
Table 4.4 Chi-Square test for the relationship between entrepreneurship training and
performance of youth owned SMEs ......................................................................................... 31
Table 4.5 Average loan obtained by respondents. ................................................................... 32
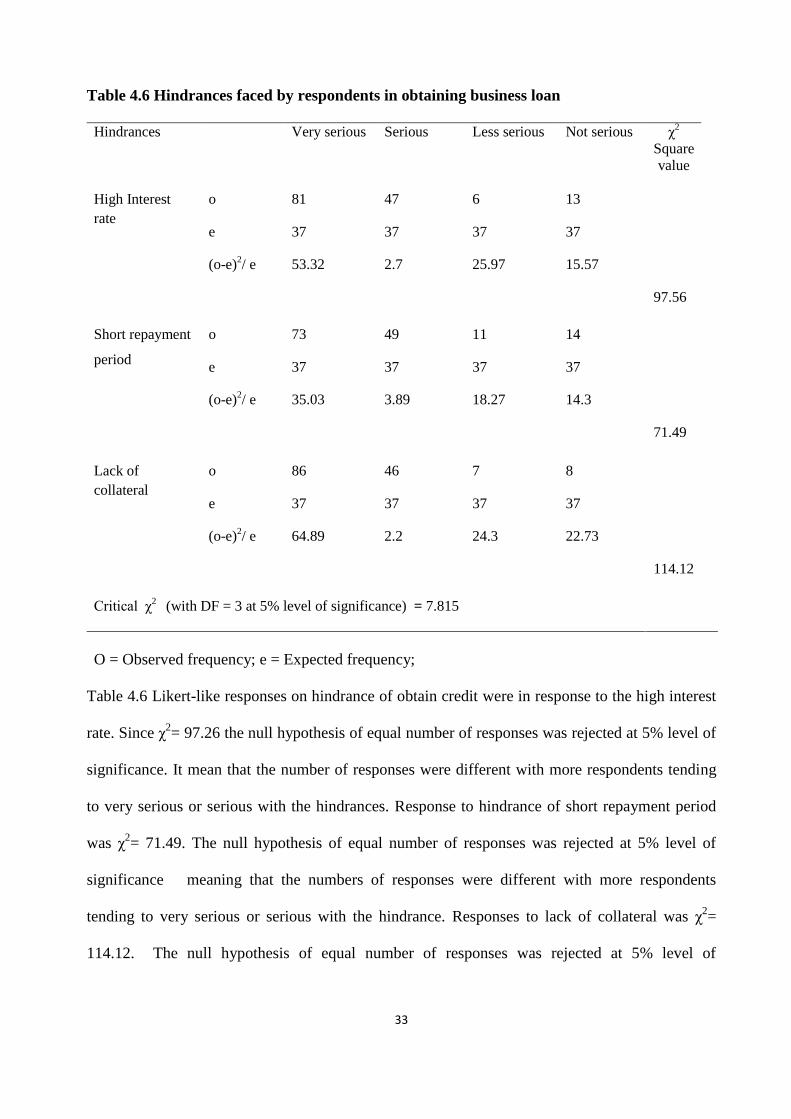
Table 4.6 Hindrances faced by respondents in obtaining business loan .................................. 33
Table 4.7 Relationship between respondents average profit per month and extent to which they
think credit access influence the performance of youth owned SMEs .................................... 34
Table 4.8 Relationship between respondent’s average profit per month and extent to which
respondents think access to market influence the performance of youth owned SMEs .......... 35
Table 4.9 Chi-Square test for the relationship between business competition and performance
of youth owned SMEs .............................................................................................................. 36
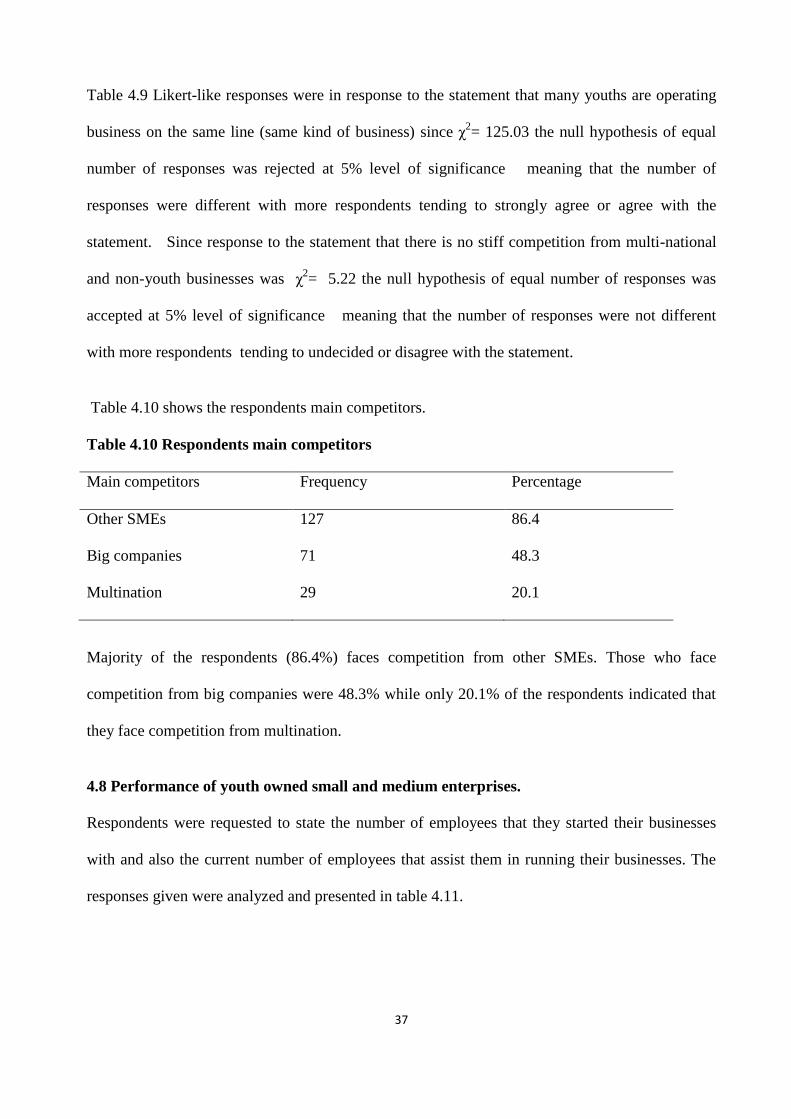
Table 4.10 Respondents main competitors .............................................................................. 37
Table 4.11 Number of employees during start-up and current employees .............................. 38
Table 4.12 Number of years the business was in operation against average profit per month 38
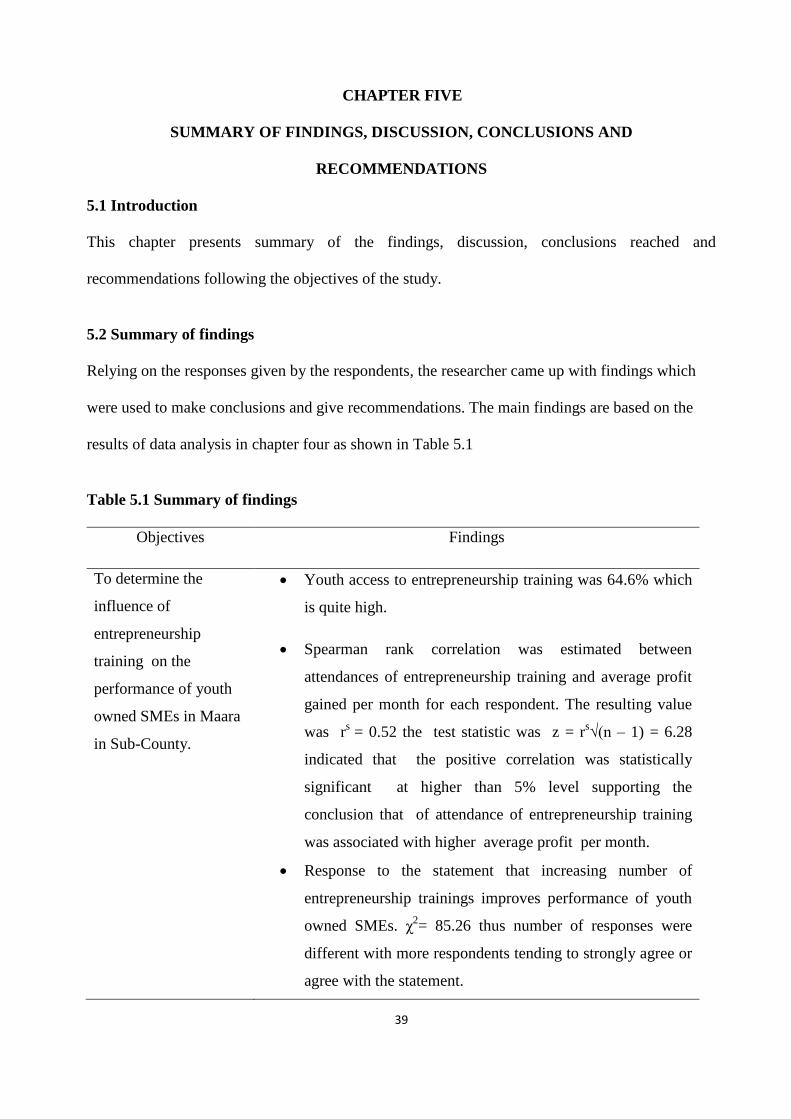
Table 5.1 Summary of findings ................................................................................................ 39
viii
LIST OF FIGURES Figure 1: Conceptual framework .......................................................................................................... 20
ix
ABBREVIATIONS AND ACRONYMS
AGOA African Growth and Opportunity Act
CYB Canadian Youth Foundation.
C-YES Constituency Youth Enterprise
GOK Government of Kenya
KNBS Kenya National Bureau of Statistics
MFI Micro Finance Institution
MOYA Ministry of Youth Affairs
NGO Non-Governmental Organization
SACCO Savings and Credit Co-Operative.
SME Small and Medium Enterprises
SPSS Statistical Package for Social Sciences
UNDP United Nation Development Programme
YEDF Youth Enterprise Development Fund
x
ABSTRACT
Small and Medium enterprises (SMEs) contribution to the Kenyan economy is widely
acknowledged, they cut across all sectors of the economy and provide many employment
opportunities and generate widespread economic benefits. Youth owned Small and Medium
Enterprises are faced with several challenges in their operations. SMEs face a mixture of
success and failure with past statistics indicating that three out five fail within the first few
months of operation The purpose of this study was to investigate factors influencing the
performance of youth owned Small and Medium Enterprises in Maara sub-county; Tharaka-
Nithi county. The objectives of the study include: establishing the influence of
entrepreneurship training on the performance of youth owned SMEs; examining how access to
credit facilities influences performance of youth owned Small and medium Enterprises;
establish how access to market influences the performance of the youth owned SMEs and
determine how business competition influences the performance of the youth owned SMEs. To
achieve this, the study adopted descriptive research design where the respondents were
requested to describe the circumstances facing their business operations. The target population
of the study was 230 youth owned Small and Medium Enterprises within Maara sub-county
Tharaka –Nithi County. The sample size was 147 youth owned small and medium enterprises.
Purposive sampling was used to identify 230 youth owned SMEs in Maara sub-county which
were operating SMEs at the time of the study. The youth owned small and Medium Enterprises
was then be clustered into five clusters. A semi structured questionnaire was used in data
collection. The completed questionnaires were coded, entered into SPSS and presented using
frequency tables and percentages. The study concludes that entrepreneurship training, access to
credit, access to market and business competition the performance of youth owned enterprises.
The study also established that entrepreneurship training affected the performance of the
enterprises. Access to credit facilities influenced performance youth enterprises to a great
extent. Business Competition determines the performance of the youth owned enterprises
because of its effects on the ability of the businesses to cover their operational costs. Further
access to market influences the performance of the youth enterprises due to the fact that many a
times the youth have limited or no access to timely, simplified, production technology and
government regulations they are unable to perform and survive in the fast changing,
increasingly globalized and highly competitive environment. This study recommended that the
youth entrepreneurs be trained on entrepreneurship skills including business management and
the general reputation, acceptance and credibility of entrepreneurs in society would help to
overcome these challenge. The study further recommended that Microfinance institutions
continuously engage the youth entrepreneurs in providing finance and entrepreneurial
knowledge to the poor in the society as this would lead to creation of jobs and reduced poverty
levels in a country. The study also recommended that the Government provides more space for
entrepreneurs to work from. The study finally recommends that more cheaper and efficient
marketing strategies be advocated among youth entrepreneurs to improve their reach to their
customers.
1
CHAPTER ONE
INTRODUCTION
1.1 Background of the study
The importance of Small and Medium enterprises (SMEs) in contributing to job creation and
output growth is now widely accepted in both developed and developing countries. Small and
Medium Enterprises are regard as the backbone of the economy (Welter and Smallbone
2011).There is no single criterion for classifying business enterprises as small or medium scale
globally. In a study carried out by International labour Organization (2005), over 50 definitions
were identified in 75 different countries. However, evidence from literature shows that in
defining small- scale business, reference is usually made to some quantifiable measures such
as: number of people employed by the enterprises, investment outlay, the annual turnover
(sales) and the asset value of the enterprise or a combination of these measures. Small and
Medium enterprises has a number of benefits. One of its major significant benefits is that Small
and Medium enterprises contributes to the creation of self-employment among those youth
operating businesses and jobs to those who are employed in those enterprises amidst high level
of unemployment.
Since the beginning of the 1990s, small and medium-sized enterprises , as remained one of the
main avenues for building a vibrant and competitive private sector in many countries. Support
for the SME sector has also become an increasingly important part of the industrial policy of
the European Union (EU) over the last 10 years. The SMEs, has been a central pillar for the
creation of the world’s most dynamic and competitive European economy. According to data
from the European observatory (ENSR, 2005) Small and medium enterprises that employing
up to 100 people accounted for 68 million jobs in the European Union in 2005. In Nigeria
Small and medium enterprises account to 95 percent of formal manufacturing activity and 70
percent of individual jobs. In south Africa Small and medium enterprises provided more than
2
55 percent of total employment and 22 percent gross domestic product (GDP) in
2003(OECD,2005). In Botswana small and medium enterprises employs majority of youth and
women which youth accounts for 49 percent. In bid to improve the youth owned small and
medium enterprises government of Botswana created government credit schemes youth
development fund to provide credit to youth owned SMEs at affordable interest and also
provide capacity building (Friedman, 2009).
The mortality rate of Small and medium enterprises in Africa remain very high for example
Mead (2010) in the study of five African countries found that most firms started with 1-5
employees and never expanded. Furthermore less than 1 percent grew to a size of about 10
employees. Friedman (2009) in his study of 214 small enterprises in the northern region of
Nigeria within an eight year period reported that only 4 had graduated into medium firms.
The promotion of youth owned Small and Medium enterprises (SMEs) is fundamental to the
achievement of MDG 8, target 16 which focuses on developing decent and productive work for
youth. This has a significant effect of bringing back the alienated and marginalized youth into
the economic mainstream thereby addressing some of the socio-psychological problems and
delinquency which occur due to joblessness (Welter and Smallbone 2011). Action on youth
unemployment must be integrated as a central platform for achieving; MDG 1 on poverty
reduction and hunger as well as Kenya Vision 2030. The achievement of MDG 1 has a bearing
to the achievement of other MDGs in particular MDG 3, target 11 which promotes an increase
in the share of women on wage employment in Nonagricultural particularly in Africa where
socio-cultural constraints tend to affect the participation of female youth in self-employment.
SMEs contribution to the Kenyan economy is widely acknowledged, they cut across all sectors
of the economy and provide many employment opportunities and generate widespread
economic benefits (Government of Kenya, 2005). The National Census Survey of Kenya
3
(2009) revealed that 64 percent of its population was engaged in Small and Medium-Enterprise
(KNBS, 2010). According to the economic survey of 2003, the SMEs sector accounted for
74.2% of the total persons engaged in employment and contributed up to 18.4% of the Kenya’s
GDP in 2003. Economic recovery strategy for wealth and employment creation 2003-2007
recognized the need to establish and maintain a favorable environment for the growth and
transformation of small businesses into medium sized enterprises that can have capacity to
create more employment opportunities (GOK, 2005).
In Kenya today, businesses employing between 1 to 99 people account for about 48 percent of
all businesses; with a majority of these being managed or owned by the young people (25-34
years) (Njonjo, 2010). According to Government of Kenya (2007), three out of five of these
businesses fail within the first Three years of operation and those that continue 80 percent fail
before the fifth year. This failure of enterprises performance is marked by poor return and
bankruptcy proceedings, (Saleemi, 2009), having noted how important the contribution of
SMEs sector is in Kenya; despite their poor performance. Leadership must be increased to
effectively respond to the challenges of creating productive and sustainable employment
opportunities in the country amongst the youths, (Kariuki, 2010)
Although generally in Kenya there has been an increase in the promotion of youths owned
enterprises, not much has been achieved. These promotions have been through the affirmative
action like establishment of Youth Enterprise Development Fund (YEDF) in 2007. Budget of
2013/2014 set an ambitious youth and women empowerment programme (uwezo fund) by
allocating 6 billion as revolving fund to be loaned to the youths and women, the presidential
directive of thirty (30) percent access to government procurement opportunities to youth,
women and persons with disabilities (GOK, 2013). Maara sub-county has a total population of
107, 125, out of which 35,238 are aged between 15-34 years representing approximately 32.9%
4
of its total population (KNBS, 2010). The sub-county is characterized by high potential of both
agricultural and non-agricultural activities as well as multiple of small and medium businesses.
Data from the sub-county youth office indicates that the youth owned enterprises are in both
the informal sector like agriculture, kiosk, building and construction and formal sector like
legal, medical, business consultancy services. It is against this background that the study of the
factors influencing performance of youth owned Small and Medium enterprises is necessary.
1.2 Statement of the problem
Small and Medium Enterprises (SMEs) sector plays an important role in income and
employment creation as well as poverty alleviation. The government has embraced the
formulation of policies favorable to development of small and medium enterprises since the
year 2003. Such policy initiatives include Sessional Paper number 2 of 2005 on development
of SMEs for wealth and employment creation (Government of Kenya, 2005) .Sector Plan for
labour, youth and human resource development 2008-2012 (Republic of Kenya, 2008); and
SME bill 2006 which led to the establishment of a council to facilitate the development of
SMEs and creation of SMEs development fund (Government of Kenya, 2006). In addition, the
Ministry of Youth Affairs (MoYA) established Youth Enterprise Development Fund (YEDF)
in the year 2007 (MoYA, 2008) as a source of capital for youths in Kenya to start and/or boost
their SMEs (Onugu, 2005). The government has also initiated other programmes like Jitihada
Business Plan Competition; the government undertook a training programme for entrepreneurs
under the Micro, Small and Medium Enterprises competitive project in the Ministry of
Industrialization Implemented by the Kenya Institute of Management in partnership with Jomo
Kenyatta University of Agriculture and Technology and Techno Serve, (GOK, 2012).
Most commercial banks and financial institutions have also developed SME tailored strategies
to enable the young entrepreneurs in groups and as individuals to access loans like equity bank
5
in year 2012 which acquired 4 billion shillings loan from Chinaserves to support the SME
sector (GOK, 2012).
Despite these interventions by the government and private sector to boost the performance of
SME sector, the youth SMEs have not been performing as expected (Wanjohi, 2010).
According to the data from Chogoria town council, Youth owned enterprises have increased in
Maara sub-county from 186 in the year 2012 to 203 in the year 2013. Those who were
registered as new enterprises in year 2013 were 48 meaning some youth businesses did not
survive up to year 2013. Studies elsewhere have identified the factors influencing small and
medium enterprises (SMEs) in general but with no specific focus on factors influencing the
performance youths owned small and medium enterprises in Maara sub-county and Tharaka-
Nithi County in general. Therefore, this study seeks to establish the factors influencing
performance of youth owned small and medium enterprises in Maara sub-county, Tharaka-
Nithi County.
1.3 The purpose of this study
The purpose of the study was to investigate the factors that influence performance of youth
owned small and medium enterprise (SMEs) in Maara sub-county. It was expected to shed
more light on the factors that influence performance of youth owned small and medium
enterprise (SMEs) and guide policy makers and particularly the youths in formulating policies
and strategies that will address performance of sustainable youth owned small and medium
enterprises in the area and Kenya in general.
1.4 Objectives of the study
The study was guided by the following objectives:
i. To determine the influence of entrepreneurship training on the performance of
youth owned SMEs in Maara in Sub-County.
6
ii. To establish how access to credit facilities influences the performance of youth
owned SMEs in Maara Sub-County.
iii. To examine how access to market influences performance of youth owned SMEs in
Maara Sub-County.
iv. To determine how business competition influence performance of youth owned
SMEs in Maara Sub-County.
1.5 Research Questions
The research questions of the study were.
i. How does entrepreneurship training influence the performance of youth owned SMEs
in Maara Sub-County?
ii. To what extent does access to credit facilities influence the performance of youth
owned SMEs in Maara Sub-County?
iii. To what extent does access to market influence the performance of youth owned SMEs
in Maara Sub-County?
iv. How does business competition influence the performance of youth owned SMEs in
Maara Sub-County?
1.6 Significance of the study
It is hoped that this study will be useful to youths, policy makers in government institutions,
private sector, Non-Governmental Organizations, among others. The youths can use the
findings to improve the performance of their enterprises. The government can use the findings
to develop appropriate policies to help the youths. This includes empowering the youths to be
successful entrepreneurs. The private sector can use these findings to identify areas where
SMEs can be funded. Credit provision is an important role of financial institutions.
Understanding credit accessibility behavior is therefore of great importance to them. The Non-
7
Governmental organizations can use the findings to develop various strategies and programs
that aim to empower the youths and address the challenges they face in the operation of their
SMEs. The findings of this study will also add value to the existing body of knowledge on
SME management as well as provide a basis for further research.
1.7 Basic assumption of the study
It was assumed that the respondents would be co-operative and provide accurate information
when responding to the research questions. It was also assumed that the sample size chosen
was adequate to enable the researcher draw a valid conclusion about the population.
1.8 Limitations of the study
Time constraint was a limiting factor because the study had to be concluded within short time.
Availability of funds was also a limiting factor to the study since the researcher was self-
sponsored. There was no assurance that the respondents would return all the questionnaires
duly completed.
1.9 Delimitations of the study
The study sought to determine the factors influencing the performance of youth owned small
and Medium Enterprises in Maara sub-county. The study focused on four variables which
included: entrepreneurship training, access to credit, access to market and competition. Other
variables that may influence the performance of youth owned SMEs includes leadership style,
networking and government policy among others. However these variables were not
considered during the study. The study was limited to Maara Sub-county in Tharaka Nithi
County.
1.10 Definitions of Significant terms
Access to credit- Possibility of the youth owned small and medium enterprises (SMEs) to
access credit facilities services at affordable rate.
8
Access to market – Possibility of the youth owned small and medium enterprises (SMEs) to
access market opportunities services.
Business competition-Rivalry among youth owned SMEs themselves or with other business
trying to achieve such goals like increasing profits, market share and sales volume
Entrepreneurship training – Teaching the youth small and medium enterprise’s owners skills
and knowledge on business management, record keeping, investment, sale and marketing,
purchases, stock control and cost and benefit analysis.
Maara: – An administrative unit within Tharaka-Nithi County.
Small and Medium Enterprises (SME): An income generating activity with the number of
employees ranging from 1-49 and registered with Chogoria Town Council for which the
owner(s) are responsible for management decisions relating to the business operations;
operating in all sectors of the economy. The words Enterprise and Business’ are used in the
study to refer to the same thing.
SME Performance – Ability of the SMEs to continue operating while remaining profitable.
Youth: - An individual aged between 18-35 years old.
1.11 Organization of the study
The research project has five sections. Chapter one covers the background of the study,
problem statement, objectives, limitations and delimitations. It also covers the significance of
the study and definition of key terms used in the study. Chapter two on the other hand provides
the literature review. This covers the related literature about the area of study, clearly giving
evidence on the past studies done on the subject matter, the theory on which the study is based
and conceptual framework which explains the relationships between variables. Chapter three
consists of research methodology which specifically covers the research design, target
9
population, sample size and sampling procedure, data collection instruments and procedure,
validity and reliability of the instruments, data analysis and presentation techniques and ethical
issues. Chapter four contains data analysis, presentation and interpretation while chapter five
provides a summary of findings, discussion, conclusions and recommendations. This is
followed by references and appendices sections.
10
CHAPTER TWO:
LITERATURE REVIEW
2.1 Introduction
This chapter reviews related literature under different sub-topics relevant to the study
objectives. These include: entrepreneurship training, access to credit facilities, access to market
and business competition. The chapter also discusses concept of small and medium enterprises,
their role in economic development and the conceptual and theoretical framework of the study;
it also presents the summary of gaps in literature.
2.2 Influence of entrepreneurship training on performance youth owned SMEs
Training and entrepreneurial learning has widely been understood as how people acquire
knowledge and enact new behaviors in the process of recognizing and acting on opportunities
and of organizing and managing enterprise. Sexton and Similor (1997) defined
entrepreneurship training as a formal structured instruction that conveys entrepreneurial
knowledge and develops focused awareness relating to opportunity, recognition and the
creation of new ventures. Entrepreneurship training should be mainly focused on starting a
business and subsequent sustainability of such business.
McClelland theory of acquired needs advocates that increasing level of need-achievement in a
society through modeling and learning such behavior stimulates entrepreneurship and
economic growth. This need is inculcated through child rearing practices, which stresses
standards of excellence, material warmth, self-reliance, training and low father dominance,
(Saleemi 2009). Entrepreneurial education based on solid learning theory can thus explain the
need to develop entrepreneurs by increasing business knowledge, and promoting characteristics
associated with entrepreneurs. Today’s business environment can be characterized as changing.
The accelerated pace of advances in technology, increasing foreign competition, widespread
11
and growing unemployment creating serious adjustment problems, and diminishing resource
supplies have affected the way business is conducted. This complex and unstable environment
is a way of life, which will continue far into the future (Leintz and Rea,2012).Saleemi (2009)
argue that entrepreneurship training has traditionally focused on teaching individuals, but many
initiatives are increasingly becoming more action-oriented, emphasizing learning by doing. In
their paper they present a number of action-based activities at five Swedish universities. The
cases show that entrepreneurship education focuses less on teaching individuals in a classroom
setting and more on learning-by-doing activities in a group setting and network context.
Given that past research results have consistently found SMEs training to result in better
company performance, even under different cultural settings such as the Netherlands, Spain,
Hungary, and China (Mullei, 1999), it is expected that training programs offered by
government agencies and private sector will lead to higher firm performance in youth SMEs.
This statement underpins the importance of training and development in the national economic
development process. It becomes significant point of reference especially since most
developing countries are responding to many challenges of the industrial development by
implementing new programs, which calls for new expertise and new orientation of work. This
usually means changes in specific knowledge, skills attitudes or behaviors. Training should be
designed to meet the goals of the organization while simultaneously meeting the goals of
individual employees (saleemi, 2009).Development refers to learning opportunities designed to
help employees grow. Such opportunities do not have to be limited to improving employee’s
performance on their current jobs.
2.3 Influence of access credit facilities on performance youth owned SMEs
Chigunta (2001) retained that lack of access to finance is one of the major challenges facing
youth owned SMEs worldwide. Surprisingly the World Bank (2005) revealed that lack of
12
finance was seen as a major obstacle in two of the original EU6 -Italy and France which are
among the more developed nations. Credit programmes especially those targeting the youth
presently, are an important alternative motivation for those seeking small affordable loans for
starting and running up their own small businesses.
The Canadian Youth Business Foundation (CYBF) started in 1996 in Canada for instance
Operates a Specialized Youth Business Loan Programme aimed at helping young women and
men, particularly those who are unemployed and under-employed (Wadell, 2001). Youth
seeking loan funds from the foundation are not asked for securities other than just genuine
commitment, appropriate business training, a valid business plan and an agreement to a
mandatory mentor programme. Another credit programme that has improved youth access to
funds according to White and Kenyon (2001) is the Bharatiya Yuva Shakti Trust (BYST) in
India. The BYST provides low interest loans of up to Rs. 50,000, with repayments based upon
projected business cash flows.Although there are many credit programmes targeting women,
young women seem to be underrepresented as a target group (ILO, 2008). In Asia, the credit
programmes are more likely to target married women, as opposed to unmarried women, based
on the assumption that they have a higher risk of default for loans as they might stop repaying
their loans immediately they get married.
Chigunta (2001) suggested that youth enterprise support programmes in developing Countries
should consider socio-cultural constraints that limit the participation of youth in particular
young women who want to engage in entrepreneurship and self-employment. However, the
problem of credit access to youth owned SMEs seems to be more pronounced in developing
nations. Developing countries have very few microcredit schemes targeting the youth.
According to Curtain (2000) a review of 902 organizations in 96 countries listed under the
Microcredit Summit’s Council of practitioners revealed that only 21 organizations had the term
13
‘youth’ in their title. A study carried out by Chigunta (2001) in Zambia, revealed that the
majority of potential youth entrepreneurs (72.4 per cent) cited lack of capital as the major
reason as to why they were not self-employed.
According to the World Youth Report (2003) many youths in developing countries relied on
personal savings or turned to family and friends for start-up funding and expansion. Without
such finances they had minimal chances of starting their own businesses. However, of late
different African countries have set up special credit programmes to promote credit access
among the youth.
The Umsobomvu Youth Fund (UYF) in South Africa formed in 2001 has promoted skills
development for employment creation and provisions of capital among other services to
address the growing youth unemployment problem. The UYF makes finance available to
young people through partnerships with financial institutions and other providers of finance.
Zambians have a Youth Enterprise Promotion scheme established in 1994 through government
initiative to enable young people become more aware of self-employment through
entrepreneurship and take it as a potential and viable career option (Chigunta, 2001). Its main
aim is to provide loans to various youth groups and individual youths who do not have their
own properties to use as collateral to secure funds from financial institutions.
Credit constraints operate in a variety of ways in Kenya where undeveloped capital market
forces entrepreneurs to rely on self-financing or borrowing from friends or relatives. Lack of
access to long-term credit for small enterprises forces them to rely on high cost short term
finance (Obwocha, 2005). There are various other financial challenges that face small
enterprises. They include the high cost of credit, high bank charges and fees. The scenario
witnessed in Kenya particularly during the climaxing period of the year 2008 testifies the need
for credit among the youth’s entrepreneurs (Mbonyane and Ladzani, 2011).
14
Numerous money lenders in the name of Pyramid schemes came up, promising hope among
the ‘little investors’ in which they can make the financial freedom through soft borrowing. The
rationale behind turning to these schemes among a good number of entrepreneurs is mainly to
seek alternatives for soft credit with low interest rates while making profits. Financial
constraint remains a major challenge facing SMEs in Kenya (Wanjohi and Mugure, 2008).
Due to these challenges, the government of Kenya established the Youth Enterprise
Development Fund in December 2006. Its main purpose is to provide loans to existing micro-
finance institutions (MFIs), Registered Non-Governmental Organizations (NGOs) involved in
micro financing and Savings and Credit Co-Operative Organizations (SACCOs) for on-lending
to youth enterprises.
The second Channel through which the YEDF disburses funds to the youth is the Constituency