Page 1
SAMZODHANA – “Journal of Management Research”
ISSN 2347 - 4270
Vol 6 Issue 1, April 2016
An International, Double-Blind Peer-Reviewed, Open-Access Journal
www.eecmbajournal.in 130
FACTORS INFLUENCING PREFERENCES OF BIG BAZAAR RETAIL CONSUMERS
IN CHENNAI
Dr. G. Kannan,
Assistant Professor, School of Management,
SRM University,
Ramapuram, Chennai - 89.
E-Mail: [email protected]
Dr. J. Vijayadurai
Associate Professor, Department of Business Administration,
Madurai Kamaraj University,
Palkalai Nagar, Madurai – 21.
E-Mail: [email protected]
Abstract
Retailing consists of those business activities involved in the sale of goods and services to
consumers for their personal, family, or household use. Indian retail industry is the largest
industry in India, with an employment of around 8% and contributing to over 10% of the
country's GDP. The study starts with reviewing the earlier works in this area and the objectives
of the study. The research methodology used is then delineated. The study is being conducted for
the Big Bazaar store in Express Avenue based in Chennai city, to find out the customer
preferences in choosing Big Bazaar. The sample size taken for the study at Big Bazaar is 80. The
data is gathered by distributing a questionnaire to the customers who visit big bazaar and
through personal interview. The data collected from the customers are copied to the worksheet
in the form of tally bars and analyzed using statistical tools. Inferences were drawn on a
marketing concept and conversation. Based on the marketing concepts, findings of the research
were driven and recommendations are made.
Key Words: Retail Marketing, Preferences, Promotional Offers, Big Bazaar, Marketing
Page 2
SAMZODHANA – “Journal of Management Research”
ISSN 2347 - 4270
Vol 6 Issue 1, April 2016
An International, Double-Blind Peer-Reviewed, Open-Access Journal
www.eecmbajournal.in 131
Introduction:
Organized retail is gaining tremendous importance in the recent times. On the other
hand, the retail industry is also facing severe competition and those who are able to retain
their customers are the ones that are able to succeed in the market place. The retail firms
are spending a lot of their marketing resources to keep existing customers rather than to
attract new ones. Customer satisfaction plays a key role in customer retention and also is a
major differentiating factor among retail stores. Delivering satisfaction to the consumers
has become one of the major drivers of profitability. In this scenario, the firms have to
work on what attracts consumers and what will make them not to shift their choice towards
competitors. Working out strategies in this direction requires a thorough understanding of
the preferences of the consumers on the attributes that are considered of much significance.
Indian retail industry is the largest industry in India, with an employment of
around 8% and contributing to over 10% of the country's GDP. Retail industry in India is
expected to rise 25% yearly being driven by strong income growth, changing lifestyles,
and favorable demographic patterns.
It is expected that by 2016 modern retail industry in India will be worth US$ 175-
200 billion. India retail industry is one of the fastest growing industries with revenue
expected in 2007 to amount US$ 320 billion and is increasing at a rate of 5% yearly. A
further increase of 7-8% is expected in the industry of retail in India by growth in
Consumerism in urban areas, rising incomes, and a steep rise in rural consumption. It has
further been predicted that the retailing industry in India will amount to US$ 21.5 billion
by 2010 from the current size of US$ 7.5 billion.
Shopping in India has witnessed a revolution with the change in the consumer
buying behaviour and the whole format of shopping also altering. Industry of retail in
India which has become modern can be seen from the fact that there are multi-
stored malls, huge shopping centers, and sprawling complexes which offer food,
shopping, and entertainment to all customers. In the Indian retailing industry, food is the
most dominating sector and is growing at a rate of 9% annually. The branded food industry
is trying to enter the India retail Industry and convert Indian consumers to branded food.
Page 3
SAMZODHANA – “Journal of Management Research”
ISSN 2347 - 4270
Vol 6 Issue 1, April 2016
An International, Double-Blind Peer-Reviewed, Open-Access Journal
www.eecmbajournal.in 132
Since at present 60% of the Indian grocery basket consists of non-branded items.
Indian retail industry is progressing well and for this to continue, retailers as
well as the Indian government will have to make a combined effort. Indian retailing
industry has seen phenomenal growth in the last five years. Organized retailing has
finally emerged from the shadows of unorganized retailing and is contributing
significantly to the growth of Indian retail sector. The “India Retail Sector Analysis
report helps clients to analyze opportunities and factors critical to the success of retail
industry in India. Indian retail industry is going through a transition phase. Most of the
retailing in our country is still in the unorganized sector. The spread out of the retails in
US and India shows a wide gap between the two countries. Though retailing in India is
undergoing an exponential growth, the road ahead is full of challenges the untapped scope
of retailing has attracted superstars like WAL-MART into India, leaving behind the
kiranas that served us for years. Such companies are basically IT based. The other
important participants in the Indian retail sector are BATA, BIG BAZAAR, CAFÉ
COFFE DAY, KHADIM’S, CROSSWORD, MORE, STARBAZAAR, RELIANCE
FRESH, SPENCER, GOPALAN MALL to name a few.
This study focuses on analyzing the consumers’ preferences of the specific
attributes of retail store. The study starts with reviewing the earlier works in this area,
the objectives of the study and the research methodology used is then delineated. The
study is being conducted for the Big Bazaar store in Express Avenue based in Chennai
city, to find out the customer preferences in choosing Big Bazaar. It is required to find
out the preferences based on certain aspects (price, Income, levels selection of products
satisfaction level of customers).
Review of Related Literature
Several past studies revealed the difference of shopping in the traditional shopping
channel and online shopping channels.
Lusch and Lusch (1987), suggest that in the traditional shopping environment, there are
four unique characteristics of services which differentiate services from goods. These
Page 4
SAMZODHANA – “Journal of Management Research”
ISSN 2347 - 4270
Vol 6 Issue 1, April 2016
An International, Double-Blind Peer-Reviewed, Open-Access Journal
www.eecmbajournal.in 133
characteristics are generally summarized as intangibility, inseparability, heterogeneity and
perishability.
Jahng, Jain and Ramamurthy (2000), consumers may have different perceptions of
the differences between goods and services in the Ecommerce environment, compared
with the situation in the traditional shopping environment.
In the traditional shopping environment, services are intangible (Berkowitz et al. 1997;
Kotler and Armstrong , (2001; Kotler et al., 1999; Lusch and Lusch, 1987), They cannot be
seen, held, touched, felt, heard, tasted or smelled before they are bought (Berkowitz et al,
1997; Kotler and Armstrong, 2001; Kotler et al, 1999).
In the traditional shopping environment, services are highly variable in quality as they
depend on who provides them as well as when, where and how they are provided (Kotler et
al., 1999; Kotler and Armstrong, 2001). The quality of services in the traditional shopping
environment is perceived to be inconsistent while the quality of goods, regardless of good or bad,
is perceived to be consistent (Berkowitz et al, 1997).
Sheth (1983) also suggested that the consumers have two types of motives while
shopping, which are functional and non-functional. The functional motives are mostly about the
time, shopping place and consumer‘s needs, which could be like one-stop shopping to save time,
the environmental of shopping place such as free parking place, lower cost of products and
available to choose from widely range of products. The non-functional motives are more related
with culture or social values, such as the brand name of the store.
Mehta & Sivadas, (1995) reported that the consumers’ willingness to and preference for
adopting the Internet as his or her shopping medium was also positively related to income,
household size, and innovativeness.
Singh and Dalal (1999) in the study titled ‘Web Home pages as advertisement’, has
concluded that: Visitors to a Web site can be classified into two broad categories, low-
involvement hedonistic surfers and high-involvement utilitarian searchers - henceforth, surfers
and searchers, respectively. Surfers are fun-seekers and explorers who desire entertainment and
stimulation; they are likely to land at a website, linger for a brief period and then take off for
Page 5
SAMZODHANA – “Journal of Management Research”
ISSN 2347 - 4270
Vol 6 Issue 1, April 2016
An International, Double-Blind Peer-Reviewed, Open-Access Journal
www.eecmbajournal.in 134
another more attractive site in their path. In contrast, searchers are goal-oriented, looking for
specific information, and are likely to spend more time at their preferred sites.
Changchit & Vokurka, (2003) in their study on understanding customer satisfaction
factors can increase the probability of attracting new customers and/or retaining existing
customers. A study reported that customers expressed that "customer service" was a key factor in
their decision to shop at a store or revisit the website.
Need of the Project:
Now-a-day’s retail stores a r e facing more competition in retailing business.
Good store design increases the number of customer visits to the store and increases the
store goodwill. Price also plays a major role in customer preference and selection of
the store. And as industry research has shown, there is much need to know the
customer expectations, customer preferences and their store choices (features) and we
will find out solutions for designing effective store which will be getting more
customers and getting more profits.
Scope of the Study:
The research is applicable in the area of customer decision making process
for purchasing of products at Big Bazaar. The scope of research also helps in
understanding the preferences of the customers. It would help Big Bazaar in designing
their marketing promoting sales.
Problem Definition:
The study is being conducted for the Big Bazaar store in Express Avenue based
in Chennai city, to find out the customer preferences in choosing Big Bazaar. It is
required to find out the preferences based on certain aspects (price, Income, levels
selection of products satisfaction level of customers).
Objectives of the Study:
Page 6
SAMZODHANA – “Journal of Management Research”
ISSN 2347 - 4270
Vol 6 Issue 1, April 2016
An International, Double-Blind Peer-Reviewed, Open-Access Journal
www.eecmbajournal.in 135
1. To study the customer preferences in choosing Big Bazaar.
2. To analyse the impact of promotional offer in influencing the customer
preference of Big Bazaar.
Research Design:
This research is completely based on the description of the factors that lead to
the customer decision-making process. It is basically valued on the various parameters
which include personal details of customers, their income–level, and satisfaction level.
Here, the need is to find which factors that describe the customer decision making process
effectively.
Sample Design: To obtain the representative sample, a non-probability sample can be
drawn. In this study the method of selecting samples is random. The sample size taken for
the study at big bazaar is 80. To obtain the representative sample, a non-probability
sample can be drawn. In this study, the method of selecting samples is random.
Sources of data collection: The sources of data include both primary and secondary data.
Primary data is collected by distributing a questionnaire to the customers who visit big
bazaar and through personal interview. Secondary data includes books, journals,
magazines, newsletters of the big bazaar, and internet.
Tools for Analysis & Techniques: The data collected from the respondents are
transcript to the worksheet in the form of tally bars and analyzed by statistical tools by
drawing tables and graphs, inferences were drawn on a marketing concept and
conversation. Based on the marketing concepts findings of the research were driven and
recommendations are made.
Limitations of the Study: It is not possible for any market study to make it accurate due
to many hurdles in the collection and computation of data. Findings of the study are based
on the assumption that respondents have disclosed in the questionnaire. Time was a major
constraint. The sample was limited to only customers who have made a purchase at big
bazaar.
Page 7
SAMZODHANA – “Journal of Management Research”
ISSN 2347 - 4270
Vol 6 Issue 1, April 2016
An International, Double-Blind Peer-Reviewed, Open-Access Journal
www.eecmbajournal.in 136
Data Analysis and Interpretation
The data has been analysed and presented in the table below.
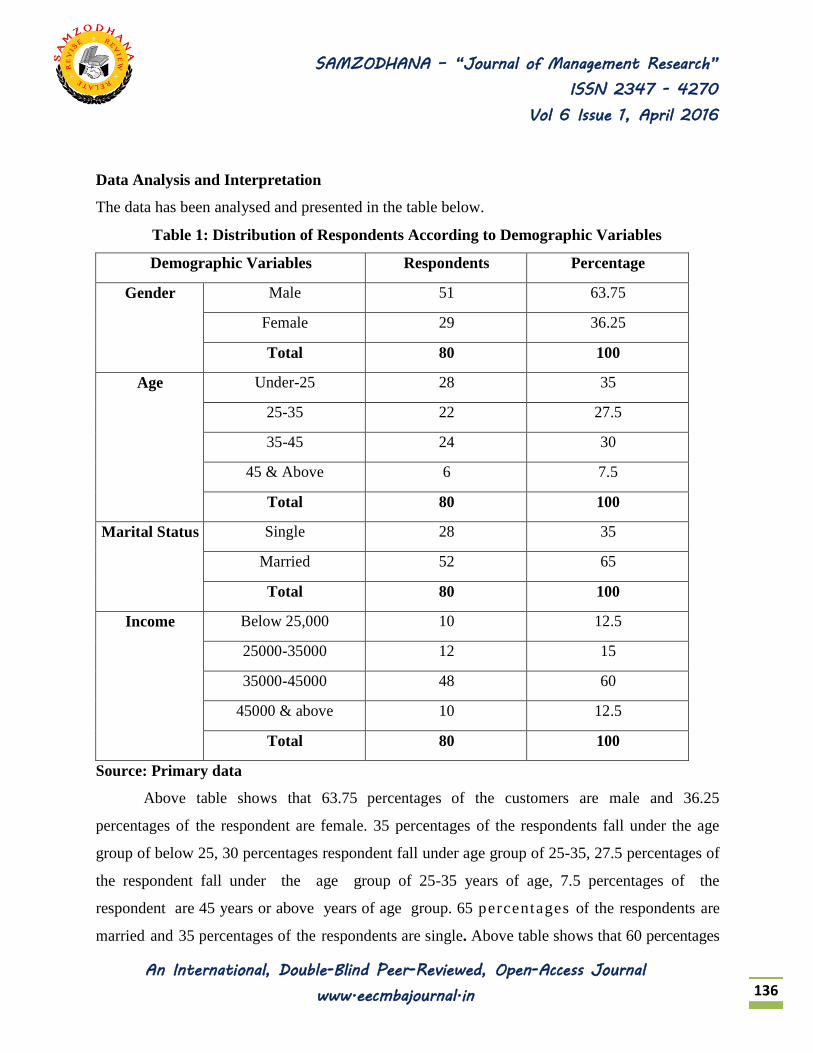
Table 1: Distribution of Respondents According to Demographic Variables
Demographic Variables Respondents Percentage
Gender Male
51
63.75
Female
29
36.25
Total
80
100
Age
Under-25
28
35
25-35
22
27.5
35-45
24
30
45 & Above
6
7.5
Total
80
100
Marital Status
Single
28
35
Married
52
65
Total
80
100
Income Below 25,000
10 12.5
25000-35000
12
15
35000-45000
48
60
45000 & above
10 12.5
Total 80 100
Source: Primary data
Above table shows that 63.75 percentages of the customers are male and 36.25
percentages of the respondent are female. 35 percentages of the respondents fall under the age
group of below 25, 30 percentages respondent fall under age group of 25-35, 27.5 percentages of
the respondent fall under the age group of 25-35 years of age, 7.5 percentages of the
respondent are 45 years or above years of age group. 65 percentages of the respondents are
married and 35 percentages of the respondents are single. Above table shows that 60 percentages
Page 8
SAMZODHANA – “Journal of Management Research”
ISSN 2347 - 4270
Vol 6 Issue 1, April 2016
An International, Double-Blind Peer-Reviewed, Open-Access Journal
www.eecmbajournal.in 137
of the respondent fall under the income group between Rs.35,000 – Rs. 45,000, Rs. 15
percentages of the customers fall under the income group between Rs. 25,000 - 35,000, 12.5
percentages of respondent fall under income group of Rs. 20000 - 40000 and Rs. 45,000 and
above.
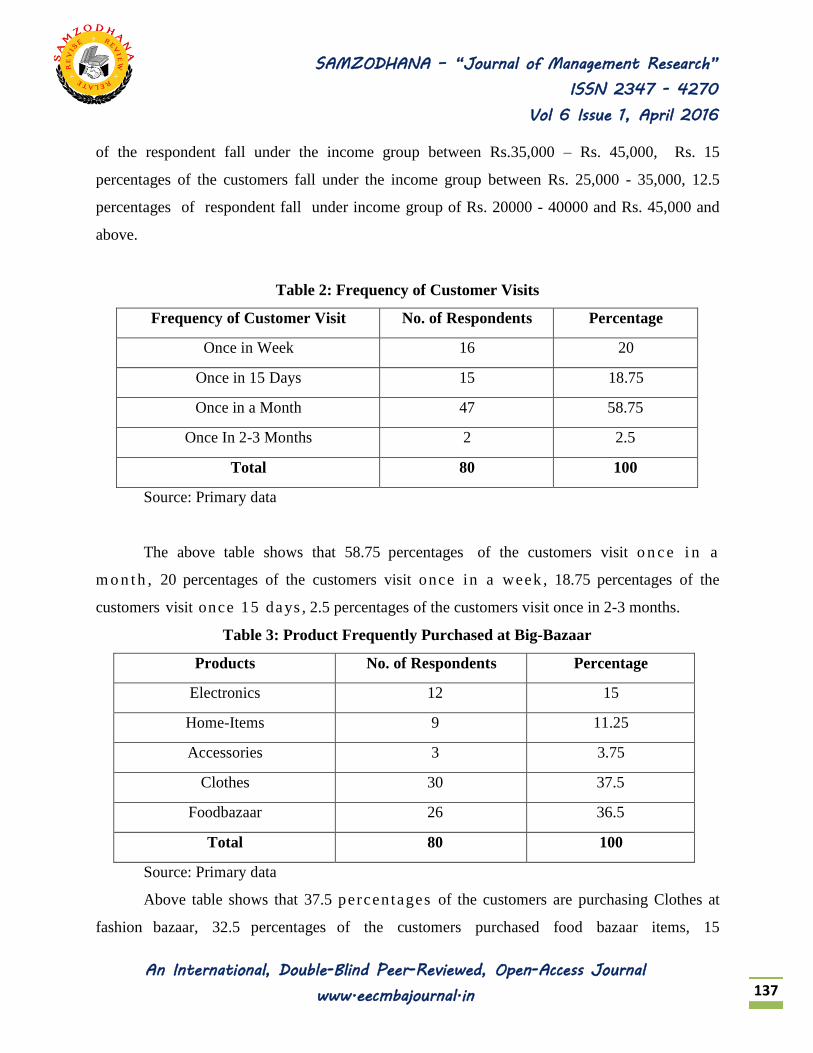
Table 2: Frequency of Customer Visits
Frequency of Customer Visit
No. of Respondents
Percentage
Once in Week
16
20
Once in 15 Days
15
18.75
Once in a Month 47 58.75
Once In 2-3 Months 2
2.5
Total 80 100
Source: Primary data
The above table shows that 58.75 percentages of the customers visit o n c e i n a
m o n t h , 20 percentages of the customers visit once in a week , 18.75 percentages of the
customers visit once 15 days , 2.5 percentages of the customers visit once in 2-3 months.
Table 3: Product Frequently Purchased at Big-Bazaar
Products
No. of Respondents
Percentage
Electronics
12
15
Home-Items
9
11.25
Accessories
3
3.75
Clothes
30
37.5
Foodbazaar 26 36.5
Total 80 100
Source: Primary data
Above table shows that 37.5 percentages of the customers are purchasing Clothes at
fashion bazaar, 32.5 percentages of the customers purchased food bazaar items, 15
Page 9
SAMZODHANA – “Journal of Management Research”
ISSN 2347 - 4270
Vol 6 Issue 1, April 2016
An International, Double-Blind Peer-Reviewed, Open-Access Journal
www.eecmbajournal.in 138
percentages of the customers purchased electronic teems. 11.25 percentages of the customers
purchased home products. 3.75 percentages of the customers are purchased accessories.
Table 4: Source of Influence for Purchasing
Source of Influence
Respondents
Percentage
F.M. Radio
2
2.5
Television
10
12.5
News Paper
48
60
Friends / Others
20
25
Total
80
100
Source: Primary data
Above table shows that 60 percentages of the customers are buy products by source of
news-papers, 25 percentages of the customers are buy products by source (influence by) of friends
& family & others, 12.5 percentages of the customers are buy source of Television and 2.5
percentages of the customers are buy products by source of F.M. Radio source about Big-Bazaar.
Table 5: Reason to Purchase from Big Bazaar
Purchase Reason
Respondents
Percentage
Better-Quality
32
40
Low-Price
30
37.5
Variety of Products
12
15
Various Brands
6
7.5
Total
80
100
Source: Primary data
Above table shows that 40 percentage of consumers approach Big bazaar for better-
quality of product, 37.55 percentage of consumers approach Big bazaar due to low-price, 12.5
percentage of consumers purchases from Big bazaar for variety of products, 8 percentage of
consumers purchases from Big bazaar for availability of various brands.
Page 10
SAMZODHANA – “Journal of Management Research”
ISSN 2347 - 4270
Vol 6 Issue 1, April 2016
An International, Double-Blind Peer-Reviewed, Open-Access Journal
www.eecmbajournal.in 139
Table 6: Opinion Regarding Availability of Company Products at Big Bazaar
Availability of Company Products Respondents
Percentage
Yes
55
68.75
No
11
13.75
Not-Many
14
17.5
None
0
0
Total
80
100
Source: Primary data
Above table shows that 68.75 percentages customers are getting more products in one
category. 17.5 percentages of the customers are not getting too many company products in one
category and 13.75 percentages of customers are not getting more products in one category and
none of the customers can’t respond for none categories of products available in one product
category.
Table 7: Store Space in Big-Bazaar
Store Space
Respondents
Percentage
Small-Space
6
7.5
Free-Space
58
72.5
No-Free Space
13
16.25
Congested
3
3.75
Total
80
100
Source: Primary data
Above table shows that 72.5 percentages of the customers can freely moving around
in store for products, 16.25 percentages of customers cann ot freely moving around in store
for products,, 7.5 percentages of the customers can get small space in store for moving around
for products, 3.75 percentages respondents can get congested space in store for moving around
Page 11
SAMZODHANA – “Journal of Management Research”
ISSN 2347 - 4270
Vol 6 Issue 1, April 2016
An International, Double-Blind Peer-Reviewed, Open-Access Journal
www.eecmbajournal.in 140
for products.
Table 8: Representatives’ Interaction with Big Bazaar Customers
Representatives’ Interaction Respondents
Percentage
Effective
38
47.5
Not-Effective
30
37.5
Good
10
12.5
No-Interaction
2
2.5
Total
80
100
Source: Primary data
47.5 percentages of the customers getting effective interaction by store representatives,
37.5 percentages of the customers can’t get effective interaction by store representatives, 12.5
percentages of the customers can’t get good interaction by store representative, 2.5 percentages of
the customers cannot get interaction by store representative while selecting product.
Table 9: Reminding and Intimating About Offers & Prices
Offer Intimation
Respondents
Percentage
Yes / Clear Intimating
43
53.75
No Clarity Intimating
26
32.5
No Intimation At All
11
13.75
Total
80
100
Source: Primary data
Above table shows that the 53.75 percentages of the customers are getting clear
announcement from store about store discounts, prices. 32.5 percentages of the customers are not
getting clear announcement from store about store discounts, prices 13.75 percentages customers
are not getting any announcement from store about store discounts prices.
Table 10: Opinion towards Customer Service
Page 12
SAMZODHANA – “Journal of Management Research”
ISSN 2347 - 4270
Vol 6 Issue 1, April 2016
An International, Double-Blind Peer-Reviewed, Open-Access Journal
www.eecmbajournal.in 141
Customer Service Respondents
Percentage
Fast-Service
38
47.5
Slow-Service
28
35
Not-Sufficient Service
9
11.25
Not-Good Service
5
6.25
Total 80 100
Source: Primary data
Above table shows that we conclude that the 47.5 percentages of the customers are
getting fast customer-service from customer service department, 35 percentages of the
customers are getting slow-service from customer service department, 11.25 percentages of the
customers are getting not-sufficient service from customer service department, and 6.25
percentages of the customers are getting not-good service from customer service department.
Table 11: Opinion towards Discount Prices Offered in Store
Discount Prices Respondents
Percentage
Yes
69
86.25
No
11
13.75
Total
80
100
Source: Primary data
86.25 percentages of the customers respond store offering special discount prices and
13.75 percentages of the customers respond store did not offer special discount prices.
Table 12: Respondents Awareness Regarding Various Offers and Special Discounts
Offers and Special Discounts
Respondents
Percentage
Buy one get one free
30 37.5
50%, 40%, 60%, etc.
20
25
Buy one get two
10
12.5
-
-
Page 13
SAMZODHANA – “Journal of Management Research”
ISSN 2347 - 4270
Vol 6 Issue 1, April 2016
An International, Double-Blind Peer-Reviewed, Open-Access Journal
www.eecmbajournal.in 142
Get two for 900
8
10
Buy one get second one 60% on
price
6
7.5
Other offers & discounts
6
7.5
Total
80
100
Source: Primary data
The above table says that 37.5 percentages of customers were aware buy one get one
offer, 25 percentages of customers were aware 50%, 40%, 60% offer, 12.55 percentages of
customers were aware buy one get two offers and 10 percentages of customers were aware get
two900 (example) offer 7.5 percentages of customers were aware of buy one get second one 60
percentages of customers on price and other offers and discounts.
Table 13: Customers’ Opinion towards Long-time Waiting in Billing Section
Long-time Waiting in Billing Section Respondents
Percentage
Yes
69
86.25
No
11
13.75
Total
80
100
Source: Primary data
The above table shows that 86.25 percentages of the customers are waiting for
long time in billing section and 13.75 percentages of the customers are not waiting for
long time for long time at billing section at big bazaar.
Table 14: Responses about Food Court and Gaming Section
Page 14
SAMZODHANA – “Journal of Management Research”
ISSN 2347 - 4270
Vol 6 Issue 1, April 2016
An International, Double-Blind Peer-Reviewed, Open-Access Journal
www.eecmbajournal.in 143
Food Court and Gaming
Section
Respondents
Percentage
Yes
49
61.25
No
31
38.75
Total
80
100
Source: Primary data
61.25% of the customers want food & gaming section at store and 38.7% of the
customers don’t want food gaming section at Big-Bazaar.
Table 15: Opinion about Cause of Visiting
Cause of Visiting
Respondents
Percentage
Buying Interest
73
91.25
Product Interest
7
8.75
Information Seeking
0
0
General Interest
0
0
Total
80
100
Source: Primary data
The table shows that the 91.25 percent of the customers visit the retail stores for buying
interest, 8.75 per cent of the customers are gone to retail store for product interest and none of the
customers have gone to retail stores for information-seeking and general interest.
Table 16: Purchases at Store
Purchases at Store Respondents
Percentage
Yes
18
22.5
No
52
65
Not-First Time
9
11.25
More Than Two-Times
1
1.25
Total
80
100
Source: Primary data
Page 15
SAMZODHANA – “Journal of Management Research”
ISSN 2347 - 4270
Vol 6 Issue 1, April 2016
An International, Double-Blind Peer-Reviewed, Open-Access Journal
www.eecmbajournal.in 144
Above table shows that 63 percentages of the customers are not buy the products for first-
time visiting the store, 22.5 percentages of the customers are buying the products just by visiting
first-time the store, 11.25 percentages customers are not buying the products just buy visiting
first time the store and 1.25 percentages of customers are buying the products by more than
visiting two-times.
Table 17: Intentions to Re-enter Store
Intentions to Re-enter Store Respondents
Percentage
Product quality & availability
30
37.5
Customer service
9
11.25
Seasonal offers & discounts
18
22.5
Ambience
3
3.75
Low-prices
20
25
Total
80
100
Source: Primary data
The above table shows that 37.5 percent of the customers intention is to re-enter into the
store is product quality & availability, 25 percent customers intention is to re-enter into stores is
low prices, 22.5 percent customers intention is to re-enter in to store is seasonal offers &
discounts, 11.25 percent of the customers intention is to re-enter into the store is customer
service, and 3.75 percent of the customers intention is to re-enter into the store is ambiance.
Table 18: Product Quality In a store
Product Quality Respondents
Percentage
Good
73
91.25
Normal
7
8.75
Not-Good
0
0
Poor
0
0
Total
80
100
Source: Primary data
Page 16
SAMZODHANA – “Journal of Management Research”
ISSN 2347 - 4270
Vol 6 Issue 1, April 2016
An International, Double-Blind Peer-Reviewed, Open-Access Journal
www.eecmbajournal.in 145
91.25 percentages of the customers are respond Big-Bazaar maintain good quality,
quantity compare to other retail-store, 8.75 percentages of the customers are respond Big-Bazaar
maintain normal product quality, quantity compare to other retail stores and none of the
customers can’t respond for Big Bazaar maintaining poor and not good product quality, quantity
compare to other retail store.
Table 22: Satisfaction Level of Shopping
Satisfaction Level of Shopping Respondents
Percentage
Satisfied
17
21.25
Feel-Very Satisfied
63
78.75
Not-Satisfied
0
0
Total
80
100
Source: Primary data
The above table shows that 78.75 percentages of the customers are respond they can feel
Very-Satisfied after shopping at Big Bazaar. 21.25 percentages of the customers are respond they
can feel satisfied after shopping at Big Bazaar and none of the customers can’t respond they can
feel not-satisfied after shopping at Big-Bazaar.
Findings:
63.75 percentages of the customers are male and 36.25 percentages of the respondent are
female. 35 percentages of the respondents fall under the age group of below 25, 30 percentages
respondent fall under age group of 25-35, 27.5 percentages of the respondent fall under the
age group of 25-35 years of age, 7.5 percentages of the respondent are 45 years or above
years of age group. 65 percentages of the respondents are married and 35 percentages of
the respondents are single. 60 percentages of the respondent fall under the income group between
Rs.35,000 – Rs. 45,000, Rs. 15 percentages of the customers fall under the income group
between Rs. 25,000 - 35,000, 12.5 percentages of respondent fall under income group of Rs.
20000 - 40000 and Rs. 45,000 and above. 58.75 percentages of the customers visit o n c e i n
a m o n t h , 20 percentages of the customers visit once in a week , 18.75 percentages of the
Page 17
SAMZODHANA – “Journal of Management Research”
ISSN 2347 - 4270
Vol 6 Issue 1, April 2016
An International, Double-Blind Peer-Reviewed, Open-Access Journal
www.eecmbajournal.in 146
customers visit once 15 days , 2.5 percentages of the customers visit once in 2-3 months.
37.5 percentages of the customers are purchasing Clothes at fashion bazaar, 32.5
percentages of the customers purchased food bazaar items, 15 percentages of the
customers purchased electronic teems. 11.25 percentages of the customers purchased home
products. 3.75 percentages of the customers are purchased accessories. 60 percentages of the
customers are buy products by source of news-papers, 25 percentages of the customers are buy
products by source (influence by) of friends & family & others, 12.5 percentages of the customers
are buy source of Television and 2.5 percentages of the customers are buy products by source of
F.M. Radio source about Big-Bazaar. 40 percentages of consumers approach Big bazaar for
better-quality of product, 37.55 percentages of consumers approach Big bazaar due to low-price,
12.5 percentages of consumers purchases from Big bazaar for variety of products, 8 percentages
of consumers purchases from Big bazaar for availability of various brands. 68.75 percentages
customers are getting more products in one category. 17.5 percentages of the customers are not
getting too many company products in one category and 13.75 percentages of customers are not
getting more products in one category and none of the customers can’t respond for none
categories of products available in one product category. 72.5 percentages of the customers can
freely moving around in store for products, 16.25 percentages of customers cann ot freely
moving around in store for products,, 7.5 percentages of the customers can get small space
in store for moving around for products, 3.75 percentages respondents can get congested space
in store for moving around for products. 47.5 percentages of the customers getting effective
interaction by store representatives, 37.5 percentages of the customers can’t get effective
interaction by store representatives, 12.5 percentages of the customers can’t get good interaction
by store representative, 2.5 percentages of the customers cannot get interaction by store
representative while selecting product. 53.75 percentages of the customers are getting clear
announcement from store about store discounts, prices. 32.5 percentages of the customers are not
getting clear announcement from store about store discounts, prices 13.75 percentages customers
are not getting any announcement from store about store discounts prices. 47.5 percentages of
the customers are getting fast customer-service from customer service department, 35
percentages of the customers are getting slow-service from customer service department, 11.25
-
-
Page 18
SAMZODHANA – “Journal of Management Research”
ISSN 2347 - 4270
Vol 6 Issue 1, April 2016
An International, Double-Blind Peer-Reviewed, Open-Access Journal
www.eecmbajournal.in 147
percentages of the customers are getting not-sufficient service from customer service
department, and 6.25 percentages of the customers are getting not-good service from customer
service department. 86.25 percentages of the customers respond store offering special discount
prices and 13.75 percentages of the customers respond store did not offer special discount
prices. 37.5 percentages of customers were aware buy one get one offer, 25 percentages of
customers were aware 50%, 40%, 60% 0ffer, 12.55 percentages of customers were aware buy
one get two offers and 10 percentages of customers were aware get two900 (example) offer
7.5% customers were aware of buy one get second one 60% on price and other offers and
discounts. 61.25 percentages of the customers want food & gaming section at store and 38.7
percentages of the customers don’t want food gaming section at Big-Bazaar. 91.25 percentages
of the customers are went to retail stores for buying interest, 8.75 percentages of the customers
are gone to retail store for product interest and none of the customers are not gone to retail stores
for information-seeking and general interest. 63 percentages of the customers are not buy the
products for first-time visiting the store, 22.5 percentages of the customers are buying the
products just by visiting first-time the store, 11.25 percentages customers are not buying the
products just buy visiting first time the store and 1.25 percentages of customers are buying the
products by more than visiting two-times. 37.5 percentages of the customers intention is to re-
enter into the store is product quality & availability, 25 percentages customers intention is to re-
enter into stores is low prices, 22.5 percentages customers intention is to re-enter in to store is
seasonal offers & discounts, 11.25 percentages of the customers intention is to re-enter into the
store is customer service, and 3.75 percentages of the customers intention is to re-enter into the
store is Ambiance. 91.25 percentages of the customers are respond Big-Bazaar maintain good
quality, quantity compare to other retail-store, 8.75 percentages of the customers are respond
Big-Bazaar maintain normal product quality, quantity compare to other retail stores and none of
the customers can’t respond for Big Bazaar maintaining poor and not good product quality,
quantity compare to other retail store. 78.75 percentages of the customers are respond they can
feel Very-Satisfied after shopping at Big Bazaar. 21.25 percentages of the customers are respond
they can feel satisfied after shopping at Big Bazaar and none of the customers can’t respond they
can feel not-satisfied after shopping at Big-Bazaar.
Page 19
SAMZODHANA – “Journal of Management Research”
ISSN 2347 - 4270
Vol 6 Issue 1, April 2016
An International, Double-Blind Peer-Reviewed, Open-Access Journal
www.eecmbajournal.in 148
Suggestions
To attract more customers, big bazaar needs to offer more brands of products.
Advertising through television and F.M radio needs to be improved. Sign boards which show
restrooms and trail rooms should be visible to the customers, and also trial rooms are to be
increased. Increase the customer billing section transactions in store (for fast transactions).
Increase the food court and game’s section at big bazaar to increase the customer shopping
duration. Big bazaar can improve their customer satisfaction level, by providing better service
like home delivery etc.
References
A. Rangaswamy and G.H. Van Bruggen (2005); ―Opportunities and challenges in
multichannel marketing: An introduction to the special issue‖, Journal of Interactive
Marketing, 19(2), p.:5-11
1. Ahuja, M. K., Gupta, B., & Raman, P. (2003): An Empirical Investigation of Online
Consumer Purchasing Behavior [Electronic version]. Communications of the ACM, 46
(12ve), pp. 145-151. Retrieved 18 April 2005 fromhttp://portal.acm.org/cacm/ve1203. 97
2. Belch, G.E. & Belch, M.A. (2004), ―Advertising and promotion: an integrated
marketing communications perspective‖ New York: McGraw-Hill, 6th Edition.
3. Changchit C. and Vokurka R. (2003). "Factors Influencing the Shopping Behaviors,
Proceedings of the Decision Sciences Institute Annual Meeting, November 22-25,
Washington, D. C.
4. Dobio, K. Grant J. and Reedy, K. (2001), ―Product Motivation and purchasing activity
and explanatory study of consumer‘s purchasing activity, Journal of Promotion
Management. Vol. 6, pp. 31-43
5. Helen Robinson, Anna Wysocka and Chris and (2007), ―Internet advertising
effectiveness The effect of design on click-through rates for banner ads‖,
International Journal of Advertising, Vol.26(4), pp. 527–541
6. Hellenes S. (2004), ―Global Marketing- A Decision Oriented Approach, Edinburgh
Gate, Pearson Higher Education 3rd
edition.
Page 20
SAMZODHANA – “Journal of Management Research”
ISSN 2347 - 4270
Vol 6 Issue 1, April 2016
An International, Double-Blind Peer-Reviewed, Open-Access Journal
www.eecmbajournal.in 149
7. Kotler and Armstrong (2011), Principles of Marketing, Prentice Hall. Kant, I (1788) in
Mary, J.G. (Ed.) Collogue of Practical Reason, Cambridge University Press, and
Cambridge MA 1997.
8. Validation Proceedings of the 21st International Conference on Information Systems,
Australia, pp 688 – 695.
9. Kotler.P (2000).Marketing Management. Pearson Education, New Delhi
10. Shim, Soyeon. (1996). Adolescent Consumer Decision-Making Styles: The Consumer
Socialization Process, Psychology and Marketing 13 (6) (September): 547-68.
11. Singh Amarinder, (2001) Consumer Perception of Reliability of Electric Power System in
Punjab, Doctoral Dissertation, Punjabi University, Patiala.
12. Sinha, Piyush Kumar and Uniyal Dwarika Prasad (2000), Communication @ Point of
Purchas, Unpublished Working Paper, Mudra Institute of Communications,
Ahmadabad.
13. Sinha Piyush Kumar (2003), Shopping Orientation in the Evolving Indian Market,
Vikalpa, Vol. 28 (2), April - June, pp. 13 - 22.
14. X. Zhang (2009), Retailers’ multichannel and price advertising strategies; Journal of
Marketing Science, 28(6) pp.:1080- 1094.


![Factors influencing[1]](https://static.documents.pub/doc/80x56/54be1c8d4a795948378b4597/factors-influencing1.jpg)


