California State University, San Bernardino California State University, San Bernardino CSUSB ScholarWorks CSUSB ScholarWorks Theses Digitization Project John M. Pfau Library 2005 Factors influencing purchasing decision process of low- Factors influencing purchasing decision process of low- carbohydrate products carbohydrate products Warintra Triyangkulsri Follow this and additional works at: https://scholarworks.lib.csusb.edu/etd-project Part of the Nutrition Commons, and the Sales and Merchandising Commons Recommended Citation Recommended Citation Triyangkulsri, Warintra, "Factors influencing purchasing decision process of low-carbohydrate products" (2005). Theses Digitization Project. 2658. https://scholarworks.lib.csusb.edu/etd-project/2658 This Project is brought to you for free and open access by the John M. Pfau Library at CSUSB ScholarWorks. It has been accepted for inclusion in Theses Digitization Project by an authorized administrator of CSUSB ScholarWorks. For more information, please contact [email protected].
Transcript
California State University San Bernardino California State University San Bernardino
CSUSB ScholarWorks CSUSB ScholarWorks
Theses Digitization Project John M Pfau Library
2005
Factors influencing purchasing decision process of low-Factors influencing purchasing decision process of low-
carbohydrate products carbohydrate products
Warintra Triyangkulsri
Follow this and additional works at httpsscholarworkslibcsusbeduetd-project
Part of the Nutrition Commons and the Sales and Merchandising Commons
Recommended Citation Recommended Citation Triyangkulsri Warintra Factors influencing purchasing decision process of low-carbohydrate products (2005) Theses Digitization Project 2658 httpsscholarworkslibcsusbeduetd-project2658
This Project is brought to you for free and open access by the John M Pfau Library at CSUSB ScholarWorks It has been accepted for inclusion in Theses Digitization Project by an authorized administrator of CSUSB ScholarWorks For more information please contact scholarworkscsusbedu
FACTORS INFLUENCING PURCHASING DECISION PROCESS
OF LOW-CARBOHYDRATE PRODUCTS
A Project
Presented to the
Faculty of
California State University
San Bernardino
In Partial Fulfillment
of the Requirements for the Degree
Master of Business Administration
by
Warintra Triyangkulsri
December 2005
FACTORS INFLUENCING PURCHASING DECISION PROCESS
OF LOW-CARBOHYDRATE PRODUCTS
A Project
Presented to the
Faculty of
California State University
San Bernardino
by
Warintra Triyangkulsri
December 2005
Date
copy 2005 Warintra Triyangkulsri
ABSTRACT
A growing number of diet trends are spreading across
the nation in an effort to improve health and lose weight
such as the Atkins diet and the South Beach diet Low-fat
and low-carbohydrate diets are the most popular and in
the last two years the number of low-carbohydrate
products available in stores has sharply increased
Consequently the word carb is used extensively in food
packaging however many low-carbohydrate products are
expensiveand tasteless Hence the purpose of this study
was to determine attitudes toward low-carbohydrate diets
among consumers and the attributes that influence their
purchase decision Results showed that consumers trusted
low-fat diets more than low-carbohydrate ones regarding
achieving weight loss and improved health Further price
and taste of low-carb products were the most problematic
factors that affected consumers purchase decision
Findings suggest that suppliers and manufacturers of diet
foods should focus on low-fat attributes in package
labeling instead of low-carb However findings also
suggest that since diabetics must follow low-carbohydrate
iii
diets that medical institutions consider distributing
such products as well as grocery chains
iv
ACKNOWLEDGMENTS
Without my excellent advisor Dr Victoria Seitz
this project would not exist Her willingness to- spend
long hours guiding advising organizing and editing the
contents was a critical factor in writing this study I
will always appreciate her high-quality help guidance
and support toward the completion of this project Thanks
also go to Dr Eric Newman and Dr Vic Johar my
committee members for the contributions to complete the
project With the encouragement of my parents and my
friends I could have the time or energy to finish this
study Special thanks go to all of the participants
helping me answering all questions on the survey to meet
the project objectives as well
v
DEDICATION
To Triyangkulsri family
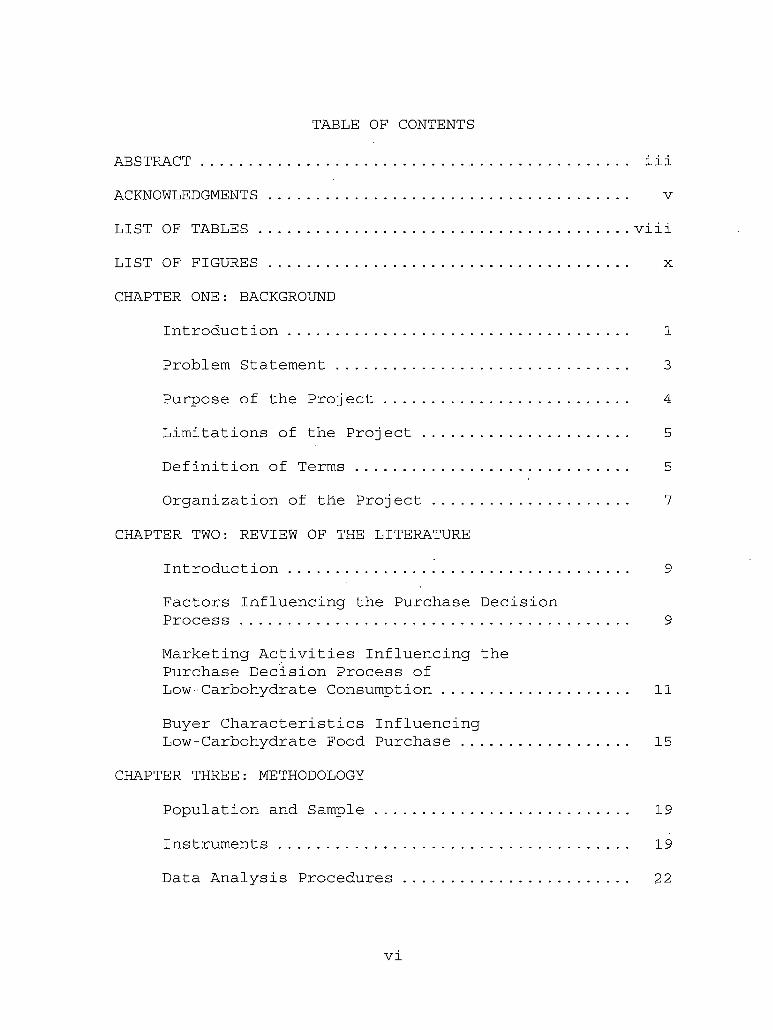
TABLE OF CONTENTS
ABSTRACT iiiACKNOWLEDGMENTS v
LIST OF TABLESviiiLIST OF FIGURES X
CHAPTER ONE BACKGROUND
Introduction 1
Problem Statement 3Purpose of the Project 4
Limitations of the Project 5
Definition of Terms 5
Organization of the Project 7
CHAPTER TWO REVIEW OF THE LITERATURE
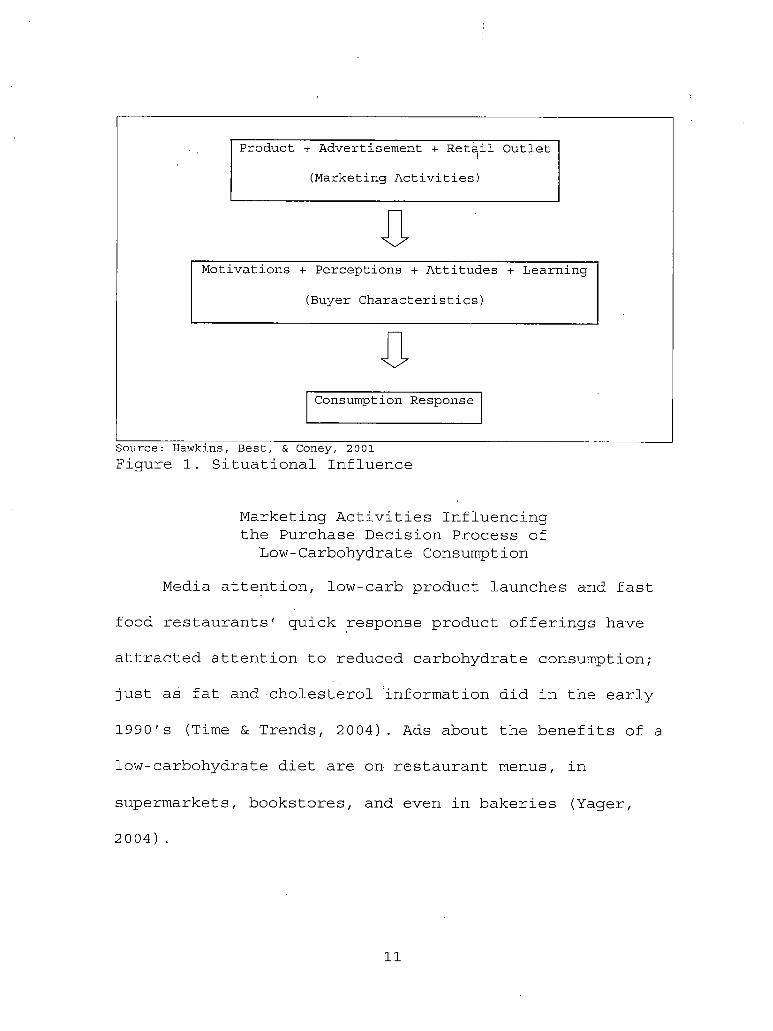
Introduction 9Factors Influencing the Purchase DecisionProcess 9Marketing Activities influencing the Purchase Decision Process ofLow-Carbohydrate Consumption 11Buyer Characteristics InfluencingLow-Carbohydrate Food Purchase 15
CHAPTER THREE METHODOLOGY
Population and Sample 19
Instruments 19Data Analysis Procedures 22
vi
CHAPTER FOUR RESULTS AND DISCUSSION
Introduction 23
Demographics of Respondents 23Study Objectives 25
Objective 1 25Objective 2 29
Objective 3 33
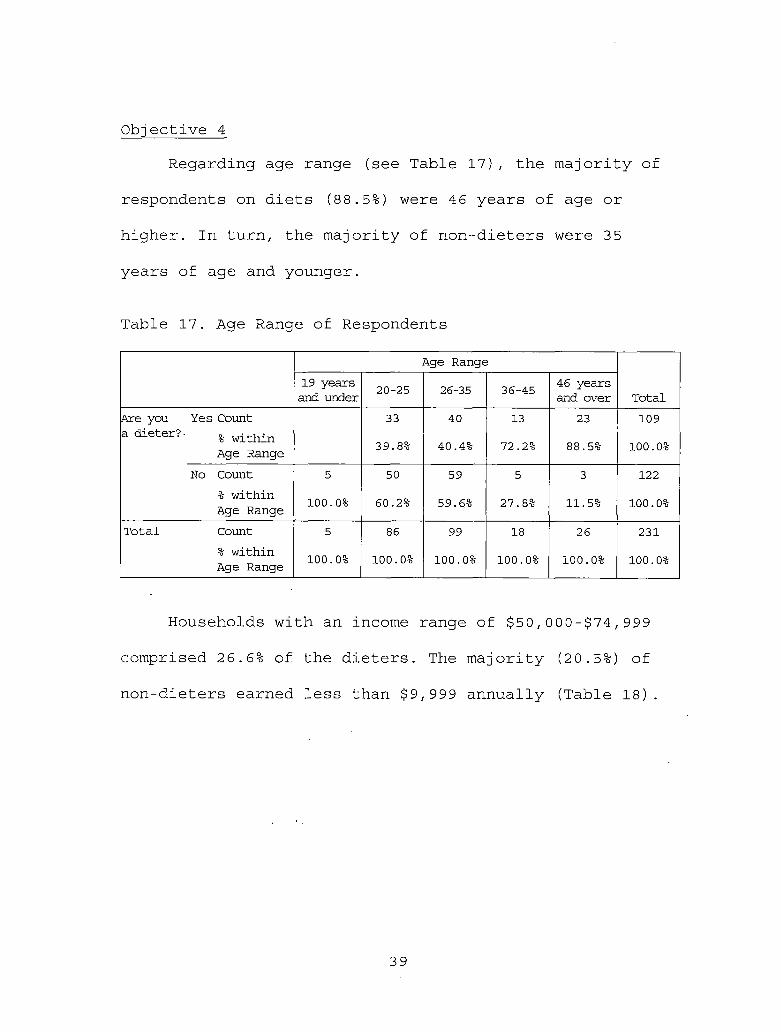
Objective 4 39
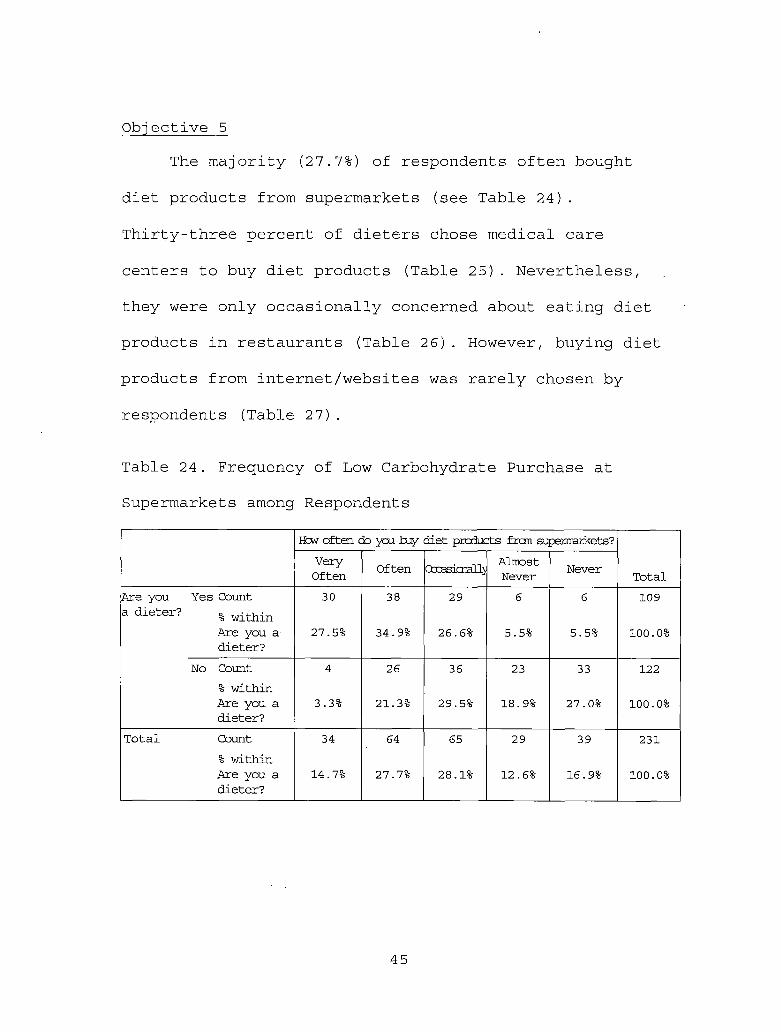
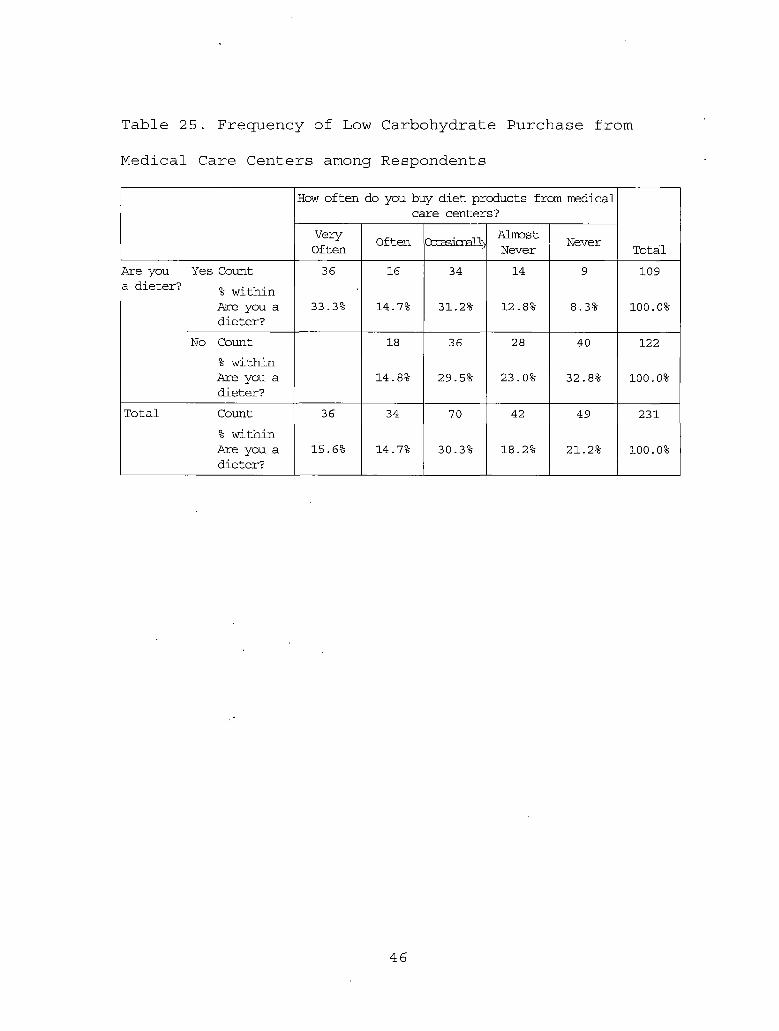
Objective 5 45
CHAPTER FIVE CONCLUSIONS AND RECOMMENDATIONSIntroduction 50Conclusions and Implications 50
APPENDIX QUESTIONNAIRE 56
REFERENCES 6 5
vii
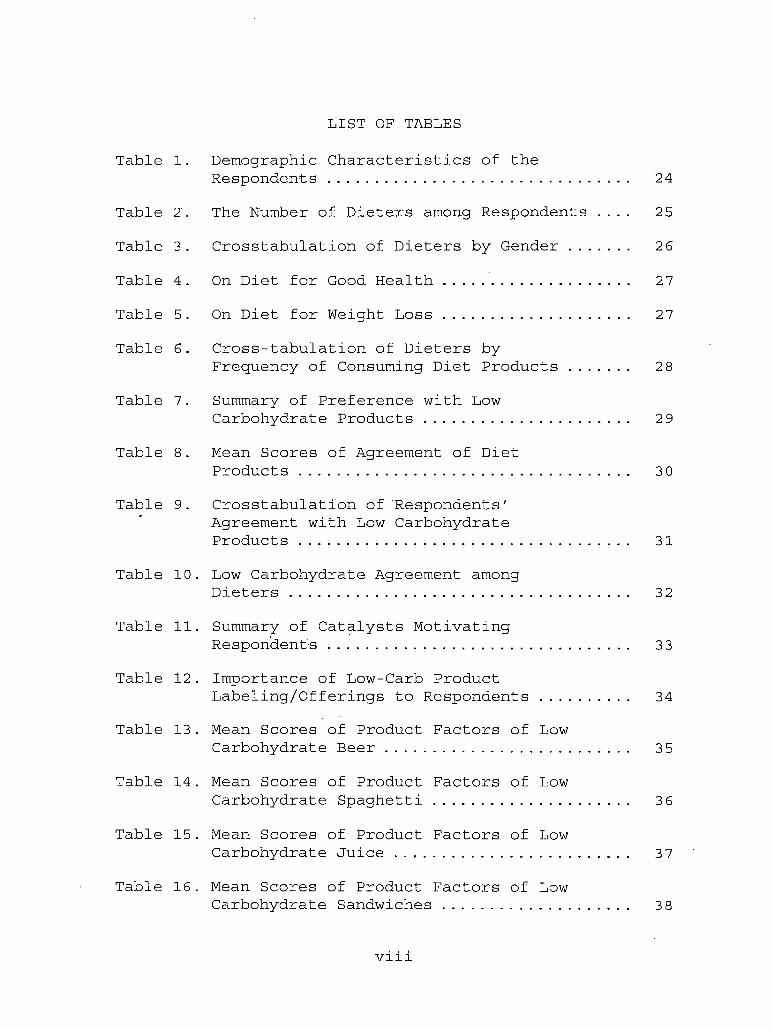
LIST OF TABLES
Table 1 Demographic Characteristics of theRespondents 24
Table 2 The Number of Dieters among Respondents 25
Table 3 Crosstabulation of Dieters by Gender 26
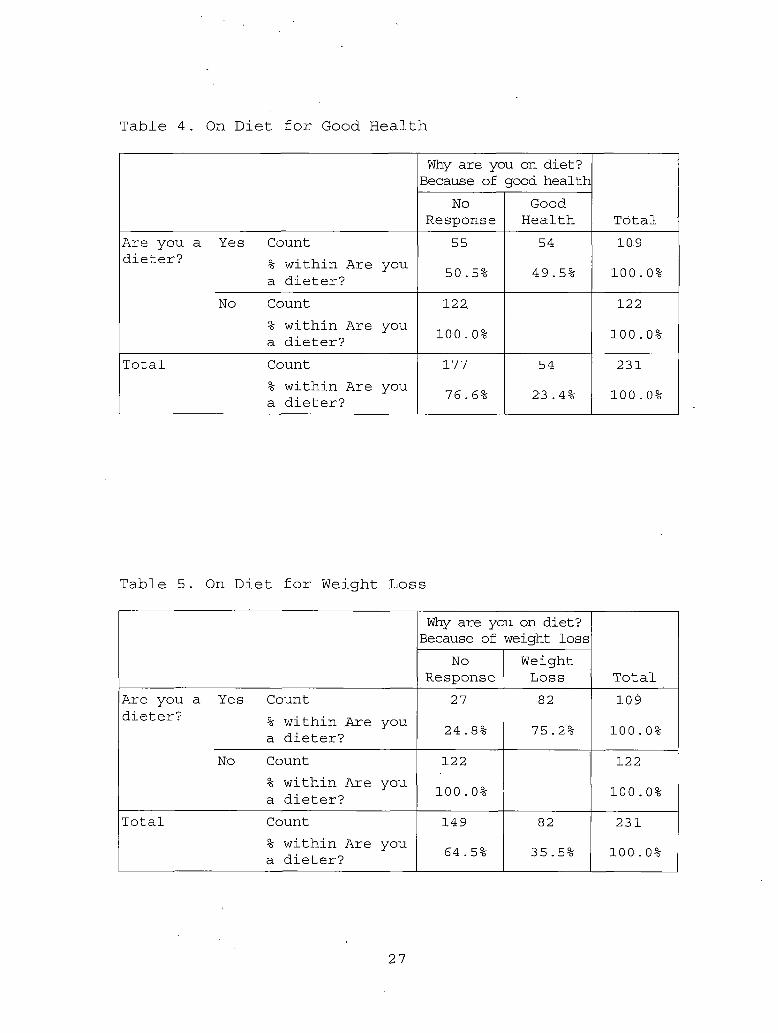
Table 4 On Diet for Good Health 27
Table 5 On Diet for Weight Loss 27Table 6 Cross-tabulation of Dieters by
Frequency of Consuming Diet Products 28
Table 7 Summary of Preference with LowCarbohydrate Products 29
Table 8 Mean Scores of Agreement of DietProducts 3 0
Table 9 Crosstabulation of RespondentsAgreement with Low CarbohydrateProducts 31
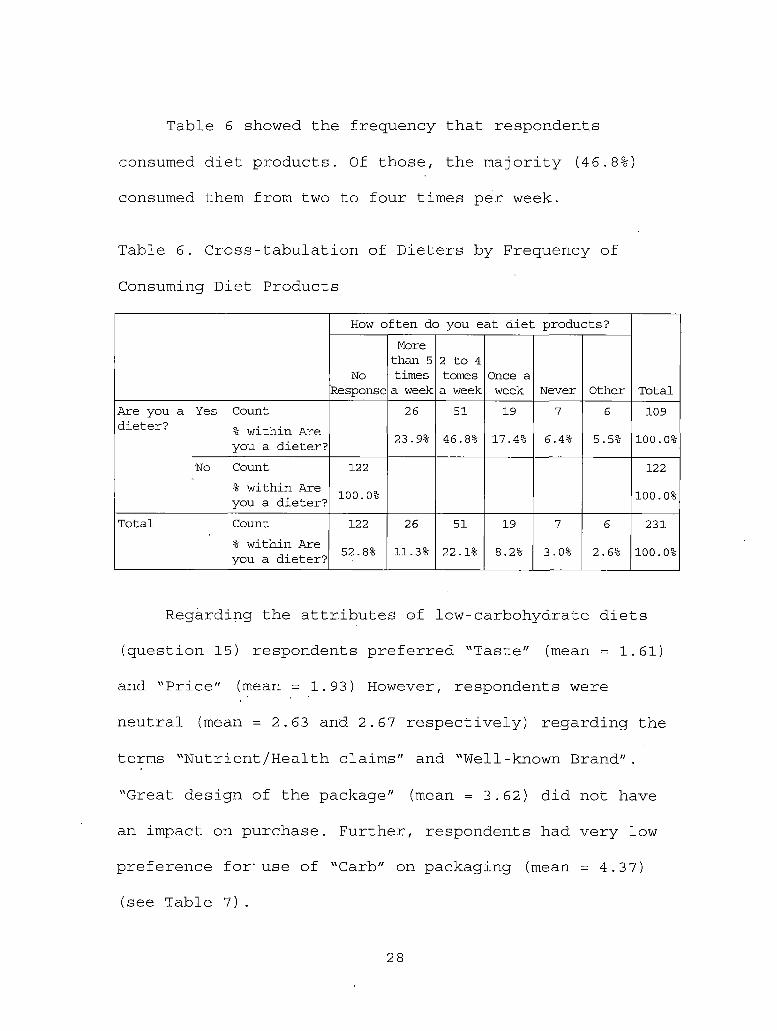
neutral (mean = 263 and 267 respectively) regarding the
terms NutrientHealth claims and Well-known Brand
Great design of the package (mean = 362) did not have
an impact on purchase Further respondents had very low
preference forL use of Carb on packaging (mean = 437)
(see Table 7)
28
Table 7 Summary of Preference with Low Carbohydrate
Products
N MeanStd
DeviationTaste is almost or the same as regular products 231 161 915NutrientHealth claim is shown on the label 231 2 63 1315Brand is well-known 231 267 1069The word Carb is added on the package 231 437 1030Package is interestingattractive 231 362 979Price is not much more expensive than regular products
231 193 1029
Valid N (listwise) 231
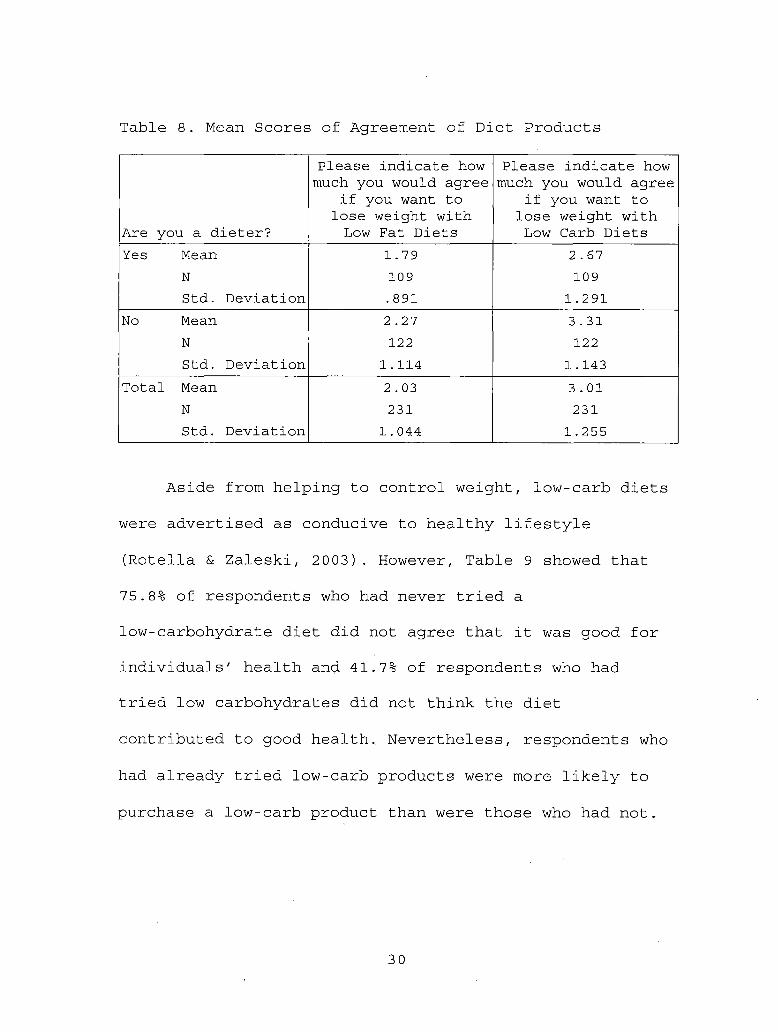
Objective 2
One reason that low-fat was placed on the market
was to appeal to weight-conscious consumers This was
also true for low-carb products Table 8 showed that a
low-fat diet was a strong motive (mean = 176) for
dieters and almost as a strong (mean = 227) by
non-dieters Overall more respondents agreed that a
low-fat diet was more effective than a low-carb diet in
losing weight
29
Table 8 Mean Scores of Agreement of Diet Products
Are you a dieter
Please indicate how much you would agree
if you want to lose weight with Low Fat Diets
Please indicate how much you would agree
if you want to lose weight with Low Carb Diets
Yes Mean 179 267N 109 109Std Deviation 891 1291
No Mean 227 331N 122 122Std Deviation 1114 1143
Total Mean 203 301N 231 231Std Deviation 1044 1255
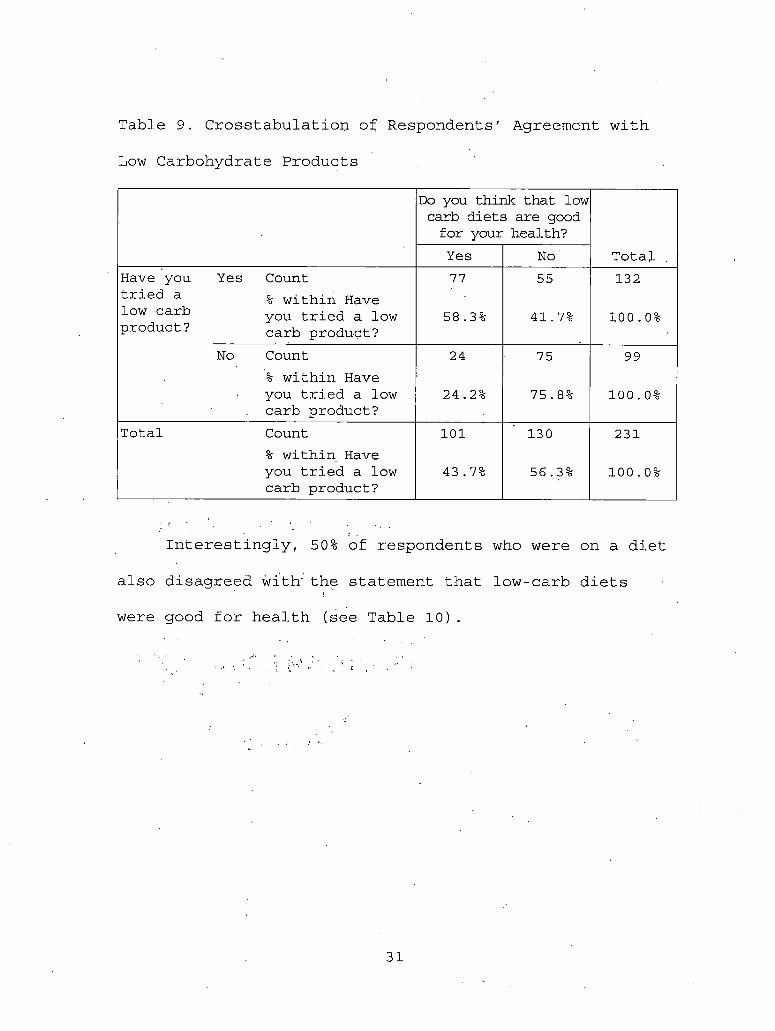
Aside from helping to control weight low-carb diets
were advertised as conducive to healthy lifestyle
(Rotella amp Zaleski 2003) However Table 9 showed that
758 of respondents who had never tried a
low-carbohydrate diet did not agree that it was good for
individuals health and 417 of respondents who had
tried low carbohydrates did not think the diet
contributed to good health Nevertheless respondents who
had already tried low-carb products were more likely to
purchase a low-carb product than were those who had not
30
Table 9 Crosstabulation of Respondents Agreement with
Low Carbohydrate Products
Do you think that low carb diets are good for your health
TotalYes NoHave you Yes Counttried a wj_thin Have
77 55 132
low carb you tried a lowproduct carb produqfc
583 417 1000
No Count within Have
24 75 99
you tried a low carb product
242 758 1000
Total Count within Have you tried a low carb product
101
437
130
563
231
1000
Interestingly 50 of respondents who were on a diet
also disagreed with the statement that low-carb diets
were good for health (see Table 10)
31
Table 10 Low Carbohydrate Agreement among Dieters
Do you think that low carb diets are
good for your health
TotalYes NoAre you a Yes Count 60 49 109dieter within Are
a dieteryou 550 450 1000
No Count 41 81 122 within Are a dieter
you 336 664 1000Total Count 101 130 231
within Are a dieter
you 437 563 1000
Table 11 identifies the catalysts that make people
want to try low-carbohydrate diets The majority of
respondents both dieters and not believed the medical
professionals opinion of low-carb products Overall
most respondents (494) would be convinced to try or
purchase low-carb products upon the recommendation of
medical professionals Nutrientlow-carb claims and
advertising (208 and 199 respectively) were the next
two catalysts that affected respondents concerning
health Other catalysts included friends families and
themselves (74) Of those who believed in the advice of
medical professionals 477 were dieters while 508
were non-dieters The next two catalysts among dieters
32
were advertising and nutrientlow-carb claims (22 and
193 respectively) The second catalyst among
non-dieters was nutrientlow-carb claims (221) followed
by advertising (18)
Table 11 Summary of Catalysts Motivating Respondents
What would be the most common catalyst that makes you try low carb products
TotalMedical
ProfessionalsStore
Environment
Nutrient Low Carb Claims Adveritsing Other
Are you Yes Count a dieter within
52 5 21 24 7 109
Are you a dieter
477 239 468 174 55 1000
No Count 62 1 27 22 10 122 within Are you a dieter
508 8 221 180 82 1000
Total Count 114 6 48 46 17 231 withinAre you a dieter
494 26 208 199 74 1000
Objective 3According to respondents concerns for low-carb
messages on either the product label or on a restaurant
advertisement Table 12 showed that dieters (mean = 294)
had more concern than non-dieters (mean = 393) for
low-carbohydrate information on the label However the
degree of concern for low-carb offerings by restaurants
33
by both groups was only moderate to less important Both
dieters and non-dieters agreed less on the offerings
(mean = 393 and 427 respectively)
Table 12 Importance of Low-Carb Product
LabelingOfferings to Respondents
Are you a dieter
How important is it to you in purchasing food to eat at home that the food has low carb information
on the label
How important is it to you in choosing a
restaurant specifically advertises low carb
offeringsYes Mean 294 393
N 109 109Std Deviation 1442 1152
No Mean 378 427N 122 122Std Deviation 1237 1045
Total Mean 338 411N 231 231Std Deviation 1399 1108
The next four tables reflect respondents opinions
regarding four different low-carbohydrate products
price taste calories carb count and carb labeling
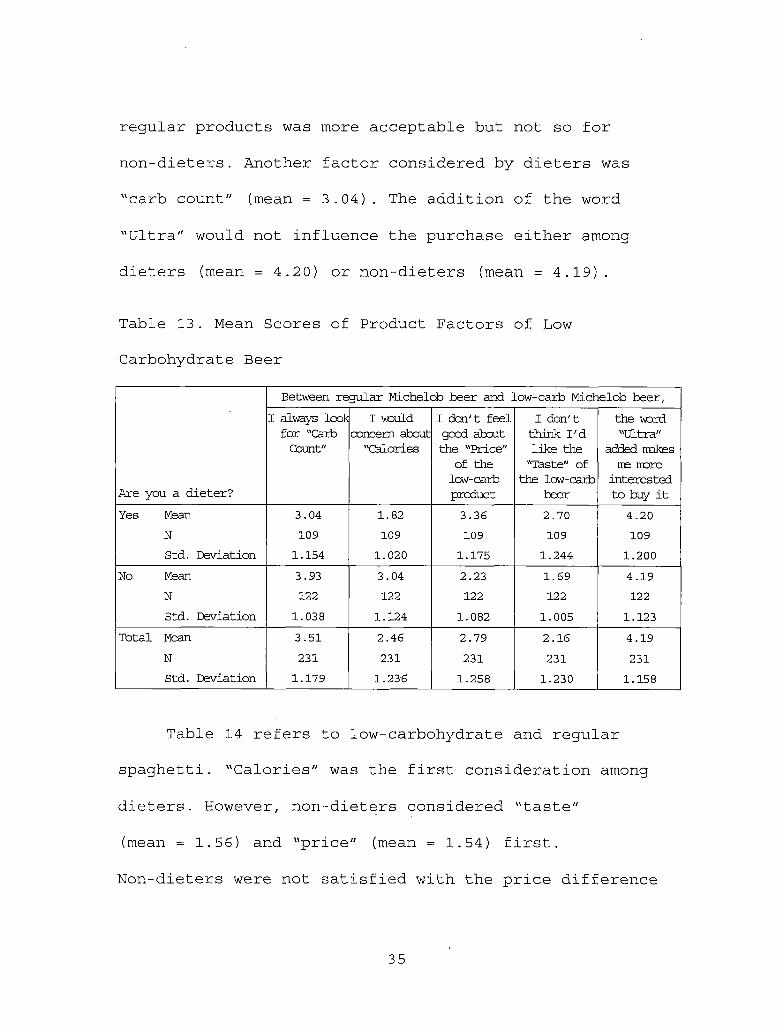
Low-carbohydrate beer Michelob Ultra is offered in
the market survey (Table 13) To dieters calories
(mean = 182) were of concern however to non-dieters
taste (mean = 169) was their primary consideration To
dieters paying a bit more for the low carbs than the
34
regular products was more acceptable but not so for
non-dieters Another factor considered by dieters was
carb count (mean = 304) The addition of the word
Ultra would not influence the purchase either among
dieters (mean = 420) or non-dieters (mean = 419)
Table 13 Mean Scores of Product Factors of Low
Carbohydrate Beer
Are you a dieter
Between regular Michelob beer and low-carb Michelob beerI always look for Carb Count
diet products and to identify the factors that influenced
their decision to purchase low-carbohydrate food Because
of epidemic of obesity and diabetes among Americans
low-fat foods contribute to good health and weight
control (UC Berkeley Wellness Letter 2004) However
obesity and diabetes rates remain high (Daniels 2003)
As a result people on low carbohydrates experience
weight loss lowered triglycerides and lower cholesterol
(Bowden 2004) Today the focus is on carbohydrate
reduction (Woodruff2004)This practice emphasized the
fact that the suppliers and manufacturers of low-carb
food markets should understand the demands of their
consumers when it comes to low-carbohydrate foods Today
50
carb is widely used in product packaging to capture
market sales (Addis 2004) However brand taste and
price attributes are still important to consumers
(Beirne 2004) Therefore it is necessary for food
marketers to understand and meet the demand for
low-carbohydrate products given these criteria
Results showed that females seemed to be more
concerned about their food consumption than males are
Most of the dieters were 46 years old and over with
incomes ranging from $50000 - $74999 Moreover people
with medical conditions such as diabetes tended to pay
more attention to low-carb information Most respondents
consumed diet products between two and four times per
week
Weight loss was the primary factor in respondents
consumption of diet products However low-fat diets were
still thought to be more effective than low-carb diets in
weight reduction This finding confirms ODCs (2005)
conclusion that consumers are more concerned with fat
content than with any other nutritional claim Still
fewer than 50 of respondents agreed that low-carb diets
were good for health
51
In general low-carbohydrate information on both the
label and on restaurant menus was important for dieters
but not for non-dieters Most respondents preferred
low-carbohydrate products that tasted as much like the
original as possible This finding is consistent with
that of the IRIs Consumer Network (2001) that determined
that taste was a key factor in food and beverage
selection Brand recognition was expected most from
non-dieters However for dieters Brand was less
important than low-carb claims which refers not only
to carb count but also to calories something that
was very important to most dieters Topkis (2003) found
that many low-carb products were often more expensive
than the original or than other products in the same
category The findings consistently indicated that
low-price or equal price of low-carb products had an
impact on purchases -especially among non-dieters who
were interested in trying something different but not in
paying more-
Although Addis (2004) expected that trademarks
combined with the word carb would sell more results
indicated that the word carb on the package had the
least importance in influencing respondents purchasing
52
decision Most respondents placed little credence in the
word carb however the word light had more of an
impact
Implications of the findings suggest that medical
care centers would be the best place to provide
low-carbohydrate products for people who have a medical
condition For other people supermarkets might be the
best place to offer low-carbohydrate foods Restaurant
menus present the occasional opportunity to dine on
low-carbohydrate products However websites would not be
a good place to market low-carbohydrate products because
people rarely buy diet products online
It is also recommended that low-carb advertisements
appear in newspapers because people age 46 years and over
spend the most time reading the newspaper
Also radio stations which most people listen to
regularly should have low-carb advertisements Magazines
should focus only on people age 20 to 35 Since medical
professionals have a great influence upon purchases they
might want to try low-carbohydrate products Their
recommendation can help promote the sale of low-carb
diets
53
Results indicated that most respondents had more
confidence in low-fat foods than in low-carbohydrate
foods Consequently a further recommendation is for diet
products to focus on being low-fat rather than the
low-carb particularly in package labeling This claim
is supported by the findings that lower fat is better
than fewer carbs for weight loss low fat promotes better
health than fewer carbs and buyers would be more
attracted to low-fat products than to products that were
labeled as low-carb
In terms of product labeling low-fat appeared to be
the most significant influence upon weight-conscious
respondents Consequently low-fat labeling should be
emphasized more than low-carb as well as in
advertisements Having words that consumers can easily
see while making a purchase can aid in a
salesfactoryexperience Further manufacturers should
research and produce tasty but reasonably-priced low-fat
and low-carb products to drive sales
However low-carbohydrate diets were still needed
among diabetic respondents (Table 20) Therefore the
niche market of low-carb products should focus on
diabetics
54
While most diabetics cited low carbohydrates as
their primary reason to stay healthy and control weight
weight watchers trusted low-fat diets more so than
low-carb ones Medical professionals should be encouraged
to endorse the health benefits of reducing carbohydrate
intake for good health
55
APPENDIX
QUESTIONNAIRE
56
Public Opinion Survey
The purpose of this survey is to learn peoplesrsquo preferences and opinions toward low carbohydrate carbohydrate-controlled products Please take 7-10 minutes to complete the questionnaire There is no right or wrong answer Your responses will be kept confidential Thank you very much for your help in this research effort
Please nut an X on the blank that best describes your opinion
Section 1
1) Are you a dieter__ Yes __ No (Go to Question No4)
2) Why are you on diet (Check all that apply)__ Good Health ___Weight loss ___Other_______
3) How often do you eat diet products__ more than 5 times a week __ 2 to 4 times a week__ Once a week __ Never__ Other______
4) Please indicate how much you would agree (if you wanted to lose weight) with each of the following by checking the blank that best represents your response
6) Do you think that low-carb diets are good for your health__ Yes __ No
7) What would be the most common catalyst that would make you try a low-carb product
__ Medical professionals __ Store environment__ NutrientLow Carb Claims ___Advertising (eg TV magazine)__ Other_______
57
8) Please indicate how often you would buyeat diet products from each of following place by circling the number that best represents your response
1- Very Often 2- Often 3- Occasionally 4- Almost Never 5- Never
A Restaurants 1 2B Supermarkets 1 2C Medical Care Centers 1 2D Websites 1 2E Others 1 2
(Please specify)
3 4 5 3 4 5 3 4 5 3 4 5 3 4 5
9) Check the blank that best represents your response
A How important is it to you to purchase food to eat at home than food with low- carb information on the label
Most important Least important
B How important is it to you to choose a restaurant that specifically advertises low- carb offerings
Most important ___ ____ ____ ____ ___Least important
MICHELOB ULTRAreg vs MICHELOBreg26 g CARBS 133 g95 CALORIES 155
$175 PRICEServing size 12 oz
$135
From above information between regular Michelob beer and low-carb Michelob beer (Michelob ultra)how would you respond to the following Check the blank that best represents bull your response
58
A I always look at carb count
Strongly Agree Strongly Disagree
B I would be concerned about ldquoCaloriesrdquo
Strongly Agree Strongly Disagree
C I donrsquot feel good about the price of the low-carb product so I wouldnrsquot buy it
Strongly Agree Strongly Disagree
D I donrsquot thinkI would like the ldquoTasterdquo of low-carb beer
Strongly Agree Strongly Disagree
E The word ldquoUltrardquo on the product makes memoreinterested in buying it
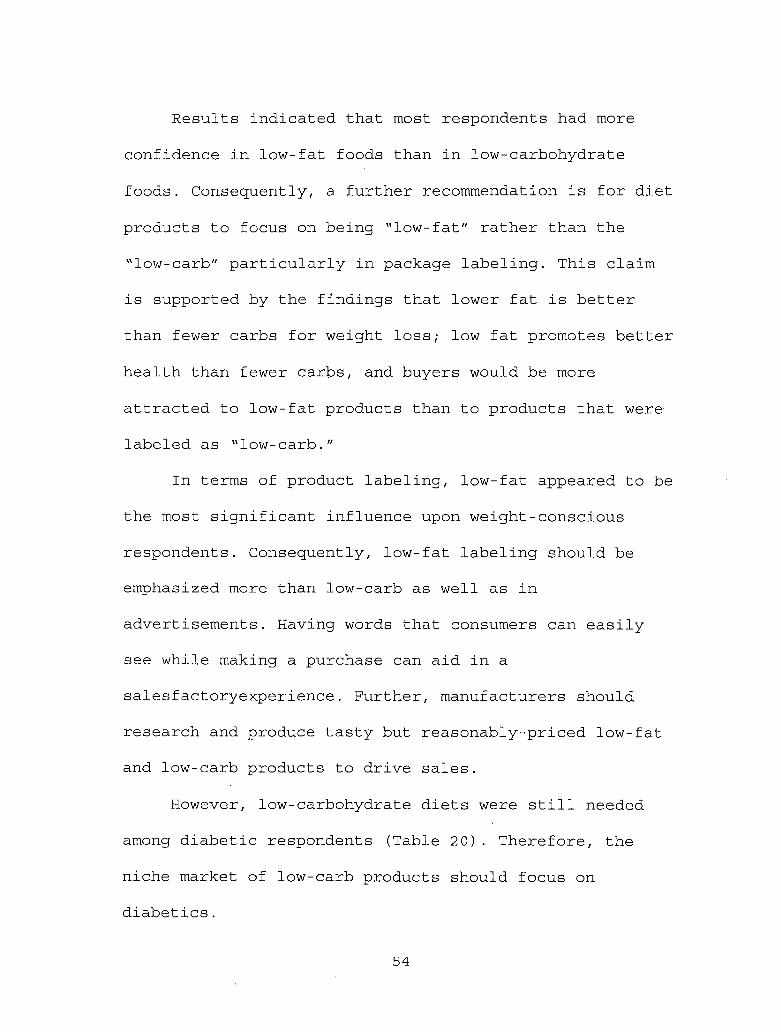
From above information between Muellerrsquos reduced-carb spaghetti and Muellerrsquos regular how would you respond to the following Check the blank that best represents your response
59
A I always look at carbCount
Strongly Agree Strongly Disagree
B I would be concerned about ldquoCaloriesrdquo
Strongly Agree Strongly Disagree
C I donrsquot feel goodabout the price of the low-carb product so I wouldnrsquot buy it
Strongly Agree Strongly Disagree
D I donrsquot think I would like the ldquoTasterdquo of the low-carb spaghetti
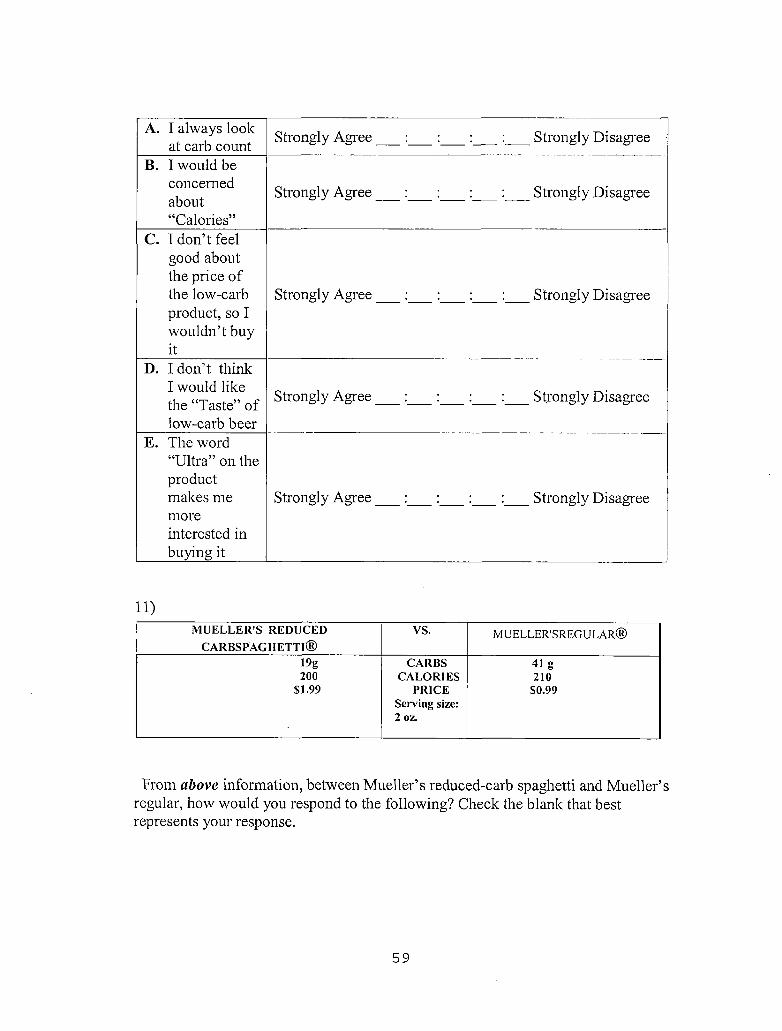
From above information between Tropicana lightrsquon healthy and Tropicana pure premium how would you respond to the following Check the blank that best represents your response
60
A I always look at carb count
Strongly Agree Strongly Disagree
BI would beconcernedaboutldquoCaloriesrdquo
Strongly Agree Strongly Disagree
CI would buy the low-carb product because itrsquos the
Strongly Agree Strongly Disagree
same price as the regular
DI donrsquot think I would like the ldquoTasterdquo of the
Strongly Agree Strongly Disagree
low-carb juiceE The word
ldquoLightrdquo on the product makes me more
Strongly Agree Strongly Disagree
interested to buy it
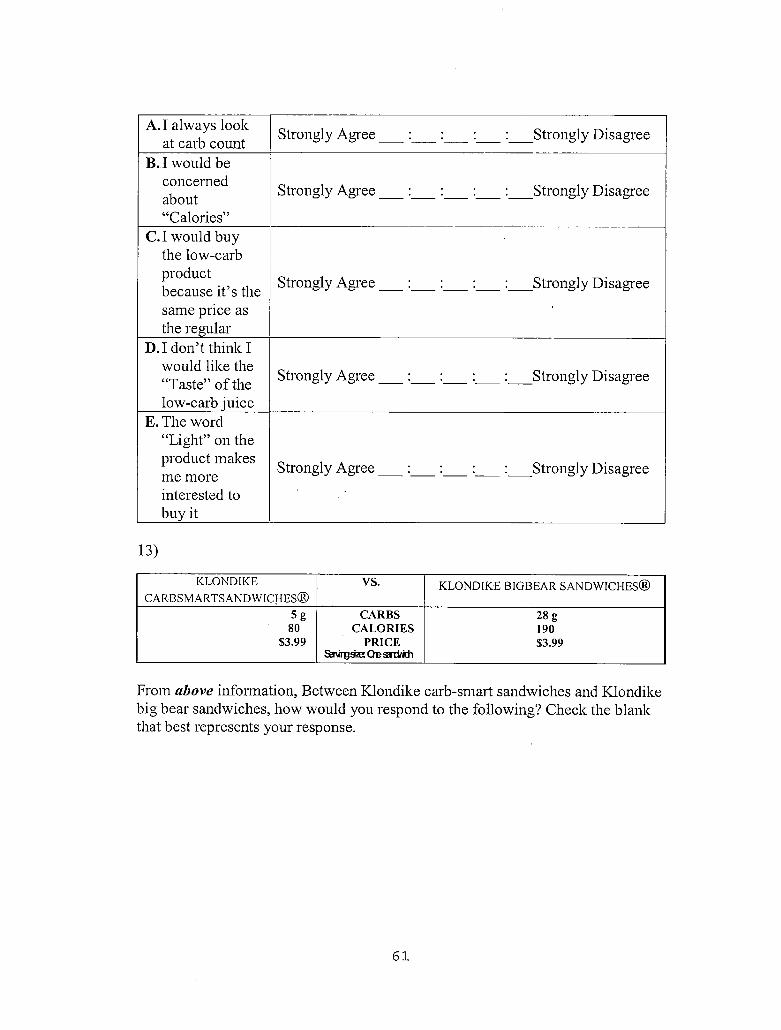
13)
KLONDIKECARBSMARTSANDWICHESreg
VS KLONDIKE BIGBEAR SANDWICHESreg
5g CARBS 28 g80 CALORIES 190
$399 PRICESferurgsx Oesrdridi
$399
From above information Between Klondike carb-smart sandwiches and Klondike big bear sandwiches how would you respond to the following Check the blank that best represents your response
61
A I always look at carb count
Strongly Agree Strongly Disagree
B I would be be concerned about ldquoCaloriesrdquo
Strongly Agree Strongly Disagree
C I would buy the low-carb product because itrsquos the same price as the regular
Strongly Agree Strongly Disagree
D I donrsquot think I would like the ldquoTasterdquo of the low-carb sandwiches
Strongly Agree Strongly Disagree
E The word ldquoCarbsmartrdquo on the product makes memoreinterested to buy them
Strongly Agree Strongly Disagree
62
14) If you were to make a decision to buy a low carbohydrate product please rate your preference for each of the following features that best represents your response
A Whether or not the ldquoTasterdquo is almost or the same as the regular product
High preference Low preference
B Preference for ldquoNutri entHealth claimrdquo on the label
High preference Low preference
C Product is made by a well-known ldquoBrandrdquo High preference Low preference
D Product package contains the word ldquoCarbrdquo
High preference Low preference
E ldquoPackagerdquo is great designed High preference Low preference
F The ldquoPricerdquo of low-carb product the same or only a bit more expensive than the regular product
High preference Low preference
15) What media do you usually use (Please check all that apply)___ Radio Station___ Television___ Newspaper___ Magazine
Internet
63
Section 2 About you
1) What is your gender__ Male
2) Which age range applies to you__ 19 years and under_ 36-45
3) What is your educational background__ High school__ Associate degree__ Graduate or professional degree
4) What is your ethnic background
Female
20-2546 years and over
CollegeBachelorrsquos degree
26-35
WhiteBlack
_ Hispanic Asian
Pacific Islander Native American Multi Racial Other
5) What is your approximately total household income_ Less than $9999 _ $ 10000-$ 14999_ $15000-$24999 _ $25000-$49999_ $50000-$74999 _ $75000-$99999__ $100000 and over
6) Do you have any medical conditions (Check all that apply)__ Diabetes__ Obesity__ I donrsquot have
Other
laquoThank You
64
REFERENCES
Addis S (2004) Think outside the low-carb box Advertising Age 75(26) 22
Alvensleben R (1997) Consumer behaviour Agro-food marketing Wallingford CAB Publishing
Astrup P Thomas M L amp Harper A(2004) Atkins and other low-carbohydrate diets Hoax or an effect tool for weight loss Lancet 364(9437) 897-899
Atkins R (1998) Dr Atkins new diet revolution (3rd ed) New York Simon amp Schuster
Atkins R (2002) Dr Atkins new diet revolution New York Avon Books
Banking Business (2004) Low-carb sales trends andconsumer attitudes Retrieved December 5 2004 from httpwwwbankingbusinesscomco_articleaspArticleID=72 022
Beirne M (2004) Confectioners unwrap low-card strategies Brandweek 45(24) 14
Bowden J (2004) Low carb diets insulin resistance and diabetes Total Health 26(2) 22-23
Cole W (2004) Is bread toast Time Magazine 163(18) 50-51
Current Events (2004) Carb-crazed Retrieved December 6 2004 from httplibproxylibcsusbedu loginurl=http search epnet com- libproxy lib csusb eduloginaspxdirect=trueampAuthType=cookieipurluidampdb=aphampan=14441487
Daniels S R (2003) Abnormal weight gain and weightmanagement are carbohydrates the enemy Journal of Pediatrics 142 225-227
65
DeNoon D (2004) Is the low-carb craze waning Retrieved December 5 2004 fromhttpcontenthealthmsncomcontentarticle90 100819htmGTl=4244
Ebenkamp B (2004) Baby you deprive my carbs Brandweek 45(11) 20-22
Food Navigator (2004) Low-carb losing its sparkle Retrieved December 5 2004 from http www f oodnavigator comnews printNewsBisaspid=53564
Foxall G R (1988) Marketing new technology markets hierarchies and user initiated innovation Managerial and Decision Economics 9 237-250
Gloede W F (2004) Diet Inc American Demographics 25(10) 32-34
Hawkins D I Roger J B amp Kenneth A C (2001) Consumer Behavior New York McGraw-Hill
Information Resources Incorporate (2003) Fifty-two weeks through mid-year 2003 Retrived March 24 2005 from httpwwwinforescompublicus contentconsumernetworkdefaulthtm
Julie S (2004) What does it mean to be low carb Retrieved December 19 2004 from httpIwwwusatodaycommoneyindustriesfood2 0 04 - 05-25-low-carb_xhtm
Kadlec D Rawe J Park A Fonda D Cole W DeQuine J Healy R Hequet M Hylton H Locke L A amp Scully S (2004) The low-carb frenzy Time Magazine 163(18) 46-53
Kotler P 6 Armstrong G (1993) Maketing An Introduction 3rd ed NY Prentice Hall
LaMar K A Groller K Marroco R Housand LMalecki J Wong S amp Tan L (2004) You asked us Prevention 56(6) 33-38
66
Opinion Dynamic Corporations (2005) Measuring thelow-carb revolution Retrieved March 25 2005 from httpwwwopiniondynamicscomlowcarbhtml
Reyes S (2004) Crowded low-carb market to face new FDA guidelines Brandweek 45(25) 44
Reyes S (2004) New Yoplait launch milks low-carb craze Brandweek 45(18) 12
Reyes S (2004) Wal-mart line may starve low-carb foes Brandweek 45(25) 6
Richard L (2004) The secret to low carb successreduced carbohydrate is the key to success New York Kensington Publishing Corp
Rotella M amp Zaleski J (2003) Low-carb from myth to reality Publishers Weekly 250(5) 71
Thompson S (2004) Carb craze hit by reality check Advertising Age 75(23) 1-2
Thompson S (2004) Food marketers grapple with carb conundrum Advertising Age 75(19) 4-5
Thompson S (2004) Low-carb craze blitzes food biz Advertising Age 75(1) 1-2
Time and Trends (2004) The wellness evolution chasing the low carb consumer Retrieved April 3 2004 from httpwwwinforescompublicusnewsEvents thoughtleadershiptt_issuel8pdf
Topkis M (2003) The lowdown on low carb Money32(13) 218-219
Tsao A (2004) Lean times for food stocks Retrieved December 5 2004 fromhttpwwwbusinessweekcombwdailydnflashmay2004 nf20040518 9901 db014htm
67
Tufts University (2003) Low-carb craze or low-carbcrazy Tufts University Health amp Nutrition Letter 21(8) 4-5
University of California Berkeley (2004) Low-carbfoods less than meets the eye Retrieved December 20 2004 from httpwwwberkeleywellnesscom htmlwl2004wlFeatured0104html
Woodruff S (2004) Finding the right foods Better Nutrition 66(1) 29-32
Woodruff S (2004) Good-cardlow-card living Better Nutrition 66(6) 37-40
Yager J (2004) Low-carbohydrate diet vs low-fat diet no differences after 1 year Eating DisordersReview 15(4) 2-3
68
Factors influencing purchasing decision process of low-carbohydrate products
Recommended Citation
regular products was more acceptable but not so for
non-dieters Another factor considered by dieters was
carb count (mean = 304) The addition of the word
Ultra would not influence the purchase either among
dieters (mean = 420) or non-dieters (mean = 419)
Table 13 Mean Scores of Product Factors of Low
Carbohydrate Beer
spaghetti Calories was the first consideration among
dieters However non-dieters considered taste
(mean = 156) and price (mean = 154) first
Non-dieters were not satisfied with the price difference
between the regular ($099) and the low-carb versions
($199) In turn dieters accepted a higher price
however they were not always likely to buy the
higher-priced product (mean = 254) Carb count was
always a consideration of dieters (mean = 288) but low
consideration was given to the word carb added
(mean = 443) Non-dieters were not very concerned with
carb count (mean = 389) and they strongly disagreed
that the word carb added was important to them
(mean = 451)
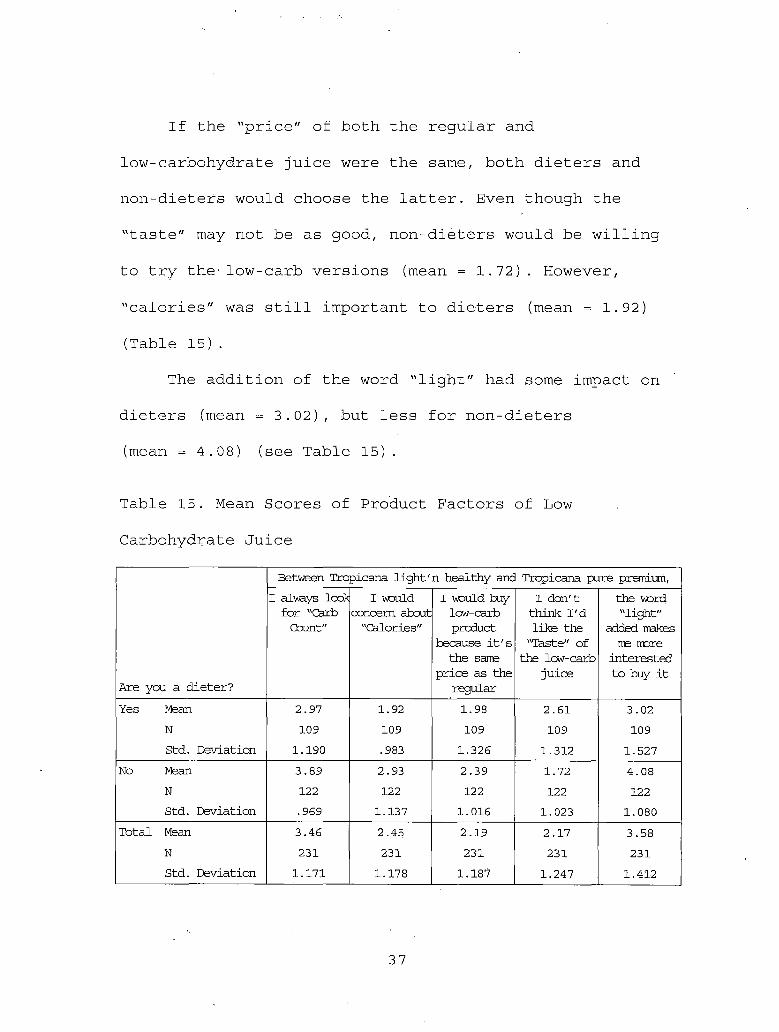
If the price of both the regular and
low-carbohydrate juice were the same both dieters and
non-dieters would choose the latter Even though the
taste may not be as good non-dieters would be willing
to try the- low-carb versions (mean = 172) However
calories was still important to dieters (mean = 192)
(Table 15)
The addition of the word light had some impact on
dieters (mean = 302) but less for non-dieters
(mean = 408) (see Table 15)
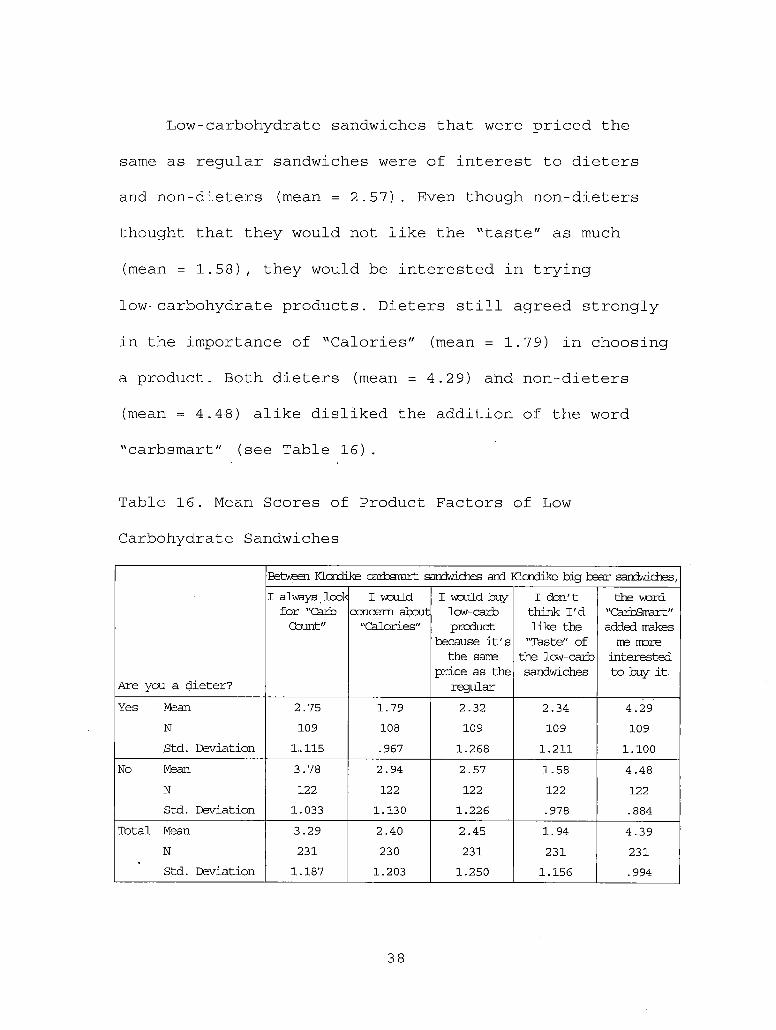
Low-carbohydrate sandwiches that were priced the
same as regular sandwiches were of interest to dieters
and non-dieters (mean = 257) Even though non-dieters
thought that they would not like the taste as much
(mean = 158) they would be interested in trying
low-carbohydrate products Dieters still agreed strongly
in the importance of Calories (mean = 179) in choosing
a product Both dieters (mean = 429) and non-dieters
(mean = 448) alike disliked the addition of the word
carbsmart (see Table 16)
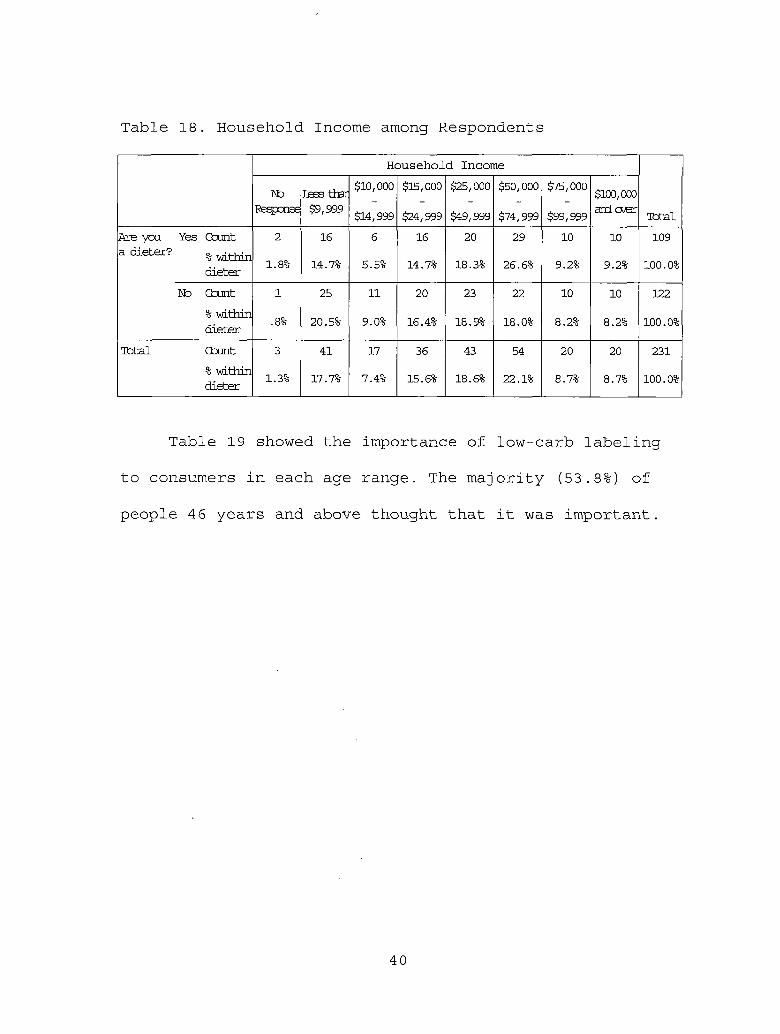
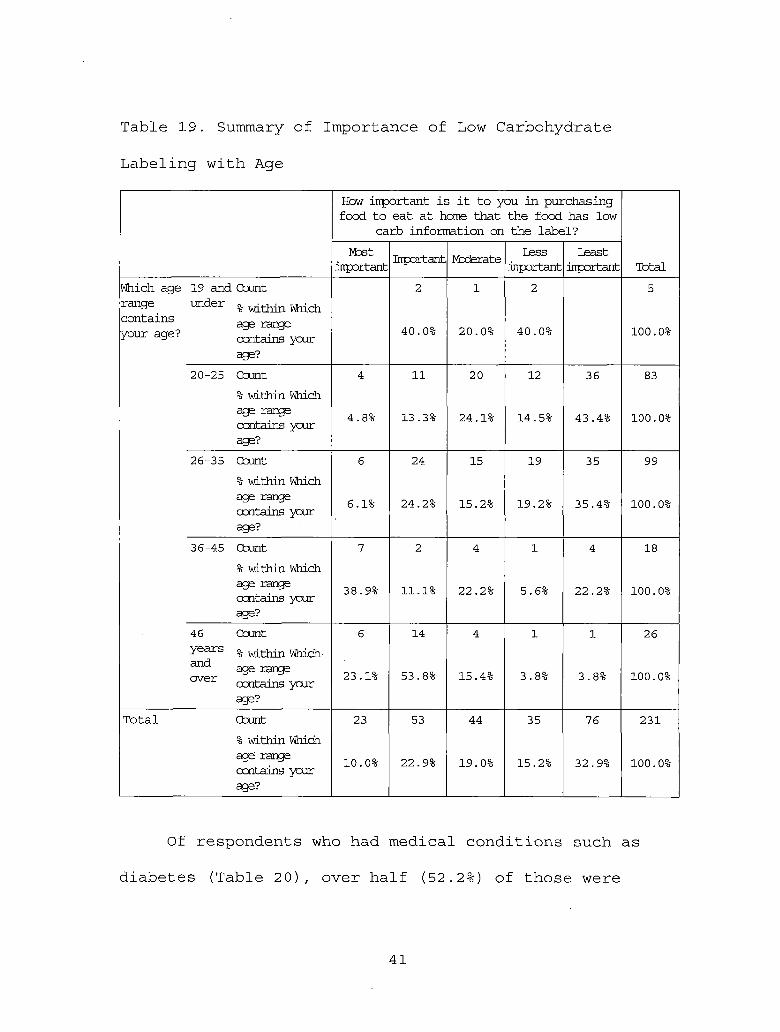
Table 19 showed the importance of low-carb labeling
to consumers in each age range The majority (538) of
people 46 years and above thought that it was important
Of respondents who had medical conditions such as
diabetes (Table 20) over half (522) of those were
mostly concerned about low-carb information on the label
and approximately 35 of them thought that low-carb
labeling was important (see Table 20)
Many of respondents who were obese (40) felt
neutral about choosing a product with low-carb labeling
However up to 33 of them thought that it was important
to have low-carb labeling when buying food to eat at home
(Table 21)
Tables 22 and 23 showed that the majority (696) of
diabetic respondents were age 46 years and over (see
Table 22) Also the majority (60) of those who
considered themselves obese were age 46 years and over
(see Table 23)
those 46 and over used the internet for research (see
Table 28)
FACTORS INFLUENCING PURCHASING DECISION PROCESS
OF LOW-CARBOHYDRATE PRODUCTS
A Project
Presented to the
Faculty of
California State University
San Bernardino
In Partial Fulfillment
of the Requirements for the Degree
Master of Business Administration
by
Warintra Triyangkulsri
December 2005
FACTORS INFLUENCING PURCHASING DECISION PROCESS
OF LOW-CARBOHYDRATE PRODUCTS
A Project
Presented to the
Faculty of
California State University
San Bernardino
by
Warintra Triyangkulsri
December 2005
Date
copy 2005 Warintra Triyangkulsri
ABSTRACT
A growing number of diet trends are spreading across
the nation in an effort to improve health and lose weight
such as the Atkins diet and the South Beach diet Low-fat
and low-carbohydrate diets are the most popular and in
the last two years the number of low-carbohydrate
products available in stores has sharply increased
Consequently the word carb is used extensively in food
packaging however many low-carbohydrate products are
expensiveand tasteless Hence the purpose of this study
was to determine attitudes toward low-carbohydrate diets
among consumers and the attributes that influence their
purchase decision Results showed that consumers trusted
low-fat diets more than low-carbohydrate ones regarding
achieving weight loss and improved health Further price
and taste of low-carb products were the most problematic
factors that affected consumers purchase decision
Findings suggest that suppliers and manufacturers of diet
foods should focus on low-fat attributes in package
labeling instead of low-carb However findings also
suggest that since diabetics must follow low-carbohydrate
iii
diets that medical institutions consider distributing
such products as well as grocery chains
iv
ACKNOWLEDGMENTS
Without my excellent advisor Dr Victoria Seitz
this project would not exist Her willingness to- spend
long hours guiding advising organizing and editing the
contents was a critical factor in writing this study I
will always appreciate her high-quality help guidance
and support toward the completion of this project Thanks
also go to Dr Eric Newman and Dr Vic Johar my
committee members for the contributions to complete the
project With the encouragement of my parents and my
friends I could have the time or energy to finish this
study Special thanks go to all of the participants
helping me answering all questions on the survey to meet
the project objectives as well
v
DEDICATION
To Triyangkulsri family
TABLE OF CONTENTS
ABSTRACT iiiACKNOWLEDGMENTS v
LIST OF TABLESviiiLIST OF FIGURES X
CHAPTER ONE BACKGROUND
Introduction 1
Problem Statement 3Purpose of the Project 4
Limitations of the Project 5
Definition of Terms 5
Organization of the Project 7
CHAPTER TWO REVIEW OF THE LITERATURE
Introduction 9Factors Influencing the Purchase DecisionProcess 9Marketing Activities influencing the Purchase Decision Process ofLow-Carbohydrate Consumption 11Buyer Characteristics InfluencingLow-Carbohydrate Food Purchase 15
CHAPTER THREE METHODOLOGY
Population and Sample 19
Instruments 19Data Analysis Procedures 22
vi
CHAPTER FOUR RESULTS AND DISCUSSION
Introduction 23
Demographics of Respondents 23Study Objectives 25
Objective 1 25Objective 2 29
Objective 3 33
Objective 4 39
Objective 5 45
CHAPTER FIVE CONCLUSIONS AND RECOMMENDATIONSIntroduction 50Conclusions and Implications 50
APPENDIX QUESTIONNAIRE 56
REFERENCES 6 5
vii
LIST OF TABLES
Table 1 Demographic Characteristics of theRespondents 24
Table 2 The Number of Dieters among Respondents 25
Table 3 Crosstabulation of Dieters by Gender 26
Table 4 On Diet for Good Health 27
Table 5 On Diet for Weight Loss 27Table 6 Cross-tabulation of Dieters by
Frequency of Consuming Diet Products 28
Table 7 Summary of Preference with LowCarbohydrate Products 29
Table 8 Mean Scores of Agreement of DietProducts 3 0
Table 9 Crosstabulation of RespondentsAgreement with Low CarbohydrateProducts 31
neutral (mean = 263 and 267 respectively) regarding the
terms NutrientHealth claims and Well-known Brand
Great design of the package (mean = 362) did not have
an impact on purchase Further respondents had very low
preference forL use of Carb on packaging (mean = 437)
(see Table 7)
28
Table 7 Summary of Preference with Low Carbohydrate
Products
N MeanStd
DeviationTaste is almost or the same as regular products 231 161 915NutrientHealth claim is shown on the label 231 2 63 1315Brand is well-known 231 267 1069The word Carb is added on the package 231 437 1030Package is interestingattractive 231 362 979Price is not much more expensive than regular products
231 193 1029
Valid N (listwise) 231
Objective 2
One reason that low-fat was placed on the market
was to appeal to weight-conscious consumers This was
also true for low-carb products Table 8 showed that a
low-fat diet was a strong motive (mean = 176) for
dieters and almost as a strong (mean = 227) by
non-dieters Overall more respondents agreed that a
low-fat diet was more effective than a low-carb diet in
losing weight
29
Table 8 Mean Scores of Agreement of Diet Products
Are you a dieter
Please indicate how much you would agree
if you want to lose weight with Low Fat Diets
Please indicate how much you would agree
if you want to lose weight with Low Carb Diets
Yes Mean 179 267N 109 109Std Deviation 891 1291
No Mean 227 331N 122 122Std Deviation 1114 1143
Total Mean 203 301N 231 231Std Deviation 1044 1255
Aside from helping to control weight low-carb diets
were advertised as conducive to healthy lifestyle
(Rotella amp Zaleski 2003) However Table 9 showed that
758 of respondents who had never tried a
low-carbohydrate diet did not agree that it was good for
individuals health and 417 of respondents who had
tried low carbohydrates did not think the diet
contributed to good health Nevertheless respondents who
had already tried low-carb products were more likely to
purchase a low-carb product than were those who had not
30
Table 9 Crosstabulation of Respondents Agreement with
Low Carbohydrate Products
Do you think that low carb diets are good for your health
TotalYes NoHave you Yes Counttried a wj_thin Have
77 55 132
low carb you tried a lowproduct carb produqfc
583 417 1000
No Count within Have
24 75 99
you tried a low carb product
242 758 1000
Total Count within Have you tried a low carb product
101
437
130
563
231
1000
Interestingly 50 of respondents who were on a diet
also disagreed with the statement that low-carb diets
were good for health (see Table 10)
31
Table 10 Low Carbohydrate Agreement among Dieters
Do you think that low carb diets are
good for your health
TotalYes NoAre you a Yes Count 60 49 109dieter within Are
a dieteryou 550 450 1000
No Count 41 81 122 within Are a dieter
you 336 664 1000Total Count 101 130 231
within Are a dieter
you 437 563 1000
Table 11 identifies the catalysts that make people
want to try low-carbohydrate diets The majority of
respondents both dieters and not believed the medical
professionals opinion of low-carb products Overall
most respondents (494) would be convinced to try or
purchase low-carb products upon the recommendation of
medical professionals Nutrientlow-carb claims and
advertising (208 and 199 respectively) were the next
two catalysts that affected respondents concerning
health Other catalysts included friends families and
themselves (74) Of those who believed in the advice of
medical professionals 477 were dieters while 508
were non-dieters The next two catalysts among dieters
32
were advertising and nutrientlow-carb claims (22 and
193 respectively) The second catalyst among
non-dieters was nutrientlow-carb claims (221) followed
by advertising (18)
Table 11 Summary of Catalysts Motivating Respondents
What would be the most common catalyst that makes you try low carb products
TotalMedical
ProfessionalsStore
Environment
Nutrient Low Carb Claims Adveritsing Other
Are you Yes Count a dieter within
52 5 21 24 7 109
Are you a dieter
477 239 468 174 55 1000
No Count 62 1 27 22 10 122 within Are you a dieter
508 8 221 180 82 1000
Total Count 114 6 48 46 17 231 withinAre you a dieter
494 26 208 199 74 1000
Objective 3According to respondents concerns for low-carb
messages on either the product label or on a restaurant
advertisement Table 12 showed that dieters (mean = 294)
had more concern than non-dieters (mean = 393) for
low-carbohydrate information on the label However the
degree of concern for low-carb offerings by restaurants
33
by both groups was only moderate to less important Both
dieters and non-dieters agreed less on the offerings
(mean = 393 and 427 respectively)
Table 12 Importance of Low-Carb Product
LabelingOfferings to Respondents
Are you a dieter
How important is it to you in purchasing food to eat at home that the food has low carb information
on the label
How important is it to you in choosing a
restaurant specifically advertises low carb
offeringsYes Mean 294 393
N 109 109Std Deviation 1442 1152
No Mean 378 427N 122 122Std Deviation 1237 1045
Total Mean 338 411N 231 231Std Deviation 1399 1108
The next four tables reflect respondents opinions
regarding four different low-carbohydrate products
price taste calories carb count and carb labeling
Low-carbohydrate beer Michelob Ultra is offered in
the market survey (Table 13) To dieters calories
(mean = 182) were of concern however to non-dieters
taste (mean = 169) was their primary consideration To
dieters paying a bit more for the low carbs than the
34
regular products was more acceptable but not so for
non-dieters Another factor considered by dieters was
carb count (mean = 304) The addition of the word
Ultra would not influence the purchase either among
dieters (mean = 420) or non-dieters (mean = 419)
Table 13 Mean Scores of Product Factors of Low
Carbohydrate Beer
Are you a dieter
Between regular Michelob beer and low-carb Michelob beerI always look for Carb Count
diet products and to identify the factors that influenced
their decision to purchase low-carbohydrate food Because
of epidemic of obesity and diabetes among Americans
low-fat foods contribute to good health and weight
control (UC Berkeley Wellness Letter 2004) However
obesity and diabetes rates remain high (Daniels 2003)
As a result people on low carbohydrates experience
weight loss lowered triglycerides and lower cholesterol
(Bowden 2004) Today the focus is on carbohydrate
reduction (Woodruff2004)This practice emphasized the
fact that the suppliers and manufacturers of low-carb
food markets should understand the demands of their
consumers when it comes to low-carbohydrate foods Today
50
carb is widely used in product packaging to capture
market sales (Addis 2004) However brand taste and
price attributes are still important to consumers
(Beirne 2004) Therefore it is necessary for food
marketers to understand and meet the demand for
low-carbohydrate products given these criteria
Results showed that females seemed to be more
concerned about their food consumption than males are
Most of the dieters were 46 years old and over with
incomes ranging from $50000 - $74999 Moreover people
with medical conditions such as diabetes tended to pay
more attention to low-carb information Most respondents
consumed diet products between two and four times per
week
Weight loss was the primary factor in respondents
consumption of diet products However low-fat diets were
still thought to be more effective than low-carb diets in
weight reduction This finding confirms ODCs (2005)
conclusion that consumers are more concerned with fat
content than with any other nutritional claim Still
fewer than 50 of respondents agreed that low-carb diets
were good for health
51
In general low-carbohydrate information on both the
label and on restaurant menus was important for dieters
but not for non-dieters Most respondents preferred
low-carbohydrate products that tasted as much like the
original as possible This finding is consistent with
that of the IRIs Consumer Network (2001) that determined
that taste was a key factor in food and beverage
selection Brand recognition was expected most from
non-dieters However for dieters Brand was less
important than low-carb claims which refers not only
to carb count but also to calories something that
was very important to most dieters Topkis (2003) found
that many low-carb products were often more expensive
than the original or than other products in the same
category The findings consistently indicated that
low-price or equal price of low-carb products had an
impact on purchases -especially among non-dieters who
were interested in trying something different but not in
paying more-
Although Addis (2004) expected that trademarks
combined with the word carb would sell more results
indicated that the word carb on the package had the
least importance in influencing respondents purchasing
52
decision Most respondents placed little credence in the
word carb however the word light had more of an
impact
Implications of the findings suggest that medical
care centers would be the best place to provide
low-carbohydrate products for people who have a medical
condition For other people supermarkets might be the
best place to offer low-carbohydrate foods Restaurant
menus present the occasional opportunity to dine on
low-carbohydrate products However websites would not be
a good place to market low-carbohydrate products because
people rarely buy diet products online
It is also recommended that low-carb advertisements
appear in newspapers because people age 46 years and over
spend the most time reading the newspaper
Also radio stations which most people listen to
regularly should have low-carb advertisements Magazines
should focus only on people age 20 to 35 Since medical
professionals have a great influence upon purchases they
might want to try low-carbohydrate products Their
recommendation can help promote the sale of low-carb
diets
53
Results indicated that most respondents had more
confidence in low-fat foods than in low-carbohydrate
foods Consequently a further recommendation is for diet
products to focus on being low-fat rather than the
low-carb particularly in package labeling This claim
is supported by the findings that lower fat is better
than fewer carbs for weight loss low fat promotes better
health than fewer carbs and buyers would be more
attracted to low-fat products than to products that were
labeled as low-carb
In terms of product labeling low-fat appeared to be
the most significant influence upon weight-conscious
respondents Consequently low-fat labeling should be
emphasized more than low-carb as well as in
advertisements Having words that consumers can easily
see while making a purchase can aid in a
salesfactoryexperience Further manufacturers should
research and produce tasty but reasonably-priced low-fat
and low-carb products to drive sales
However low-carbohydrate diets were still needed
among diabetic respondents (Table 20) Therefore the
niche market of low-carb products should focus on
diabetics
54
While most diabetics cited low carbohydrates as
their primary reason to stay healthy and control weight
weight watchers trusted low-fat diets more so than
low-carb ones Medical professionals should be encouraged
to endorse the health benefits of reducing carbohydrate
intake for good health
55
APPENDIX
QUESTIONNAIRE
56
Public Opinion Survey
The purpose of this survey is to learn peoplesrsquo preferences and opinions toward low carbohydrate carbohydrate-controlled products Please take 7-10 minutes to complete the questionnaire There is no right or wrong answer Your responses will be kept confidential Thank you very much for your help in this research effort
Please nut an X on the blank that best describes your opinion
Section 1
1) Are you a dieter__ Yes __ No (Go to Question No4)
2) Why are you on diet (Check all that apply)__ Good Health ___Weight loss ___Other_______
3) How often do you eat diet products__ more than 5 times a week __ 2 to 4 times a week__ Once a week __ Never__ Other______
4) Please indicate how much you would agree (if you wanted to lose weight) with each of the following by checking the blank that best represents your response
6) Do you think that low-carb diets are good for your health__ Yes __ No
7) What would be the most common catalyst that would make you try a low-carb product
__ Medical professionals __ Store environment__ NutrientLow Carb Claims ___Advertising (eg TV magazine)__ Other_______
57
8) Please indicate how often you would buyeat diet products from each of following place by circling the number that best represents your response
1- Very Often 2- Often 3- Occasionally 4- Almost Never 5- Never
A Restaurants 1 2B Supermarkets 1 2C Medical Care Centers 1 2D Websites 1 2E Others 1 2
(Please specify)
3 4 5 3 4 5 3 4 5 3 4 5 3 4 5
9) Check the blank that best represents your response
A How important is it to you to purchase food to eat at home than food with low- carb information on the label
Most important Least important
B How important is it to you to choose a restaurant that specifically advertises low- carb offerings
Most important ___ ____ ____ ____ ___Least important
MICHELOB ULTRAreg vs MICHELOBreg26 g CARBS 133 g95 CALORIES 155
$175 PRICEServing size 12 oz
$135
From above information between regular Michelob beer and low-carb Michelob beer (Michelob ultra)how would you respond to the following Check the blank that best represents bull your response
58
A I always look at carb count
Strongly Agree Strongly Disagree
B I would be concerned about ldquoCaloriesrdquo
Strongly Agree Strongly Disagree
C I donrsquot feel good about the price of the low-carb product so I wouldnrsquot buy it
Strongly Agree Strongly Disagree
D I donrsquot thinkI would like the ldquoTasterdquo of low-carb beer
Strongly Agree Strongly Disagree
E The word ldquoUltrardquo on the product makes memoreinterested in buying it
From above information between Muellerrsquos reduced-carb spaghetti and Muellerrsquos regular how would you respond to the following Check the blank that best represents your response
59
A I always look at carbCount
Strongly Agree Strongly Disagree
B I would be concerned about ldquoCaloriesrdquo
Strongly Agree Strongly Disagree
C I donrsquot feel goodabout the price of the low-carb product so I wouldnrsquot buy it
Strongly Agree Strongly Disagree
D I donrsquot think I would like the ldquoTasterdquo of the low-carb spaghetti
From above information between Tropicana lightrsquon healthy and Tropicana pure premium how would you respond to the following Check the blank that best represents your response
60
A I always look at carb count
Strongly Agree Strongly Disagree
BI would beconcernedaboutldquoCaloriesrdquo
Strongly Agree Strongly Disagree
CI would buy the low-carb product because itrsquos the
Strongly Agree Strongly Disagree
same price as the regular
DI donrsquot think I would like the ldquoTasterdquo of the
Strongly Agree Strongly Disagree
low-carb juiceE The word
ldquoLightrdquo on the product makes me more
Strongly Agree Strongly Disagree
interested to buy it
13)
KLONDIKECARBSMARTSANDWICHESreg
VS KLONDIKE BIGBEAR SANDWICHESreg
5g CARBS 28 g80 CALORIES 190
$399 PRICESferurgsx Oesrdridi
$399
From above information Between Klondike carb-smart sandwiches and Klondike big bear sandwiches how would you respond to the following Check the blank that best represents your response
61
A I always look at carb count
Strongly Agree Strongly Disagree
B I would be be concerned about ldquoCaloriesrdquo
Strongly Agree Strongly Disagree
C I would buy the low-carb product because itrsquos the same price as the regular
Strongly Agree Strongly Disagree
D I donrsquot think I would like the ldquoTasterdquo of the low-carb sandwiches
Strongly Agree Strongly Disagree
E The word ldquoCarbsmartrdquo on the product makes memoreinterested to buy them
Strongly Agree Strongly Disagree
62
14) If you were to make a decision to buy a low carbohydrate product please rate your preference for each of the following features that best represents your response
A Whether or not the ldquoTasterdquo is almost or the same as the regular product
High preference Low preference
B Preference for ldquoNutri entHealth claimrdquo on the label
High preference Low preference
C Product is made by a well-known ldquoBrandrdquo High preference Low preference
D Product package contains the word ldquoCarbrdquo
High preference Low preference
E ldquoPackagerdquo is great designed High preference Low preference
F The ldquoPricerdquo of low-carb product the same or only a bit more expensive than the regular product
High preference Low preference
15) What media do you usually use (Please check all that apply)___ Radio Station___ Television___ Newspaper___ Magazine
Internet
63
Section 2 About you
1) What is your gender__ Male
2) Which age range applies to you__ 19 years and under_ 36-45
3) What is your educational background__ High school__ Associate degree__ Graduate or professional degree
4) What is your ethnic background
Female
20-2546 years and over
CollegeBachelorrsquos degree
26-35
WhiteBlack
_ Hispanic Asian
Pacific Islander Native American Multi Racial Other
5) What is your approximately total household income_ Less than $9999 _ $ 10000-$ 14999_ $15000-$24999 _ $25000-$49999_ $50000-$74999 _ $75000-$99999__ $100000 and over
6) Do you have any medical conditions (Check all that apply)__ Diabetes__ Obesity__ I donrsquot have
Other
laquoThank You
64
REFERENCES
Addis S (2004) Think outside the low-carb box Advertising Age 75(26) 22
Alvensleben R (1997) Consumer behaviour Agro-food marketing Wallingford CAB Publishing
Astrup P Thomas M L amp Harper A(2004) Atkins and other low-carbohydrate diets Hoax or an effect tool for weight loss Lancet 364(9437) 897-899
Atkins R (1998) Dr Atkins new diet revolution (3rd ed) New York Simon amp Schuster
Atkins R (2002) Dr Atkins new diet revolution New York Avon Books
Banking Business (2004) Low-carb sales trends andconsumer attitudes Retrieved December 5 2004 from httpwwwbankingbusinesscomco_articleaspArticleID=72 022
Beirne M (2004) Confectioners unwrap low-card strategies Brandweek 45(24) 14
Bowden J (2004) Low carb diets insulin resistance and diabetes Total Health 26(2) 22-23
Cole W (2004) Is bread toast Time Magazine 163(18) 50-51
Current Events (2004) Carb-crazed Retrieved December 6 2004 from httplibproxylibcsusbedu loginurl=http search epnet com- libproxy lib csusb eduloginaspxdirect=trueampAuthType=cookieipurluidampdb=aphampan=14441487
Daniels S R (2003) Abnormal weight gain and weightmanagement are carbohydrates the enemy Journal of Pediatrics 142 225-227
65
DeNoon D (2004) Is the low-carb craze waning Retrieved December 5 2004 fromhttpcontenthealthmsncomcontentarticle90 100819htmGTl=4244
Ebenkamp B (2004) Baby you deprive my carbs Brandweek 45(11) 20-22
Food Navigator (2004) Low-carb losing its sparkle Retrieved December 5 2004 from http www f oodnavigator comnews printNewsBisaspid=53564
Foxall G R (1988) Marketing new technology markets hierarchies and user initiated innovation Managerial and Decision Economics 9 237-250
Gloede W F (2004) Diet Inc American Demographics 25(10) 32-34
Hawkins D I Roger J B amp Kenneth A C (2001) Consumer Behavior New York McGraw-Hill
Information Resources Incorporate (2003) Fifty-two weeks through mid-year 2003 Retrived March 24 2005 from httpwwwinforescompublicus contentconsumernetworkdefaulthtm
Julie S (2004) What does it mean to be low carb Retrieved December 19 2004 from httpIwwwusatodaycommoneyindustriesfood2 0 04 - 05-25-low-carb_xhtm
Kadlec D Rawe J Park A Fonda D Cole W DeQuine J Healy R Hequet M Hylton H Locke L A amp Scully S (2004) The low-carb frenzy Time Magazine 163(18) 46-53
Kotler P 6 Armstrong G (1993) Maketing An Introduction 3rd ed NY Prentice Hall
LaMar K A Groller K Marroco R Housand LMalecki J Wong S amp Tan L (2004) You asked us Prevention 56(6) 33-38
66
Opinion Dynamic Corporations (2005) Measuring thelow-carb revolution Retrieved March 25 2005 from httpwwwopiniondynamicscomlowcarbhtml
Reyes S (2004) Crowded low-carb market to face new FDA guidelines Brandweek 45(25) 44
Reyes S (2004) New Yoplait launch milks low-carb craze Brandweek 45(18) 12
Reyes S (2004) Wal-mart line may starve low-carb foes Brandweek 45(25) 6
Richard L (2004) The secret to low carb successreduced carbohydrate is the key to success New York Kensington Publishing Corp
Rotella M amp Zaleski J (2003) Low-carb from myth to reality Publishers Weekly 250(5) 71
Thompson S (2004) Carb craze hit by reality check Advertising Age 75(23) 1-2
Thompson S (2004) Food marketers grapple with carb conundrum Advertising Age 75(19) 4-5
Thompson S (2004) Low-carb craze blitzes food biz Advertising Age 75(1) 1-2
Time and Trends (2004) The wellness evolution chasing the low carb consumer Retrieved April 3 2004 from httpwwwinforescompublicusnewsEvents thoughtleadershiptt_issuel8pdf
Topkis M (2003) The lowdown on low carb Money32(13) 218-219
Tsao A (2004) Lean times for food stocks Retrieved December 5 2004 fromhttpwwwbusinessweekcombwdailydnflashmay2004 nf20040518 9901 db014htm
67
Tufts University (2003) Low-carb craze or low-carbcrazy Tufts University Health amp Nutrition Letter 21(8) 4-5
University of California Berkeley (2004) Low-carbfoods less than meets the eye Retrieved December 20 2004 from httpwwwberkeleywellnesscom htmlwl2004wlFeatured0104html
Woodruff S (2004) Finding the right foods Better Nutrition 66(1) 29-32
Woodruff S (2004) Good-cardlow-card living Better Nutrition 66(6) 37-40
Yager J (2004) Low-carbohydrate diet vs low-fat diet no differences after 1 year Eating DisordersReview 15(4) 2-3
68
Factors influencing purchasing decision process of low-carbohydrate products
Recommended Citation
regular products was more acceptable but not so for
non-dieters Another factor considered by dieters was
carb count (mean = 304) The addition of the word
Ultra would not influence the purchase either among
dieters (mean = 420) or non-dieters (mean = 419)
Table 13 Mean Scores of Product Factors of Low
Carbohydrate Beer
spaghetti Calories was the first consideration among
dieters However non-dieters considered taste
(mean = 156) and price (mean = 154) first
Non-dieters were not satisfied with the price difference
between the regular ($099) and the low-carb versions
($199) In turn dieters accepted a higher price
however they were not always likely to buy the
higher-priced product (mean = 254) Carb count was
always a consideration of dieters (mean = 288) but low
consideration was given to the word carb added
(mean = 443) Non-dieters were not very concerned with
carb count (mean = 389) and they strongly disagreed
that the word carb added was important to them
(mean = 451)
If the price of both the regular and
low-carbohydrate juice were the same both dieters and
non-dieters would choose the latter Even though the
taste may not be as good non-dieters would be willing
to try the- low-carb versions (mean = 172) However
calories was still important to dieters (mean = 192)
(Table 15)
The addition of the word light had some impact on
dieters (mean = 302) but less for non-dieters
(mean = 408) (see Table 15)
Low-carbohydrate sandwiches that were priced the
same as regular sandwiches were of interest to dieters
and non-dieters (mean = 257) Even though non-dieters
thought that they would not like the taste as much
(mean = 158) they would be interested in trying
low-carbohydrate products Dieters still agreed strongly
in the importance of Calories (mean = 179) in choosing
a product Both dieters (mean = 429) and non-dieters
(mean = 448) alike disliked the addition of the word
carbsmart (see Table 16)
Table 19 showed the importance of low-carb labeling
to consumers in each age range The majority (538) of
people 46 years and above thought that it was important
Of respondents who had medical conditions such as
diabetes (Table 20) over half (522) of those were
mostly concerned about low-carb information on the label
and approximately 35 of them thought that low-carb
labeling was important (see Table 20)
Many of respondents who were obese (40) felt
neutral about choosing a product with low-carb labeling
However up to 33 of them thought that it was important
to have low-carb labeling when buying food to eat at home
(Table 21)
Tables 22 and 23 showed that the majority (696) of
diabetic respondents were age 46 years and over (see
Table 22) Also the majority (60) of those who
considered themselves obese were age 46 years and over
(see Table 23)
those 46 and over used the internet for research (see
Table 28)
FACTORS INFLUENCING PURCHASING DECISION PROCESS
OF LOW-CARBOHYDRATE PRODUCTS
A Project
Presented to the
Faculty of
California State University
San Bernardino
by
Warintra Triyangkulsri
December 2005
Date
copy 2005 Warintra Triyangkulsri
ABSTRACT
A growing number of diet trends are spreading across
the nation in an effort to improve health and lose weight
such as the Atkins diet and the South Beach diet Low-fat
and low-carbohydrate diets are the most popular and in
the last two years the number of low-carbohydrate
products available in stores has sharply increased
Consequently the word carb is used extensively in food
packaging however many low-carbohydrate products are
expensiveand tasteless Hence the purpose of this study
was to determine attitudes toward low-carbohydrate diets
among consumers and the attributes that influence their
purchase decision Results showed that consumers trusted
low-fat diets more than low-carbohydrate ones regarding
achieving weight loss and improved health Further price
and taste of low-carb products were the most problematic
factors that affected consumers purchase decision
Findings suggest that suppliers and manufacturers of diet
foods should focus on low-fat attributes in package
labeling instead of low-carb However findings also
suggest that since diabetics must follow low-carbohydrate
iii
diets that medical institutions consider distributing
such products as well as grocery chains
iv
ACKNOWLEDGMENTS
Without my excellent advisor Dr Victoria Seitz
this project would not exist Her willingness to- spend
long hours guiding advising organizing and editing the
contents was a critical factor in writing this study I
will always appreciate her high-quality help guidance
and support toward the completion of this project Thanks
also go to Dr Eric Newman and Dr Vic Johar my
committee members for the contributions to complete the
project With the encouragement of my parents and my
friends I could have the time or energy to finish this
study Special thanks go to all of the participants
helping me answering all questions on the survey to meet
the project objectives as well
v
DEDICATION
To Triyangkulsri family
TABLE OF CONTENTS
ABSTRACT iiiACKNOWLEDGMENTS v
LIST OF TABLESviiiLIST OF FIGURES X
CHAPTER ONE BACKGROUND
Introduction 1
Problem Statement 3Purpose of the Project 4
Limitations of the Project 5
Definition of Terms 5
Organization of the Project 7
CHAPTER TWO REVIEW OF THE LITERATURE
Introduction 9Factors Influencing the Purchase DecisionProcess 9Marketing Activities influencing the Purchase Decision Process ofLow-Carbohydrate Consumption 11Buyer Characteristics InfluencingLow-Carbohydrate Food Purchase 15
CHAPTER THREE METHODOLOGY
Population and Sample 19
Instruments 19Data Analysis Procedures 22
vi
CHAPTER FOUR RESULTS AND DISCUSSION
Introduction 23
Demographics of Respondents 23Study Objectives 25
Objective 1 25Objective 2 29
Objective 3 33
Objective 4 39
Objective 5 45
CHAPTER FIVE CONCLUSIONS AND RECOMMENDATIONSIntroduction 50Conclusions and Implications 50
APPENDIX QUESTIONNAIRE 56
REFERENCES 6 5
vii
LIST OF TABLES
Table 1 Demographic Characteristics of theRespondents 24
Table 2 The Number of Dieters among Respondents 25
Table 3 Crosstabulation of Dieters by Gender 26
Table 4 On Diet for Good Health 27
Table 5 On Diet for Weight Loss 27Table 6 Cross-tabulation of Dieters by
Frequency of Consuming Diet Products 28
Table 7 Summary of Preference with LowCarbohydrate Products 29
Table 8 Mean Scores of Agreement of DietProducts 3 0
Table 9 Crosstabulation of RespondentsAgreement with Low CarbohydrateProducts 31
neutral (mean = 263 and 267 respectively) regarding the
terms NutrientHealth claims and Well-known Brand
Great design of the package (mean = 362) did not have
an impact on purchase Further respondents had very low
preference forL use of Carb on packaging (mean = 437)
(see Table 7)
28
Table 7 Summary of Preference with Low Carbohydrate
Products
N MeanStd
DeviationTaste is almost or the same as regular products 231 161 915NutrientHealth claim is shown on the label 231 2 63 1315Brand is well-known 231 267 1069The word Carb is added on the package 231 437 1030Package is interestingattractive 231 362 979Price is not much more expensive than regular products
231 193 1029
Valid N (listwise) 231
Objective 2
One reason that low-fat was placed on the market
was to appeal to weight-conscious consumers This was
also true for low-carb products Table 8 showed that a
low-fat diet was a strong motive (mean = 176) for
dieters and almost as a strong (mean = 227) by
non-dieters Overall more respondents agreed that a
low-fat diet was more effective than a low-carb diet in
losing weight
29
Table 8 Mean Scores of Agreement of Diet Products
Are you a dieter
Please indicate how much you would agree
if you want to lose weight with Low Fat Diets
Please indicate how much you would agree
if you want to lose weight with Low Carb Diets
Yes Mean 179 267N 109 109Std Deviation 891 1291
No Mean 227 331N 122 122Std Deviation 1114 1143
Total Mean 203 301N 231 231Std Deviation 1044 1255
Aside from helping to control weight low-carb diets
were advertised as conducive to healthy lifestyle
(Rotella amp Zaleski 2003) However Table 9 showed that
758 of respondents who had never tried a
low-carbohydrate diet did not agree that it was good for
individuals health and 417 of respondents who had
tried low carbohydrates did not think the diet
contributed to good health Nevertheless respondents who
had already tried low-carb products were more likely to
purchase a low-carb product than were those who had not
30
Table 9 Crosstabulation of Respondents Agreement with
Low Carbohydrate Products
Do you think that low carb diets are good for your health
TotalYes NoHave you Yes Counttried a wj_thin Have
77 55 132
low carb you tried a lowproduct carb produqfc
583 417 1000
No Count within Have
24 75 99
you tried a low carb product
242 758 1000
Total Count within Have you tried a low carb product
101
437
130
563
231
1000
Interestingly 50 of respondents who were on a diet
also disagreed with the statement that low-carb diets
were good for health (see Table 10)
31
Table 10 Low Carbohydrate Agreement among Dieters
Do you think that low carb diets are
good for your health
TotalYes NoAre you a Yes Count 60 49 109dieter within Are
a dieteryou 550 450 1000
No Count 41 81 122 within Are a dieter
you 336 664 1000Total Count 101 130 231
within Are a dieter
you 437 563 1000
Table 11 identifies the catalysts that make people
want to try low-carbohydrate diets The majority of
respondents both dieters and not believed the medical
professionals opinion of low-carb products Overall
most respondents (494) would be convinced to try or
purchase low-carb products upon the recommendation of
medical professionals Nutrientlow-carb claims and
advertising (208 and 199 respectively) were the next
two catalysts that affected respondents concerning
health Other catalysts included friends families and
themselves (74) Of those who believed in the advice of
medical professionals 477 were dieters while 508
were non-dieters The next two catalysts among dieters
32
were advertising and nutrientlow-carb claims (22 and
193 respectively) The second catalyst among
non-dieters was nutrientlow-carb claims (221) followed
by advertising (18)
Table 11 Summary of Catalysts Motivating Respondents
What would be the most common catalyst that makes you try low carb products
TotalMedical
ProfessionalsStore
Environment
Nutrient Low Carb Claims Adveritsing Other
Are you Yes Count a dieter within
52 5 21 24 7 109
Are you a dieter
477 239 468 174 55 1000
No Count 62 1 27 22 10 122 within Are you a dieter
508 8 221 180 82 1000
Total Count 114 6 48 46 17 231 withinAre you a dieter
494 26 208 199 74 1000
Objective 3According to respondents concerns for low-carb
messages on either the product label or on a restaurant
advertisement Table 12 showed that dieters (mean = 294)
had more concern than non-dieters (mean = 393) for
low-carbohydrate information on the label However the
degree of concern for low-carb offerings by restaurants
33
by both groups was only moderate to less important Both
dieters and non-dieters agreed less on the offerings
(mean = 393 and 427 respectively)
Table 12 Importance of Low-Carb Product
LabelingOfferings to Respondents
Are you a dieter
How important is it to you in purchasing food to eat at home that the food has low carb information
on the label
How important is it to you in choosing a
restaurant specifically advertises low carb
offeringsYes Mean 294 393
N 109 109Std Deviation 1442 1152
No Mean 378 427N 122 122Std Deviation 1237 1045
Total Mean 338 411N 231 231Std Deviation 1399 1108
The next four tables reflect respondents opinions
regarding four different low-carbohydrate products
price taste calories carb count and carb labeling
Low-carbohydrate beer Michelob Ultra is offered in
the market survey (Table 13) To dieters calories
(mean = 182) were of concern however to non-dieters
taste (mean = 169) was their primary consideration To
dieters paying a bit more for the low carbs than the
34
regular products was more acceptable but not so for
non-dieters Another factor considered by dieters was
carb count (mean = 304) The addition of the word
Ultra would not influence the purchase either among
dieters (mean = 420) or non-dieters (mean = 419)
Table 13 Mean Scores of Product Factors of Low
Carbohydrate Beer
Are you a dieter
Between regular Michelob beer and low-carb Michelob beerI always look for Carb Count
diet products and to identify the factors that influenced
their decision to purchase low-carbohydrate food Because
of epidemic of obesity and diabetes among Americans
low-fat foods contribute to good health and weight
control (UC Berkeley Wellness Letter 2004) However
obesity and diabetes rates remain high (Daniels 2003)
As a result people on low carbohydrates experience
weight loss lowered triglycerides and lower cholesterol
(Bowden 2004) Today the focus is on carbohydrate
reduction (Woodruff2004)This practice emphasized the
fact that the suppliers and manufacturers of low-carb
food markets should understand the demands of their
consumers when it comes to low-carbohydrate foods Today
50
carb is widely used in product packaging to capture
market sales (Addis 2004) However brand taste and
price attributes are still important to consumers
(Beirne 2004) Therefore it is necessary for food
marketers to understand and meet the demand for
low-carbohydrate products given these criteria
Results showed that females seemed to be more
concerned about their food consumption than males are
Most of the dieters were 46 years old and over with
incomes ranging from $50000 - $74999 Moreover people
with medical conditions such as diabetes tended to pay
more attention to low-carb information Most respondents
consumed diet products between two and four times per
week
Weight loss was the primary factor in respondents
consumption of diet products However low-fat diets were
still thought to be more effective than low-carb diets in
weight reduction This finding confirms ODCs (2005)
conclusion that consumers are more concerned with fat
content than with any other nutritional claim Still
fewer than 50 of respondents agreed that low-carb diets
were good for health
51
In general low-carbohydrate information on both the
label and on restaurant menus was important for dieters
but not for non-dieters Most respondents preferred
low-carbohydrate products that tasted as much like the
original as possible This finding is consistent with
that of the IRIs Consumer Network (2001) that determined
that taste was a key factor in food and beverage
selection Brand recognition was expected most from
non-dieters However for dieters Brand was less
important than low-carb claims which refers not only
to carb count but also to calories something that
was very important to most dieters Topkis (2003) found
that many low-carb products were often more expensive
than the original or than other products in the same
category The findings consistently indicated that
low-price or equal price of low-carb products had an
impact on purchases -especially among non-dieters who
were interested in trying something different but not in
paying more-
Although Addis (2004) expected that trademarks
combined with the word carb would sell more results
indicated that the word carb on the package had the
least importance in influencing respondents purchasing
52
decision Most respondents placed little credence in the
word carb however the word light had more of an
impact
Implications of the findings suggest that medical
care centers would be the best place to provide
low-carbohydrate products for people who have a medical
condition For other people supermarkets might be the
best place to offer low-carbohydrate foods Restaurant
menus present the occasional opportunity to dine on
low-carbohydrate products However websites would not be
a good place to market low-carbohydrate products because
people rarely buy diet products online
It is also recommended that low-carb advertisements
appear in newspapers because people age 46 years and over
spend the most time reading the newspaper
Also radio stations which most people listen to
regularly should have low-carb advertisements Magazines
should focus only on people age 20 to 35 Since medical
professionals have a great influence upon purchases they
might want to try low-carbohydrate products Their
recommendation can help promote the sale of low-carb
diets
53
Results indicated that most respondents had more
confidence in low-fat foods than in low-carbohydrate
foods Consequently a further recommendation is for diet
products to focus on being low-fat rather than the
low-carb particularly in package labeling This claim
is supported by the findings that lower fat is better
than fewer carbs for weight loss low fat promotes better
health than fewer carbs and buyers would be more
attracted to low-fat products than to products that were
labeled as low-carb
In terms of product labeling low-fat appeared to be
the most significant influence upon weight-conscious
respondents Consequently low-fat labeling should be
emphasized more than low-carb as well as in
advertisements Having words that consumers can easily
see while making a purchase can aid in a
salesfactoryexperience Further manufacturers should
research and produce tasty but reasonably-priced low-fat
and low-carb products to drive sales
However low-carbohydrate diets were still needed
among diabetic respondents (Table 20) Therefore the
niche market of low-carb products should focus on
diabetics
54
While most diabetics cited low carbohydrates as
their primary reason to stay healthy and control weight
weight watchers trusted low-fat diets more so than
low-carb ones Medical professionals should be encouraged
to endorse the health benefits of reducing carbohydrate
intake for good health
55
APPENDIX
QUESTIONNAIRE
56
Public Opinion Survey
The purpose of this survey is to learn peoplesrsquo preferences and opinions toward low carbohydrate carbohydrate-controlled products Please take 7-10 minutes to complete the questionnaire There is no right or wrong answer Your responses will be kept confidential Thank you very much for your help in this research effort
Please nut an X on the blank that best describes your opinion
Section 1
1) Are you a dieter__ Yes __ No (Go to Question No4)
2) Why are you on diet (Check all that apply)__ Good Health ___Weight loss ___Other_______
3) How often do you eat diet products__ more than 5 times a week __ 2 to 4 times a week__ Once a week __ Never__ Other______
4) Please indicate how much you would agree (if you wanted to lose weight) with each of the following by checking the blank that best represents your response
6) Do you think that low-carb diets are good for your health__ Yes __ No
7) What would be the most common catalyst that would make you try a low-carb product
__ Medical professionals __ Store environment__ NutrientLow Carb Claims ___Advertising (eg TV magazine)__ Other_______
57
8) Please indicate how often you would buyeat diet products from each of following place by circling the number that best represents your response
1- Very Often 2- Often 3- Occasionally 4- Almost Never 5- Never
A Restaurants 1 2B Supermarkets 1 2C Medical Care Centers 1 2D Websites 1 2E Others 1 2
(Please specify)
3 4 5 3 4 5 3 4 5 3 4 5 3 4 5
9) Check the blank that best represents your response
A How important is it to you to purchase food to eat at home than food with low- carb information on the label
Most important Least important
B How important is it to you to choose a restaurant that specifically advertises low- carb offerings
Most important ___ ____ ____ ____ ___Least important
MICHELOB ULTRAreg vs MICHELOBreg26 g CARBS 133 g95 CALORIES 155
$175 PRICEServing size 12 oz
$135
From above information between regular Michelob beer and low-carb Michelob beer (Michelob ultra)how would you respond to the following Check the blank that best represents bull your response
58
A I always look at carb count
Strongly Agree Strongly Disagree
B I would be concerned about ldquoCaloriesrdquo
Strongly Agree Strongly Disagree
C I donrsquot feel good about the price of the low-carb product so I wouldnrsquot buy it
Strongly Agree Strongly Disagree
D I donrsquot thinkI would like the ldquoTasterdquo of low-carb beer
Strongly Agree Strongly Disagree
E The word ldquoUltrardquo on the product makes memoreinterested in buying it
From above information between Muellerrsquos reduced-carb spaghetti and Muellerrsquos regular how would you respond to the following Check the blank that best represents your response
59
A I always look at carbCount
Strongly Agree Strongly Disagree
B I would be concerned about ldquoCaloriesrdquo
Strongly Agree Strongly Disagree
C I donrsquot feel goodabout the price of the low-carb product so I wouldnrsquot buy it
Strongly Agree Strongly Disagree
D I donrsquot think I would like the ldquoTasterdquo of the low-carb spaghetti
From above information between Tropicana lightrsquon healthy and Tropicana pure premium how would you respond to the following Check the blank that best represents your response
60
A I always look at carb count
Strongly Agree Strongly Disagree
BI would beconcernedaboutldquoCaloriesrdquo
Strongly Agree Strongly Disagree
CI would buy the low-carb product because itrsquos the
Strongly Agree Strongly Disagree
same price as the regular
DI donrsquot think I would like the ldquoTasterdquo of the
Strongly Agree Strongly Disagree
low-carb juiceE The word
ldquoLightrdquo on the product makes me more
Strongly Agree Strongly Disagree
interested to buy it
13)
KLONDIKECARBSMARTSANDWICHESreg
VS KLONDIKE BIGBEAR SANDWICHESreg
5g CARBS 28 g80 CALORIES 190
$399 PRICESferurgsx Oesrdridi
$399
From above information Between Klondike carb-smart sandwiches and Klondike big bear sandwiches how would you respond to the following Check the blank that best represents your response
61
A I always look at carb count
Strongly Agree Strongly Disagree
B I would be be concerned about ldquoCaloriesrdquo
Strongly Agree Strongly Disagree
C I would buy the low-carb product because itrsquos the same price as the regular
Strongly Agree Strongly Disagree
D I donrsquot think I would like the ldquoTasterdquo of the low-carb sandwiches
Strongly Agree Strongly Disagree
E The word ldquoCarbsmartrdquo on the product makes memoreinterested to buy them
Strongly Agree Strongly Disagree
62
14) If you were to make a decision to buy a low carbohydrate product please rate your preference for each of the following features that best represents your response
A Whether or not the ldquoTasterdquo is almost or the same as the regular product
High preference Low preference
B Preference for ldquoNutri entHealth claimrdquo on the label
High preference Low preference
C Product is made by a well-known ldquoBrandrdquo High preference Low preference
D Product package contains the word ldquoCarbrdquo
High preference Low preference
E ldquoPackagerdquo is great designed High preference Low preference
F The ldquoPricerdquo of low-carb product the same or only a bit more expensive than the regular product
High preference Low preference
15) What media do you usually use (Please check all that apply)___ Radio Station___ Television___ Newspaper___ Magazine
Internet
63
Section 2 About you
1) What is your gender__ Male
2) Which age range applies to you__ 19 years and under_ 36-45
3) What is your educational background__ High school__ Associate degree__ Graduate or professional degree
4) What is your ethnic background
Female
20-2546 years and over
CollegeBachelorrsquos degree
26-35
WhiteBlack
_ Hispanic Asian
Pacific Islander Native American Multi Racial Other
5) What is your approximately total household income_ Less than $9999 _ $ 10000-$ 14999_ $15000-$24999 _ $25000-$49999_ $50000-$74999 _ $75000-$99999__ $100000 and over
6) Do you have any medical conditions (Check all that apply)__ Diabetes__ Obesity__ I donrsquot have
Other
laquoThank You
64
REFERENCES
Addis S (2004) Think outside the low-carb box Advertising Age 75(26) 22
Alvensleben R (1997) Consumer behaviour Agro-food marketing Wallingford CAB Publishing
Astrup P Thomas M L amp Harper A(2004) Atkins and other low-carbohydrate diets Hoax or an effect tool for weight loss Lancet 364(9437) 897-899
Atkins R (1998) Dr Atkins new diet revolution (3rd ed) New York Simon amp Schuster
Atkins R (2002) Dr Atkins new diet revolution New York Avon Books
Banking Business (2004) Low-carb sales trends andconsumer attitudes Retrieved December 5 2004 from httpwwwbankingbusinesscomco_articleaspArticleID=72 022
Beirne M (2004) Confectioners unwrap low-card strategies Brandweek 45(24) 14
Bowden J (2004) Low carb diets insulin resistance and diabetes Total Health 26(2) 22-23
Cole W (2004) Is bread toast Time Magazine 163(18) 50-51
Current Events (2004) Carb-crazed Retrieved December 6 2004 from httplibproxylibcsusbedu loginurl=http search epnet com- libproxy lib csusb eduloginaspxdirect=trueampAuthType=cookieipurluidampdb=aphampan=14441487
Daniels S R (2003) Abnormal weight gain and weightmanagement are carbohydrates the enemy Journal of Pediatrics 142 225-227
65
DeNoon D (2004) Is the low-carb craze waning Retrieved December 5 2004 fromhttpcontenthealthmsncomcontentarticle90 100819htmGTl=4244
Ebenkamp B (2004) Baby you deprive my carbs Brandweek 45(11) 20-22
Food Navigator (2004) Low-carb losing its sparkle Retrieved December 5 2004 from http www f oodnavigator comnews printNewsBisaspid=53564
Foxall G R (1988) Marketing new technology markets hierarchies and user initiated innovation Managerial and Decision Economics 9 237-250
Gloede W F (2004) Diet Inc American Demographics 25(10) 32-34
Hawkins D I Roger J B amp Kenneth A C (2001) Consumer Behavior New York McGraw-Hill
Information Resources Incorporate (2003) Fifty-two weeks through mid-year 2003 Retrived March 24 2005 from httpwwwinforescompublicus contentconsumernetworkdefaulthtm
Julie S (2004) What does it mean to be low carb Retrieved December 19 2004 from httpIwwwusatodaycommoneyindustriesfood2 0 04 - 05-25-low-carb_xhtm
Kadlec D Rawe J Park A Fonda D Cole W DeQuine J Healy R Hequet M Hylton H Locke L A amp Scully S (2004) The low-carb frenzy Time Magazine 163(18) 46-53
Kotler P 6 Armstrong G (1993) Maketing An Introduction 3rd ed NY Prentice Hall
LaMar K A Groller K Marroco R Housand LMalecki J Wong S amp Tan L (2004) You asked us Prevention 56(6) 33-38
66
Opinion Dynamic Corporations (2005) Measuring thelow-carb revolution Retrieved March 25 2005 from httpwwwopiniondynamicscomlowcarbhtml
Reyes S (2004) Crowded low-carb market to face new FDA guidelines Brandweek 45(25) 44
Reyes S (2004) New Yoplait launch milks low-carb craze Brandweek 45(18) 12
Reyes S (2004) Wal-mart line may starve low-carb foes Brandweek 45(25) 6
Richard L (2004) The secret to low carb successreduced carbohydrate is the key to success New York Kensington Publishing Corp
Rotella M amp Zaleski J (2003) Low-carb from myth to reality Publishers Weekly 250(5) 71
Thompson S (2004) Carb craze hit by reality check Advertising Age 75(23) 1-2
Thompson S (2004) Food marketers grapple with carb conundrum Advertising Age 75(19) 4-5
Thompson S (2004) Low-carb craze blitzes food biz Advertising Age 75(1) 1-2
Time and Trends (2004) The wellness evolution chasing the low carb consumer Retrieved April 3 2004 from httpwwwinforescompublicusnewsEvents thoughtleadershiptt_issuel8pdf
Topkis M (2003) The lowdown on low carb Money32(13) 218-219
Tsao A (2004) Lean times for food stocks Retrieved December 5 2004 fromhttpwwwbusinessweekcombwdailydnflashmay2004 nf20040518 9901 db014htm
67
Tufts University (2003) Low-carb craze or low-carbcrazy Tufts University Health amp Nutrition Letter 21(8) 4-5
University of California Berkeley (2004) Low-carbfoods less than meets the eye Retrieved December 20 2004 from httpwwwberkeleywellnesscom htmlwl2004wlFeatured0104html
Woodruff S (2004) Finding the right foods Better Nutrition 66(1) 29-32
Woodruff S (2004) Good-cardlow-card living Better Nutrition 66(6) 37-40
Yager J (2004) Low-carbohydrate diet vs low-fat diet no differences after 1 year Eating DisordersReview 15(4) 2-3
68
Factors influencing purchasing decision process of low-carbohydrate products
Recommended Citation
regular products was more acceptable but not so for
non-dieters Another factor considered by dieters was
carb count (mean = 304) The addition of the word
Ultra would not influence the purchase either among
dieters (mean = 420) or non-dieters (mean = 419)
Table 13 Mean Scores of Product Factors of Low
Carbohydrate Beer
spaghetti Calories was the first consideration among
dieters However non-dieters considered taste
(mean = 156) and price (mean = 154) first
Non-dieters were not satisfied with the price difference
between the regular ($099) and the low-carb versions
($199) In turn dieters accepted a higher price
however they were not always likely to buy the
higher-priced product (mean = 254) Carb count was
always a consideration of dieters (mean = 288) but low
consideration was given to the word carb added
(mean = 443) Non-dieters were not very concerned with
carb count (mean = 389) and they strongly disagreed
that the word carb added was important to them
(mean = 451)
If the price of both the regular and
low-carbohydrate juice were the same both dieters and
non-dieters would choose the latter Even though the
taste may not be as good non-dieters would be willing
to try the- low-carb versions (mean = 172) However
calories was still important to dieters (mean = 192)
(Table 15)
The addition of the word light had some impact on
dieters (mean = 302) but less for non-dieters
(mean = 408) (see Table 15)
Low-carbohydrate sandwiches that were priced the
same as regular sandwiches were of interest to dieters
and non-dieters (mean = 257) Even though non-dieters
thought that they would not like the taste as much
(mean = 158) they would be interested in trying
low-carbohydrate products Dieters still agreed strongly
in the importance of Calories (mean = 179) in choosing
a product Both dieters (mean = 429) and non-dieters
(mean = 448) alike disliked the addition of the word
carbsmart (see Table 16)
Table 19 showed the importance of low-carb labeling
to consumers in each age range The majority (538) of
people 46 years and above thought that it was important
Of respondents who had medical conditions such as
diabetes (Table 20) over half (522) of those were
mostly concerned about low-carb information on the label
and approximately 35 of them thought that low-carb
labeling was important (see Table 20)
Many of respondents who were obese (40) felt
neutral about choosing a product with low-carb labeling
However up to 33 of them thought that it was important
to have low-carb labeling when buying food to eat at home
(Table 21)
Tables 22 and 23 showed that the majority (696) of
diabetic respondents were age 46 years and over (see
Table 22) Also the majority (60) of those who
considered themselves obese were age 46 years and over
(see Table 23)
those 46 and over used the internet for research (see
Table 28)
Table 17 Age Range of Respondents
Table 18 Household Income among Respondents 40Table 19 Summary of Importance of Low
Carbohydrate Labeling with Age 41Table 20 Importance of Low Carbohydrate Labeling
to Respondents with Diabetes 42
Table 21 Importance of Low Carbohydrate Labelingto Respondents Suffering from Obesity 43
Table 22 Crosstabulation of Respondents withDiabetes by Age 44
Table 23 Crosstabulation of Respondents withObesity by Age 44
Table 24 Frequency of Low Carbohydrate Purchaseat Supermarkets among Respondents 45
Table 25 Frequency of Low Carbohydrate Purchase from Medical Care Centers amongRespondents 4 6
Table 26 Frequency of Low Carbohydrate Purchaseat Restaurants among Respondents 47
Table 27 Frequency of Low Carbohydrate Purchasefrom Websites among Respondents 48
Table 28 Summary of Respondents Use of MediaSummarized by Age 4 9
neutral (mean = 263 and 267 respectively) regarding the
terms NutrientHealth claims and Well-known Brand
Great design of the package (mean = 362) did not have
an impact on purchase Further respondents had very low
preference forL use of Carb on packaging (mean = 437)
(see Table 7)
28
Table 7 Summary of Preference with Low Carbohydrate
Products
N MeanStd
DeviationTaste is almost or the same as regular products 231 161 915NutrientHealth claim is shown on the label 231 2 63 1315Brand is well-known 231 267 1069The word Carb is added on the package 231 437 1030Package is interestingattractive 231 362 979Price is not much more expensive than regular products
231 193 1029
Valid N (listwise) 231
Objective 2
One reason that low-fat was placed on the market
was to appeal to weight-conscious consumers This was
also true for low-carb products Table 8 showed that a
low-fat diet was a strong motive (mean = 176) for
dieters and almost as a strong (mean = 227) by
non-dieters Overall more respondents agreed that a
low-fat diet was more effective than a low-carb diet in
losing weight
29
Table 8 Mean Scores of Agreement of Diet Products
Are you a dieter
Please indicate how much you would agree
if you want to lose weight with Low Fat Diets
Please indicate how much you would agree
if you want to lose weight with Low Carb Diets
Yes Mean 179 267N 109 109Std Deviation 891 1291
No Mean 227 331N 122 122Std Deviation 1114 1143
Total Mean 203 301N 231 231Std Deviation 1044 1255
Aside from helping to control weight low-carb diets
were advertised as conducive to healthy lifestyle
(Rotella amp Zaleski 2003) However Table 9 showed that
758 of respondents who had never tried a
low-carbohydrate diet did not agree that it was good for
individuals health and 417 of respondents who had
tried low carbohydrates did not think the diet
contributed to good health Nevertheless respondents who
had already tried low-carb products were more likely to
purchase a low-carb product than were those who had not
30
Table 9 Crosstabulation of Respondents Agreement with
Low Carbohydrate Products
Do you think that low carb diets are good for your health
TotalYes NoHave you Yes Counttried a wj_thin Have
77 55 132
low carb you tried a lowproduct carb produqfc
583 417 1000
No Count within Have
24 75 99
you tried a low carb product
242 758 1000
Total Count within Have you tried a low carb product
101
437
130
563
231
1000
Interestingly 50 of respondents who were on a diet
also disagreed with the statement that low-carb diets
were good for health (see Table 10)
31
Table 10 Low Carbohydrate Agreement among Dieters
Do you think that low carb diets are
good for your health
TotalYes NoAre you a Yes Count 60 49 109dieter within Are
a dieteryou 550 450 1000
No Count 41 81 122 within Are a dieter
you 336 664 1000Total Count 101 130 231
within Are a dieter
you 437 563 1000
Table 11 identifies the catalysts that make people
want to try low-carbohydrate diets The majority of
respondents both dieters and not believed the medical
professionals opinion of low-carb products Overall
most respondents (494) would be convinced to try or
purchase low-carb products upon the recommendation of
medical professionals Nutrientlow-carb claims and
advertising (208 and 199 respectively) were the next
two catalysts that affected respondents concerning
health Other catalysts included friends families and
themselves (74) Of those who believed in the advice of
medical professionals 477 were dieters while 508
were non-dieters The next two catalysts among dieters
32
were advertising and nutrientlow-carb claims (22 and
193 respectively) The second catalyst among
non-dieters was nutrientlow-carb claims (221) followed
by advertising (18)
Table 11 Summary of Catalysts Motivating Respondents
What would be the most common catalyst that makes you try low carb products
TotalMedical
ProfessionalsStore
Environment
Nutrient Low Carb Claims Adveritsing Other
Are you Yes Count a dieter within
52 5 21 24 7 109
Are you a dieter
477 239 468 174 55 1000
No Count 62 1 27 22 10 122 within Are you a dieter
508 8 221 180 82 1000
Total Count 114 6 48 46 17 231 withinAre you a dieter
494 26 208 199 74 1000
Objective 3According to respondents concerns for low-carb
messages on either the product label or on a restaurant
advertisement Table 12 showed that dieters (mean = 294)
had more concern than non-dieters (mean = 393) for
low-carbohydrate information on the label However the
degree of concern for low-carb offerings by restaurants
33
by both groups was only moderate to less important Both
dieters and non-dieters agreed less on the offerings
(mean = 393 and 427 respectively)
Table 12 Importance of Low-Carb Product
LabelingOfferings to Respondents
Are you a dieter
How important is it to you in purchasing food to eat at home that the food has low carb information
on the label
How important is it to you in choosing a
restaurant specifically advertises low carb
offeringsYes Mean 294 393
N 109 109Std Deviation 1442 1152
No Mean 378 427N 122 122Std Deviation 1237 1045
Total Mean 338 411N 231 231Std Deviation 1399 1108
The next four tables reflect respondents opinions
regarding four different low-carbohydrate products
price taste calories carb count and carb labeling
Low-carbohydrate beer Michelob Ultra is offered in
the market survey (Table 13) To dieters calories
(mean = 182) were of concern however to non-dieters
taste (mean = 169) was their primary consideration To
dieters paying a bit more for the low carbs than the
34
regular products was more acceptable but not so for
non-dieters Another factor considered by dieters was
carb count (mean = 304) The addition of the word
Ultra would not influence the purchase either among
dieters (mean = 420) or non-dieters (mean = 419)
Table 13 Mean Scores of Product Factors of Low
Carbohydrate Beer
Are you a dieter
Between regular Michelob beer and low-carb Michelob beerI always look for Carb Count
diet products and to identify the factors that influenced
their decision to purchase low-carbohydrate food Because
of epidemic of obesity and diabetes among Americans
low-fat foods contribute to good health and weight
control (UC Berkeley Wellness Letter 2004) However
obesity and diabetes rates remain high (Daniels 2003)
As a result people on low carbohydrates experience
weight loss lowered triglycerides and lower cholesterol
(Bowden 2004) Today the focus is on carbohydrate
reduction (Woodruff2004)This practice emphasized the
fact that the suppliers and manufacturers of low-carb
food markets should understand the demands of their
consumers when it comes to low-carbohydrate foods Today
50
carb is widely used in product packaging to capture
market sales (Addis 2004) However brand taste and
price attributes are still important to consumers
(Beirne 2004) Therefore it is necessary for food
marketers to understand and meet the demand for
low-carbohydrate products given these criteria
Results showed that females seemed to be more
concerned about their food consumption than males are
Most of the dieters were 46 years old and over with
incomes ranging from $50000 - $74999 Moreover people
with medical conditions such as diabetes tended to pay
more attention to low-carb information Most respondents
consumed diet products between two and four times per
week
Weight loss was the primary factor in respondents
consumption of diet products However low-fat diets were
still thought to be more effective than low-carb diets in
weight reduction This finding confirms ODCs (2005)
conclusion that consumers are more concerned with fat
content than with any other nutritional claim Still
fewer than 50 of respondents agreed that low-carb diets
were good for health
51
In general low-carbohydrate information on both the
label and on restaurant menus was important for dieters
but not for non-dieters Most respondents preferred
low-carbohydrate products that tasted as much like the
original as possible This finding is consistent with
that of the IRIs Consumer Network (2001) that determined
that taste was a key factor in food and beverage
selection Brand recognition was expected most from
non-dieters However for dieters Brand was less
important than low-carb claims which refers not only
to carb count but also to calories something that
was very important to most dieters Topkis (2003) found
that many low-carb products were often more expensive
than the original or than other products in the same
category The findings consistently indicated that
low-price or equal price of low-carb products had an
impact on purchases -especially among non-dieters who
were interested in trying something different but not in
paying more-
Although Addis (2004) expected that trademarks
combined with the word carb would sell more results
indicated that the word carb on the package had the
least importance in influencing respondents purchasing
52
decision Most respondents placed little credence in the
word carb however the word light had more of an
impact
Implications of the findings suggest that medical
care centers would be the best place to provide
low-carbohydrate products for people who have a medical
condition For other people supermarkets might be the
best place to offer low-carbohydrate foods Restaurant
menus present the occasional opportunity to dine on
low-carbohydrate products However websites would not be
a good place to market low-carbohydrate products because
people rarely buy diet products online
It is also recommended that low-carb advertisements
appear in newspapers because people age 46 years and over
spend the most time reading the newspaper
Also radio stations which most people listen to
regularly should have low-carb advertisements Magazines
should focus only on people age 20 to 35 Since medical
professionals have a great influence upon purchases they
might want to try low-carbohydrate products Their
recommendation can help promote the sale of low-carb
diets
53
Results indicated that most respondents had more
confidence in low-fat foods than in low-carbohydrate
foods Consequently a further recommendation is for diet
products to focus on being low-fat rather than the
low-carb particularly in package labeling This claim
is supported by the findings that lower fat is better
than fewer carbs for weight loss low fat promotes better
health than fewer carbs and buyers would be more
attracted to low-fat products than to products that were
labeled as low-carb
In terms of product labeling low-fat appeared to be
the most significant influence upon weight-conscious
respondents Consequently low-fat labeling should be
emphasized more than low-carb as well as in
advertisements Having words that consumers can easily
see while making a purchase can aid in a
salesfactoryexperience Further manufacturers should
research and produce tasty but reasonably-priced low-fat
and low-carb products to drive sales
However low-carbohydrate diets were still needed
among diabetic respondents (Table 20) Therefore the
niche market of low-carb products should focus on
diabetics
54
While most diabetics cited low carbohydrates as
their primary reason to stay healthy and control weight
weight watchers trusted low-fat diets more so than
low-carb ones Medical professionals should be encouraged
to endorse the health benefits of reducing carbohydrate
intake for good health
55
APPENDIX
QUESTIONNAIRE
56
Public Opinion Survey
The purpose of this survey is to learn peoplesrsquo preferences and opinions toward low carbohydrate carbohydrate-controlled products Please take 7-10 minutes to complete the questionnaire There is no right or wrong answer Your responses will be kept confidential Thank you very much for your help in this research effort
Please nut an X on the blank that best describes your opinion
Section 1
1) Are you a dieter__ Yes __ No (Go to Question No4)
2) Why are you on diet (Check all that apply)__ Good Health ___Weight loss ___Other_______
3) How often do you eat diet products__ more than 5 times a week __ 2 to 4 times a week__ Once a week __ Never__ Other______
4) Please indicate how much you would agree (if you wanted to lose weight) with each of the following by checking the blank that best represents your response
6) Do you think that low-carb diets are good for your health__ Yes __ No
7) What would be the most common catalyst that would make you try a low-carb product
__ Medical professionals __ Store environment__ NutrientLow Carb Claims ___Advertising (eg TV magazine)__ Other_______
57
8) Please indicate how often you would buyeat diet products from each of following place by circling the number that best represents your response
1- Very Often 2- Often 3- Occasionally 4- Almost Never 5- Never
A Restaurants 1 2B Supermarkets 1 2C Medical Care Centers 1 2D Websites 1 2E Others 1 2
(Please specify)
3 4 5 3 4 5 3 4 5 3 4 5 3 4 5
9) Check the blank that best represents your response
A How important is it to you to purchase food to eat at home than food with low- carb information on the label
Most important Least important
B How important is it to you to choose a restaurant that specifically advertises low- carb offerings
Most important ___ ____ ____ ____ ___Least important
MICHELOB ULTRAreg vs MICHELOBreg26 g CARBS 133 g95 CALORIES 155
$175 PRICEServing size 12 oz
$135
From above information between regular Michelob beer and low-carb Michelob beer (Michelob ultra)how would you respond to the following Check the blank that best represents bull your response
58
A I always look at carb count
Strongly Agree Strongly Disagree
B I would be concerned about ldquoCaloriesrdquo
Strongly Agree Strongly Disagree
C I donrsquot feel good about the price of the low-carb product so I wouldnrsquot buy it
Strongly Agree Strongly Disagree
D I donrsquot thinkI would like the ldquoTasterdquo of low-carb beer
Strongly Agree Strongly Disagree
E The word ldquoUltrardquo on the product makes memoreinterested in buying it
From above information between Muellerrsquos reduced-carb spaghetti and Muellerrsquos regular how would you respond to the following Check the blank that best represents your response
59
A I always look at carbCount
Strongly Agree Strongly Disagree
B I would be concerned about ldquoCaloriesrdquo
Strongly Agree Strongly Disagree
C I donrsquot feel goodabout the price of the low-carb product so I wouldnrsquot buy it
Strongly Agree Strongly Disagree
D I donrsquot think I would like the ldquoTasterdquo of the low-carb spaghetti
From above information between Tropicana lightrsquon healthy and Tropicana pure premium how would you respond to the following Check the blank that best represents your response
60
A I always look at carb count
Strongly Agree Strongly Disagree
BI would beconcernedaboutldquoCaloriesrdquo
Strongly Agree Strongly Disagree
CI would buy the low-carb product because itrsquos the
Strongly Agree Strongly Disagree
same price as the regular
DI donrsquot think I would like the ldquoTasterdquo of the
Strongly Agree Strongly Disagree
low-carb juiceE The word
ldquoLightrdquo on the product makes me more
Strongly Agree Strongly Disagree
interested to buy it
13)
KLONDIKECARBSMARTSANDWICHESreg
VS KLONDIKE BIGBEAR SANDWICHESreg
5g CARBS 28 g80 CALORIES 190
$399 PRICESferurgsx Oesrdridi
$399
From above information Between Klondike carb-smart sandwiches and Klondike big bear sandwiches how would you respond to the following Check the blank that best represents your response
61
A I always look at carb count
Strongly Agree Strongly Disagree
B I would be be concerned about ldquoCaloriesrdquo
Strongly Agree Strongly Disagree
C I would buy the low-carb product because itrsquos the same price as the regular
Strongly Agree Strongly Disagree
D I donrsquot think I would like the ldquoTasterdquo of the low-carb sandwiches
Strongly Agree Strongly Disagree
E The word ldquoCarbsmartrdquo on the product makes memoreinterested to buy them
Strongly Agree Strongly Disagree
62
14) If you were to make a decision to buy a low carbohydrate product please rate your preference for each of the following features that best represents your response
A Whether or not the ldquoTasterdquo is almost or the same as the regular product
High preference Low preference
B Preference for ldquoNutri entHealth claimrdquo on the label
High preference Low preference
C Product is made by a well-known ldquoBrandrdquo High preference Low preference
D Product package contains the word ldquoCarbrdquo
High preference Low preference
E ldquoPackagerdquo is great designed High preference Low preference
F The ldquoPricerdquo of low-carb product the same or only a bit more expensive than the regular product
High preference Low preference
15) What media do you usually use (Please check all that apply)___ Radio Station___ Television___ Newspaper___ Magazine
Internet
63
Section 2 About you
1) What is your gender__ Male
2) Which age range applies to you__ 19 years and under_ 36-45
3) What is your educational background__ High school__ Associate degree__ Graduate or professional degree
4) What is your ethnic background
Female
20-2546 years and over
CollegeBachelorrsquos degree
26-35
WhiteBlack
_ Hispanic Asian
Pacific Islander Native American Multi Racial Other
5) What is your approximately total household income_ Less than $9999 _ $ 10000-$ 14999_ $15000-$24999 _ $25000-$49999_ $50000-$74999 _ $75000-$99999__ $100000 and over
6) Do you have any medical conditions (Check all that apply)__ Diabetes__ Obesity__ I donrsquot have
Other
laquoThank You
64
REFERENCES
Addis S (2004) Think outside the low-carb box Advertising Age 75(26) 22
Alvensleben R (1997) Consumer behaviour Agro-food marketing Wallingford CAB Publishing
Astrup P Thomas M L amp Harper A(2004) Atkins and other low-carbohydrate diets Hoax or an effect tool for weight loss Lancet 364(9437) 897-899
Atkins R (1998) Dr Atkins new diet revolution (3rd ed) New York Simon amp Schuster
Atkins R (2002) Dr Atkins new diet revolution New York Avon Books
Banking Business (2004) Low-carb sales trends andconsumer attitudes Retrieved December 5 2004 from httpwwwbankingbusinesscomco_articleaspArticleID=72 022
Beirne M (2004) Confectioners unwrap low-card strategies Brandweek 45(24) 14
Bowden J (2004) Low carb diets insulin resistance and diabetes Total Health 26(2) 22-23
Cole W (2004) Is bread toast Time Magazine 163(18) 50-51
Current Events (2004) Carb-crazed Retrieved December 6 2004 from httplibproxylibcsusbedu loginurl=http search epnet com- libproxy lib csusb eduloginaspxdirect=trueampAuthType=cookieipurluidampdb=aphampan=14441487
Daniels S R (2003) Abnormal weight gain and weightmanagement are carbohydrates the enemy Journal of Pediatrics 142 225-227
65
DeNoon D (2004) Is the low-carb craze waning Retrieved December 5 2004 fromhttpcontenthealthmsncomcontentarticle90 100819htmGTl=4244
Ebenkamp B (2004) Baby you deprive my carbs Brandweek 45(11) 20-22
Food Navigator (2004) Low-carb losing its sparkle Retrieved December 5 2004 from http www f oodnavigator comnews printNewsBisaspid=53564
Foxall G R (1988) Marketing new technology markets hierarchies and user initiated innovation Managerial and Decision Economics 9 237-250
Gloede W F (2004) Diet Inc American Demographics 25(10) 32-34
Hawkins D I Roger J B amp Kenneth A C (2001) Consumer Behavior New York McGraw-Hill
Information Resources Incorporate (2003) Fifty-two weeks through mid-year 2003 Retrived March 24 2005 from httpwwwinforescompublicus contentconsumernetworkdefaulthtm
Julie S (2004) What does it mean to be low carb Retrieved December 19 2004 from httpIwwwusatodaycommoneyindustriesfood2 0 04 - 05-25-low-carb_xhtm
Kadlec D Rawe J Park A Fonda D Cole W DeQuine J Healy R Hequet M Hylton H Locke L A amp Scully S (2004) The low-carb frenzy Time Magazine 163(18) 46-53
Kotler P 6 Armstrong G (1993) Maketing An Introduction 3rd ed NY Prentice Hall
LaMar K A Groller K Marroco R Housand LMalecki J Wong S amp Tan L (2004) You asked us Prevention 56(6) 33-38
66
Opinion Dynamic Corporations (2005) Measuring thelow-carb revolution Retrieved March 25 2005 from httpwwwopiniondynamicscomlowcarbhtml
Reyes S (2004) Crowded low-carb market to face new FDA guidelines Brandweek 45(25) 44
Reyes S (2004) New Yoplait launch milks low-carb craze Brandweek 45(18) 12
Reyes S (2004) Wal-mart line may starve low-carb foes Brandweek 45(25) 6
Richard L (2004) The secret to low carb successreduced carbohydrate is the key to success New York Kensington Publishing Corp
Rotella M amp Zaleski J (2003) Low-carb from myth to reality Publishers Weekly 250(5) 71
Thompson S (2004) Carb craze hit by reality check Advertising Age 75(23) 1-2
Thompson S (2004) Food marketers grapple with carb conundrum Advertising Age 75(19) 4-5
Thompson S (2004) Low-carb craze blitzes food biz Advertising Age 75(1) 1-2
Time and Trends (2004) The wellness evolution chasing the low carb consumer Retrieved April 3 2004 from httpwwwinforescompublicusnewsEvents thoughtleadershiptt_issuel8pdf
Topkis M (2003) The lowdown on low carb Money32(13) 218-219
Tsao A (2004) Lean times for food stocks Retrieved December 5 2004 fromhttpwwwbusinessweekcombwdailydnflashmay2004 nf20040518 9901 db014htm
67
Tufts University (2003) Low-carb craze or low-carbcrazy Tufts University Health amp Nutrition Letter 21(8) 4-5
University of California Berkeley (2004) Low-carbfoods less than meets the eye Retrieved December 20 2004 from httpwwwberkeleywellnesscom htmlwl2004wlFeatured0104html
Woodruff S (2004) Finding the right foods Better Nutrition 66(1) 29-32
Woodruff S (2004) Good-cardlow-card living Better Nutrition 66(6) 37-40
Yager J (2004) Low-carbohydrate diet vs low-fat diet no differences after 1 year Eating DisordersReview 15(4) 2-3
68
Factors influencing purchasing decision process of low-carbohydrate products
Recommended Citation
regular products was more acceptable but not so for
non-dieters Another factor considered by dieters was
carb count (mean = 304) The addition of the word
Ultra would not influence the purchase either among
dieters (mean = 420) or non-dieters (mean = 419)
Table 13 Mean Scores of Product Factors of Low
Carbohydrate Beer
spaghetti Calories was the first consideration among
dieters However non-dieters considered taste
(mean = 156) and price (mean = 154) first
Non-dieters were not satisfied with the price difference
between the regular ($099) and the low-carb versions
($199) In turn dieters accepted a higher price
however they were not always likely to buy the
higher-priced product (mean = 254) Carb count was
always a consideration of dieters (mean = 288) but low
consideration was given to the word carb added
(mean = 443) Non-dieters were not very concerned with
carb count (mean = 389) and they strongly disagreed
that the word carb added was important to them
(mean = 451)
If the price of both the regular and
low-carbohydrate juice were the same both dieters and
non-dieters would choose the latter Even though the
taste may not be as good non-dieters would be willing
to try the- low-carb versions (mean = 172) However
calories was still important to dieters (mean = 192)
(Table 15)
The addition of the word light had some impact on
dieters (mean = 302) but less for non-dieters
(mean = 408) (see Table 15)
Low-carbohydrate sandwiches that were priced the
same as regular sandwiches were of interest to dieters
and non-dieters (mean = 257) Even though non-dieters
thought that they would not like the taste as much
(mean = 158) they would be interested in trying
low-carbohydrate products Dieters still agreed strongly
in the importance of Calories (mean = 179) in choosing
a product Both dieters (mean = 429) and non-dieters
(mean = 448) alike disliked the addition of the word
carbsmart (see Table 16)
Table 19 showed the importance of low-carb labeling
to consumers in each age range The majority (538) of
people 46 years and above thought that it was important
Of respondents who had medical conditions such as
diabetes (Table 20) over half (522) of those were
mostly concerned about low-carb information on the label
and approximately 35 of them thought that low-carb
labeling was important (see Table 20)
Many of respondents who were obese (40) felt
neutral about choosing a product with low-carb labeling
However up to 33 of them thought that it was important
to have low-carb labeling when buying food to eat at home
(Table 21)
Tables 22 and 23 showed that the majority (696) of
diabetic respondents were age 46 years and over (see
Table 22) Also the majority (60) of those who
considered themselves obese were age 46 years and over
(see Table 23)
those 46 and over used the internet for research (see
Table 28)
CHAPTER ONE
BACKGROUND
IntroductionLow-fat and non-fat foods are positioned to
appeal to the weight and health conscious consumers (UC
Berkeley Wellness Letter 2004) Although Americans have
substantially reduced their fat intake the obesity
epidemic persists (Daniels 2003) About 64 percent of
Americans are overweight (Current Events 2004) and
obesity is fast becoming a national health crisis (Kadlec
et al 2004) In fact diabetes is the seventh leading
cause of preventable death in the United States Bowden
(2004) found that people on low-carbohydrate diets
experience increased glucose control reduced insulin
resistance weight loss lowered triglycerides and
improved cholesterol It is clear that a focus on low
carbohydrates is needed today (Woodruff 2004)
Of the carbohydrate-oriented diet books the most
successful one is Dr Atkins New Diet Revolution
(Atkins 1998) Atkins recommends restricting intake of
carbohydrates to less than 20 grams a day (Atkins 1998)
However low-carb diets have recently been regarded as a
1
fad (Astrup Thomas amp Harper 2004) yet the trend is
still going strong (Woodruff 2004) Low-carbohydrate
diets such as Atkins South Beach The Zone and other
protein-packed eating regimens are running their course
as did the low-fat diets of the 1980s (Kadlec et al
2004)
Today 24 million Americans are cutting out
carbohydrates and another 44 million may try a low-carb
diet in the next two years (Current Events 2004) Also
according to Opinion Dynamics Corp about 70 million
Americans limit their carbohydrate intake without
actually dieting (Kadlec et al 2004) Suppliers and
manufacturers of diet foods have distributed more than
1500 low-carb diet products since 2002 with the average
carb-conscious shopper spending $85 dollars a month on
neutral (mean = 263 and 267 respectively) regarding the
terms NutrientHealth claims and Well-known Brand
Great design of the package (mean = 362) did not have
an impact on purchase Further respondents had very low
preference forL use of Carb on packaging (mean = 437)
(see Table 7)
28
Table 7 Summary of Preference with Low Carbohydrate
Products
N MeanStd
DeviationTaste is almost or the same as regular products 231 161 915NutrientHealth claim is shown on the label 231 2 63 1315Brand is well-known 231 267 1069The word Carb is added on the package 231 437 1030Package is interestingattractive 231 362 979Price is not much more expensive than regular products
231 193 1029
Valid N (listwise) 231
Objective 2
One reason that low-fat was placed on the market
was to appeal to weight-conscious consumers This was
also true for low-carb products Table 8 showed that a
low-fat diet was a strong motive (mean = 176) for
dieters and almost as a strong (mean = 227) by
non-dieters Overall more respondents agreed that a
low-fat diet was more effective than a low-carb diet in
losing weight
29
Table 8 Mean Scores of Agreement of Diet Products
Are you a dieter
Please indicate how much you would agree
if you want to lose weight with Low Fat Diets
Please indicate how much you would agree
if you want to lose weight with Low Carb Diets
Yes Mean 179 267N 109 109Std Deviation 891 1291
No Mean 227 331N 122 122Std Deviation 1114 1143
Total Mean 203 301N 231 231Std Deviation 1044 1255
Aside from helping to control weight low-carb diets
were advertised as conducive to healthy lifestyle
(Rotella amp Zaleski 2003) However Table 9 showed that
758 of respondents who had never tried a
low-carbohydrate diet did not agree that it was good for
individuals health and 417 of respondents who had
tried low carbohydrates did not think the diet
contributed to good health Nevertheless respondents who
had already tried low-carb products were more likely to
purchase a low-carb product than were those who had not
30
Table 9 Crosstabulation of Respondents Agreement with
Low Carbohydrate Products
Do you think that low carb diets are good for your health
TotalYes NoHave you Yes Counttried a wj_thin Have
77 55 132
low carb you tried a lowproduct carb produqfc
583 417 1000
No Count within Have
24 75 99
you tried a low carb product
242 758 1000
Total Count within Have you tried a low carb product
101
437
130
563
231
1000
Interestingly 50 of respondents who were on a diet
also disagreed with the statement that low-carb diets
were good for health (see Table 10)
31
Table 10 Low Carbohydrate Agreement among Dieters
Do you think that low carb diets are
good for your health
TotalYes NoAre you a Yes Count 60 49 109dieter within Are
a dieteryou 550 450 1000
No Count 41 81 122 within Are a dieter
you 336 664 1000Total Count 101 130 231
within Are a dieter
you 437 563 1000
Table 11 identifies the catalysts that make people
want to try low-carbohydrate diets The majority of
respondents both dieters and not believed the medical
professionals opinion of low-carb products Overall
most respondents (494) would be convinced to try or
purchase low-carb products upon the recommendation of
medical professionals Nutrientlow-carb claims and
advertising (208 and 199 respectively) were the next
two catalysts that affected respondents concerning
health Other catalysts included friends families and
themselves (74) Of those who believed in the advice of
medical professionals 477 were dieters while 508
were non-dieters The next two catalysts among dieters
32
were advertising and nutrientlow-carb claims (22 and
193 respectively) The second catalyst among
non-dieters was nutrientlow-carb claims (221) followed
by advertising (18)
Table 11 Summary of Catalysts Motivating Respondents
What would be the most common catalyst that makes you try low carb products
TotalMedical
ProfessionalsStore
Environment
Nutrient Low Carb Claims Adveritsing Other
Are you Yes Count a dieter within
52 5 21 24 7 109
Are you a dieter
477 239 468 174 55 1000
No Count 62 1 27 22 10 122 within Are you a dieter
508 8 221 180 82 1000
Total Count 114 6 48 46 17 231 withinAre you a dieter
494 26 208 199 74 1000
Objective 3According to respondents concerns for low-carb
messages on either the product label or on a restaurant
advertisement Table 12 showed that dieters (mean = 294)
had more concern than non-dieters (mean = 393) for
low-carbohydrate information on the label However the
degree of concern for low-carb offerings by restaurants
33
by both groups was only moderate to less important Both
dieters and non-dieters agreed less on the offerings
(mean = 393 and 427 respectively)
Table 12 Importance of Low-Carb Product
LabelingOfferings to Respondents
Are you a dieter
How important is it to you in purchasing food to eat at home that the food has low carb information
on the label
How important is it to you in choosing a
restaurant specifically advertises low carb
offeringsYes Mean 294 393
N 109 109Std Deviation 1442 1152
No Mean 378 427N 122 122Std Deviation 1237 1045
Total Mean 338 411N 231 231Std Deviation 1399 1108
The next four tables reflect respondents opinions
regarding four different low-carbohydrate products
price taste calories carb count and carb labeling
Low-carbohydrate beer Michelob Ultra is offered in
the market survey (Table 13) To dieters calories
(mean = 182) were of concern however to non-dieters
taste (mean = 169) was their primary consideration To
dieters paying a bit more for the low carbs than the
34
regular products was more acceptable but not so for
non-dieters Another factor considered by dieters was
carb count (mean = 304) The addition of the word
Ultra would not influence the purchase either among
dieters (mean = 420) or non-dieters (mean = 419)
Table 13 Mean Scores of Product Factors of Low
Carbohydrate Beer
Are you a dieter
Between regular Michelob beer and low-carb Michelob beerI always look for Carb Count
diet products and to identify the factors that influenced
their decision to purchase low-carbohydrate food Because
of epidemic of obesity and diabetes among Americans
low-fat foods contribute to good health and weight
control (UC Berkeley Wellness Letter 2004) However
obesity and diabetes rates remain high (Daniels 2003)
As a result people on low carbohydrates experience
weight loss lowered triglycerides and lower cholesterol
(Bowden 2004) Today the focus is on carbohydrate
reduction (Woodruff2004)This practice emphasized the
fact that the suppliers and manufacturers of low-carb
food markets should understand the demands of their
consumers when it comes to low-carbohydrate foods Today
50
carb is widely used in product packaging to capture
market sales (Addis 2004) However brand taste and
price attributes are still important to consumers
(Beirne 2004) Therefore it is necessary for food
marketers to understand and meet the demand for
low-carbohydrate products given these criteria
Results showed that females seemed to be more
concerned about their food consumption than males are
Most of the dieters were 46 years old and over with
incomes ranging from $50000 - $74999 Moreover people
with medical conditions such as diabetes tended to pay
more attention to low-carb information Most respondents
consumed diet products between two and four times per
week
Weight loss was the primary factor in respondents
consumption of diet products However low-fat diets were
still thought to be more effective than low-carb diets in
weight reduction This finding confirms ODCs (2005)
conclusion that consumers are more concerned with fat
content than with any other nutritional claim Still
fewer than 50 of respondents agreed that low-carb diets
were good for health
51
In general low-carbohydrate information on both the
label and on restaurant menus was important for dieters
but not for non-dieters Most respondents preferred
low-carbohydrate products that tasted as much like the
original as possible This finding is consistent with
that of the IRIs Consumer Network (2001) that determined
that taste was a key factor in food and beverage
selection Brand recognition was expected most from
non-dieters However for dieters Brand was less
important than low-carb claims which refers not only
to carb count but also to calories something that
was very important to most dieters Topkis (2003) found
that many low-carb products were often more expensive
than the original or than other products in the same
category The findings consistently indicated that
low-price or equal price of low-carb products had an
impact on purchases -especially among non-dieters who
were interested in trying something different but not in
paying more-
Although Addis (2004) expected that trademarks
combined with the word carb would sell more results
indicated that the word carb on the package had the
least importance in influencing respondents purchasing
52
decision Most respondents placed little credence in the
word carb however the word light had more of an
impact
Implications of the findings suggest that medical
care centers would be the best place to provide
low-carbohydrate products for people who have a medical
condition For other people supermarkets might be the
best place to offer low-carbohydrate foods Restaurant
menus present the occasional opportunity to dine on
low-carbohydrate products However websites would not be
a good place to market low-carbohydrate products because
people rarely buy diet products online
It is also recommended that low-carb advertisements
appear in newspapers because people age 46 years and over
spend the most time reading the newspaper
Also radio stations which most people listen to
regularly should have low-carb advertisements Magazines
should focus only on people age 20 to 35 Since medical
professionals have a great influence upon purchases they
might want to try low-carbohydrate products Their
recommendation can help promote the sale of low-carb
diets
53
Results indicated that most respondents had more
confidence in low-fat foods than in low-carbohydrate
foods Consequently a further recommendation is for diet
products to focus on being low-fat rather than the
low-carb particularly in package labeling This claim
is supported by the findings that lower fat is better
than fewer carbs for weight loss low fat promotes better
health than fewer carbs and buyers would be more
attracted to low-fat products than to products that were
labeled as low-carb
In terms of product labeling low-fat appeared to be
the most significant influence upon weight-conscious
respondents Consequently low-fat labeling should be
emphasized more than low-carb as well as in
advertisements Having words that consumers can easily
see while making a purchase can aid in a
salesfactoryexperience Further manufacturers should
research and produce tasty but reasonably-priced low-fat
and low-carb products to drive sales
However low-carbohydrate diets were still needed
among diabetic respondents (Table 20) Therefore the
niche market of low-carb products should focus on
diabetics
54
While most diabetics cited low carbohydrates as
their primary reason to stay healthy and control weight
weight watchers trusted low-fat diets more so than
low-carb ones Medical professionals should be encouraged
to endorse the health benefits of reducing carbohydrate
intake for good health
55
APPENDIX
QUESTIONNAIRE
56
Public Opinion Survey
The purpose of this survey is to learn peoplesrsquo preferences and opinions toward low carbohydrate carbohydrate-controlled products Please take 7-10 minutes to complete the questionnaire There is no right or wrong answer Your responses will be kept confidential Thank you very much for your help in this research effort
Please nut an X on the blank that best describes your opinion
Section 1
1) Are you a dieter__ Yes __ No (Go to Question No4)
2) Why are you on diet (Check all that apply)__ Good Health ___Weight loss ___Other_______
3) How often do you eat diet products__ more than 5 times a week __ 2 to 4 times a week__ Once a week __ Never__ Other______
4) Please indicate how much you would agree (if you wanted to lose weight) with each of the following by checking the blank that best represents your response
6) Do you think that low-carb diets are good for your health__ Yes __ No
7) What would be the most common catalyst that would make you try a low-carb product
__ Medical professionals __ Store environment__ NutrientLow Carb Claims ___Advertising (eg TV magazine)__ Other_______
57
8) Please indicate how often you would buyeat diet products from each of following place by circling the number that best represents your response
1- Very Often 2- Often 3- Occasionally 4- Almost Never 5- Never
A Restaurants 1 2B Supermarkets 1 2C Medical Care Centers 1 2D Websites 1 2E Others 1 2
(Please specify)
3 4 5 3 4 5 3 4 5 3 4 5 3 4 5
9) Check the blank that best represents your response
A How important is it to you to purchase food to eat at home than food with low- carb information on the label
Most important Least important
B How important is it to you to choose a restaurant that specifically advertises low- carb offerings
Most important ___ ____ ____ ____ ___Least important
MICHELOB ULTRAreg vs MICHELOBreg26 g CARBS 133 g95 CALORIES 155
$175 PRICEServing size 12 oz
$135
From above information between regular Michelob beer and low-carb Michelob beer (Michelob ultra)how would you respond to the following Check the blank that best represents bull your response
58
A I always look at carb count
Strongly Agree Strongly Disagree
B I would be concerned about ldquoCaloriesrdquo
Strongly Agree Strongly Disagree
C I donrsquot feel good about the price of the low-carb product so I wouldnrsquot buy it
Strongly Agree Strongly Disagree
D I donrsquot thinkI would like the ldquoTasterdquo of low-carb beer
Strongly Agree Strongly Disagree
E The word ldquoUltrardquo on the product makes memoreinterested in buying it
From above information between Muellerrsquos reduced-carb spaghetti and Muellerrsquos regular how would you respond to the following Check the blank that best represents your response
59
A I always look at carbCount
Strongly Agree Strongly Disagree
B I would be concerned about ldquoCaloriesrdquo
Strongly Agree Strongly Disagree
C I donrsquot feel goodabout the price of the low-carb product so I wouldnrsquot buy it
Strongly Agree Strongly Disagree
D I donrsquot think I would like the ldquoTasterdquo of the low-carb spaghetti
From above information between Tropicana lightrsquon healthy and Tropicana pure premium how would you respond to the following Check the blank that best represents your response
60
A I always look at carb count
Strongly Agree Strongly Disagree
BI would beconcernedaboutldquoCaloriesrdquo
Strongly Agree Strongly Disagree
CI would buy the low-carb product because itrsquos the
Strongly Agree Strongly Disagree
same price as the regular
DI donrsquot think I would like the ldquoTasterdquo of the
Strongly Agree Strongly Disagree
low-carb juiceE The word
ldquoLightrdquo on the product makes me more
Strongly Agree Strongly Disagree
interested to buy it
13)
KLONDIKECARBSMARTSANDWICHESreg
VS KLONDIKE BIGBEAR SANDWICHESreg
5g CARBS 28 g80 CALORIES 190
$399 PRICESferurgsx Oesrdridi
$399
From above information Between Klondike carb-smart sandwiches and Klondike big bear sandwiches how would you respond to the following Check the blank that best represents your response
61
A I always look at carb count
Strongly Agree Strongly Disagree
B I would be be concerned about ldquoCaloriesrdquo
Strongly Agree Strongly Disagree
C I would buy the low-carb product because itrsquos the same price as the regular
Strongly Agree Strongly Disagree
D I donrsquot think I would like the ldquoTasterdquo of the low-carb sandwiches
Strongly Agree Strongly Disagree
E The word ldquoCarbsmartrdquo on the product makes memoreinterested to buy them
Strongly Agree Strongly Disagree
62
14) If you were to make a decision to buy a low carbohydrate product please rate your preference for each of the following features that best represents your response
A Whether or not the ldquoTasterdquo is almost or the same as the regular product
High preference Low preference
B Preference for ldquoNutri entHealth claimrdquo on the label
High preference Low preference
C Product is made by a well-known ldquoBrandrdquo High preference Low preference
D Product package contains the word ldquoCarbrdquo
High preference Low preference
E ldquoPackagerdquo is great designed High preference Low preference
F The ldquoPricerdquo of low-carb product the same or only a bit more expensive than the regular product
High preference Low preference
15) What media do you usually use (Please check all that apply)___ Radio Station___ Television___ Newspaper___ Magazine
Internet
63
Section 2 About you
1) What is your gender__ Male
2) Which age range applies to you__ 19 years and under_ 36-45
3) What is your educational background__ High school__ Associate degree__ Graduate or professional degree
4) What is your ethnic background
Female
20-2546 years and over
CollegeBachelorrsquos degree
26-35
WhiteBlack
_ Hispanic Asian
Pacific Islander Native American Multi Racial Other
5) What is your approximately total household income_ Less than $9999 _ $ 10000-$ 14999_ $15000-$24999 _ $25000-$49999_ $50000-$74999 _ $75000-$99999__ $100000 and over
6) Do you have any medical conditions (Check all that apply)__ Diabetes__ Obesity__ I donrsquot have
Other
laquoThank You
64
REFERENCES
Addis S (2004) Think outside the low-carb box Advertising Age 75(26) 22
Alvensleben R (1997) Consumer behaviour Agro-food marketing Wallingford CAB Publishing
Astrup P Thomas M L amp Harper A(2004) Atkins and other low-carbohydrate diets Hoax or an effect tool for weight loss Lancet 364(9437) 897-899
Atkins R (1998) Dr Atkins new diet revolution (3rd ed) New York Simon amp Schuster
Atkins R (2002) Dr Atkins new diet revolution New York Avon Books
Banking Business (2004) Low-carb sales trends andconsumer attitudes Retrieved December 5 2004 from httpwwwbankingbusinesscomco_articleaspArticleID=72 022
Beirne M (2004) Confectioners unwrap low-card strategies Brandweek 45(24) 14
Bowden J (2004) Low carb diets insulin resistance and diabetes Total Health 26(2) 22-23
Cole W (2004) Is bread toast Time Magazine 163(18) 50-51
Current Events (2004) Carb-crazed Retrieved December 6 2004 from httplibproxylibcsusbedu loginurl=http search epnet com- libproxy lib csusb eduloginaspxdirect=trueampAuthType=cookieipurluidampdb=aphampan=14441487
Daniels S R (2003) Abnormal weight gain and weightmanagement are carbohydrates the enemy Journal of Pediatrics 142 225-227
65
DeNoon D (2004) Is the low-carb craze waning Retrieved December 5 2004 fromhttpcontenthealthmsncomcontentarticle90 100819htmGTl=4244
Ebenkamp B (2004) Baby you deprive my carbs Brandweek 45(11) 20-22
Food Navigator (2004) Low-carb losing its sparkle Retrieved December 5 2004 from http www f oodnavigator comnews printNewsBisaspid=53564
Foxall G R (1988) Marketing new technology markets hierarchies and user initiated innovation Managerial and Decision Economics 9 237-250
Gloede W F (2004) Diet Inc American Demographics 25(10) 32-34
Hawkins D I Roger J B amp Kenneth A C (2001) Consumer Behavior New York McGraw-Hill
Information Resources Incorporate (2003) Fifty-two weeks through mid-year 2003 Retrived March 24 2005 from httpwwwinforescompublicus contentconsumernetworkdefaulthtm
Julie S (2004) What does it mean to be low carb Retrieved December 19 2004 from httpIwwwusatodaycommoneyindustriesfood2 0 04 - 05-25-low-carb_xhtm
Kadlec D Rawe J Park A Fonda D Cole W DeQuine J Healy R Hequet M Hylton H Locke L A amp Scully S (2004) The low-carb frenzy Time Magazine 163(18) 46-53
Kotler P 6 Armstrong G (1993) Maketing An Introduction 3rd ed NY Prentice Hall
LaMar K A Groller K Marroco R Housand LMalecki J Wong S amp Tan L (2004) You asked us Prevention 56(6) 33-38
66
Opinion Dynamic Corporations (2005) Measuring thelow-carb revolution Retrieved March 25 2005 from httpwwwopiniondynamicscomlowcarbhtml
Reyes S (2004) Crowded low-carb market to face new FDA guidelines Brandweek 45(25) 44
Reyes S (2004) New Yoplait launch milks low-carb craze Brandweek 45(18) 12
Reyes S (2004) Wal-mart line may starve low-carb foes Brandweek 45(25) 6
Richard L (2004) The secret to low carb successreduced carbohydrate is the key to success New York Kensington Publishing Corp
Rotella M amp Zaleski J (2003) Low-carb from myth to reality Publishers Weekly 250(5) 71
Thompson S (2004) Carb craze hit by reality check Advertising Age 75(23) 1-2
Thompson S (2004) Food marketers grapple with carb conundrum Advertising Age 75(19) 4-5
Thompson S (2004) Low-carb craze blitzes food biz Advertising Age 75(1) 1-2
Time and Trends (2004) The wellness evolution chasing the low carb consumer Retrieved April 3 2004 from httpwwwinforescompublicusnewsEvents thoughtleadershiptt_issuel8pdf
Topkis M (2003) The lowdown on low carb Money32(13) 218-219
Tsao A (2004) Lean times for food stocks Retrieved December 5 2004 fromhttpwwwbusinessweekcombwdailydnflashmay2004 nf20040518 9901 db014htm
67
Tufts University (2003) Low-carb craze or low-carbcrazy Tufts University Health amp Nutrition Letter 21(8) 4-5
University of California Berkeley (2004) Low-carbfoods less than meets the eye Retrieved December 20 2004 from httpwwwberkeleywellnesscom htmlwl2004wlFeatured0104html
Woodruff S (2004) Finding the right foods Better Nutrition 66(1) 29-32
Woodruff S (2004) Good-cardlow-card living Better Nutrition 66(6) 37-40
Yager J (2004) Low-carbohydrate diet vs low-fat diet no differences after 1 year Eating DisordersReview 15(4) 2-3
68
Factors influencing purchasing decision process of low-carbohydrate products
Recommended Citation
regular products was more acceptable but not so for
non-dieters Another factor considered by dieters was
carb count (mean = 304) The addition of the word
Ultra would not influence the purchase either among
dieters (mean = 420) or non-dieters (mean = 419)
Table 13 Mean Scores of Product Factors of Low
Carbohydrate Beer
spaghetti Calories was the first consideration among
dieters However non-dieters considered taste
(mean = 156) and price (mean = 154) first
Non-dieters were not satisfied with the price difference
between the regular ($099) and the low-carb versions
($199) In turn dieters accepted a higher price
however they were not always likely to buy the
higher-priced product (mean = 254) Carb count was
always a consideration of dieters (mean = 288) but low
consideration was given to the word carb added
(mean = 443) Non-dieters were not very concerned with
carb count (mean = 389) and they strongly disagreed
that the word carb added was important to them
(mean = 451)
If the price of both the regular and
low-carbohydrate juice were the same both dieters and
non-dieters would choose the latter Even though the
taste may not be as good non-dieters would be willing
to try the- low-carb versions (mean = 172) However
calories was still important to dieters (mean = 192)
(Table 15)
The addition of the word light had some impact on
dieters (mean = 302) but less for non-dieters
(mean = 408) (see Table 15)
Low-carbohydrate sandwiches that were priced the
same as regular sandwiches were of interest to dieters
and non-dieters (mean = 257) Even though non-dieters
thought that they would not like the taste as much
(mean = 158) they would be interested in trying
low-carbohydrate products Dieters still agreed strongly
in the importance of Calories (mean = 179) in choosing
a product Both dieters (mean = 429) and non-dieters
(mean = 448) alike disliked the addition of the word
carbsmart (see Table 16)
Table 19 showed the importance of low-carb labeling
to consumers in each age range The majority (538) of
people 46 years and above thought that it was important
Of respondents who had medical conditions such as
diabetes (Table 20) over half (522) of those were
mostly concerned about low-carb information on the label
and approximately 35 of them thought that low-carb
labeling was important (see Table 20)
Many of respondents who were obese (40) felt
neutral about choosing a product with low-carb labeling
However up to 33 of them thought that it was important
to have low-carb labeling when buying food to eat at home
(Table 21)
Tables 22 and 23 showed that the majority (696) of
diabetic respondents were age 46 years and over (see
Table 22) Also the majority (60) of those who
considered themselves obese were age 46 years and over
(see Table 23)
those 46 and over used the internet for research (see
Table 28)
(Cole 2004) Undoubtedly America officially became the
Low-Carb Nation with its craze for low-carbohydrate
foods (UC Berkeley Wellness Letter 2004)
Problem StatementCarb has become the popular abbreviation for
carbohydrates and this term is being used extensively in
product packaging (Addis 2 0 04) Today a large
percentage of research and development dollars in the
packaged-foods industry is being directed to low-carb
products to meet the markets insatiable appetite (Addis
2004) More than 1000 trademarks are associated with
products that used the word carb to capture market
sales (Addis 2004) In addition many foods have been
developed for consumers on the Atkins diet and endorsed
by the company to influence brand choice
People love brands on an emotional level but if
branded low-carb versions of tasty and value-priced foods
can be developed they will capture consumers attention
as did Coca Cola when it introduced C2 (Beirne 2004)
However reduced carbohydrate products are not known for
their flavor For instance low-carb beer had very little
taste (Tufts University Health amp Nutrition Letter 2003)
3
Also many low-carbohydrate products were expensive
costing two or three times more than the regular versions
(Topkis 2003) Despite these setbacks consumers are
carb aware and retailers report that low-carb products
are not selling as anticipated (Thompson 2004) However
the low-carb craze is forcing major food marketers to
rethink their strategies because consumers will not pay
a premium for brands that support their dietary
requirements if the food does not taste good (Thompson
2004)
Purpose of the Project The purpose of the study is to identify the
attributes that influence the purchase decision of
low-carbohydrate foods Understanding consumers
attitudes toward low-carb diet products will help
manufacturers to build low-carb products sales and
improve their marketing strategies The objectives of
this project are to
1 Determine the extent of low-carbohydrate
purchases among consumers and the level of
preference among consumers when purchasing
low-carb products
4
2 Determine attitudes toward low-carbohydrate
diets among consumers
3 Determine the attributes that influence
purchase decisions of low-carbohydrate
products
4 Determine the demographic and psychographic
characteristics of consumers that purchase
low-carbohydrate foods
5 Determine strategies to improve marketing of
low-carbohydrate products among manufacturers
Limitations of the Project1 The study focuses on the low-carbohydrate diet
trend in the United States
2 The study population is limited to students
enrolled in a Southwestern University and
residents in a city in the Southwest
Definition of Terms
bull Carbohydrates are the bodys first source of
energy (Julie 2004)
bull bull Complex carbohydrates are found in
whole-grain breads beans fruits and
5
vegetables They contain fiber and break down
slowly when digested creating a feeling of
fullness (Kadlec et al 2004)
Simple carbohydrates are found in white rice
potatoes most commercial breads and processed
crackers cookies chips soda and candy bars
They break down more quickly than complex
carbohydrates They produce a sugar overload
and do not provide the same amount of nutrition
or fiber of complex carbohydrates (Kadlec et
al 2004)
The Atkins diet limits carbohydrate craving
resets the bodys metabolism and induces
fat loss by eliminating
carbohydrate-containing foods regardless of
whether they are high in fiber contain whole
grains or have vitamins and minerals As a
result the diet recommends limiting breads
pasta rice potatoes fruit and starchy
vegetables (corn peas) and sweets (Atkins
2002)
6
Low-carb is used in this project to refer to
reduced carbohydrate or that lowers blood
glucose levels Fewer carbohydrates in the diet
allow the body to minimize the amount of blood
glucose that is stored as body fat (Richard
2004)
bull Net carbs are often used to refer only to
those carbs that raise blood-sugar levels
(Reyes 2004)
The Food and Drug Administration (FDA) has not
stipulated the minimum number of carbs a product must
have to qualify as low carbohydrate (Julie 2004)
Therefore there is no standard of how many carbs per
serving are considered low carb or how many servings a
day as shown on the food label should be low carb
Although the term has not been legally defined it
appears on many food labels and in supermarkets (LaMar et
al 2004)
Organization of the Project
This study is divided into five chapters Chapter
One provides an introduction to the problem purpose of
the project objectives limitations and definitions of
7
terms Chapter Two is a review of relevant literature
Chapter Three outlines the methodology used in the study
Chapter Four provides the results and Chapter Five
presents conclusions and implications of the studys
findings Project references follow Chapter Five An
Appendix for the project consists of a Questionnaire and
data collected
8
CHAPTER TWO
REVIEW OF THE LITERATURE
Introduction
Today there is a wealth of information on consumer
wellness concerns and on the factors that influence the
purchasing of low-carbohydrate diets (Time amp Trends
2004) Consumer demand for healthier life and nutritional
benefits is growing and low carbohydrate is part of
the overall wellness theme The low-carb craze was
spearheaded by the publicity about the Atkins Diet the
national obesity crisis low-carb product launches and
fast food restaurants quick response offerings (Time amp
Trends 2 0 04) Many companies are spending millions of
dollars on advertising packaging and store atmosphere to
push low-carbohydrate products (Hawkins Best amp Coney
2001)
Factors Influencing the Purchase Decision ProcessBuyers are motivated to purchase food on the basis
of their nutritional or health needs taste convenience
and brand (Alvensleben 1997) Furthermore customers
age and income are among the factors that influence their
9
choice Finally product-related variables such as
packaging and price affect consumer demand for
low-carbohydrate foods (Alvensleben 1997)
The IRIs Consumer Network (2004) found that taste
is a key factor in food and beverage selection - based
upon Retail Satisfaction Survey of more than 5000
consumers The results showed that 46 percent of
consumers rarely sacrificed good taste for health
benefits even though staying healthy or having a healthy
life influences consumer purchase behavior and attitudes
among low-carb product categories (Time amp Trends 2004)
Kirsten Aune a marketing manager at General Mills
said that many consumers especially women wanted
products that were both tasty and easy to enjoy (Reyes
2004) Many women complained about the bland taste of
low-carbohydrate products For instance low-carb beer
tasted watery (Tufts University Health amp Nutrition
Letter 2003) The low-carb craze is forcing major food
marketers to rethink their assumption that consumers will
pay a premium for poor-tasting products (Thompson 2004)
10
restaurant advertised low-carb offerings before choosing
a restaurant (Banking Business 2004)
A large percentage of RampD dollars in the
packaged-foods business is going into low-carbohydrate
products There have been over 1000 trademarks carrying
with the word carb to increase sales (Addis 2004)
People might purchase new items because they are
attracted to the products and because they think that
messages on food labels are controlled by the government
The FDA however has not defined low carb
Consequently consumers assume that low-carb labeling
must be true even though the claims are ambiguous (UC
Berkeley Wellness Letter 2004)
However many low-carbohydrate products cost two or
three times the price of a- fully loaded version (Topkis
2003) Even though consumers are carb aware retailers
report that low-carb foods are unpopular because
consumers think that they are overpriced This
unpopularity is driving down the premium prices of
low-carb products (Thompson 2004) Consumers are not
willing to pay a lot of extra money for fewer calories or
13
carbohydrates (Tufts University Health amp Nutrition
Letter 2003)
Opinion Dynamics Corporation (2005) found that
consumers are more concerned with fat content than with
any other nutritional claim At the moment it is not at
all clear that there will be any one claim that can
support the low-carb craze of 2005 (ODC)
(httpwwwopiniondynamicscomlowcarbhtml 2 0 04)
However about 64 percent of Americans are overweight
(Current Events 2004) and about 40 percent of Americans
have tried to lose weight by using some form of a
low-carbohydrate diet (Ebenkamp 2004) According to the
AC Nielsen poll a low-carbohydrate dieter lost weight
felt great by embracing the low-carb lifestyle and
avoiding sugary and starchy foods (Raloff 2004)
Low-carb diets are not only used by people who wish to
lose weight but also by those who desired to live
healthier lives There is a focus on choosing the right
carb In doing so the entire diet becomes healthy
(Rotella amp Zaleski 2003) According to the New Product
Development (2004) people who are eating fewer
carbohydrates already had a higher incidence of health
14
problems such as diabetes high blood pressure and high
neutral (mean = 263 and 267 respectively) regarding the
terms NutrientHealth claims and Well-known Brand
Great design of the package (mean = 362) did not have
an impact on purchase Further respondents had very low
preference forL use of Carb on packaging (mean = 437)
(see Table 7)
28
Table 7 Summary of Preference with Low Carbohydrate
Products
N MeanStd
DeviationTaste is almost or the same as regular products 231 161 915NutrientHealth claim is shown on the label 231 2 63 1315Brand is well-known 231 267 1069The word Carb is added on the package 231 437 1030Package is interestingattractive 231 362 979Price is not much more expensive than regular products
231 193 1029
Valid N (listwise) 231
Objective 2
One reason that low-fat was placed on the market
was to appeal to weight-conscious consumers This was
also true for low-carb products Table 8 showed that a
low-fat diet was a strong motive (mean = 176) for
dieters and almost as a strong (mean = 227) by
non-dieters Overall more respondents agreed that a
low-fat diet was more effective than a low-carb diet in
losing weight
29
Table 8 Mean Scores of Agreement of Diet Products
Are you a dieter
Please indicate how much you would agree
if you want to lose weight with Low Fat Diets
Please indicate how much you would agree
if you want to lose weight with Low Carb Diets
Yes Mean 179 267N 109 109Std Deviation 891 1291
No Mean 227 331N 122 122Std Deviation 1114 1143
Total Mean 203 301N 231 231Std Deviation 1044 1255
Aside from helping to control weight low-carb diets
were advertised as conducive to healthy lifestyle
(Rotella amp Zaleski 2003) However Table 9 showed that
758 of respondents who had never tried a
low-carbohydrate diet did not agree that it was good for
individuals health and 417 of respondents who had
tried low carbohydrates did not think the diet
contributed to good health Nevertheless respondents who
had already tried low-carb products were more likely to
purchase a low-carb product than were those who had not
30
Table 9 Crosstabulation of Respondents Agreement with
Low Carbohydrate Products
Do you think that low carb diets are good for your health
TotalYes NoHave you Yes Counttried a wj_thin Have
77 55 132
low carb you tried a lowproduct carb produqfc
583 417 1000
No Count within Have
24 75 99
you tried a low carb product
242 758 1000
Total Count within Have you tried a low carb product
101
437
130
563
231
1000
Interestingly 50 of respondents who were on a diet
also disagreed with the statement that low-carb diets
were good for health (see Table 10)
31
Table 10 Low Carbohydrate Agreement among Dieters
Do you think that low carb diets are
good for your health
TotalYes NoAre you a Yes Count 60 49 109dieter within Are
a dieteryou 550 450 1000
No Count 41 81 122 within Are a dieter
you 336 664 1000Total Count 101 130 231
within Are a dieter
you 437 563 1000
Table 11 identifies the catalysts that make people
want to try low-carbohydrate diets The majority of
respondents both dieters and not believed the medical
professionals opinion of low-carb products Overall
most respondents (494) would be convinced to try or
purchase low-carb products upon the recommendation of
medical professionals Nutrientlow-carb claims and
advertising (208 and 199 respectively) were the next
two catalysts that affected respondents concerning
health Other catalysts included friends families and
themselves (74) Of those who believed in the advice of
medical professionals 477 were dieters while 508
were non-dieters The next two catalysts among dieters
32
were advertising and nutrientlow-carb claims (22 and
193 respectively) The second catalyst among
non-dieters was nutrientlow-carb claims (221) followed
by advertising (18)
Table 11 Summary of Catalysts Motivating Respondents
What would be the most common catalyst that makes you try low carb products
TotalMedical
ProfessionalsStore
Environment
Nutrient Low Carb Claims Adveritsing Other
Are you Yes Count a dieter within
52 5 21 24 7 109
Are you a dieter
477 239 468 174 55 1000
No Count 62 1 27 22 10 122 within Are you a dieter
508 8 221 180 82 1000
Total Count 114 6 48 46 17 231 withinAre you a dieter
494 26 208 199 74 1000
Objective 3According to respondents concerns for low-carb
messages on either the product label or on a restaurant
advertisement Table 12 showed that dieters (mean = 294)
had more concern than non-dieters (mean = 393) for
low-carbohydrate information on the label However the
degree of concern for low-carb offerings by restaurants
33
by both groups was only moderate to less important Both
dieters and non-dieters agreed less on the offerings
(mean = 393 and 427 respectively)
Table 12 Importance of Low-Carb Product
LabelingOfferings to Respondents
Are you a dieter
How important is it to you in purchasing food to eat at home that the food has low carb information
on the label
How important is it to you in choosing a
restaurant specifically advertises low carb
offeringsYes Mean 294 393
N 109 109Std Deviation 1442 1152
No Mean 378 427N 122 122Std Deviation 1237 1045
Total Mean 338 411N 231 231Std Deviation 1399 1108
The next four tables reflect respondents opinions
regarding four different low-carbohydrate products
price taste calories carb count and carb labeling
Low-carbohydrate beer Michelob Ultra is offered in
the market survey (Table 13) To dieters calories
(mean = 182) were of concern however to non-dieters
taste (mean = 169) was their primary consideration To
dieters paying a bit more for the low carbs than the
34
regular products was more acceptable but not so for
non-dieters Another factor considered by dieters was
carb count (mean = 304) The addition of the word
Ultra would not influence the purchase either among
dieters (mean = 420) or non-dieters (mean = 419)
Table 13 Mean Scores of Product Factors of Low
Carbohydrate Beer
Are you a dieter
Between regular Michelob beer and low-carb Michelob beerI always look for Carb Count
diet products and to identify the factors that influenced
their decision to purchase low-carbohydrate food Because
of epidemic of obesity and diabetes among Americans
low-fat foods contribute to good health and weight
control (UC Berkeley Wellness Letter 2004) However
obesity and diabetes rates remain high (Daniels 2003)
As a result people on low carbohydrates experience
weight loss lowered triglycerides and lower cholesterol
(Bowden 2004) Today the focus is on carbohydrate
reduction (Woodruff2004)This practice emphasized the
fact that the suppliers and manufacturers of low-carb
food markets should understand the demands of their
consumers when it comes to low-carbohydrate foods Today
50
carb is widely used in product packaging to capture
market sales (Addis 2004) However brand taste and
price attributes are still important to consumers
(Beirne 2004) Therefore it is necessary for food
marketers to understand and meet the demand for
low-carbohydrate products given these criteria
Results showed that females seemed to be more
concerned about their food consumption than males are
Most of the dieters were 46 years old and over with
incomes ranging from $50000 - $74999 Moreover people
with medical conditions such as diabetes tended to pay
more attention to low-carb information Most respondents
consumed diet products between two and four times per
week
Weight loss was the primary factor in respondents
consumption of diet products However low-fat diets were
still thought to be more effective than low-carb diets in
weight reduction This finding confirms ODCs (2005)
conclusion that consumers are more concerned with fat
content than with any other nutritional claim Still
fewer than 50 of respondents agreed that low-carb diets
were good for health
51
In general low-carbohydrate information on both the
label and on restaurant menus was important for dieters
but not for non-dieters Most respondents preferred
low-carbohydrate products that tasted as much like the
original as possible This finding is consistent with
that of the IRIs Consumer Network (2001) that determined
that taste was a key factor in food and beverage
selection Brand recognition was expected most from
non-dieters However for dieters Brand was less
important than low-carb claims which refers not only
to carb count but also to calories something that
was very important to most dieters Topkis (2003) found
that many low-carb products were often more expensive
than the original or than other products in the same
category The findings consistently indicated that
low-price or equal price of low-carb products had an
impact on purchases -especially among non-dieters who
were interested in trying something different but not in
paying more-
Although Addis (2004) expected that trademarks
combined with the word carb would sell more results
indicated that the word carb on the package had the
least importance in influencing respondents purchasing
52
decision Most respondents placed little credence in the
word carb however the word light had more of an
impact
Implications of the findings suggest that medical
care centers would be the best place to provide
low-carbohydrate products for people who have a medical
condition For other people supermarkets might be the
best place to offer low-carbohydrate foods Restaurant
menus present the occasional opportunity to dine on
low-carbohydrate products However websites would not be
a good place to market low-carbohydrate products because
people rarely buy diet products online
It is also recommended that low-carb advertisements
appear in newspapers because people age 46 years and over
spend the most time reading the newspaper
Also radio stations which most people listen to
regularly should have low-carb advertisements Magazines
should focus only on people age 20 to 35 Since medical
professionals have a great influence upon purchases they
might want to try low-carbohydrate products Their
recommendation can help promote the sale of low-carb
diets
53
Results indicated that most respondents had more
confidence in low-fat foods than in low-carbohydrate
foods Consequently a further recommendation is for diet
products to focus on being low-fat rather than the
low-carb particularly in package labeling This claim
is supported by the findings that lower fat is better
than fewer carbs for weight loss low fat promotes better
health than fewer carbs and buyers would be more
attracted to low-fat products than to products that were
labeled as low-carb
In terms of product labeling low-fat appeared to be
the most significant influence upon weight-conscious
respondents Consequently low-fat labeling should be
emphasized more than low-carb as well as in
advertisements Having words that consumers can easily
see while making a purchase can aid in a
salesfactoryexperience Further manufacturers should
research and produce tasty but reasonably-priced low-fat
and low-carb products to drive sales
However low-carbohydrate diets were still needed
among diabetic respondents (Table 20) Therefore the
niche market of low-carb products should focus on
diabetics
54
While most diabetics cited low carbohydrates as
their primary reason to stay healthy and control weight
weight watchers trusted low-fat diets more so than
low-carb ones Medical professionals should be encouraged
to endorse the health benefits of reducing carbohydrate
intake for good health
55
APPENDIX
QUESTIONNAIRE
56
Public Opinion Survey
The purpose of this survey is to learn peoplesrsquo preferences and opinions toward low carbohydrate carbohydrate-controlled products Please take 7-10 minutes to complete the questionnaire There is no right or wrong answer Your responses will be kept confidential Thank you very much for your help in this research effort
Please nut an X on the blank that best describes your opinion
Section 1
1) Are you a dieter__ Yes __ No (Go to Question No4)
2) Why are you on diet (Check all that apply)__ Good Health ___Weight loss ___Other_______
3) How often do you eat diet products__ more than 5 times a week __ 2 to 4 times a week__ Once a week __ Never__ Other______
4) Please indicate how much you would agree (if you wanted to lose weight) with each of the following by checking the blank that best represents your response
6) Do you think that low-carb diets are good for your health__ Yes __ No
7) What would be the most common catalyst that would make you try a low-carb product
__ Medical professionals __ Store environment__ NutrientLow Carb Claims ___Advertising (eg TV magazine)__ Other_______
57
8) Please indicate how often you would buyeat diet products from each of following place by circling the number that best represents your response
1- Very Often 2- Often 3- Occasionally 4- Almost Never 5- Never
A Restaurants 1 2B Supermarkets 1 2C Medical Care Centers 1 2D Websites 1 2E Others 1 2
(Please specify)
3 4 5 3 4 5 3 4 5 3 4 5 3 4 5
9) Check the blank that best represents your response
A How important is it to you to purchase food to eat at home than food with low- carb information on the label
Most important Least important
B How important is it to you to choose a restaurant that specifically advertises low- carb offerings
Most important ___ ____ ____ ____ ___Least important
MICHELOB ULTRAreg vs MICHELOBreg26 g CARBS 133 g95 CALORIES 155
$175 PRICEServing size 12 oz
$135
From above information between regular Michelob beer and low-carb Michelob beer (Michelob ultra)how would you respond to the following Check the blank that best represents bull your response
58
A I always look at carb count
Strongly Agree Strongly Disagree
B I would be concerned about ldquoCaloriesrdquo
Strongly Agree Strongly Disagree
C I donrsquot feel good about the price of the low-carb product so I wouldnrsquot buy it
Strongly Agree Strongly Disagree
D I donrsquot thinkI would like the ldquoTasterdquo of low-carb beer
Strongly Agree Strongly Disagree
E The word ldquoUltrardquo on the product makes memoreinterested in buying it
From above information between Muellerrsquos reduced-carb spaghetti and Muellerrsquos regular how would you respond to the following Check the blank that best represents your response
59
A I always look at carbCount
Strongly Agree Strongly Disagree
B I would be concerned about ldquoCaloriesrdquo
Strongly Agree Strongly Disagree
C I donrsquot feel goodabout the price of the low-carb product so I wouldnrsquot buy it
Strongly Agree Strongly Disagree
D I donrsquot think I would like the ldquoTasterdquo of the low-carb spaghetti
From above information between Tropicana lightrsquon healthy and Tropicana pure premium how would you respond to the following Check the blank that best represents your response
60
A I always look at carb count
Strongly Agree Strongly Disagree
BI would beconcernedaboutldquoCaloriesrdquo
Strongly Agree Strongly Disagree
CI would buy the low-carb product because itrsquos the
Strongly Agree Strongly Disagree
same price as the regular
DI donrsquot think I would like the ldquoTasterdquo of the
Strongly Agree Strongly Disagree
low-carb juiceE The word
ldquoLightrdquo on the product makes me more
Strongly Agree Strongly Disagree
interested to buy it
13)
KLONDIKECARBSMARTSANDWICHESreg
VS KLONDIKE BIGBEAR SANDWICHESreg
5g CARBS 28 g80 CALORIES 190
$399 PRICESferurgsx Oesrdridi
$399
From above information Between Klondike carb-smart sandwiches and Klondike big bear sandwiches how would you respond to the following Check the blank that best represents your response
61
A I always look at carb count
Strongly Agree Strongly Disagree
B I would be be concerned about ldquoCaloriesrdquo
Strongly Agree Strongly Disagree
C I would buy the low-carb product because itrsquos the same price as the regular
Strongly Agree Strongly Disagree
D I donrsquot think I would like the ldquoTasterdquo of the low-carb sandwiches
Strongly Agree Strongly Disagree
E The word ldquoCarbsmartrdquo on the product makes memoreinterested to buy them
Strongly Agree Strongly Disagree
62
14) If you were to make a decision to buy a low carbohydrate product please rate your preference for each of the following features that best represents your response
A Whether or not the ldquoTasterdquo is almost or the same as the regular product
High preference Low preference
B Preference for ldquoNutri entHealth claimrdquo on the label
High preference Low preference
C Product is made by a well-known ldquoBrandrdquo High preference Low preference
D Product package contains the word ldquoCarbrdquo
High preference Low preference
E ldquoPackagerdquo is great designed High preference Low preference
F The ldquoPricerdquo of low-carb product the same or only a bit more expensive than the regular product
High preference Low preference
15) What media do you usually use (Please check all that apply)___ Radio Station___ Television___ Newspaper___ Magazine
Internet
63
Section 2 About you
1) What is your gender__ Male
2) Which age range applies to you__ 19 years and under_ 36-45
3) What is your educational background__ High school__ Associate degree__ Graduate or professional degree
4) What is your ethnic background
Female
20-2546 years and over
CollegeBachelorrsquos degree
26-35
WhiteBlack
_ Hispanic Asian
Pacific Islander Native American Multi Racial Other
5) What is your approximately total household income_ Less than $9999 _ $ 10000-$ 14999_ $15000-$24999 _ $25000-$49999_ $50000-$74999 _ $75000-$99999__ $100000 and over
6) Do you have any medical conditions (Check all that apply)__ Diabetes__ Obesity__ I donrsquot have
Other
laquoThank You
64
REFERENCES
Addis S (2004) Think outside the low-carb box Advertising Age 75(26) 22
Alvensleben R (1997) Consumer behaviour Agro-food marketing Wallingford CAB Publishing
Astrup P Thomas M L amp Harper A(2004) Atkins and other low-carbohydrate diets Hoax or an effect tool for weight loss Lancet 364(9437) 897-899
Atkins R (1998) Dr Atkins new diet revolution (3rd ed) New York Simon amp Schuster
Atkins R (2002) Dr Atkins new diet revolution New York Avon Books
Banking Business (2004) Low-carb sales trends andconsumer attitudes Retrieved December 5 2004 from httpwwwbankingbusinesscomco_articleaspArticleID=72 022
Beirne M (2004) Confectioners unwrap low-card strategies Brandweek 45(24) 14
Bowden J (2004) Low carb diets insulin resistance and diabetes Total Health 26(2) 22-23
Cole W (2004) Is bread toast Time Magazine 163(18) 50-51
Current Events (2004) Carb-crazed Retrieved December 6 2004 from httplibproxylibcsusbedu loginurl=http search epnet com- libproxy lib csusb eduloginaspxdirect=trueampAuthType=cookieipurluidampdb=aphampan=14441487
Daniels S R (2003) Abnormal weight gain and weightmanagement are carbohydrates the enemy Journal of Pediatrics 142 225-227
65
DeNoon D (2004) Is the low-carb craze waning Retrieved December 5 2004 fromhttpcontenthealthmsncomcontentarticle90 100819htmGTl=4244
Ebenkamp B (2004) Baby you deprive my carbs Brandweek 45(11) 20-22
Food Navigator (2004) Low-carb losing its sparkle Retrieved December 5 2004 from http www f oodnavigator comnews printNewsBisaspid=53564
Foxall G R (1988) Marketing new technology markets hierarchies and user initiated innovation Managerial and Decision Economics 9 237-250
Gloede W F (2004) Diet Inc American Demographics 25(10) 32-34
Hawkins D I Roger J B amp Kenneth A C (2001) Consumer Behavior New York McGraw-Hill
Information Resources Incorporate (2003) Fifty-two weeks through mid-year 2003 Retrived March 24 2005 from httpwwwinforescompublicus contentconsumernetworkdefaulthtm
Julie S (2004) What does it mean to be low carb Retrieved December 19 2004 from httpIwwwusatodaycommoneyindustriesfood2 0 04 - 05-25-low-carb_xhtm
Kadlec D Rawe J Park A Fonda D Cole W DeQuine J Healy R Hequet M Hylton H Locke L A amp Scully S (2004) The low-carb frenzy Time Magazine 163(18) 46-53
Kotler P 6 Armstrong G (1993) Maketing An Introduction 3rd ed NY Prentice Hall
LaMar K A Groller K Marroco R Housand LMalecki J Wong S amp Tan L (2004) You asked us Prevention 56(6) 33-38
66
Opinion Dynamic Corporations (2005) Measuring thelow-carb revolution Retrieved March 25 2005 from httpwwwopiniondynamicscomlowcarbhtml
Reyes S (2004) Crowded low-carb market to face new FDA guidelines Brandweek 45(25) 44
Reyes S (2004) New Yoplait launch milks low-carb craze Brandweek 45(18) 12
Reyes S (2004) Wal-mart line may starve low-carb foes Brandweek 45(25) 6
Richard L (2004) The secret to low carb successreduced carbohydrate is the key to success New York Kensington Publishing Corp
Rotella M amp Zaleski J (2003) Low-carb from myth to reality Publishers Weekly 250(5) 71
Thompson S (2004) Carb craze hit by reality check Advertising Age 75(23) 1-2
Thompson S (2004) Food marketers grapple with carb conundrum Advertising Age 75(19) 4-5
Thompson S (2004) Low-carb craze blitzes food biz Advertising Age 75(1) 1-2
Time and Trends (2004) The wellness evolution chasing the low carb consumer Retrieved April 3 2004 from httpwwwinforescompublicusnewsEvents thoughtleadershiptt_issuel8pdf
Topkis M (2003) The lowdown on low carb Money32(13) 218-219
Tsao A (2004) Lean times for food stocks Retrieved December 5 2004 fromhttpwwwbusinessweekcombwdailydnflashmay2004 nf20040518 9901 db014htm
67
Tufts University (2003) Low-carb craze or low-carbcrazy Tufts University Health amp Nutrition Letter 21(8) 4-5
University of California Berkeley (2004) Low-carbfoods less than meets the eye Retrieved December 20 2004 from httpwwwberkeleywellnesscom htmlwl2004wlFeatured0104html
Woodruff S (2004) Finding the right foods Better Nutrition 66(1) 29-32
Woodruff S (2004) Good-cardlow-card living Better Nutrition 66(6) 37-40
Yager J (2004) Low-carbohydrate diet vs low-fat diet no differences after 1 year Eating DisordersReview 15(4) 2-3
68
Factors influencing purchasing decision process of low-carbohydrate products
Recommended Citation
regular products was more acceptable but not so for
non-dieters Another factor considered by dieters was
carb count (mean = 304) The addition of the word
Ultra would not influence the purchase either among
dieters (mean = 420) or non-dieters (mean = 419)
Table 13 Mean Scores of Product Factors of Low
Carbohydrate Beer
spaghetti Calories was the first consideration among
dieters However non-dieters considered taste
(mean = 156) and price (mean = 154) first
Non-dieters were not satisfied with the price difference
between the regular ($099) and the low-carb versions
($199) In turn dieters accepted a higher price
however they were not always likely to buy the
higher-priced product (mean = 254) Carb count was
always a consideration of dieters (mean = 288) but low
consideration was given to the word carb added
(mean = 443) Non-dieters were not very concerned with
carb count (mean = 389) and they strongly disagreed
that the word carb added was important to them
(mean = 451)
If the price of both the regular and
low-carbohydrate juice were the same both dieters and
non-dieters would choose the latter Even though the
taste may not be as good non-dieters would be willing
to try the- low-carb versions (mean = 172) However
calories was still important to dieters (mean = 192)
(Table 15)
The addition of the word light had some impact on
dieters (mean = 302) but less for non-dieters
(mean = 408) (see Table 15)
Low-carbohydrate sandwiches that were priced the
same as regular sandwiches were of interest to dieters
and non-dieters (mean = 257) Even though non-dieters
thought that they would not like the taste as much
(mean = 158) they would be interested in trying
low-carbohydrate products Dieters still agreed strongly
in the importance of Calories (mean = 179) in choosing
a product Both dieters (mean = 429) and non-dieters
(mean = 448) alike disliked the addition of the word
carbsmart (see Table 16)
Table 19 showed the importance of low-carb labeling
to consumers in each age range The majority (538) of
people 46 years and above thought that it was important
Of respondents who had medical conditions such as
diabetes (Table 20) over half (522) of those were
mostly concerned about low-carb information on the label
and approximately 35 of them thought that low-carb
labeling was important (see Table 20)
Many of respondents who were obese (40) felt
neutral about choosing a product with low-carb labeling
However up to 33 of them thought that it was important
to have low-carb labeling when buying food to eat at home
(Table 21)
Tables 22 and 23 showed that the majority (696) of
diabetic respondents were age 46 years and over (see
Table 22) Also the majority (60) of those who
considered themselves obese were age 46 years and over
(see Table 23)
those 46 and over used the internet for research (see
Table 28)
organic foods to quick meals will always compete for
neutral (mean = 263 and 267 respectively) regarding the
terms NutrientHealth claims and Well-known Brand
Great design of the package (mean = 362) did not have
an impact on purchase Further respondents had very low
preference forL use of Carb on packaging (mean = 437)
(see Table 7)
28
Table 7 Summary of Preference with Low Carbohydrate
Products
N MeanStd
DeviationTaste is almost or the same as regular products 231 161 915NutrientHealth claim is shown on the label 231 2 63 1315Brand is well-known 231 267 1069The word Carb is added on the package 231 437 1030Package is interestingattractive 231 362 979Price is not much more expensive than regular products
231 193 1029
Valid N (listwise) 231
Objective 2
One reason that low-fat was placed on the market
was to appeal to weight-conscious consumers This was
also true for low-carb products Table 8 showed that a
low-fat diet was a strong motive (mean = 176) for
dieters and almost as a strong (mean = 227) by
non-dieters Overall more respondents agreed that a
low-fat diet was more effective than a low-carb diet in
losing weight
29
Table 8 Mean Scores of Agreement of Diet Products
Are you a dieter
Please indicate how much you would agree
if you want to lose weight with Low Fat Diets
Please indicate how much you would agree
if you want to lose weight with Low Carb Diets
Yes Mean 179 267N 109 109Std Deviation 891 1291
No Mean 227 331N 122 122Std Deviation 1114 1143
Total Mean 203 301N 231 231Std Deviation 1044 1255
Aside from helping to control weight low-carb diets
were advertised as conducive to healthy lifestyle
(Rotella amp Zaleski 2003) However Table 9 showed that
758 of respondents who had never tried a
low-carbohydrate diet did not agree that it was good for
individuals health and 417 of respondents who had
tried low carbohydrates did not think the diet
contributed to good health Nevertheless respondents who
had already tried low-carb products were more likely to
purchase a low-carb product than were those who had not
30
Table 9 Crosstabulation of Respondents Agreement with
Low Carbohydrate Products
Do you think that low carb diets are good for your health
TotalYes NoHave you Yes Counttried a wj_thin Have
77 55 132
low carb you tried a lowproduct carb produqfc
583 417 1000
No Count within Have
24 75 99
you tried a low carb product
242 758 1000
Total Count within Have you tried a low carb product
101
437
130
563
231
1000
Interestingly 50 of respondents who were on a diet
also disagreed with the statement that low-carb diets
were good for health (see Table 10)
31
Table 10 Low Carbohydrate Agreement among Dieters
Do you think that low carb diets are
good for your health
TotalYes NoAre you a Yes Count 60 49 109dieter within Are
a dieteryou 550 450 1000
No Count 41 81 122 within Are a dieter
you 336 664 1000Total Count 101 130 231
within Are a dieter
you 437 563 1000
Table 11 identifies the catalysts that make people
want to try low-carbohydrate diets The majority of
respondents both dieters and not believed the medical
professionals opinion of low-carb products Overall
most respondents (494) would be convinced to try or
purchase low-carb products upon the recommendation of
medical professionals Nutrientlow-carb claims and
advertising (208 and 199 respectively) were the next
two catalysts that affected respondents concerning
health Other catalysts included friends families and
themselves (74) Of those who believed in the advice of
medical professionals 477 were dieters while 508
were non-dieters The next two catalysts among dieters
32
were advertising and nutrientlow-carb claims (22 and
193 respectively) The second catalyst among
non-dieters was nutrientlow-carb claims (221) followed
by advertising (18)
Table 11 Summary of Catalysts Motivating Respondents
What would be the most common catalyst that makes you try low carb products
TotalMedical
ProfessionalsStore
Environment
Nutrient Low Carb Claims Adveritsing Other
Are you Yes Count a dieter within
52 5 21 24 7 109
Are you a dieter
477 239 468 174 55 1000
No Count 62 1 27 22 10 122 within Are you a dieter
508 8 221 180 82 1000
Total Count 114 6 48 46 17 231 withinAre you a dieter
494 26 208 199 74 1000
Objective 3According to respondents concerns for low-carb
messages on either the product label or on a restaurant
advertisement Table 12 showed that dieters (mean = 294)
had more concern than non-dieters (mean = 393) for
low-carbohydrate information on the label However the
degree of concern for low-carb offerings by restaurants
33
by both groups was only moderate to less important Both
dieters and non-dieters agreed less on the offerings
(mean = 393 and 427 respectively)
Table 12 Importance of Low-Carb Product
LabelingOfferings to Respondents
Are you a dieter
How important is it to you in purchasing food to eat at home that the food has low carb information
on the label
How important is it to you in choosing a
restaurant specifically advertises low carb
offeringsYes Mean 294 393
N 109 109Std Deviation 1442 1152
No Mean 378 427N 122 122Std Deviation 1237 1045
Total Mean 338 411N 231 231Std Deviation 1399 1108
The next four tables reflect respondents opinions
regarding four different low-carbohydrate products
price taste calories carb count and carb labeling
Low-carbohydrate beer Michelob Ultra is offered in
the market survey (Table 13) To dieters calories
(mean = 182) were of concern however to non-dieters
taste (mean = 169) was their primary consideration To
dieters paying a bit more for the low carbs than the
34
regular products was more acceptable but not so for
non-dieters Another factor considered by dieters was
carb count (mean = 304) The addition of the word
Ultra would not influence the purchase either among
dieters (mean = 420) or non-dieters (mean = 419)
Table 13 Mean Scores of Product Factors of Low
Carbohydrate Beer
Are you a dieter
Between regular Michelob beer and low-carb Michelob beerI always look for Carb Count
diet products and to identify the factors that influenced
their decision to purchase low-carbohydrate food Because
of epidemic of obesity and diabetes among Americans
low-fat foods contribute to good health and weight
control (UC Berkeley Wellness Letter 2004) However
obesity and diabetes rates remain high (Daniels 2003)
As a result people on low carbohydrates experience
weight loss lowered triglycerides and lower cholesterol
(Bowden 2004) Today the focus is on carbohydrate
reduction (Woodruff2004)This practice emphasized the
fact that the suppliers and manufacturers of low-carb
food markets should understand the demands of their
consumers when it comes to low-carbohydrate foods Today
50
carb is widely used in product packaging to capture
market sales (Addis 2004) However brand taste and
price attributes are still important to consumers
(Beirne 2004) Therefore it is necessary for food
marketers to understand and meet the demand for
low-carbohydrate products given these criteria
Results showed that females seemed to be more
concerned about their food consumption than males are
Most of the dieters were 46 years old and over with
incomes ranging from $50000 - $74999 Moreover people
with medical conditions such as diabetes tended to pay
more attention to low-carb information Most respondents
consumed diet products between two and four times per
week
Weight loss was the primary factor in respondents
consumption of diet products However low-fat diets were
still thought to be more effective than low-carb diets in
weight reduction This finding confirms ODCs (2005)
conclusion that consumers are more concerned with fat
content than with any other nutritional claim Still
fewer than 50 of respondents agreed that low-carb diets
were good for health
51
In general low-carbohydrate information on both the
label and on restaurant menus was important for dieters
but not for non-dieters Most respondents preferred
low-carbohydrate products that tasted as much like the
original as possible This finding is consistent with
that of the IRIs Consumer Network (2001) that determined
that taste was a key factor in food and beverage
selection Brand recognition was expected most from
non-dieters However for dieters Brand was less
important than low-carb claims which refers not only
to carb count but also to calories something that
was very important to most dieters Topkis (2003) found
that many low-carb products were often more expensive
than the original or than other products in the same
category The findings consistently indicated that
low-price or equal price of low-carb products had an
impact on purchases -especially among non-dieters who
were interested in trying something different but not in
paying more-
Although Addis (2004) expected that trademarks
combined with the word carb would sell more results
indicated that the word carb on the package had the
least importance in influencing respondents purchasing
52
decision Most respondents placed little credence in the
word carb however the word light had more of an
impact
Implications of the findings suggest that medical
care centers would be the best place to provide
low-carbohydrate products for people who have a medical
condition For other people supermarkets might be the
best place to offer low-carbohydrate foods Restaurant
menus present the occasional opportunity to dine on
low-carbohydrate products However websites would not be
a good place to market low-carbohydrate products because
people rarely buy diet products online
It is also recommended that low-carb advertisements
appear in newspapers because people age 46 years and over
spend the most time reading the newspaper
Also radio stations which most people listen to
regularly should have low-carb advertisements Magazines
should focus only on people age 20 to 35 Since medical
professionals have a great influence upon purchases they
might want to try low-carbohydrate products Their
recommendation can help promote the sale of low-carb
diets
53
Results indicated that most respondents had more
confidence in low-fat foods than in low-carbohydrate
foods Consequently a further recommendation is for diet
products to focus on being low-fat rather than the
low-carb particularly in package labeling This claim
is supported by the findings that lower fat is better
than fewer carbs for weight loss low fat promotes better
health than fewer carbs and buyers would be more
attracted to low-fat products than to products that were
labeled as low-carb
In terms of product labeling low-fat appeared to be
the most significant influence upon weight-conscious
respondents Consequently low-fat labeling should be
emphasized more than low-carb as well as in
advertisements Having words that consumers can easily
see while making a purchase can aid in a
salesfactoryexperience Further manufacturers should
research and produce tasty but reasonably-priced low-fat
and low-carb products to drive sales
However low-carbohydrate diets were still needed
among diabetic respondents (Table 20) Therefore the
niche market of low-carb products should focus on
diabetics
54
While most diabetics cited low carbohydrates as
their primary reason to stay healthy and control weight
weight watchers trusted low-fat diets more so than
low-carb ones Medical professionals should be encouraged
to endorse the health benefits of reducing carbohydrate
intake for good health
55
APPENDIX
QUESTIONNAIRE
56
Public Opinion Survey
The purpose of this survey is to learn peoplesrsquo preferences and opinions toward low carbohydrate carbohydrate-controlled products Please take 7-10 minutes to complete the questionnaire There is no right or wrong answer Your responses will be kept confidential Thank you very much for your help in this research effort
Please nut an X on the blank that best describes your opinion
Section 1
1) Are you a dieter__ Yes __ No (Go to Question No4)
2) Why are you on diet (Check all that apply)__ Good Health ___Weight loss ___Other_______
3) How often do you eat diet products__ more than 5 times a week __ 2 to 4 times a week__ Once a week __ Never__ Other______
4) Please indicate how much you would agree (if you wanted to lose weight) with each of the following by checking the blank that best represents your response
6) Do you think that low-carb diets are good for your health__ Yes __ No
7) What would be the most common catalyst that would make you try a low-carb product
__ Medical professionals __ Store environment__ NutrientLow Carb Claims ___Advertising (eg TV magazine)__ Other_______
57
8) Please indicate how often you would buyeat diet products from each of following place by circling the number that best represents your response
1- Very Often 2- Often 3- Occasionally 4- Almost Never 5- Never
A Restaurants 1 2B Supermarkets 1 2C Medical Care Centers 1 2D Websites 1 2E Others 1 2
(Please specify)
3 4 5 3 4 5 3 4 5 3 4 5 3 4 5
9) Check the blank that best represents your response
A How important is it to you to purchase food to eat at home than food with low- carb information on the label
Most important Least important
B How important is it to you to choose a restaurant that specifically advertises low- carb offerings
Most important ___ ____ ____ ____ ___Least important
MICHELOB ULTRAreg vs MICHELOBreg26 g CARBS 133 g95 CALORIES 155
$175 PRICEServing size 12 oz
$135
From above information between regular Michelob beer and low-carb Michelob beer (Michelob ultra)how would you respond to the following Check the blank that best represents bull your response
58
A I always look at carb count
Strongly Agree Strongly Disagree
B I would be concerned about ldquoCaloriesrdquo
Strongly Agree Strongly Disagree
C I donrsquot feel good about the price of the low-carb product so I wouldnrsquot buy it
Strongly Agree Strongly Disagree
D I donrsquot thinkI would like the ldquoTasterdquo of low-carb beer
Strongly Agree Strongly Disagree
E The word ldquoUltrardquo on the product makes memoreinterested in buying it
From above information between Muellerrsquos reduced-carb spaghetti and Muellerrsquos regular how would you respond to the following Check the blank that best represents your response
59
A I always look at carbCount
Strongly Agree Strongly Disagree
B I would be concerned about ldquoCaloriesrdquo
Strongly Agree Strongly Disagree
C I donrsquot feel goodabout the price of the low-carb product so I wouldnrsquot buy it
Strongly Agree Strongly Disagree
D I donrsquot think I would like the ldquoTasterdquo of the low-carb spaghetti
From above information between Tropicana lightrsquon healthy and Tropicana pure premium how would you respond to the following Check the blank that best represents your response
60
A I always look at carb count
Strongly Agree Strongly Disagree
BI would beconcernedaboutldquoCaloriesrdquo
Strongly Agree Strongly Disagree
CI would buy the low-carb product because itrsquos the
Strongly Agree Strongly Disagree
same price as the regular
DI donrsquot think I would like the ldquoTasterdquo of the
Strongly Agree Strongly Disagree
low-carb juiceE The word
ldquoLightrdquo on the product makes me more
Strongly Agree Strongly Disagree
interested to buy it
13)
KLONDIKECARBSMARTSANDWICHESreg
VS KLONDIKE BIGBEAR SANDWICHESreg
5g CARBS 28 g80 CALORIES 190
$399 PRICESferurgsx Oesrdridi
$399
From above information Between Klondike carb-smart sandwiches and Klondike big bear sandwiches how would you respond to the following Check the blank that best represents your response
61
A I always look at carb count
Strongly Agree Strongly Disagree
B I would be be concerned about ldquoCaloriesrdquo
Strongly Agree Strongly Disagree
C I would buy the low-carb product because itrsquos the same price as the regular
Strongly Agree Strongly Disagree
D I donrsquot think I would like the ldquoTasterdquo of the low-carb sandwiches
Strongly Agree Strongly Disagree
E The word ldquoCarbsmartrdquo on the product makes memoreinterested to buy them
Strongly Agree Strongly Disagree
62
14) If you were to make a decision to buy a low carbohydrate product please rate your preference for each of the following features that best represents your response
A Whether or not the ldquoTasterdquo is almost or the same as the regular product
High preference Low preference
B Preference for ldquoNutri entHealth claimrdquo on the label
High preference Low preference
C Product is made by a well-known ldquoBrandrdquo High preference Low preference
D Product package contains the word ldquoCarbrdquo
High preference Low preference
E ldquoPackagerdquo is great designed High preference Low preference
F The ldquoPricerdquo of low-carb product the same or only a bit more expensive than the regular product
High preference Low preference
15) What media do you usually use (Please check all that apply)___ Radio Station___ Television___ Newspaper___ Magazine
Internet
63
Section 2 About you
1) What is your gender__ Male
2) Which age range applies to you__ 19 years and under_ 36-45
3) What is your educational background__ High school__ Associate degree__ Graduate or professional degree
4) What is your ethnic background
Female
20-2546 years and over
CollegeBachelorrsquos degree
26-35
WhiteBlack
_ Hispanic Asian
Pacific Islander Native American Multi Racial Other
5) What is your approximately total household income_ Less than $9999 _ $ 10000-$ 14999_ $15000-$24999 _ $25000-$49999_ $50000-$74999 _ $75000-$99999__ $100000 and over
6) Do you have any medical conditions (Check all that apply)__ Diabetes__ Obesity__ I donrsquot have
Other
laquoThank You
64
REFERENCES
Addis S (2004) Think outside the low-carb box Advertising Age 75(26) 22
Alvensleben R (1997) Consumer behaviour Agro-food marketing Wallingford CAB Publishing
Astrup P Thomas M L amp Harper A(2004) Atkins and other low-carbohydrate diets Hoax or an effect tool for weight loss Lancet 364(9437) 897-899
Atkins R (1998) Dr Atkins new diet revolution (3rd ed) New York Simon amp Schuster
Atkins R (2002) Dr Atkins new diet revolution New York Avon Books
Banking Business (2004) Low-carb sales trends andconsumer attitudes Retrieved December 5 2004 from httpwwwbankingbusinesscomco_articleaspArticleID=72 022
Beirne M (2004) Confectioners unwrap low-card strategies Brandweek 45(24) 14
Bowden J (2004) Low carb diets insulin resistance and diabetes Total Health 26(2) 22-23
Cole W (2004) Is bread toast Time Magazine 163(18) 50-51
Current Events (2004) Carb-crazed Retrieved December 6 2004 from httplibproxylibcsusbedu loginurl=http search epnet com- libproxy lib csusb eduloginaspxdirect=trueampAuthType=cookieipurluidampdb=aphampan=14441487
Daniels S R (2003) Abnormal weight gain and weightmanagement are carbohydrates the enemy Journal of Pediatrics 142 225-227
65
DeNoon D (2004) Is the low-carb craze waning Retrieved December 5 2004 fromhttpcontenthealthmsncomcontentarticle90 100819htmGTl=4244
Ebenkamp B (2004) Baby you deprive my carbs Brandweek 45(11) 20-22
Food Navigator (2004) Low-carb losing its sparkle Retrieved December 5 2004 from http www f oodnavigator comnews printNewsBisaspid=53564
Foxall G R (1988) Marketing new technology markets hierarchies and user initiated innovation Managerial and Decision Economics 9 237-250
Gloede W F (2004) Diet Inc American Demographics 25(10) 32-34
Hawkins D I Roger J B amp Kenneth A C (2001) Consumer Behavior New York McGraw-Hill
Information Resources Incorporate (2003) Fifty-two weeks through mid-year 2003 Retrived March 24 2005 from httpwwwinforescompublicus contentconsumernetworkdefaulthtm
Julie S (2004) What does it mean to be low carb Retrieved December 19 2004 from httpIwwwusatodaycommoneyindustriesfood2 0 04 - 05-25-low-carb_xhtm
Kadlec D Rawe J Park A Fonda D Cole W DeQuine J Healy R Hequet M Hylton H Locke L A amp Scully S (2004) The low-carb frenzy Time Magazine 163(18) 46-53
Kotler P 6 Armstrong G (1993) Maketing An Introduction 3rd ed NY Prentice Hall
LaMar K A Groller K Marroco R Housand LMalecki J Wong S amp Tan L (2004) You asked us Prevention 56(6) 33-38
66
Opinion Dynamic Corporations (2005) Measuring thelow-carb revolution Retrieved March 25 2005 from httpwwwopiniondynamicscomlowcarbhtml
Reyes S (2004) Crowded low-carb market to face new FDA guidelines Brandweek 45(25) 44
Reyes S (2004) New Yoplait launch milks low-carb craze Brandweek 45(18) 12
Reyes S (2004) Wal-mart line may starve low-carb foes Brandweek 45(25) 6
Richard L (2004) The secret to low carb successreduced carbohydrate is the key to success New York Kensington Publishing Corp
Rotella M amp Zaleski J (2003) Low-carb from myth to reality Publishers Weekly 250(5) 71
Thompson S (2004) Carb craze hit by reality check Advertising Age 75(23) 1-2
Thompson S (2004) Food marketers grapple with carb conundrum Advertising Age 75(19) 4-5
Thompson S (2004) Low-carb craze blitzes food biz Advertising Age 75(1) 1-2
Time and Trends (2004) The wellness evolution chasing the low carb consumer Retrieved April 3 2004 from httpwwwinforescompublicusnewsEvents thoughtleadershiptt_issuel8pdf
Topkis M (2003) The lowdown on low carb Money32(13) 218-219
Tsao A (2004) Lean times for food stocks Retrieved December 5 2004 fromhttpwwwbusinessweekcombwdailydnflashmay2004 nf20040518 9901 db014htm
67
Tufts University (2003) Low-carb craze or low-carbcrazy Tufts University Health amp Nutrition Letter 21(8) 4-5
University of California Berkeley (2004) Low-carbfoods less than meets the eye Retrieved December 20 2004 from httpwwwberkeleywellnesscom htmlwl2004wlFeatured0104html
Woodruff S (2004) Finding the right foods Better Nutrition 66(1) 29-32
Woodruff S (2004) Good-cardlow-card living Better Nutrition 66(6) 37-40
Yager J (2004) Low-carbohydrate diet vs low-fat diet no differences after 1 year Eating DisordersReview 15(4) 2-3
68
Factors influencing purchasing decision process of low-carbohydrate products
Recommended Citation
regular products was more acceptable but not so for
non-dieters Another factor considered by dieters was
carb count (mean = 304) The addition of the word
Ultra would not influence the purchase either among
dieters (mean = 420) or non-dieters (mean = 419)
Table 13 Mean Scores of Product Factors of Low
Carbohydrate Beer
spaghetti Calories was the first consideration among
dieters However non-dieters considered taste
(mean = 156) and price (mean = 154) first
Non-dieters were not satisfied with the price difference
between the regular ($099) and the low-carb versions
($199) In turn dieters accepted a higher price
however they were not always likely to buy the
higher-priced product (mean = 254) Carb count was
always a consideration of dieters (mean = 288) but low
consideration was given to the word carb added
(mean = 443) Non-dieters were not very concerned with
carb count (mean = 389) and they strongly disagreed
that the word carb added was important to them
(mean = 451)
If the price of both the regular and
low-carbohydrate juice were the same both dieters and
non-dieters would choose the latter Even though the
taste may not be as good non-dieters would be willing
to try the- low-carb versions (mean = 172) However
calories was still important to dieters (mean = 192)
(Table 15)
The addition of the word light had some impact on
dieters (mean = 302) but less for non-dieters
(mean = 408) (see Table 15)
Low-carbohydrate sandwiches that were priced the
same as regular sandwiches were of interest to dieters
and non-dieters (mean = 257) Even though non-dieters
thought that they would not like the taste as much
(mean = 158) they would be interested in trying
low-carbohydrate products Dieters still agreed strongly
in the importance of Calories (mean = 179) in choosing
a product Both dieters (mean = 429) and non-dieters
(mean = 448) alike disliked the addition of the word
carbsmart (see Table 16)
Table 19 showed the importance of low-carb labeling
to consumers in each age range The majority (538) of
people 46 years and above thought that it was important
Of respondents who had medical conditions such as
diabetes (Table 20) over half (522) of those were
mostly concerned about low-carb information on the label
and approximately 35 of them thought that low-carb
labeling was important (see Table 20)
Many of respondents who were obese (40) felt
neutral about choosing a product with low-carb labeling
However up to 33 of them thought that it was important
to have low-carb labeling when buying food to eat at home
(Table 21)
Tables 22 and 23 showed that the majority (696) of
diabetic respondents were age 46 years and over (see
Table 22) Also the majority (60) of those who
considered themselves obese were age 46 years and over
(see Table 23)
those 46 and over used the internet for research (see
Table 28)
The literature shows that living healthy is the top
concern of people and that a low-carbohydrate diet is
especially popular among consumers age 55 years and
older Manufacturers and retailers of low-carbohydrate
products have to study analyze and plan all the details
of the low-carb consumer behaviors because so many
factors influence their purchase decision
The taste of low-carbohydrate products plays a
major role in purchase decision and can compete with
brand because people believe in brand but they also
love good taste so they can compete In addition
price is a critical factor in making a purchase
18
CHAPTER THREE
METHODOLOGY
Population and SampleThe sample was chosen among students enrolled in a
Southwestern University and those living in a
Southwestern city Shoppers exiting a local supermarket
and students at the local university were selected at
random Children and pregnant women were not included in
this study
InstrumentsA self-administered questionnaire was developed to
ascertain the objectives set fourth To determine
attitudes toward low-carbohydrate diets among the sample
questions included whether they had tried a low-carb
product and whether they thought low-carb diets were good
for health They were also asked how they learned about
low-carb products (the choices were from literature
reviewed) Statements were measured via Yes-or-No and
multiple-choice responses Moreover the researcher used
the instrument developed by Opinion Dynamic Corporation
(ODC) (httpwwwopiniondynamicscomlowcarbhtml 2004)
19
to measure how much consumers believed they would lose
weight by following a low-fat or a low-carb diet The
instrument was measured on a five point Likert scale
ranging from strongly agree (1) to strongly disagree (5)
To determine that the attributes that influence the
purchase of low-carbohydrate products statements were
taken from the ODC (2004) Statements were measured via
modified five point Likert scaled ranging from high
preference (1) to low preference (5) and included
low-carb labeling in addition to factors used by
Alvensleben (1997) that included price taste calories
and carb count In order to determine the most important
attributes respondents were asked to consider their
decision process for samples of four low-carbohydrate
products Michelob Ultra Muellers Reduced-Carb
Spaghetti Tropicana Light Healthy and Klondike
Carbsmart Sandwiches This instrument previously used by
Rawe (2004) used a Likert scale ranging from strongly
agree (1) to strongly disagree (5) and asked respondents
to evaluate the brands price taste calories and carb
count -
20
To determine the extent of low-carbohydrate
purchases among consumers respondents were asked to
describe their low-carb buying experiences and preference
choices when purchasing such products over a selected
period The first three questions established if they
were dieters why they were on a diet and how often they
consumed or purchased diet products The questions were
measured using a Yes-or-No response
To determine the media mix and ultimately
marketing strategies to promote low-carbohydrate foods
among manufacturers respondents were asked where they
turned for information The five media were radio
television newspapers magazines and the internet Also
respondents were asked about how often they would buy
diet products from restaurants websites and
supermarkets Questions were measured using a modified
Likert scaled ranging from very often (1) to never (5)
To determine the demographic and psychographic
characteristics of consumers items mentioned in the
literature reviewed included income education and
ethnicity
21
Data Analysis Procedures
After collecting the data the data were put into
the Statistical Program of Social Science (SPSS)
Frequencies means and cross tabulations were compiled
to complete the data analysis
22
CHAPTER FOUR
RESULTS AND DISCUSSION
Introduction
The data were analyzed using the Statistical Package
for Social Sciences (SPSS)
Demographics of RespondentsTwo hundred and thirty-one of the 250 respondents
(92) returned the completed survey The demographic
characteristics of respondents are given in Table 1 Of
the respondents 593 were female and the majority
(429) ranged from 26 to 35 years of age Further
approximately 41 of the respondents had some college
education Most respondents were White (316) and 251
were Asian Moreover the majority (234) of respondents
reported a household income from $25000 to $49999 and
831 did not have a medical condition Only 39 of
respondents (169) reported suffering from diabetes and
obesity Eleven of the respondents had diabetes and nine
classified themselves as obese (see Table 1)
23
Table 1 Demographic Characteristics of the Respondents
N = 231VariableGender
Male 94 407Female 137 593
Age19 years and under 5 22 bull20-25 83 35926-35 99 42936-45 18 7846 years and over 26 113
neutral (mean = 263 and 267 respectively) regarding the
terms NutrientHealth claims and Well-known Brand
Great design of the package (mean = 362) did not have
an impact on purchase Further respondents had very low
preference forL use of Carb on packaging (mean = 437)
(see Table 7)
28
Table 7 Summary of Preference with Low Carbohydrate
Products
N MeanStd
DeviationTaste is almost or the same as regular products 231 161 915NutrientHealth claim is shown on the label 231 2 63 1315Brand is well-known 231 267 1069The word Carb is added on the package 231 437 1030Package is interestingattractive 231 362 979Price is not much more expensive than regular products
231 193 1029
Valid N (listwise) 231
Objective 2
One reason that low-fat was placed on the market
was to appeal to weight-conscious consumers This was
also true for low-carb products Table 8 showed that a
low-fat diet was a strong motive (mean = 176) for
dieters and almost as a strong (mean = 227) by
non-dieters Overall more respondents agreed that a
low-fat diet was more effective than a low-carb diet in
losing weight
29
Table 8 Mean Scores of Agreement of Diet Products
Are you a dieter
Please indicate how much you would agree
if you want to lose weight with Low Fat Diets
Please indicate how much you would agree
if you want to lose weight with Low Carb Diets
Yes Mean 179 267N 109 109Std Deviation 891 1291
No Mean 227 331N 122 122Std Deviation 1114 1143
Total Mean 203 301N 231 231Std Deviation 1044 1255
Aside from helping to control weight low-carb diets
were advertised as conducive to healthy lifestyle
(Rotella amp Zaleski 2003) However Table 9 showed that
758 of respondents who had never tried a
low-carbohydrate diet did not agree that it was good for
individuals health and 417 of respondents who had
tried low carbohydrates did not think the diet
contributed to good health Nevertheless respondents who
had already tried low-carb products were more likely to
purchase a low-carb product than were those who had not
30
Table 9 Crosstabulation of Respondents Agreement with
Low Carbohydrate Products
Do you think that low carb diets are good for your health
TotalYes NoHave you Yes Counttried a wj_thin Have
77 55 132
low carb you tried a lowproduct carb produqfc
583 417 1000
No Count within Have
24 75 99
you tried a low carb product
242 758 1000
Total Count within Have you tried a low carb product
101
437
130
563
231
1000
Interestingly 50 of respondents who were on a diet
also disagreed with the statement that low-carb diets
were good for health (see Table 10)
31
Table 10 Low Carbohydrate Agreement among Dieters
Do you think that low carb diets are
good for your health
TotalYes NoAre you a Yes Count 60 49 109dieter within Are
a dieteryou 550 450 1000
No Count 41 81 122 within Are a dieter
you 336 664 1000Total Count 101 130 231
within Are a dieter
you 437 563 1000
Table 11 identifies the catalysts that make people
want to try low-carbohydrate diets The majority of
respondents both dieters and not believed the medical
professionals opinion of low-carb products Overall
most respondents (494) would be convinced to try or
purchase low-carb products upon the recommendation of
medical professionals Nutrientlow-carb claims and
advertising (208 and 199 respectively) were the next
two catalysts that affected respondents concerning
health Other catalysts included friends families and
themselves (74) Of those who believed in the advice of
medical professionals 477 were dieters while 508
were non-dieters The next two catalysts among dieters
32
were advertising and nutrientlow-carb claims (22 and
193 respectively) The second catalyst among
non-dieters was nutrientlow-carb claims (221) followed
by advertising (18)
Table 11 Summary of Catalysts Motivating Respondents
What would be the most common catalyst that makes you try low carb products
TotalMedical
ProfessionalsStore
Environment
Nutrient Low Carb Claims Adveritsing Other
Are you Yes Count a dieter within
52 5 21 24 7 109
Are you a dieter
477 239 468 174 55 1000
No Count 62 1 27 22 10 122 within Are you a dieter
508 8 221 180 82 1000
Total Count 114 6 48 46 17 231 withinAre you a dieter
494 26 208 199 74 1000
Objective 3According to respondents concerns for low-carb
messages on either the product label or on a restaurant
advertisement Table 12 showed that dieters (mean = 294)
had more concern than non-dieters (mean = 393) for
low-carbohydrate information on the label However the
degree of concern for low-carb offerings by restaurants
33
by both groups was only moderate to less important Both
dieters and non-dieters agreed less on the offerings
(mean = 393 and 427 respectively)
Table 12 Importance of Low-Carb Product
LabelingOfferings to Respondents
Are you a dieter
How important is it to you in purchasing food to eat at home that the food has low carb information
on the label
How important is it to you in choosing a
restaurant specifically advertises low carb
offeringsYes Mean 294 393
N 109 109Std Deviation 1442 1152
No Mean 378 427N 122 122Std Deviation 1237 1045
Total Mean 338 411N 231 231Std Deviation 1399 1108
The next four tables reflect respondents opinions
regarding four different low-carbohydrate products
price taste calories carb count and carb labeling
Low-carbohydrate beer Michelob Ultra is offered in
the market survey (Table 13) To dieters calories
(mean = 182) were of concern however to non-dieters
taste (mean = 169) was their primary consideration To
dieters paying a bit more for the low carbs than the
34
regular products was more acceptable but not so for
non-dieters Another factor considered by dieters was
carb count (mean = 304) The addition of the word
Ultra would not influence the purchase either among
dieters (mean = 420) or non-dieters (mean = 419)
Table 13 Mean Scores of Product Factors of Low
Carbohydrate Beer
Are you a dieter
Between regular Michelob beer and low-carb Michelob beerI always look for Carb Count
diet products and to identify the factors that influenced
their decision to purchase low-carbohydrate food Because
of epidemic of obesity and diabetes among Americans
low-fat foods contribute to good health and weight
control (UC Berkeley Wellness Letter 2004) However
obesity and diabetes rates remain high (Daniels 2003)
As a result people on low carbohydrates experience
weight loss lowered triglycerides and lower cholesterol
(Bowden 2004) Today the focus is on carbohydrate
reduction (Woodruff2004)This practice emphasized the
fact that the suppliers and manufacturers of low-carb
food markets should understand the demands of their
consumers when it comes to low-carbohydrate foods Today
50
carb is widely used in product packaging to capture
market sales (Addis 2004) However brand taste and
price attributes are still important to consumers
(Beirne 2004) Therefore it is necessary for food
marketers to understand and meet the demand for
low-carbohydrate products given these criteria
Results showed that females seemed to be more
concerned about their food consumption than males are
Most of the dieters were 46 years old and over with
incomes ranging from $50000 - $74999 Moreover people
with medical conditions such as diabetes tended to pay
more attention to low-carb information Most respondents
consumed diet products between two and four times per
week
Weight loss was the primary factor in respondents
consumption of diet products However low-fat diets were
still thought to be more effective than low-carb diets in
weight reduction This finding confirms ODCs (2005)
conclusion that consumers are more concerned with fat
content than with any other nutritional claim Still
fewer than 50 of respondents agreed that low-carb diets
were good for health
51
In general low-carbohydrate information on both the
label and on restaurant menus was important for dieters
but not for non-dieters Most respondents preferred
low-carbohydrate products that tasted as much like the
original as possible This finding is consistent with
that of the IRIs Consumer Network (2001) that determined
that taste was a key factor in food and beverage
selection Brand recognition was expected most from
non-dieters However for dieters Brand was less
important than low-carb claims which refers not only
to carb count but also to calories something that
was very important to most dieters Topkis (2003) found
that many low-carb products were often more expensive
than the original or than other products in the same
category The findings consistently indicated that
low-price or equal price of low-carb products had an
impact on purchases -especially among non-dieters who
were interested in trying something different but not in
paying more-
Although Addis (2004) expected that trademarks
combined with the word carb would sell more results
indicated that the word carb on the package had the
least importance in influencing respondents purchasing
52
decision Most respondents placed little credence in the
word carb however the word light had more of an
impact
Implications of the findings suggest that medical
care centers would be the best place to provide
low-carbohydrate products for people who have a medical
condition For other people supermarkets might be the
best place to offer low-carbohydrate foods Restaurant
menus present the occasional opportunity to dine on
low-carbohydrate products However websites would not be
a good place to market low-carbohydrate products because
people rarely buy diet products online
It is also recommended that low-carb advertisements
appear in newspapers because people age 46 years and over
spend the most time reading the newspaper
Also radio stations which most people listen to
regularly should have low-carb advertisements Magazines
should focus only on people age 20 to 35 Since medical
professionals have a great influence upon purchases they
might want to try low-carbohydrate products Their
recommendation can help promote the sale of low-carb
diets
53
Results indicated that most respondents had more
confidence in low-fat foods than in low-carbohydrate
foods Consequently a further recommendation is for diet
products to focus on being low-fat rather than the
low-carb particularly in package labeling This claim
is supported by the findings that lower fat is better
than fewer carbs for weight loss low fat promotes better
health than fewer carbs and buyers would be more
attracted to low-fat products than to products that were
labeled as low-carb
In terms of product labeling low-fat appeared to be
the most significant influence upon weight-conscious
respondents Consequently low-fat labeling should be
emphasized more than low-carb as well as in
advertisements Having words that consumers can easily
see while making a purchase can aid in a
salesfactoryexperience Further manufacturers should
research and produce tasty but reasonably-priced low-fat
and low-carb products to drive sales
However low-carbohydrate diets were still needed
among diabetic respondents (Table 20) Therefore the
niche market of low-carb products should focus on
diabetics
54
While most diabetics cited low carbohydrates as
their primary reason to stay healthy and control weight
weight watchers trusted low-fat diets more so than
low-carb ones Medical professionals should be encouraged
to endorse the health benefits of reducing carbohydrate
intake for good health
55
APPENDIX
QUESTIONNAIRE
56
Public Opinion Survey
The purpose of this survey is to learn peoplesrsquo preferences and opinions toward low carbohydrate carbohydrate-controlled products Please take 7-10 minutes to complete the questionnaire There is no right or wrong answer Your responses will be kept confidential Thank you very much for your help in this research effort
Please nut an X on the blank that best describes your opinion
Section 1
1) Are you a dieter__ Yes __ No (Go to Question No4)
2) Why are you on diet (Check all that apply)__ Good Health ___Weight loss ___Other_______
3) How often do you eat diet products__ more than 5 times a week __ 2 to 4 times a week__ Once a week __ Never__ Other______
4) Please indicate how much you would agree (if you wanted to lose weight) with each of the following by checking the blank that best represents your response
6) Do you think that low-carb diets are good for your health__ Yes __ No
7) What would be the most common catalyst that would make you try a low-carb product
__ Medical professionals __ Store environment__ NutrientLow Carb Claims ___Advertising (eg TV magazine)__ Other_______
57
8) Please indicate how often you would buyeat diet products from each of following place by circling the number that best represents your response
1- Very Often 2- Often 3- Occasionally 4- Almost Never 5- Never
A Restaurants 1 2B Supermarkets 1 2C Medical Care Centers 1 2D Websites 1 2E Others 1 2
(Please specify)
3 4 5 3 4 5 3 4 5 3 4 5 3 4 5
9) Check the blank that best represents your response
A How important is it to you to purchase food to eat at home than food with low- carb information on the label
Most important Least important
B How important is it to you to choose a restaurant that specifically advertises low- carb offerings
Most important ___ ____ ____ ____ ___Least important
MICHELOB ULTRAreg vs MICHELOBreg26 g CARBS 133 g95 CALORIES 155
$175 PRICEServing size 12 oz
$135
From above information between regular Michelob beer and low-carb Michelob beer (Michelob ultra)how would you respond to the following Check the blank that best represents bull your response
58
A I always look at carb count
Strongly Agree Strongly Disagree
B I would be concerned about ldquoCaloriesrdquo
Strongly Agree Strongly Disagree
C I donrsquot feel good about the price of the low-carb product so I wouldnrsquot buy it
Strongly Agree Strongly Disagree
D I donrsquot thinkI would like the ldquoTasterdquo of low-carb beer
Strongly Agree Strongly Disagree
E The word ldquoUltrardquo on the product makes memoreinterested in buying it
From above information between Muellerrsquos reduced-carb spaghetti and Muellerrsquos regular how would you respond to the following Check the blank that best represents your response
59
A I always look at carbCount
Strongly Agree Strongly Disagree
B I would be concerned about ldquoCaloriesrdquo
Strongly Agree Strongly Disagree
C I donrsquot feel goodabout the price of the low-carb product so I wouldnrsquot buy it
Strongly Agree Strongly Disagree
D I donrsquot think I would like the ldquoTasterdquo of the low-carb spaghetti
From above information between Tropicana lightrsquon healthy and Tropicana pure premium how would you respond to the following Check the blank that best represents your response
60
A I always look at carb count
Strongly Agree Strongly Disagree
BI would beconcernedaboutldquoCaloriesrdquo
Strongly Agree Strongly Disagree
CI would buy the low-carb product because itrsquos the
Strongly Agree Strongly Disagree
same price as the regular
DI donrsquot think I would like the ldquoTasterdquo of the
Strongly Agree Strongly Disagree
low-carb juiceE The word
ldquoLightrdquo on the product makes me more
Strongly Agree Strongly Disagree
interested to buy it
13)
KLONDIKECARBSMARTSANDWICHESreg
VS KLONDIKE BIGBEAR SANDWICHESreg
5g CARBS 28 g80 CALORIES 190
$399 PRICESferurgsx Oesrdridi
$399
From above information Between Klondike carb-smart sandwiches and Klondike big bear sandwiches how would you respond to the following Check the blank that best represents your response
61
A I always look at carb count
Strongly Agree Strongly Disagree
B I would be be concerned about ldquoCaloriesrdquo
Strongly Agree Strongly Disagree
C I would buy the low-carb product because itrsquos the same price as the regular
Strongly Agree Strongly Disagree
D I donrsquot think I would like the ldquoTasterdquo of the low-carb sandwiches
Strongly Agree Strongly Disagree
E The word ldquoCarbsmartrdquo on the product makes memoreinterested to buy them
Strongly Agree Strongly Disagree
62
14) If you were to make a decision to buy a low carbohydrate product please rate your preference for each of the following features that best represents your response
A Whether or not the ldquoTasterdquo is almost or the same as the regular product
High preference Low preference
B Preference for ldquoNutri entHealth claimrdquo on the label
High preference Low preference
C Product is made by a well-known ldquoBrandrdquo High preference Low preference
D Product package contains the word ldquoCarbrdquo
High preference Low preference
E ldquoPackagerdquo is great designed High preference Low preference
F The ldquoPricerdquo of low-carb product the same or only a bit more expensive than the regular product
High preference Low preference
15) What media do you usually use (Please check all that apply)___ Radio Station___ Television___ Newspaper___ Magazine
Internet
63
Section 2 About you
1) What is your gender__ Male
2) Which age range applies to you__ 19 years and under_ 36-45
3) What is your educational background__ High school__ Associate degree__ Graduate or professional degree
4) What is your ethnic background
Female
20-2546 years and over
CollegeBachelorrsquos degree
26-35
WhiteBlack
_ Hispanic Asian
Pacific Islander Native American Multi Racial Other
5) What is your approximately total household income_ Less than $9999 _ $ 10000-$ 14999_ $15000-$24999 _ $25000-$49999_ $50000-$74999 _ $75000-$99999__ $100000 and over
6) Do you have any medical conditions (Check all that apply)__ Diabetes__ Obesity__ I donrsquot have
Other
laquoThank You
64
REFERENCES
Addis S (2004) Think outside the low-carb box Advertising Age 75(26) 22
Alvensleben R (1997) Consumer behaviour Agro-food marketing Wallingford CAB Publishing
Astrup P Thomas M L amp Harper A(2004) Atkins and other low-carbohydrate diets Hoax or an effect tool for weight loss Lancet 364(9437) 897-899
Atkins R (1998) Dr Atkins new diet revolution (3rd ed) New York Simon amp Schuster
Atkins R (2002) Dr Atkins new diet revolution New York Avon Books
Banking Business (2004) Low-carb sales trends andconsumer attitudes Retrieved December 5 2004 from httpwwwbankingbusinesscomco_articleaspArticleID=72 022
Beirne M (2004) Confectioners unwrap low-card strategies Brandweek 45(24) 14
Bowden J (2004) Low carb diets insulin resistance and diabetes Total Health 26(2) 22-23
Cole W (2004) Is bread toast Time Magazine 163(18) 50-51
Current Events (2004) Carb-crazed Retrieved December 6 2004 from httplibproxylibcsusbedu loginurl=http search epnet com- libproxy lib csusb eduloginaspxdirect=trueampAuthType=cookieipurluidampdb=aphampan=14441487
Daniels S R (2003) Abnormal weight gain and weightmanagement are carbohydrates the enemy Journal of Pediatrics 142 225-227
65
DeNoon D (2004) Is the low-carb craze waning Retrieved December 5 2004 fromhttpcontenthealthmsncomcontentarticle90 100819htmGTl=4244
Ebenkamp B (2004) Baby you deprive my carbs Brandweek 45(11) 20-22
Food Navigator (2004) Low-carb losing its sparkle Retrieved December 5 2004 from http www f oodnavigator comnews printNewsBisaspid=53564
Foxall G R (1988) Marketing new technology markets hierarchies and user initiated innovation Managerial and Decision Economics 9 237-250
Gloede W F (2004) Diet Inc American Demographics 25(10) 32-34
Hawkins D I Roger J B amp Kenneth A C (2001) Consumer Behavior New York McGraw-Hill
Information Resources Incorporate (2003) Fifty-two weeks through mid-year 2003 Retrived March 24 2005 from httpwwwinforescompublicus contentconsumernetworkdefaulthtm
Julie S (2004) What does it mean to be low carb Retrieved December 19 2004 from httpIwwwusatodaycommoneyindustriesfood2 0 04 - 05-25-low-carb_xhtm
Kadlec D Rawe J Park A Fonda D Cole W DeQuine J Healy R Hequet M Hylton H Locke L A amp Scully S (2004) The low-carb frenzy Time Magazine 163(18) 46-53
Kotler P 6 Armstrong G (1993) Maketing An Introduction 3rd ed NY Prentice Hall
LaMar K A Groller K Marroco R Housand LMalecki J Wong S amp Tan L (2004) You asked us Prevention 56(6) 33-38
66
Opinion Dynamic Corporations (2005) Measuring thelow-carb revolution Retrieved March 25 2005 from httpwwwopiniondynamicscomlowcarbhtml
Reyes S (2004) Crowded low-carb market to face new FDA guidelines Brandweek 45(25) 44
Reyes S (2004) New Yoplait launch milks low-carb craze Brandweek 45(18) 12
Reyes S (2004) Wal-mart line may starve low-carb foes Brandweek 45(25) 6
Richard L (2004) The secret to low carb successreduced carbohydrate is the key to success New York Kensington Publishing Corp
Rotella M amp Zaleski J (2003) Low-carb from myth to reality Publishers Weekly 250(5) 71
Thompson S (2004) Carb craze hit by reality check Advertising Age 75(23) 1-2
Thompson S (2004) Food marketers grapple with carb conundrum Advertising Age 75(19) 4-5
Thompson S (2004) Low-carb craze blitzes food biz Advertising Age 75(1) 1-2
Time and Trends (2004) The wellness evolution chasing the low carb consumer Retrieved April 3 2004 from httpwwwinforescompublicusnewsEvents thoughtleadershiptt_issuel8pdf
Topkis M (2003) The lowdown on low carb Money32(13) 218-219
Tsao A (2004) Lean times for food stocks Retrieved December 5 2004 fromhttpwwwbusinessweekcombwdailydnflashmay2004 nf20040518 9901 db014htm
67
Tufts University (2003) Low-carb craze or low-carbcrazy Tufts University Health amp Nutrition Letter 21(8) 4-5
University of California Berkeley (2004) Low-carbfoods less than meets the eye Retrieved December 20 2004 from httpwwwberkeleywellnesscom htmlwl2004wlFeatured0104html
Woodruff S (2004) Finding the right foods Better Nutrition 66(1) 29-32
Woodruff S (2004) Good-cardlow-card living Better Nutrition 66(6) 37-40
Yager J (2004) Low-carbohydrate diet vs low-fat diet no differences after 1 year Eating DisordersReview 15(4) 2-3
68
Factors influencing purchasing decision process of low-carbohydrate products
Recommended Citation
regular products was more acceptable but not so for
non-dieters Another factor considered by dieters was
carb count (mean = 304) The addition of the word
Ultra would not influence the purchase either among
dieters (mean = 420) or non-dieters (mean = 419)
Table 13 Mean Scores of Product Factors of Low
Carbohydrate Beer
spaghetti Calories was the first consideration among
dieters However non-dieters considered taste
(mean = 156) and price (mean = 154) first
Non-dieters were not satisfied with the price difference
between the regular ($099) and the low-carb versions
($199) In turn dieters accepted a higher price
however they were not always likely to buy the
higher-priced product (mean = 254) Carb count was
always a consideration of dieters (mean = 288) but low
consideration was given to the word carb added
(mean = 443) Non-dieters were not very concerned with
carb count (mean = 389) and they strongly disagreed
that the word carb added was important to them
(mean = 451)
If the price of both the regular and
low-carbohydrate juice were the same both dieters and
non-dieters would choose the latter Even though the
taste may not be as good non-dieters would be willing
to try the- low-carb versions (mean = 172) However
calories was still important to dieters (mean = 192)
(Table 15)
The addition of the word light had some impact on
dieters (mean = 302) but less for non-dieters
(mean = 408) (see Table 15)
Low-carbohydrate sandwiches that were priced the
same as regular sandwiches were of interest to dieters
and non-dieters (mean = 257) Even though non-dieters
thought that they would not like the taste as much
(mean = 158) they would be interested in trying
low-carbohydrate products Dieters still agreed strongly
in the importance of Calories (mean = 179) in choosing
a product Both dieters (mean = 429) and non-dieters
(mean = 448) alike disliked the addition of the word
carbsmart (see Table 16)
Table 19 showed the importance of low-carb labeling
to consumers in each age range The majority (538) of
people 46 years and above thought that it was important
Of respondents who had medical conditions such as
diabetes (Table 20) over half (522) of those were
mostly concerned about low-carb information on the label
and approximately 35 of them thought that low-carb
labeling was important (see Table 20)
Many of respondents who were obese (40) felt
neutral about choosing a product with low-carb labeling
However up to 33 of them thought that it was important
to have low-carb labeling when buying food to eat at home
(Table 21)
Tables 22 and 23 showed that the majority (696) of
diabetic respondents were age 46 years and over (see
Table 22) Also the majority (60) of those who
considered themselves obese were age 46 years and over
(see Table 23)
those 46 and over used the internet for research (see
Table 28)
CHAPTER THREE
METHODOLOGY
Population and SampleThe sample was chosen among students enrolled in a
Southwestern University and those living in a
Southwestern city Shoppers exiting a local supermarket
and students at the local university were selected at
random Children and pregnant women were not included in
this study
InstrumentsA self-administered questionnaire was developed to
ascertain the objectives set fourth To determine
attitudes toward low-carbohydrate diets among the sample
questions included whether they had tried a low-carb
product and whether they thought low-carb diets were good
for health They were also asked how they learned about
low-carb products (the choices were from literature
reviewed) Statements were measured via Yes-or-No and
multiple-choice responses Moreover the researcher used
the instrument developed by Opinion Dynamic Corporation
(ODC) (httpwwwopiniondynamicscomlowcarbhtml 2004)
19
to measure how much consumers believed they would lose
weight by following a low-fat or a low-carb diet The
instrument was measured on a five point Likert scale
ranging from strongly agree (1) to strongly disagree (5)
To determine that the attributes that influence the
purchase of low-carbohydrate products statements were
taken from the ODC (2004) Statements were measured via
modified five point Likert scaled ranging from high
preference (1) to low preference (5) and included
low-carb labeling in addition to factors used by
Alvensleben (1997) that included price taste calories
and carb count In order to determine the most important
attributes respondents were asked to consider their
decision process for samples of four low-carbohydrate
products Michelob Ultra Muellers Reduced-Carb
Spaghetti Tropicana Light Healthy and Klondike
Carbsmart Sandwiches This instrument previously used by
Rawe (2004) used a Likert scale ranging from strongly
agree (1) to strongly disagree (5) and asked respondents
to evaluate the brands price taste calories and carb
count -
20
To determine the extent of low-carbohydrate
purchases among consumers respondents were asked to
describe their low-carb buying experiences and preference
choices when purchasing such products over a selected
period The first three questions established if they
were dieters why they were on a diet and how often they
consumed or purchased diet products The questions were
measured using a Yes-or-No response
To determine the media mix and ultimately
marketing strategies to promote low-carbohydrate foods
among manufacturers respondents were asked where they
turned for information The five media were radio
television newspapers magazines and the internet Also
respondents were asked about how often they would buy
diet products from restaurants websites and
supermarkets Questions were measured using a modified
Likert scaled ranging from very often (1) to never (5)
To determine the demographic and psychographic
characteristics of consumers items mentioned in the
literature reviewed included income education and
ethnicity
21
Data Analysis Procedures
After collecting the data the data were put into
the Statistical Program of Social Science (SPSS)
Frequencies means and cross tabulations were compiled
to complete the data analysis
22
CHAPTER FOUR
RESULTS AND DISCUSSION
Introduction
The data were analyzed using the Statistical Package
for Social Sciences (SPSS)
Demographics of RespondentsTwo hundred and thirty-one of the 250 respondents
(92) returned the completed survey The demographic
characteristics of respondents are given in Table 1 Of
the respondents 593 were female and the majority
(429) ranged from 26 to 35 years of age Further
approximately 41 of the respondents had some college
education Most respondents were White (316) and 251
were Asian Moreover the majority (234) of respondents
reported a household income from $25000 to $49999 and
831 did not have a medical condition Only 39 of
respondents (169) reported suffering from diabetes and
obesity Eleven of the respondents had diabetes and nine
classified themselves as obese (see Table 1)
23
Table 1 Demographic Characteristics of the Respondents
N = 231VariableGender
Male 94 407Female 137 593
Age19 years and under 5 22 bull20-25 83 35926-35 99 42936-45 18 7846 years and over 26 113
neutral (mean = 263 and 267 respectively) regarding the
terms NutrientHealth claims and Well-known Brand
Great design of the package (mean = 362) did not have
an impact on purchase Further respondents had very low
preference forL use of Carb on packaging (mean = 437)
(see Table 7)
28
Table 7 Summary of Preference with Low Carbohydrate
Products
N MeanStd
DeviationTaste is almost or the same as regular products 231 161 915NutrientHealth claim is shown on the label 231 2 63 1315Brand is well-known 231 267 1069The word Carb is added on the package 231 437 1030Package is interestingattractive 231 362 979Price is not much more expensive than regular products
231 193 1029
Valid N (listwise) 231
Objective 2
One reason that low-fat was placed on the market
was to appeal to weight-conscious consumers This was
also true for low-carb products Table 8 showed that a
low-fat diet was a strong motive (mean = 176) for
dieters and almost as a strong (mean = 227) by
non-dieters Overall more respondents agreed that a
low-fat diet was more effective than a low-carb diet in
losing weight
29
Table 8 Mean Scores of Agreement of Diet Products
Are you a dieter
Please indicate how much you would agree
if you want to lose weight with Low Fat Diets
Please indicate how much you would agree
if you want to lose weight with Low Carb Diets
Yes Mean 179 267N 109 109Std Deviation 891 1291
No Mean 227 331N 122 122Std Deviation 1114 1143
Total Mean 203 301N 231 231Std Deviation 1044 1255
Aside from helping to control weight low-carb diets
were advertised as conducive to healthy lifestyle
(Rotella amp Zaleski 2003) However Table 9 showed that
758 of respondents who had never tried a
low-carbohydrate diet did not agree that it was good for
individuals health and 417 of respondents who had
tried low carbohydrates did not think the diet
contributed to good health Nevertheless respondents who
had already tried low-carb products were more likely to
purchase a low-carb product than were those who had not
30
Table 9 Crosstabulation of Respondents Agreement with
Low Carbohydrate Products
Do you think that low carb diets are good for your health
TotalYes NoHave you Yes Counttried a wj_thin Have
77 55 132
low carb you tried a lowproduct carb produqfc
583 417 1000
No Count within Have
24 75 99
you tried a low carb product
242 758 1000
Total Count within Have you tried a low carb product
101
437
130
563
231
1000
Interestingly 50 of respondents who were on a diet
also disagreed with the statement that low-carb diets
were good for health (see Table 10)
31
Table 10 Low Carbohydrate Agreement among Dieters
Do you think that low carb diets are
good for your health
TotalYes NoAre you a Yes Count 60 49 109dieter within Are
a dieteryou 550 450 1000
No Count 41 81 122 within Are a dieter
you 336 664 1000Total Count 101 130 231
within Are a dieter
you 437 563 1000
Table 11 identifies the catalysts that make people
want to try low-carbohydrate diets The majority of
respondents both dieters and not believed the medical
professionals opinion of low-carb products Overall
most respondents (494) would be convinced to try or
purchase low-carb products upon the recommendation of
medical professionals Nutrientlow-carb claims and
advertising (208 and 199 respectively) were the next
two catalysts that affected respondents concerning
health Other catalysts included friends families and
themselves (74) Of those who believed in the advice of
medical professionals 477 were dieters while 508
were non-dieters The next two catalysts among dieters
32
were advertising and nutrientlow-carb claims (22 and
193 respectively) The second catalyst among
non-dieters was nutrientlow-carb claims (221) followed
by advertising (18)
Table 11 Summary of Catalysts Motivating Respondents
What would be the most common catalyst that makes you try low carb products
TotalMedical
ProfessionalsStore
Environment
Nutrient Low Carb Claims Adveritsing Other
Are you Yes Count a dieter within
52 5 21 24 7 109
Are you a dieter
477 239 468 174 55 1000
No Count 62 1 27 22 10 122 within Are you a dieter
508 8 221 180 82 1000
Total Count 114 6 48 46 17 231 withinAre you a dieter
494 26 208 199 74 1000
Objective 3According to respondents concerns for low-carb
messages on either the product label or on a restaurant
advertisement Table 12 showed that dieters (mean = 294)
had more concern than non-dieters (mean = 393) for
low-carbohydrate information on the label However the
degree of concern for low-carb offerings by restaurants
33
by both groups was only moderate to less important Both
dieters and non-dieters agreed less on the offerings
(mean = 393 and 427 respectively)
Table 12 Importance of Low-Carb Product
LabelingOfferings to Respondents
Are you a dieter
How important is it to you in purchasing food to eat at home that the food has low carb information
on the label
How important is it to you in choosing a
restaurant specifically advertises low carb
offeringsYes Mean 294 393
N 109 109Std Deviation 1442 1152
No Mean 378 427N 122 122Std Deviation 1237 1045
Total Mean 338 411N 231 231Std Deviation 1399 1108
The next four tables reflect respondents opinions
regarding four different low-carbohydrate products
price taste calories carb count and carb labeling
Low-carbohydrate beer Michelob Ultra is offered in
the market survey (Table 13) To dieters calories
(mean = 182) were of concern however to non-dieters
taste (mean = 169) was their primary consideration To
dieters paying a bit more for the low carbs than the
34
regular products was more acceptable but not so for
non-dieters Another factor considered by dieters was
carb count (mean = 304) The addition of the word
Ultra would not influence the purchase either among
dieters (mean = 420) or non-dieters (mean = 419)
Table 13 Mean Scores of Product Factors of Low
Carbohydrate Beer
Are you a dieter
Between regular Michelob beer and low-carb Michelob beerI always look for Carb Count
diet products and to identify the factors that influenced
their decision to purchase low-carbohydrate food Because
of epidemic of obesity and diabetes among Americans
low-fat foods contribute to good health and weight
control (UC Berkeley Wellness Letter 2004) However
obesity and diabetes rates remain high (Daniels 2003)
As a result people on low carbohydrates experience
weight loss lowered triglycerides and lower cholesterol
(Bowden 2004) Today the focus is on carbohydrate
reduction (Woodruff2004)This practice emphasized the
fact that the suppliers and manufacturers of low-carb
food markets should understand the demands of their
consumers when it comes to low-carbohydrate foods Today
50
carb is widely used in product packaging to capture
market sales (Addis 2004) However brand taste and
price attributes are still important to consumers
(Beirne 2004) Therefore it is necessary for food
marketers to understand and meet the demand for
low-carbohydrate products given these criteria
Results showed that females seemed to be more
concerned about their food consumption than males are
Most of the dieters were 46 years old and over with
incomes ranging from $50000 - $74999 Moreover people
with medical conditions such as diabetes tended to pay
more attention to low-carb information Most respondents
consumed diet products between two and four times per
week
Weight loss was the primary factor in respondents
consumption of diet products However low-fat diets were
still thought to be more effective than low-carb diets in
weight reduction This finding confirms ODCs (2005)
conclusion that consumers are more concerned with fat
content than with any other nutritional claim Still
fewer than 50 of respondents agreed that low-carb diets
were good for health
51
In general low-carbohydrate information on both the
label and on restaurant menus was important for dieters
but not for non-dieters Most respondents preferred
low-carbohydrate products that tasted as much like the
original as possible This finding is consistent with
that of the IRIs Consumer Network (2001) that determined
that taste was a key factor in food and beverage
selection Brand recognition was expected most from
non-dieters However for dieters Brand was less
important than low-carb claims which refers not only
to carb count but also to calories something that
was very important to most dieters Topkis (2003) found
that many low-carb products were often more expensive
than the original or than other products in the same
category The findings consistently indicated that
low-price or equal price of low-carb products had an
impact on purchases -especially among non-dieters who
were interested in trying something different but not in
paying more-
Although Addis (2004) expected that trademarks
combined with the word carb would sell more results
indicated that the word carb on the package had the
least importance in influencing respondents purchasing
52
decision Most respondents placed little credence in the
word carb however the word light had more of an
impact
Implications of the findings suggest that medical
care centers would be the best place to provide
low-carbohydrate products for people who have a medical
condition For other people supermarkets might be the
best place to offer low-carbohydrate foods Restaurant
menus present the occasional opportunity to dine on
low-carbohydrate products However websites would not be
a good place to market low-carbohydrate products because
people rarely buy diet products online
It is also recommended that low-carb advertisements
appear in newspapers because people age 46 years and over
spend the most time reading the newspaper
Also radio stations which most people listen to
regularly should have low-carb advertisements Magazines
should focus only on people age 20 to 35 Since medical
professionals have a great influence upon purchases they
might want to try low-carbohydrate products Their
recommendation can help promote the sale of low-carb
diets
53
Results indicated that most respondents had more
confidence in low-fat foods than in low-carbohydrate
foods Consequently a further recommendation is for diet
products to focus on being low-fat rather than the
low-carb particularly in package labeling This claim
is supported by the findings that lower fat is better
than fewer carbs for weight loss low fat promotes better
health than fewer carbs and buyers would be more
attracted to low-fat products than to products that were
labeled as low-carb
In terms of product labeling low-fat appeared to be
the most significant influence upon weight-conscious
respondents Consequently low-fat labeling should be
emphasized more than low-carb as well as in
advertisements Having words that consumers can easily
see while making a purchase can aid in a
salesfactoryexperience Further manufacturers should
research and produce tasty but reasonably-priced low-fat
and low-carb products to drive sales
However low-carbohydrate diets were still needed
among diabetic respondents (Table 20) Therefore the
niche market of low-carb products should focus on
diabetics
54
While most diabetics cited low carbohydrates as
their primary reason to stay healthy and control weight
weight watchers trusted low-fat diets more so than
low-carb ones Medical professionals should be encouraged
to endorse the health benefits of reducing carbohydrate
intake for good health
55
APPENDIX
QUESTIONNAIRE
56
Public Opinion Survey
The purpose of this survey is to learn peoplesrsquo preferences and opinions toward low carbohydrate carbohydrate-controlled products Please take 7-10 minutes to complete the questionnaire There is no right or wrong answer Your responses will be kept confidential Thank you very much for your help in this research effort
Please nut an X on the blank that best describes your opinion
Section 1
1) Are you a dieter__ Yes __ No (Go to Question No4)
2) Why are you on diet (Check all that apply)__ Good Health ___Weight loss ___Other_______
3) How often do you eat diet products__ more than 5 times a week __ 2 to 4 times a week__ Once a week __ Never__ Other______
4) Please indicate how much you would agree (if you wanted to lose weight) with each of the following by checking the blank that best represents your response
6) Do you think that low-carb diets are good for your health__ Yes __ No
7) What would be the most common catalyst that would make you try a low-carb product
__ Medical professionals __ Store environment__ NutrientLow Carb Claims ___Advertising (eg TV magazine)__ Other_______
57
8) Please indicate how often you would buyeat diet products from each of following place by circling the number that best represents your response
1- Very Often 2- Often 3- Occasionally 4- Almost Never 5- Never
A Restaurants 1 2B Supermarkets 1 2C Medical Care Centers 1 2D Websites 1 2E Others 1 2
(Please specify)
3 4 5 3 4 5 3 4 5 3 4 5 3 4 5
9) Check the blank that best represents your response
A How important is it to you to purchase food to eat at home than food with low- carb information on the label
Most important Least important
B How important is it to you to choose a restaurant that specifically advertises low- carb offerings
Most important ___ ____ ____ ____ ___Least important
MICHELOB ULTRAreg vs MICHELOBreg26 g CARBS 133 g95 CALORIES 155
$175 PRICEServing size 12 oz
$135
From above information between regular Michelob beer and low-carb Michelob beer (Michelob ultra)how would you respond to the following Check the blank that best represents bull your response
58
A I always look at carb count
Strongly Agree Strongly Disagree
B I would be concerned about ldquoCaloriesrdquo
Strongly Agree Strongly Disagree
C I donrsquot feel good about the price of the low-carb product so I wouldnrsquot buy it
Strongly Agree Strongly Disagree
D I donrsquot thinkI would like the ldquoTasterdquo of low-carb beer
Strongly Agree Strongly Disagree
E The word ldquoUltrardquo on the product makes memoreinterested in buying it
From above information between Muellerrsquos reduced-carb spaghetti and Muellerrsquos regular how would you respond to the following Check the blank that best represents your response
59
A I always look at carbCount
Strongly Agree Strongly Disagree
B I would be concerned about ldquoCaloriesrdquo
Strongly Agree Strongly Disagree
C I donrsquot feel goodabout the price of the low-carb product so I wouldnrsquot buy it
Strongly Agree Strongly Disagree
D I donrsquot think I would like the ldquoTasterdquo of the low-carb spaghetti
From above information between Tropicana lightrsquon healthy and Tropicana pure premium how would you respond to the following Check the blank that best represents your response
60
A I always look at carb count
Strongly Agree Strongly Disagree
BI would beconcernedaboutldquoCaloriesrdquo
Strongly Agree Strongly Disagree
CI would buy the low-carb product because itrsquos the
Strongly Agree Strongly Disagree
same price as the regular
DI donrsquot think I would like the ldquoTasterdquo of the
Strongly Agree Strongly Disagree
low-carb juiceE The word
ldquoLightrdquo on the product makes me more
Strongly Agree Strongly Disagree
interested to buy it
13)
KLONDIKECARBSMARTSANDWICHESreg
VS KLONDIKE BIGBEAR SANDWICHESreg
5g CARBS 28 g80 CALORIES 190
$399 PRICESferurgsx Oesrdridi
$399
From above information Between Klondike carb-smart sandwiches and Klondike big bear sandwiches how would you respond to the following Check the blank that best represents your response
61
A I always look at carb count
Strongly Agree Strongly Disagree
B I would be be concerned about ldquoCaloriesrdquo
Strongly Agree Strongly Disagree
C I would buy the low-carb product because itrsquos the same price as the regular
Strongly Agree Strongly Disagree
D I donrsquot think I would like the ldquoTasterdquo of the low-carb sandwiches
Strongly Agree Strongly Disagree
E The word ldquoCarbsmartrdquo on the product makes memoreinterested to buy them
Strongly Agree Strongly Disagree
62
14) If you were to make a decision to buy a low carbohydrate product please rate your preference for each of the following features that best represents your response
A Whether or not the ldquoTasterdquo is almost or the same as the regular product
High preference Low preference
B Preference for ldquoNutri entHealth claimrdquo on the label
High preference Low preference
C Product is made by a well-known ldquoBrandrdquo High preference Low preference
D Product package contains the word ldquoCarbrdquo
High preference Low preference
E ldquoPackagerdquo is great designed High preference Low preference
F The ldquoPricerdquo of low-carb product the same or only a bit more expensive than the regular product
High preference Low preference
15) What media do you usually use (Please check all that apply)___ Radio Station___ Television___ Newspaper___ Magazine
Internet
63
Section 2 About you
1) What is your gender__ Male
2) Which age range applies to you__ 19 years and under_ 36-45
3) What is your educational background__ High school__ Associate degree__ Graduate or professional degree
4) What is your ethnic background
Female
20-2546 years and over
CollegeBachelorrsquos degree
26-35
WhiteBlack
_ Hispanic Asian
Pacific Islander Native American Multi Racial Other
5) What is your approximately total household income_ Less than $9999 _ $ 10000-$ 14999_ $15000-$24999 _ $25000-$49999_ $50000-$74999 _ $75000-$99999__ $100000 and over
6) Do you have any medical conditions (Check all that apply)__ Diabetes__ Obesity__ I donrsquot have
Other
laquoThank You
64
REFERENCES
Addis S (2004) Think outside the low-carb box Advertising Age 75(26) 22
Alvensleben R (1997) Consumer behaviour Agro-food marketing Wallingford CAB Publishing
Astrup P Thomas M L amp Harper A(2004) Atkins and other low-carbohydrate diets Hoax or an effect tool for weight loss Lancet 364(9437) 897-899
Atkins R (1998) Dr Atkins new diet revolution (3rd ed) New York Simon amp Schuster
Atkins R (2002) Dr Atkins new diet revolution New York Avon Books
Banking Business (2004) Low-carb sales trends andconsumer attitudes Retrieved December 5 2004 from httpwwwbankingbusinesscomco_articleaspArticleID=72 022
Beirne M (2004) Confectioners unwrap low-card strategies Brandweek 45(24) 14
Bowden J (2004) Low carb diets insulin resistance and diabetes Total Health 26(2) 22-23
Cole W (2004) Is bread toast Time Magazine 163(18) 50-51
Current Events (2004) Carb-crazed Retrieved December 6 2004 from httplibproxylibcsusbedu loginurl=http search epnet com- libproxy lib csusb eduloginaspxdirect=trueampAuthType=cookieipurluidampdb=aphampan=14441487
Daniels S R (2003) Abnormal weight gain and weightmanagement are carbohydrates the enemy Journal of Pediatrics 142 225-227
65
DeNoon D (2004) Is the low-carb craze waning Retrieved December 5 2004 fromhttpcontenthealthmsncomcontentarticle90 100819htmGTl=4244
Ebenkamp B (2004) Baby you deprive my carbs Brandweek 45(11) 20-22
Food Navigator (2004) Low-carb losing its sparkle Retrieved December 5 2004 from http www f oodnavigator comnews printNewsBisaspid=53564
Foxall G R (1988) Marketing new technology markets hierarchies and user initiated innovation Managerial and Decision Economics 9 237-250
Gloede W F (2004) Diet Inc American Demographics 25(10) 32-34
Hawkins D I Roger J B amp Kenneth A C (2001) Consumer Behavior New York McGraw-Hill
Information Resources Incorporate (2003) Fifty-two weeks through mid-year 2003 Retrived March 24 2005 from httpwwwinforescompublicus contentconsumernetworkdefaulthtm
Julie S (2004) What does it mean to be low carb Retrieved December 19 2004 from httpIwwwusatodaycommoneyindustriesfood2 0 04 - 05-25-low-carb_xhtm
Kadlec D Rawe J Park A Fonda D Cole W DeQuine J Healy R Hequet M Hylton H Locke L A amp Scully S (2004) The low-carb frenzy Time Magazine 163(18) 46-53
Kotler P 6 Armstrong G (1993) Maketing An Introduction 3rd ed NY Prentice Hall
LaMar K A Groller K Marroco R Housand LMalecki J Wong S amp Tan L (2004) You asked us Prevention 56(6) 33-38
66
Opinion Dynamic Corporations (2005) Measuring thelow-carb revolution Retrieved March 25 2005 from httpwwwopiniondynamicscomlowcarbhtml
Reyes S (2004) Crowded low-carb market to face new FDA guidelines Brandweek 45(25) 44
Reyes S (2004) New Yoplait launch milks low-carb craze Brandweek 45(18) 12
Reyes S (2004) Wal-mart line may starve low-carb foes Brandweek 45(25) 6
Richard L (2004) The secret to low carb successreduced carbohydrate is the key to success New York Kensington Publishing Corp
Rotella M amp Zaleski J (2003) Low-carb from myth to reality Publishers Weekly 250(5) 71
Thompson S (2004) Carb craze hit by reality check Advertising Age 75(23) 1-2
Thompson S (2004) Food marketers grapple with carb conundrum Advertising Age 75(19) 4-5
Thompson S (2004) Low-carb craze blitzes food biz Advertising Age 75(1) 1-2
Time and Trends (2004) The wellness evolution chasing the low carb consumer Retrieved April 3 2004 from httpwwwinforescompublicusnewsEvents thoughtleadershiptt_issuel8pdf
Topkis M (2003) The lowdown on low carb Money32(13) 218-219
Tsao A (2004) Lean times for food stocks Retrieved December 5 2004 fromhttpwwwbusinessweekcombwdailydnflashmay2004 nf20040518 9901 db014htm
67
Tufts University (2003) Low-carb craze or low-carbcrazy Tufts University Health amp Nutrition Letter 21(8) 4-5
University of California Berkeley (2004) Low-carbfoods less than meets the eye Retrieved December 20 2004 from httpwwwberkeleywellnesscom htmlwl2004wlFeatured0104html
Woodruff S (2004) Finding the right foods Better Nutrition 66(1) 29-32
Woodruff S (2004) Good-cardlow-card living Better Nutrition 66(6) 37-40
Yager J (2004) Low-carbohydrate diet vs low-fat diet no differences after 1 year Eating DisordersReview 15(4) 2-3
68
Factors influencing purchasing decision process of low-carbohydrate products
Recommended Citation
regular products was more acceptable but not so for
non-dieters Another factor considered by dieters was
carb count (mean = 304) The addition of the word
Ultra would not influence the purchase either among
dieters (mean = 420) or non-dieters (mean = 419)
Table 13 Mean Scores of Product Factors of Low
Carbohydrate Beer
spaghetti Calories was the first consideration among
dieters However non-dieters considered taste
(mean = 156) and price (mean = 154) first
Non-dieters were not satisfied with the price difference
between the regular ($099) and the low-carb versions
($199) In turn dieters accepted a higher price
however they were not always likely to buy the
higher-priced product (mean = 254) Carb count was
always a consideration of dieters (mean = 288) but low
consideration was given to the word carb added
(mean = 443) Non-dieters were not very concerned with
carb count (mean = 389) and they strongly disagreed
that the word carb added was important to them
(mean = 451)
If the price of both the regular and
low-carbohydrate juice were the same both dieters and
non-dieters would choose the latter Even though the
taste may not be as good non-dieters would be willing
to try the- low-carb versions (mean = 172) However
calories was still important to dieters (mean = 192)
(Table 15)
The addition of the word light had some impact on
dieters (mean = 302) but less for non-dieters
(mean = 408) (see Table 15)
Low-carbohydrate sandwiches that were priced the
same as regular sandwiches were of interest to dieters
and non-dieters (mean = 257) Even though non-dieters
thought that they would not like the taste as much
(mean = 158) they would be interested in trying
low-carbohydrate products Dieters still agreed strongly
in the importance of Calories (mean = 179) in choosing
a product Both dieters (mean = 429) and non-dieters
(mean = 448) alike disliked the addition of the word
carbsmart (see Table 16)
Table 19 showed the importance of low-carb labeling
to consumers in each age range The majority (538) of
people 46 years and above thought that it was important
Of respondents who had medical conditions such as
diabetes (Table 20) over half (522) of those were
mostly concerned about low-carb information on the label
and approximately 35 of them thought that low-carb
labeling was important (see Table 20)
Many of respondents who were obese (40) felt
neutral about choosing a product with low-carb labeling
However up to 33 of them thought that it was important
to have low-carb labeling when buying food to eat at home
(Table 21)
Tables 22 and 23 showed that the majority (696) of
diabetic respondents were age 46 years and over (see
Table 22) Also the majority (60) of those who
considered themselves obese were age 46 years and over
(see Table 23)
those 46 and over used the internet for research (see