Page 1
0
FACTORS INFLUENCING THE CONSUMPTION OF
MEETINGS, INCENTIVES, CONFERENCES, AND
EXHIBITIONS (MICE) PRODUCTS IN KENYA: A CASE OF
KENYATTA INTERNATIONAL CONFERENCE CENTER
(KICC)
BY
NJOROGE MARY WAITHIRA
UNITED STATES INTERNATIONAL UNIVERSITY
SUMMER 2014
Page 2
i
FACTORS INFLUENCING THE CONSUMPTION OF
MEETINGS, INCENTIVES, CONFERENCES, AND
EXHIBITIONS (MICE) PRODUCTS IN KENYA: A CASE
OF KENYATTA INTERNATIONAL CONFERENCE
CENTER (KICC)
BY
NJOROGE MARY WAITHIRA
A Project Report Submitted to the Chandaria School of Business in partial
fulfillment of the Requirement for the Degree of Masters in Business Administration
(MBA)
UNITED STATES INTERNATIONAL UNIVERSITY
SUMMER 2014
Page 3
ii
STUDENT’S DECLARATION
I, the undersigned, declare that this is my original work and has not been submitted to any
other college, institution or university other than United States International University in
Nairobi for academic credit.
Signed: _________________________ Date: _________________________
Mary Njoroge ID. No: 611703
This report has been presented for examination with my approval as the appointed
supervisor.
Signed: _________________________ Date: __________________________
Mulindi Patrick
Signed: _______________________ __ Date: ___________________________
Dean, Chandaria School of Business
Page 4
iii
COPYRIGHT
©2014 BY MARY NJOROGE
All rights reserved. No part of this report may be photocopied, recorded or otherwise
reproduced, stored in a retrieval system or transmitted in any electronic or mechanical
means without prior permission of the copyright owner.
Page 5
iv
ACKNOWLEDGEMENT
I would like to thank God Almighty for the gift of knowledge and intellect and for His
generous providence in my academic and general life. Special thanks to my family for
their undying love and support in all my academic ventures and for their constant
challenge and encouragement towards this endeavor. My appreciation goes to my
research lecturer and my Supervisor Mr. Patrick Mulindi for imparting ample skills unto
me and for guiding me through the process of conducting this research and to the United
States International University where I’ve garnered adequate knowledge and opportunity
to develop mastery in my field. I would also like to thank the research and development
department at KICC for providing the information I required to make this research a
success. To all my friends and colleagues who made a significant contribution to this
project, it was indeed a team effort! I am so grateful.
Page 6
v
DEDICATION
I dedicate this project to my lovely daughter Inaya. You are a blessing and your smile
lights up even my darkest of days. I hope that I am an inspiration to you and that you will
aspire to surpass my achievements.
Page 7
vi
ABSTRACT
The general objective of this study was to investigate the factors that influence the
consumption of MICE products in Kenya; a case of Kenya International Conference
Center (KICC). The specific objectives of the study were to identify the influence of price
on consumption of MICE products; to establish whether promotional activities influence
consumption of MICE products; to investigate the influence of product attributes on the
consumption of MICE products; and to find out whether place or distribution influences
the consumption of MICE products.
The study adopted descriptive research design using a case study. A total of 399
corporates, political parties and other institutions situated in Nairobi that consume MICE
products at the Kenyatta International Conference Centre (KICC) constituted the target
population. A sample of 40 respondents was selected from this population using
purposive sampling technique where these institutions were selected with a preference to
repeat customers for the period 2010-2012. Data was collected using a questionnaire
which adopted both open- ended and closed-ended questions. Data processing and
analysis was done with the aid of Statistical Package for Social Sciences (SPSS). Tables
and figures were used to present the analyzed data. Correlation analysis and regression
analysis were used to show the relationship and the significance of the relationship
between the variables.
The study found out that among the components of price factor influencing the choice of
the MICE venue by consumers, the main components include organizations’ budget
allocations, ongoing promotions, cost of the venue and flexible payment terms. The study
found that business travellers are sensitive to price and before settling for a particular
destination, they tend to consider a variety of competing destinations. Consumers are also
more likely to purchase several products as a package as opposed to purchasing the
individual products by themselves. This is because the consumer is more likely to be
charged a lower rate when they buy the package. The study concluded that it is necessary
for MICE venues ensure that they have competitive prices as compared to their
competition to ensure that they succeed in attracting visitors to their venue or else they
will be at a disadvantage.
Page 8
vii
The study revealed that MICE consumers carry out extensive research on venues before
making their hire decision and they scrutinize the ‘product’ to the very detail to ensure
that it matches or meets their specific and unique needs. Key product attributes that
influenced these consumers’ choice of MICE venue included among others; one-stop-
shop, venue accessibility, parking space, cleanliness and organization, and security and
safety measures. Packages composed of all these elements were more appealing to
consumers. It was also found necessary for MICE venues to have the equipment/ facilities
that the consumer requires before the consumer decides to acquire their services.
The study revealed word-of-mouth as the most popular medium through which the MICE
consumers learnt about the venues they hired. The study also revealed that among the
promotional factors informing consumers’ choice of the venue, consumer awareness,
communication about the quality of the venue, consumer’s tastes and preferences,
renowned brands and advertising were primary. It is necessary for customers to be aware
of the availability/ existence of a certain product in order for them to acquire it.
Direct channel was found to be the most popular channel of distribution among the
consumers of MICE products. Consumers preferred to deal directly with the service
providers as opposed to engaging through intermediaries/ agents. The study also revealed
that contacts and negotiation agreements between the consumers and the venue
proprietors are instrumental in influencing the MICE consumers’ choice of the venues. It
was thus found necessary for MICE companies to ensure there is contact with customers
in order to facilitate distribution.
Recommendations included more marketing and cultivating healthy and long term
relationships between the service providers and the consumers. As service providers in
MICE industry take advantage of price dynamism, they must ensure provision of quality
services. They should also endeavor to design and package ‘products’ that not only meet
the unique needs, tastes and preferences of these consumers but also exceed their
expectations. They should also ensure that they avail as much information as possible to
both the local and international markets.
Page 9
viii
TABLE OF CONTENTS
STUDENT’S DECLARATION ....................................................................................... ii
COPYRIGHT ................................................................................................................... iv
ACKNOWLEDGEMENT ............................................................................................... iv
DEDICATION................................................................................................................... v
ABSTRACT ...................................................................................................................... vi
TABLE OF CONTENTS ................................................................................................ vi
LIST OF TABLES ............................................................................................................ x
LIST OF FIGURES ......................................................................................................... xi
LIST OF ABBREVIATIONS ........................................................................................ xii
CHAPTER ONE ............................................................................................................... 1
1.0 INTRODUCTION ....................................................................................................... 1
1.1 Background of the Study .............................................................................................. 1
1.2 Statement of the Problem. ............................................................................................. 5
1.3 General Objective ......................................................................................................... 7
1.4 Specific Objectives ....................................................................................................... 7
1.5 Justification of the Study .............................................................................................. 7
1.6 Scope of the Study. ....................................................................................................... 8
1.7 Definition of Terms....................................................................................................... 8
1.8 Chapter Summary ......................................................................................................... 9
CHAPTER TWO ............................................................................................................ 10
2.0 LITERATURE REVIEW ......................................................................................... 10
2.1 Introduction ................................................................................................................. 10
2.2 Influence of Price on Consumption of MICE Products. ............................................. 10
2.3 Influence of Product Attributes on Consumption of MICE Products ......................... 14
2.4 Influence of Promotional Activities on Consumption of MICE Products .................. 18
2.5 Influence of Place on Consumption of MICE Products .............................................. 21
2.6 Chapter Summary . ..................................................................................................... 25
CHAPTER THREE ........................................................................................................ 26
3.0 RESEARCH METHODOLOGY ........................................................................... 26
3.1 Introduction ................................................................................................................. 26
Page 10
ix
3.2 Research Design.......................................................................................................... 26
3.3 Population and Sampling Design ................................................................................ 26
3.4 Data Collection Methods ............................................................................................ 28
3.5 Research Procedures ................................................................................................... 25
3.6 Data Analysis Methods ............................................................................................... 30
3.7 Chapter Summary ....................................................................................................... 31
CHAPTER FOUR ........................................................................................................... 33
4.0 RESULTS AND FINDINGS ................................................................................... 33
4.1 Introduction ................................................................................................................. 33
4.2 General Information. ................................................................................................... 33
4.3 Price and Influence on Consumption of MICE Products ............................................ 36
4.4 Product Attributes and Influence on Consumption of MICE Products ...................... 38
4.5 Promotional Activities and Influence on Consumption of MICE Products ............... 41
4.6 Place and Influence on Consumption of MICE Products ........................................... 44
4.7 Consumption of MICE Products ................................................................................. 45
4.8 Correlation Analysis Results....................................................................................... 47
4.9 Regression Analysis Results ....................................................................................... 48
4.10 Chapter Summary ..................................................................................................... 50
CHAPTER FIVE ............................................................................................................ 51
5.0 DISCUSSION, CONCLUSION AND RECOMMENDATION .......................... 51
5.1 Introduction ................................................................................................................. 51
5.2 Summary. .................................................................................................................... 51
5.3 Discussions ................................................................................................................. 53
5.4 Conclusion .................................................................................................................. 60
5.5 Recommendations ....................................................................................................... 62
REFERENCES ................................................................................................................ 65
APPENDICES ................................................................................................................. 74
APPENDIX I:LETTER OF INTRODUCTION .......................................................... 74
APPENDIX II:QUESTIONNAIRE .............................................................................. 75
Page 11
x
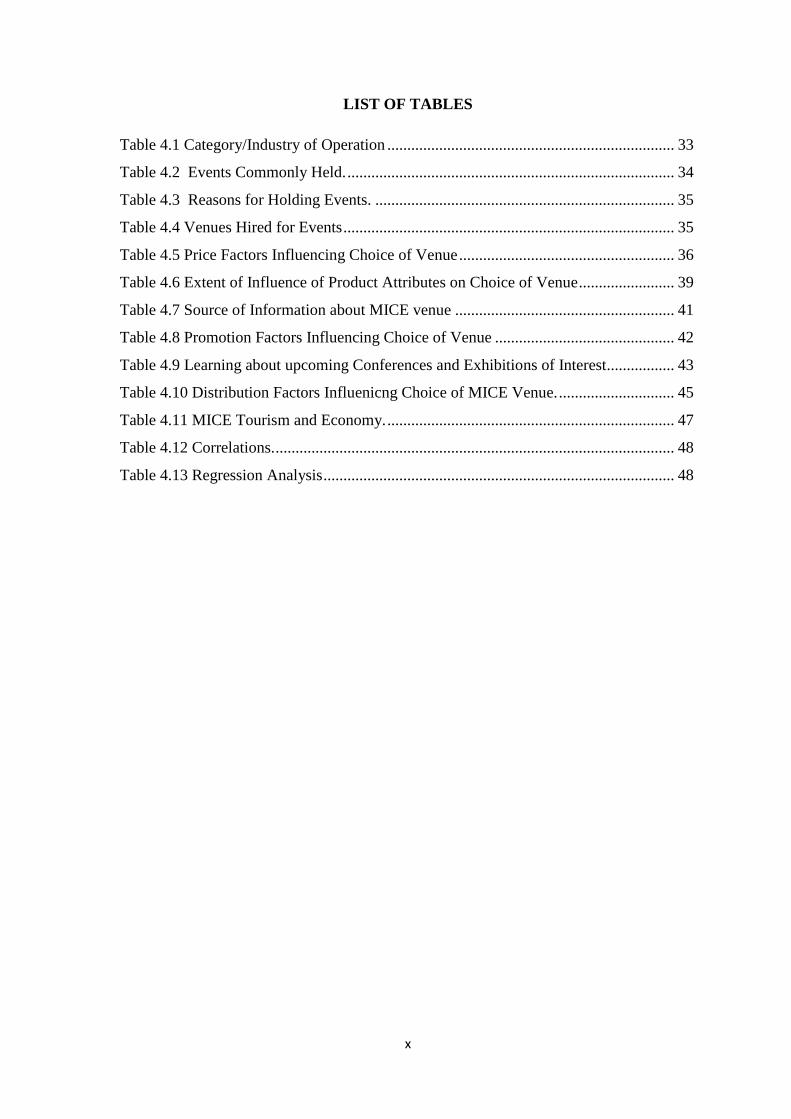
LIST OF TABLES
Table 4.1 Category/Industry of Operation ........................................................................ 33
Table 4.2 Events Commonly Held. .................................................................................. 34
Table 4.3 Reasons for Holding Events. ........................................................................... 35
Table 4.4 Venues Hired for Events ................................................................................... 35
Table 4.5 Price Factors Influencing Choice of Venue ...................................................... 36
Table 4.6 Extent of Influence of Product Attributes on Choice of Venue ........................ 39
Table 4.7 Source of Information about MICE venue ....................................................... 41
Table 4.8 Promotion Factors Influencing Choice of Venue ............................................. 42
Table 4.9 Learning about upcoming Conferences and Exhibitions of Interest ................. 43
Table 4.10 Distribution Factors Influenicng Choice of MICE Venue. ............................. 45
Table 4.11 MICE Tourism and Economy. ........................................................................ 47
Table 4.12 Correlations. .................................................................................................... 48
Table 4.13 Regression Analysis ........................................................................................ 48
Page 12
xi
LIST OF FIGURES
Figure 4.1 Compare Prices before making Hire Decision ................................................ 37
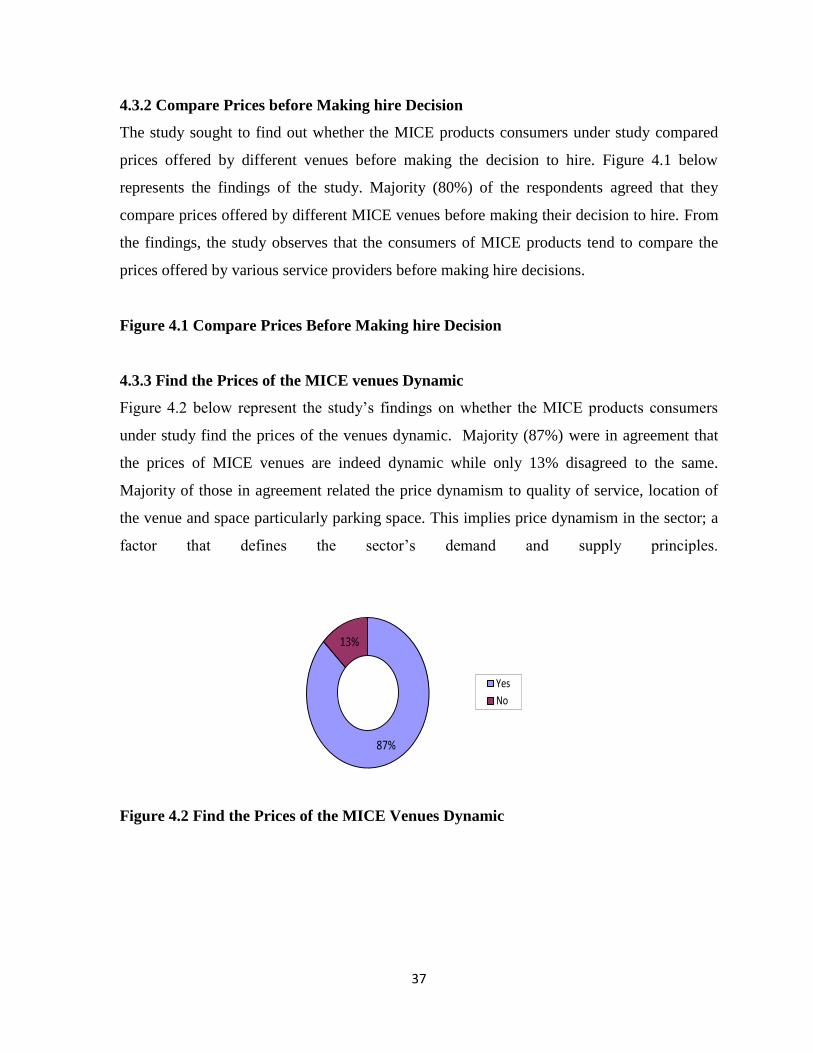
Figure 4.2 Find Prices of MICE venues Dynamic. ........................................................... 37
Figure 4.3 Carry out Research on MICE venues before making Hire Decision............... 38
Figure 4.4 Buy MICE products as Package or Individual Elements ................................ 40
Figure 4.5 Concern about Availability of MICE Venue ................................................... 41
Figure 4.6 Channel of Distribution ................................................................................... 44
Figure 4.7 MICE Tourism as Platform for Marketing Tourism Industry ......................... 46
Page 13
xii
LIST OF ABBREVIATIONS
CVBs Convention and Visitor Bureaus
DIS Department of Investment Services
DMOs Destination Marketing Organizations
GDP Gross Domestic Product
GoK Government of Kenya
ICCA International Congress & Convention Association
IAPCO International Association of Professional Congress Organizers
MICE Meetings, Incentives, Conferences and Exhibitions
UNWTO United Nations World Tourism Organization
WTO World Tourism Organization
Page 14
1
CHAPTER ONE
1.0 INTRODUCTION
1.1 Background of the Study
Tourism, according to The United Nations World Tourism Organization; UNWTO (2007)
refers to the activities of persons travelling to and staying in places outside their usual
environment for not more than one consecutive year for leisure, business and other purposes
not related to the exercise of an activity remunerated from within the place visited. Tourism
is now widely recognized as the world’s largest and most diverse industry and plays a major
role in the world economy (Girod, 2009).
In 2008, international tourist arrivals grew by 2%, to reach 924 million, 16 million more than
in 2007 (UNWTO World Tourism Barometer, 2009). Moreover by 2020, the UNWTO
forecasts up to 1.6 billion international tourist arrivals. It is one of the fastest growing
industries and a primary source for employment and for generating foreign exchange (Page
& Connell, 2006; Cooper, Fletcher, Fyall, Gilbert & Wanhill, 2008). Within the tourism
industry, different travel purposes can be found (Cooper et al., 2008; Holloway, 2006;
Boniface and Cooper, 2005). According to the UNWTO (2008) these travel purposes can be
categorized as leisure and recreation; other tourism purpose, include visiting friends and
relatives (VFR), religion, study and health tourism; and business and professional, including
the Meeting, Incentive, Conference and Exhibition (MICE) activities.
The MICE industry has been recognized as a significant hospitality market segment over the
past decades. In 2009, a total of 11,929 international meetings were held worldwide (Yang &
Gu, 2011). The industry consists of multi-sectors of hospitality services, including lodging,
food and beverage, catering, convention service, convention facility supply, transportation,
tourism, retail, and entertainment and thus bears great importance for the local economy of a
destination (Yang & Gu, 2011).
According to Braley (2008) the demand for MICE capacity is uncertain and highly seasonal
and convention and exhibition facilities, like hotel rooms, are perishable. CEIR (2009) argues
that the demand of the MICE industry is usually affected by seasons, holidays, and weather
Page 15
2
conditions. Further, fluctuations in the economy and competition from rivaling destinations
always cause uncertain markets to a MICE destination (Astroff & Abbey, 2006; Fenich,
2008; Isler, 2008).
MICE industry—a service industry combining trade, transportation, finance, and travel—has
been active in Europe and America for over a century. The industry is characterized by the
‘Three Highs’—high growth potential, high added-values, and highly beneficial innovations;
the ‘Three Larges’—large output, large opportunities for employment, and large industry
associations; and the ‘Three Advantages’—advantage over other industries in human
resources, technological know-how, and the efficient utilization of assets (GIS, 2012).
International Congress & Convention Association (ICCA) statistics show, that a total of
400,000 conferences and exhibitions are held worldwide every year at the total outlay of
US$280 billion. The Global Association of the Exhibition Industry (UFI) points out that as
annual MICE industry output value has already reached US$1.16 trillion (including US$400
billion for conferences and US$760 billion for exhibitions), MICE could be counted on to
bring enormous economic benefit to the countries and cities that host them (GIS, 2012).
Today, countries all over the world are putting their best foot forward to develop the MICE
industry as a means to enliven national economic development (Yang & Gu, 2011). To the
U.S. economy the industry contributes $263 billion in annual spending, provides $25.6
billion in tax revenue at the federal, state, and local levels, and creates 1.7 million jobs for the
American workforce in local communities. For Singapore, which relies on MICE heavily for
its tourism industry, MICE business contributes even more to the nation’s economy. Every
dollar generated by the MICE industry adds another $12 to the national gross domestic
product (Yang & Gu, 2011).
As nations around the world are optimistic about MICE industry development, exhibition
space will continue to grow in the years ahead (UNWTO, 2008). In its October 2007
report—“World Map of Exhibition Venues”—UFI notes that in 2006, there were a total of
1,062 exhibition halls around the world with indoor exhibition space exceeding 5,000m2,
meaning that there is approximately 53.1 million m2 in total indoor space primarily located
in Europe, North America, and Asia. More specifically, exhibition halls in the U.S.,
Page 16
3
Germany, China, Italy, and France assume 58% of the worldwide capacity (GIS, 2012). Total
construction costs for 2007-2010 was estimated at a minimum of US$18.7 trillion for
building and expansion and total of 1,104 exhibition halls with over 5,000 m2 in indoor
exhibition space in 2010 (UNWTO, 2010).
In a nutshell, continental ranking of conference tourism puts Europe and Asia as the leaders
while North America and Africa follow suit. Within Africa, South Africa has been the most
popular in hosting meetings in Africa, followed by Egypt, Tunisia and Morocco. Kenya takes
the 4th position. City wise, Nairobi ranks 5th after Cape Town, Durban, Cairo and
Johannesburg (Odunga, Belsoy, Nthinga & Maingi, 2011).
While Africa has a relatively small share of the growing global convention and conference
demand, Kenya has East Africa‘s largest convention facility, which is able to support up to
5,000 attendees in its newly renovated facility. Bolstering this segment is the fact that Kenya
is an international airline hub with direct access that far exceeds the capacity of any other
country in East Africa (Zutt, 2010).
As the third highest contributor to Gross Domestic Product (GDP), Kenya‘s tourism is being
promoted by the government as a source of economic growth and poverty alleviation. It is
also a cornerstone of the country‘s Vision 2030 (GoK, 2012). The sector is among the
leading foreign exchange earners generating about Ksh. 65.4 billion in 2007 up from 21.7 in
2002, is a major generator of employment, and contributes about 10% of Kenya’s GDP. The
sector has linkages with other sectors of the economy thus facilitating growth in those sectors
(GoK, 2012).
MICE, also known as business and conference travel, is Kenya‘s third major tourism product
line after Safari tourism and Coastal tourism (Odunga et al., 2011). Independent business
travelers originate from domestic, intraregional, and international source markets and choose
specific Kenyan destinations depending upon their business activities. In contrast, conference
and meeting attendees are drawn to major meetings typically hosted at the Kenyatta
International Convention Center (KICC) in Nairobi.
Page 17
4
However, the current volume of business and conference tourism is eclipsed by the other
major product lines. Systematically cultivated through the development of tailored products,
the business and conference product line holds potential. Likely to have disposable income,
business and conference travelers here can be tempted to stay longer and spend more, such as
by taking a weekend on the coast or taking a safari package (Zutt, 2010).
The industry is a major source of government revenue in the form of taxes, duties, license
fees, entry fees among others (GoK, 2012). It is also a significant employer in both formal
and informal sectors (Zutt, 2010). Due to its linkage with other sectors, MICE industry has a
very high multiplier effect which is highly felt by the multi-sectors of hospitality services and
the economy as a whole (GoK, 2012).
According to Odunga et al. (2011), there are over 2000 meetings, incentive travel,
conference and events/ exhibitions (M.I.C.E) facilities in form of hotels, lodges, learning
institutions, Conference/Convention centers and Stadia all over the country concentrated in
the major towns, along the coast and national parks, all with conference facilities of varying
capacities. In addition to the above public learning institutions have by virtue of their core
business constructed to provide venues of information and knowledge exchanges in form of
lecture theatres and seminar rooms. These facilities have been used as secondary source of
income for these institutions through hiring to the local market for conferences, meetings and
seminars. On the other hand stadia have been able to cater for demands of huge crowds
especially for political and religious functions (Rotich, Nthiga, Bor & Logola, 2012).
The Kenyatta International Conference Center, United Nations office in Nairobi, Gigiri,
Safari Park Hotel in Nairobi and the Whitesands hotel and Sun-n-sand hotel in Mombasa
have been and still are the strong forces behind development of conference tourism, coming
out as the main host venues for most of the international events / conferences coming to
Kenya (Odunga et al, 2011). In the recent past, a host of other hotels and institutions of
higher learning in the country have been also instrumental in hosting meetings and events
(Victoria Safaris, 2007).
Page 18
5
KICC has been distinguished it as a premiere meeting venue all through the region, it has
been the only facility of such stature in Eastern and Central Africa (Rotich et al., 2012).
According to KICC (2013), the facility boasts of being the largest facility in conference
tourism industry South of Sahara and the North of Limpopo and hence why most regional
and international conferences have been held including conventions of the UN organizations.
Located in the city center, KICC boasts of easy accessibility to and from most major hotels in
Nairobi. KICC has the capacity to hold large and small events, both indoors and outdoors.
Sound proof rooms with excellent ambiance, cleanliness and air conditioning compliment the
indoor events while expansive grounds, well-manicured lawns and a helipad in the tower
block compliment the outdoor events where dinners, galas, banquets cocktails can be held.
The facility also has an ultra-modern amphitheatre that in itself manifests contemporary and
tradition, which can host a capacity of 900 people a session. Technologically KICC has
sophisticated simultaneous translation equipment and fast speed internet access. The facility
also has various caucus rooms that conveniently serve as office space for secretariat co-
ordination and business center Internet accessibility for online delegates and registration
(KICC, 2013).
1.2 Statement of the Problem
Kenya’s MICE industry is characterized by low volume mix of domestic, intraregional, and
international business travellers (GoK, 2012). The demand for Kenya‘s tourism activities is
characterized by fluctuations (Zutt, 2010). In 2008, after a very strong year in 2007, demand
for these tourism activities recorded a significant drop. The Kenya Tourism Board reported
that the 40.25 percent drop in visitor arrivals from 2007 to 2008 led to a 20% drop in
revenues. According to the Kenya National Bureau of Statistics as quoted by Zutt (2010)
self-reported visitor arrivals by purpose of visit for 2008 were holiday; 77.8 %, MICE; 9.0%,
transit; 5.2%, and other; 8.0%.
The MICE industry is facing stiff competition which is expected to intensify with the
international brands such as Marriott hotel, Rezidor among others, eying the Kenyan market
(Sarova Hotels, 2011). These facilities will have their in house MICE facilities. The stand
alone facilities will have to package their products better in order to remain relevant when the
Page 19
6
competitors come on board. The competition is set to give consumers a variety of choices
when it comes to the consumption of the MICE products. Thus it is important to know the
factors that influence their choice when it comes to making a purchase/ consumption of a
particular product.
In 2010, conferences held in Nakuru town; one of the fastest growing towns in East Africa,
rivaled both Nairobi and Mombasa in terms of number of visitors (Sarova Hotels 2012) this
clearly depicts that consumers have begun sourcing for the MICE facilities out of major
cities. Thus we ought to understand the basis behind choice of such a place.
According to GoK (2012) MICE as a product line of the Tourism industry continues to face a
number of challenges which need to be addressed for the sector to attain its full potential.
Severe shortage of accommodation facilities in most parts of Kenya has exposed a great
weakness in this industry. Others include insecurity, untapped regional and domestic tourism,
narrow product diversity, inadequate hotel/bed capacity, inadequate skilled human resource
research and development, inadequate infrastructure support and environmental issues. Zutt
(2010) argues that other annual fluctuations in arrivals reflect the impact of macro-events,
such as political instability in the country and the global financial crisis.
There was little research on MICE products and the factors that drive the consumption of
these products. Most empirical studies on MICE products had been carried out in Asia,
Europe and the U.S with majority of these studies focusing on capacity issues for the already
existing MICE facilities (Yang & Gu, 2011; Girod, 2009; Zhang &Ying, 2008; GDI, 2012).
Other studies carried out in Kenya addressed other aspects of Tourism for example the
Impact of promotional strategies on consumption of Domestic Tourism products (Adhiambo
K, 2006). Therefore the purpose of this study sought to fill this existing knowledge gap with
a specific focus on factors influencing consumption of MICE products in Kenya.
Page 20
7
1.3 General Objective
The general objective of this study was to investigate the factors that influence the
consumption of MICE products in Kenya, a case of KICC.
1.4 Specific Objectives
The study was guided by the following research objectives.
1.4.1 To identify the influence of price on consumption of MICE products.
1.4.2 To establish whether promotional activities influence consumption of MICE products.
1.4.3 To investigate the influence of product attributes on the consumption of MICE
products.
1.4.4 To find out whether place influences the consumption of MICE products.
1.5 Justification of the Study
1.5.1 Entrepreneurs in Tourism and Hospitality Industry
Entrepreneurs will benefit from the information in this study in that it gives insight on the
factors that influence the consumption of MICE products in the country; a key factor to
consider while making investment decisions or decisions pertaining to sustainable growth of
their ventures. They will be able to devise ways of making their ventures more profitable.
1.5.2 Government Agencies
Government agencies particularly the Ministry of Tourism will benefit in that they will not
only gain insight into the drivers of consumption of MICE products but also gain insight on
the challenges facing this sector. This will enable them to formulate informed policies that
address the obstacles facing the MICE sector and make decisions that are geared towards the
development of the sector and Tourism industry at large as envisaged in the country’s
economic blueprint; The Vision 2030 .
1.5.3 Academic Scholars
Scholars will also benefit extensively from the information provided by this study and will
have a basis from which to build further arguments in the same field of study. The study will
enable researchers in Tourism field to identify the existing research gaps in the current MICE
Page 21
8
sector and undertake further research in order to add and enrich the existing empirical
information on the subject area.
1.6 Scope of the study
The study targeted corporate companies as well as institutions and bodies in politics and
governance in Nairobi County who regularly consumed MICE products at KICC in the
period of 2010-2012. Those who recorded as repeat customers with three and above times
within the said period were selected for study. This came to a total of 399 consumers out of
which 40 were studied. The study was then carried out between March 2012 to August 2012.
One of the limitations was time frame and the sample was limited to Nairobi County.
Another challenge was in reaching some of the respondents, while some claimed the
questionnaire was a bit lengthy, thus with some respondents the research assistants had to
know the questions and had to ask the questions in an interview format as they filled out the
questionnaire. Conclusions of this study are based on the research conducted for the KICCs’
clients; therefore they cannot be generalized to all MICE venues. However KICC is an
interesting case which can provide insight for future studies.
1.7 Definition of Terms
1.7.1 Meeting
It is a general term indicating the coming together of a number of people in one place, to
confer or carry out a particular activity. The frequency can be on an ad hoc basis or according
to a set pattern, as for instance annual general meetings, committee meetings, etc (Rogers,
2003; WTO, 2006 ).
1.7.2 Incentives
Incentive refers to a meeting event as part of a programme which is offered to its participants
to reward a previous performance (Wood & Brotherton , 2008).
1.7.3 Conferences
A conference refers to a participatory meeting designed for discussion, fact-finding, problem
solving and consultation. As compared with a congress, a conference is normally smaller in
Page 22
9
scale and more select in character - features which tend to facilitate the exchange of
information. The term "conference" carries no special connotation as to frequency. Though
not inherently limited in time, conferences are usually of limited duration with specific
objectives (Rogers, 2003; Odunga, Besloy, Nthinga, & Maingi, 2011).
1.7.4 Exhibition
Exhibitions refer to large-scale showcasing of products and services. Exhibitions can be trade
only, where attendees have to work in whatever industry is being showcased or can be
consumer or public, where anyone can attend (WTO, 2006).
1.8 Chapter Summary
This chapter presented the background of consumption of MICE products as informed by the
study’s general objective. It also details the problem statement in the Kenyan context and
outlines the general purpose or objective of the study as well as the specific objectives
guiding the study. Justification of the study is also presented specifically detailing the
beneficiaries of the study. The scope of the study is also presented as well as a definition of
operational terms used in the study.
Chapter two reviews past studies and literature as guided by the study’s specific objectives. It
discusses to detail the factors influencing the consumption of MICE products. Specifically, it
looks into how price, product attributes, promotional activities, and place or distribution as
the independent variables influence the consumption of MICE products; the dependent
variable. Chapter three looks into the research methodology adopted by the study in meeting
the research objectives. Chapter four presents the finding of the study with analyzed data
presented in charts and tables. Chapter five; the last chapter presents a discussion of the
study, the conclusion and the recommendations of the study.
Page 23
10
CHAPTER TWO
2.0 LITERATURE REVIEW
2.1 Introduction
This chapter explores past studies and literature on consumption of Meeting, Incentives,
Conferences, and Exhibitions (MICE) products and factors that influence the consumption of
these products. Specifically the chapter discusses the influence of price, product attributes,
promotional activities and place or distribution on consumption of MICE products. The
chapter closes with a summary of the discussions.
2.2 Influence of Price on Consumption of MICE Products
2.2.1 Pricing
Of the four “P’s” of marketing (product, place, promotion, price), pricing holds a unique
attribution to a seller’s profitability. Therefore, the strategic importance of pricing cannot be
overrated. Not only have companies been striving to seek effective pricing strategies, but
researchers have also been investigating buyers’ reactions to sellers’ pricing strategies
including their perceptions of price fairness (Herrmann, Xia, Monroe, & Huber, 2007; Xia,
Martin-Consuegra, Molina & Esteban, 2007).
Price is the term used to describe what customers actually pay in exchange for the benefits
accruing from a product or service (Dai, 2010). It is the value consumers place on the event
experience and are prepared to pay (Hudson, 2008). Pricing is the manual or automatic
method where prices are applied to sales and purchase orders. It is based on factors which
include, among others, the fixed amount on the commodity, specific vendor quote, quantity
break, price prevailing on entry, promotion or sales campaign, combination of several orders
or lines and the shipment or invoice date (Senguttuvan 2009).
Among the various pricing strategies, dynamic pricing has become a commonly practiced
price discrimination strategy used by sellers to maximize profits by charging different prices
for very similar or essentially the same products or services according to the amount of
money individual customer is willing to pay (Dai, 2010). Although dynamic pricing
Page 24
11
advocates are optimistic about the opportunities brought to sellers through such individual-
level price discrimination (Garbarino & Lee, 2003) dynamic pricing may lead to negative
emotional and behavioral reactions among customers (Xia et al., 2004).
According to Dai (2010), past research shows that consumers may perceive price differences
as unfair when they discover the difference is to their disadvantage (i.e., paying a higher
price than other customers or compared to past experience with the same seller).
Another common pricing strategy is the cost-plus pricing technique. This entails an increased
mark-up amount or percentage to the overall cost (Jones, 2007). Suggested retail pricing is
another widespread technique when it comes to pricing. This involves simply charging the
amount suggested by the manufacturer which is usually printed on the product or commodity
by the manufacturer (Jones, 2007).
Price is also used by the seller as a profit lever as it has proven to be the most effective for
this. According to Kotler et al. (2010), pricing is approached at three levels: the market,
industry, and transaction level. At the industry level, pricing focuses on the overall
economics of the industry which include consumer demand changes and supplier price
changes. This explains the common practice in various tourism destinations to set price based
on season for instance charging low prices when it is off peak season and there is less likely
to be a lot of visitors in order to attract more visitors. It also entails increase or decrease in
price as a result of increase or decrease of cost of raw materials/ supplier price. At the market
level, pricing is focused on the competitive position of the price in comparison to the value
differential of the product to that of comparative competing products. At the transaction
level, pricing focused on managing implementation of discounts away from the reference, or
list price. This occurs both on and off the receipt or invoice for customers (Kotler et al.,
2010).
The significance of price in choice of destination varies according to several factors such as
the definition of price, the number of explanatory variables, and the form of the demand
model used, exchange rate changes, the origin and destination location, and whether the cost
of transportation is included in the definition (Toth & David 2010). In their choice of
Page 25
12
destination, travelers consider price in terms of cost of living at the host destination
comparative to the costs of living at the origin and substitute destinations and regardless of
the quality of attractions on offer at the destinations.
Zang, Leung & Qu (2007) argue that international travellers are sensitive to price and before
settling for a particular destination, tourists tend to consider a variety of competing
destinations. The impact of destinations competing for customers has influence on the
demand for international tourism; this means that an increase in price in one destination
increase visitor numbers to alternate destinations. Price competitiveness according to Dwyer
& Forsyth (2008) is a fundamental factor in the overall tourism competitiveness of a nation
or a destination. It is also widely acknowledged that price is one of the most important
aspects of decisions on whether, and where, to undertake trips and therefore, imperative to
pay attention to the price competitiveness of a nation’s tourism industry, in comparison to
that of its competitors.
In the market, prices play a pertinent role in consumer decision making as they influence
where, when, what and how much consumers buy (Alba, Mela, Shimp & Urbany, 2009).
Kokkomaki, Laukkanen & Komppula (2009) argue that price continues to be a determining
aspect of consumers’ choice. Consumer price knowledge and expertise of an industry’s
prices, add to the ease at which consumers choose products (Hudson, 2008). They are
informed on the product assortment of a particular organization as well as discounted prices
on products through promotions and marketing.
Before settling for a particular destination, tourists tend to consider a variety of competing
destinations with price as a major factor (Dwyer & Forsyth, 2008). The impact of
destinations competing for customers has an influence on the demand for international
tourism; this means that an increase in price in one destination has been seen to increase
visitor numbers to alternate destinations (Lim 2006). This shows customer preference for a
cheaper location over a more expensive option.
According to Dwyer & Forsyth (2008), price competitiveness is a fundamental factor in the
overall tourism competitiveness of a nation or a destination and that there is widely
Page 26
13
acknowledged evidence that price is one of the most important aspects in decisions on
whether, and where, to undertake trips. It is therefore imperative to pay attention to the price
competitiveness of a nation’s tourism industry, as compared to that of its competitors, if the
industry is to prosper (Dwyer & Forsyth, 2008). It is imperative that locations ensure their
prices are competitive as compared to their competitors as price has shown to be a factor in
influencing potential customers’ choice in the location they visit or travel to. Some
organizations have been seen to cope well with increase in competition while others have
been unable to do so according to Crouch & Ritchie (1998).
2.2.2 Packaged Pricing
Packaging relates to the way a product and price are offered in the market. Hudson (2008)
posits that in the tourism and hospitality industry, packaging is the process of combining two
or more related and complementary offerings into a single-price offering. A package
according to him may include a wide variety of services, such as lodging, meals, entrance
fees for attractions, entertainment, transportation costs, guide services, or other similar
activities. Travel packages have become increasingly popular over the years (Kokkomaki,
Laukkanen & Komppula, 2009). This is so because they benefit both the consumer and
participating businesses by providing convenience and value to the consumer and added
revenue for businesses. Packaging according to Hudson (2008) provides several customer
benefits, including: easier budgeting for trips: the customer pays at one time and has a good
idea of the trip’s total cost; increased convenience, which saves time and prevents
aggravation; greater economy, as the cost to the customer is usually more economical than
purchasing the package components individually; the opportunity to experience previously
unfamiliar activities and attractions; and the opportunity to design components of a package
for specialized interests.
2.2.3 Price Awareness or Knowledge
According to Aalto-Setala & Raijas (2003), price awareness or price knowledge is the ability
of buyers to estimate prices of products or services accurately. It is the ability of buyers to
estimate the price at which a seller/ sellers are selling a product or service. Garbarino & Lee
(2003) affirm that price is always a significant attribute in consumer’s decision-making
Page 27
14
process. Lovelock and Wirtz (2007) submit that customer satisfaction is directly influenced
by price perceptions and indirectly influenced through the perception of price fairness. Thus,
price fairness itself and the way it is fixed and offered have a great impact on satisfaction.
2.3 Influence of Product Attributes on Consumption of MICE Products
2.3.1 Product
A product is anything that can be offered to a market to satisfy a need or a want (Kotler,
2010). Products include physical goods, services, events, experiences, places, properties,
persons, organizations, ideas, and information. Products have proven to be a key element in
market offering and any company that wishes to be successful should be well aware of this.
Consumers judge a seller’s products by three basic elements which are product features and
quality, services mix and quality, and appropriateness of the price. It is thus necessary for
sellers to think about these factors and the level of their products’ quality, features, and
benefits. A product has to meet customers’ needs or wants. Sellers have to ensure that three
elements, the product, services, and price are harnessed into an attractive offering for the
consumer in order to be successful in the marketplace (Kotler, 2010).
Pichler (2010) posits that product attributes are the essential properties a product has in order
to meet consumers’ needs. He adds that attributes that meet several needs are more important
and should be prioritized. Product attributes include quality of the product i.e. the quality of
performance of the product/ the ability of the product to perform its functions, consistency of
the product in performing its functions i.e. being free of defects and being able to deliver a
certain level of performance consistently. Other attributes include the features of the product
i.e. the additions to the product that make it perform to a high level (Kotler, 2000).
Product attributes also include the brand, packaging, and the style and design of the product.
Style and design entails the appearance which has no effect on performance. The brand, on
the other hand, represents a unique name, symbol, or design that shows the seller of the
product enabling consumers to differentiate a product from a competitors’. It could also lead
to consumers identifying with a particular organization because of the product. Packaging
Page 28
15
entails the container or wrapper of a product. Packaging is an important marketing tool as it
attracts attention to store shelves e.g. a product packaged in an interesting way could attract a
potential customers attention. Other product attributes include labeling and support services
that are sold together with the product. Labeling is also a part of packaging and it identifies
the product, describes things about the product, and it also includes active graphics that serve
to promote the product (Kotler, 2000).
2.3.2 Capacity and Equipment
The effectiveness of planning the marketing mix depends as much on the ability to select the
right target market as on the skill in devising a product which will generate high levels of
satisfaction (Kotler, Kevin & Manceau, 2012). For a conference or meeting, the marketing
team of the institution prospecting to hold the event must have a much deeper knowledge of
the product/ venue at their fingertips (Baum et al. (2009). In terms of delegate capacity, a
room will vary according to the different possible seating plans, and it is essential to know
how many delegates can be comfortably seated in each variation of the seating plans ;theatre
style, classroom, boardroom style, U-shape, banquet, reception (British Tourist Authority,
2008).
Some meetings or conferences may need an accompanying exhibition, either in the same or
an adjacent room. They may have a particularly heavy piece of equipment to display,
therefore issues such as the load-bearing strength of the flooring must be considered.
Questions of great importance to the consumer of a MICE venue according to British Tourist
Authority (2008) include: what is the shape of the room? How many doors are there? Are
they lockable? How is the ceiling? How is the room lit? Where are the overhead lights? How
many electrical, lighting, telephone and Integrated Service Digital Network (ISDN) outlets
there are in the room and exactly where they are located? Is there a teleconferencing facility?
Is the venue/ room accessible to the disabled? Where are the toilet facilities and wash basins
in relation to the meeting room? How easy is it to evacuate the room, if there is an
emergency?
Page 29
16
Baum et al. (2009); Kokkomaki, Laukkanen & Komppula (2009) argue that conferencing
attributes that influence the choice of a venue are good standard of décor and facilities,
accessibility to road links, cleanliness of the facility, availability of a dining facility and
convenient or free parking. Previous satisfactory experience is a relatively important attribute
that guide the consumer in choice of the venue; and these attributes enhance the overall
quality of experience. Accessibility, attractions and entertainment, destination image,
affordability, availability of facilities, safety and security and quality of service are attributes
commonly identified by past studies to influence the choice of a venue or destination
(Lawrence & McCabe, 2001).
2.3.3 Product Availability
Kotler (2010) posits that product availability is a major factor when it comes to customers’
choice. This according to Conlon & Mortimer (2010) is due to the impact demand and cost
considerations have in many markets, predominantly those for which storage costs or
capacity constraints matter. Jones (2007) argues that MICE consumers prefer buying from
organizations whose product availability is assured. According to him, complete run-outs
cause inconveniences and lack of trust in loyal customers when they fail to get stocks of their
requirements. In addition, product and service availability serve as a measure of supplier or
retailer reliability.
2.3.4 Product Accessibility
According to Zang, Leung & Qu (2007) destination accessibility is essential and influences
the preference of consumers of MICE products. Toth & David (2010) posit that in tourism,
accessibility is a function of distance from centres of population which comprise of tourist
markets and of external transport that enables one to reach the specific destination. It is
measured in terms of distance traveled, cost involved and the time taken to reach the
destination. For some business travelers however, the destination accessibility is less
important in regard to incentives for travel. This is because a certain degree of difficulty in
accessibility of a destination may give meetings a certain degree of originality and
exclusivity that could help influence on the emotions and enthusiasm of participants (Toth &
David, 2010).
Page 30
17
2.3.5 Security
According to Opperman (2006) customer choice of MICE products is also influenced by the
level of security available. Security as indicated by Zutt (2010) is the condition of being
protected against danger or loss. It is a concept similar to safety; being protected from
dangers that originate from outside and individuals or actions that encroach upon the
condition of protection are responsible for the breach of security.
Mansfeld & Pizam (2006) argue that consumer's view of security is not always directly
related to actual security. Sometimes, if it is perceived that there is security then there is an
increase in actual security, even if the perception of security is mistaken. Occasionally due to
posting of security signs by malicious persons, consumers are deterred by the notion that
there actually is security. Usually when there is actual security present in an area, advertising
this security increases its efficiency (Zutt, 2010). According to Mansfeld & Pizam (2006)
different MICE locations pose different security concerns to consumers and concern for
crime and safety, whether real or perceived, negatively affect tourism behavior, thus
influencing choice of destination and experience satisfaction.
2.3.6 Brand Preference
A name, symbol, term or a design or a combination of them is referred to as a brand. These
are all intended to enable prospective customers differentiate the commodities of one
company from those of its competitors (Keller, 2003). A brand is a trademark which comes
into the mind of the consumer and enables them to embrace specific appealing sets of values
and attributes; both tangible and intangible (Kotler, 2010). With the growing realization that
brands are one of a company's most valuable intangible assets, branding emerged as a top
management priority in the last decade. Given its highly competitive nature, branding is
especially important in the retailing industry as it influences customer perceptions, shopping
destination choice as well as consumer loyalty (Ailawadi & Keller, 2004).
Kotler, (2010) argues that a good brand suggests something about the product's quality and
characteristics. It should be easy to pronounce, recognize and remember; distinctive and not
easy to confuse with others. It should not carry poor meaning in other countries causing
Page 31
18
misinterpretations. Ailawadi & Keller (2004) submit that retail consumers prefer strong
brands and it is common practice to find strong brand advertising on and within retail outlets.
Similarly, most MICE products are well branded and MICE consumers tend to prefer strong
brands (Boniface & Cooper, 2005).
2.4 Influence of Promotional Activities and Consumption of MICE Products
2.4.1 Promotion
Promotion is synonymous with marketing to many people; it is the visual face of marketing.
However, promotion is simply one element of the marketing mix, fulfilling the function of
making potential customers want to purchase a particular product (Hudson, 2008). Marketing
a MICE venue does not differ in principle from the marketing of any other product or
service: first, define what you have to offer, then identify your market segment and finally
promote your product to potential customers (Baloglu & Love, 2005).
Promotion of MICE venues is concerned with reaching prospective visitors via expenditure
on a promotional mix intended to achieve destination awareness and influence prospective
customers’ attitudes and purchasing behavior (Getz, 2008). The promotional campaigns of
most destination marketing organizations (DMOs) fall into three main categories: traditional
image or brand-building campaigns, which aim to build or/and maintain awareness of the
destination; strategic campaigns, aimed, for example, at attracting visitors in the shoulder
season; and ‘damage control’ campaigns (Crouch & Louviere, (2004). Media investment in
attracting tourists has grown rapidly in recent years, and most destination marketing
organizations are involved in a range of promotional activities (Brassington, 2011).
2.4.1.1 Advertising
Chen (2006) submits that advertising is used to establish a basic awareness of the product or
service in the minds of the potential customer and to build up knowledge about it. Kotler
(2010) sees advertising as one of the four key tools organizations employ to direct persuasive
communications so as to entice buyers and the public. Specifically, the objective of
advertising is to enhance potential buyers’ responses to the organization and what it offers. It
Page 32
19
seeks to provide information, by channeling desire, and by supplying reasons for a consumer
to opt for a particular organization’s offer (Chen, 2006).
Kotler (2010) further argues that the primary purpose of advertising thus is to create
awareness of the product or service and provide information that enables the consumer to
decide on what to purchase and eventually develop brand loyalty. As a result, many
organizations spend a large sum of money on advertising and brand management. Hudson
(2008) submits that due to the challenge of limited budgets most destinations’ ads are placed
in print media rather than on the more expensive, but more effective, medium of television.
Most resort advertising for example is seasonal and takes place when it is thought potential
visitors will be making their holiday decisions. Hudson (2008) further argues that the
majority of ads seek to encourage potential consumers to request a copy of the destination’s
brochure, although more recently ads have been created to drive the audience to a destination
website or to combat tourism crises.
2.4.1.2 Press and Public Relations
According to Adhiambo (2006), Press and Public Relations play a significant role in
marketing of destinations and influencing the consumer’s choice of the destination. Most
destinations use familiarization trips, celebrity visits, press releases, product placement and
television broadcasts to attract attention and improve their image with the general public
(Boniface & Cooper, 2005). For agencies that have limited budgets (Zang, Leung & Qu,
2007) this low cost form of promotion is particularly attractive. Promotional videos are also
often used as a sales tool by destinations.
2.4.1.3 Personal Selling
Hudson (2008) argues that relatively little personal selling is carried out by destination
marketing agencies. However, some destinations find personal selling to be the most
effective communication tool in promoting to key travel decision-makers and influencers in
the travel trade, such as corporate travel managers, convention or meeting planners, tour
operators and retail travel agents. According to Dai (2006), the purchasing power of these
Page 33
20
groups is impressive, and there are relatively few of them, which justifies the added expense
of personal selling.
In 2005 for example, the Kenya Tourist Board launched the Fall 2005 Roadshow in order to
increase awareness of the destination across the US. Along with 20 tour operators from
Kenya, members of the tourist board visited travel agents in Arizona, Florida, Los Angeles,
New York and Texas, in order to educate them on the virtues of travelling to Kenya. At the
same time, an extensive network of newly appointed global market representatives were
employed in Kenya’s key markets in Europe, the US and Asia. Their role was to raise the
profile of Kenya among trade representatives and consumers by emphasizing the quality and
diversity of the country (Adhiambo, 2006).
2.4.1.4 Sales Promotion
Davidson (2007) argues that due to the lack of control over the destination product and
pricing, sales promotions are used relatively little in destination marketing. However, ‘added
value’ promotional offers may be made available, featuring elements of the destination
product over which the destination marketing agency does have control.
Many DMOs according to Hudson (2008) exhibit at travel trade shows, fairs, exhibitions or
conventions. Generally these occasions bring all parts of the industry together exerting some
high degree of consumer influence on choice of venues and destinations (Chen, 2006). Such
events may be annual, or used as a short-term tactic to boost tourism interest. In October
2006 for instance, Zimbabwe opened an international tourism fair to promote its once
booming resorts, largely deserted because of President Robert Mugabe’s controversial
politics (Odunga, et al., 2011).
2.4.1.5 Customer Awareness
Page & Connell (2006) submit that customer awareness forms an essential part in improving
knowledge of MICE products amongst customers. Marketers usually employ customer
awareness programs to create consumer awareness. These usually are in the form of bill-
boards, posters, brochures as well as direct marketing through the internet. Hudson (2008)
posits that brochures are produced for both promotional and informational purposes, although
Page 34
21
both functions may be served by a single brochure. As well as a general brochure covering
the whole destination, a range of others may also be offered. These may cover smaller
geographical entities within the overall region. Alternatively, they may be targeted at specific
market segments (Hudson, 2008).
Pearlman (2008) argue that it is important for a marketing manager to consider using social
networks as a marketing tool. The benefits of using social media are that they enable meeting
planners expand networking and maintain relationships with participants and suppliers
(Swarbrooke & Horner, 2007). Social media facilitate for a competitive edge for meeting
planners who design educational programs as they are able to obtain instant feedback. More
important, it enhances customer service and develops new business and sponsorship
opportunities (Lovelock & Wirtz, 2007).
2.5 Influence of Place/ Distribution and Consumption of MICE Products
2.5.1 Distribution System
An organization’s distribution system is centered on the ‘place’ aspect of a company’s
marketing mix. Its purpose is to provide an adequate framework for making a company’s
product or service available to the consumer. In the tourism industry, distribution systems are
often used to move the customer to the product (Hudson, 2008). Place or distribution is
concerned with how business travelers or tourists actually purchase the products they need.
There are two dimensions to this: one, customers can buy whole packages such as an
incentive travel package or individual elements such as air tickets, venues and
accommodation and two, customers can purchase products directly or make use of the
services of specialist intermediaries (Kokkomaki, Laukkanen & Komppula, 2009).
2.5.2 Distribution Channels (Direct and Intermediaries)
According to Sa´nchez, Callarisa, Rodrı´guez, & Moliner (2006), Lee & Back (2005) a set of
attractive packages could be one reason to use the services of specialist intermediaries.
Intermediary organizations, destination marketing organizations (DMOs) or convention and
visitor bureaus (CVBs) create bundles of different services, which offer a total experience for
Page 35
22
the person who attends a meeting at that certain destination. Usually the intermediary offers
services in selecting hotels or a special theme for the meeting, organizing activity or
transportation services for a meeting. When associations arrange a meeting they pay special
attention to the availability and attractiveness of the venue (Fenich, 2005). Specialist
intermediaries have an overall knowledge of the destination services, which is respected by
the meeting planners.
According to Kotler & Armstrong (2000), organizations use intermediaries because they are
more efficient at making goods available to target markets. Intermediaries are also used
because of their experience, specialization, contacts, and because of the largeness in scale of
an operation. Intermediaries connect producers’ products to satisfy consumers’ demand thus
connecting the supply with demand. Intermediaries bundle up various producer products
which are produced in large quantities and offer the products that a specific consumer
requires thus matching supply with demand. Kotler & Armstrong (2000) posits that
intermediaries are used because they are more efficient at making goods available to the
target market. This is especially true for tangible products which need to be transported or
physically moved from the producer to the consumer.
Distribution channel moves goods and services from producers to consumers (Kotler &
Amstrong, 2000). A distribution channel performs the work of moving goods from producers
to consumers, overcoming the time, place, and possession gaps that separate goods and
services from those who need or want them (Kotler, 2010). Distribution channels help to
complete transactions by gathering information and market research, carrying out promotion,
getting contacts, matching a buyer’s needs to the products being offered by sellers, and
negotiation of price and terms so that the transaction is completed. Distribution channels also
help fulfill completed transactions by physical transportation of the goods from the buyer to
the seller as well as assuming the risks of transferring the product. If producer does the
channel work for themselves, they could add the cost to the price as a part of production,
whereas if an intermediary carries out the channel work, they could add a markup to the
product increasing the final price. They could also charge a fee for their service (Kotler &
Armstrong, 2000).
Page 36
23
Choice of distribution channel is one of the most critical for any organization according to
Kotler (2010). One of the reasons for this is because they often involve long term
commitment to other firms. The distribution channel chosen could also affect price of the
product for example a direct web presence is much cheaper than using an intermediary to
distribute a product. It is essential for organizations to choose the most efficient distribution
channel to reduce distribution costs and a huge increase in the price of the product which the
consumer pays (Kotler & Armstrong, 2000).
According to Kotler & Armstrong (2000) the different distribution channel levels in
marketing are differentiated by the number of participants in the channel. There has to be at
least two participants which are the producer and the consumer who both have to exist in
order for a transaction to take place. B2C marketing channels are categorized into direct and
indirect marketing channels. Direct marketing channel entails distribution from the producer
directly to the consumer. Indirect marketing channels involve the presence of wholesalers or
retailers as the product moves from the producer to the consumer. A B2B marketing channel
involves the producer dealing with an appointed or an industrial distributor to get the product
to the consumer.
According to Kokkomaki et al., (2009) the most often used intermediary services are
destination information, referral services and lead services. Intermediaries have also made
information search quite easy for customers because intermediaries web sites are a cost
effective way to give updated information quickly and the information is available very
easily for meeting planners (Fenich, 2005). However, Weber (2001) argues that many
meeting planners prefer to deal directly with suppliers instead of using intermediaries.
Sa´nchez, Callarisa, Rodrı´guez, & Moliner (2006), state that the distribution decisions of the
tourism package and professional personnel of the intermediary organization are essential:
the skills of the personnel affect their functional value. Fenich (2005) argues that instead of
organizing a meeting, an intermediary’s task is to help meeting planners to use the
destination’s services and plan a suitable combination of these services. According to
Kokkomaki, Laukkanen & Komppula (2009) the intermediary’s role is also to work with
Page 37
24
meeting planners and develop a destination’s image as an attractive destination for meetings.
Buying a packaged service may save a customer cost, time and effort.
Kotler & Armstrong (2000) submits that one of the functions of a distribution channel is
matching the buyer’s needs to the product being distributed. This involves shaping and fitting
the offer to the buyer’s needs in activities such as assembling and packaging. Kotler &
Armstrong (2000) also posits that a distribution channel is required to carry out promotion
activities. That is developing and spreading information and communication that is
persuasive to consumers about the products on offer.
Fenich (2005) stresses that companies usually do not use an intermediary to organize a
meeting close to their location. They book conference facilities for example from a hotel or
from an educational institution. But when a meeting gathers people from provinces or from
the whole country, meeting planners more commonly use intermediary organizations,
because the meeting requires organizing transportation, accommodation, conference facilities
and some entertainment Sa´nchez et al., (2006).
2.5.3 Contacts and Negotiation
Hudson (2008) argues that in order for a company’s distribution system to operate
effectively, members must perform the key functions one of which is contact; is important
that the company establishes contact with its target market in order to be able to
communicate effectively the benefits of its product. It is important that consumers are able to
contact the organization in order for them to acquire the services/ products they need. Two,
negotiation; of high-quality arrangements and contracts is key to any business relationship- it
is important to negotiate agreements with regard to price, operating procedures and other
issues that may arise among the system’s participants. It is important that the seller and the
consumer reach an agreement on price and other terms of the offer so that possession/
ownership of the product can be transferred (Kotler & Armstrong 2010). Kotler; Kevin &
Manceau (2012) submit that physical distribution is equally important and argue that a
distribution system cannot be effective if there are no means of actually delivering the service
Page 38
25
to the consumer- the service provider is responsible for ensuring the successful distribution
of its product at this stage.
2.6 Chapter Summary
The chapter reviewed literature on factors influencing the consumption of MICE products. It
explored at length the influence of price, product attributes, promotional activities and place
or distribution on consumption of MICE products. The next chapter presents and discusses
the research methodology adopted by the study.
Page 39
26
CHAPTER THREE
3.0 RESEARCH METHODOLOGY
3.1 Introduction
The purpose of the research was to gain insight on the factors influencing consumption of
MICE products in Kenya. In this chapter, the research design and methodology that the study
adopted are described. Specifically, the chapter looks into the research design, the target
population, geographical area, sampling procedure, pilot testing issues and data collection.
3.2 Research Design
The study adopted descriptive research design. This design was ideal for the study because
the methods involved in descriptive research as described by Mugenda & Mugenda (2003)
include survey, which describes the status quo, and correlation study which investigates the
relationship between variables. Descriptive design also determines and reports the way things
are and attempts to describe such things as possible behavior, attitudes, values and
characteristics (Mugenda, 2008). The design also has enough provision for protection of bias
and maximized reliability (Kothari, 2008).
Descriptive research design has also been used by Girod (2009) in analyzing the
development of the MICE industry. Odunga et al., (2011) used descriptive research in their
study of conference tourism in Kenya; in which they sought to determine and describe “the
characteristics of the variables of interest”. In reference to consumption of MICE products,
the study’s dependent variable was consumption of MICE products while the independent
variables included: price, product attributes, promotional activities, and place.
3.3. Population and Sampling Design
3.3.1 Population
According to Kombo & Tromp (2006), a population includes all people, items or a set of
elements having a common observable characteristic that the research focuses upon and to
which the results obtained by testing the sample can be generalized. Kothari, (2004) posits
that target population refers to the entire group of individuals or objects to which researchers
Page 40
27
are interested in generalizing the conclusions. For this study, a total of 399 corporates,
political parties and other institutions situated in Nairobi that consume MICE products at the
Kenyatta International Conference Centre (KICC) constituted the target population.
3.3.2 Sampling Design
3.3.2.1 Sampling Frame
This is the list of ultimate sampling entities which may be people, households, organizations
or other units of analysis (Mugenda, 2008). Kothari (2008) posits that a sampling frame is a
physical representation of the target population and comprises all the units that are potential
members of a sample. After defining the target and study populations, a sample is selected
from the study population. To select a representative sample, a sampling frame is selected.
In some situations, a sampling frame does not exist or it would require more time and
resources to compile. The importance of the sampling frame is stressed by Bernard (2002)
who observes that in many practical situations the sampling frame is a matter of choice to the
survey planner, and sometimes a critical one. To meet the expectation of the sampling theory
that all possible units in the target population be identified to enable probability for selecting
a sample combination, KICC provided a ‘three- year’ list (2012, 2011, and 2010) of MICE
products consumers particularly those located in Nairobi.
3.3.2.2 Sampling Technique
Sampling technique according to Kothari (2004) is the procedure a researcher uses to gather
people, places or things to study. In this study therefore, 40 consumers of MICE products at
KICC were sampled using purposive sampling technique. Purposive sampling method is a
deliberate non-random method of sampling which aims at selecting a sample of people,
settings or events with predetermined characteristics (Cooper & Schindler, 2003). Consumers
of MICE products at KICC were selected with a preference to repeat customers for the period
2010-2012. Respondents refer to those who respond to the research instruments (Kothari,
2004). In this study, 40 consumers of MICE products at KICC were the respondents.
Page 41
28
3.3.2.3 Sample size
When it is not feasible to study the entire population, sampling is appropriate. A sample is a
part of the target or accessible population that has been procedurally selected to represent it
(Cooper & Schindler, 2003). Kothari (2008) defines a sample size as the number of items to
be selected from the universe or the population to constitute a sample. Mugenda & Mugenda
(2003) states that for descriptive studies 10% of the accessible population is a representative
sample. This implies that out of the target population of 399 institutions, 40 formed the
sample size for this study.
3.4 Data Collection Methods
Primary data was collected from the respondents using the questionnaire which was
administered by the researcher and trained assistants. The questionnaire adopted both open-
ended and closed-ended questions. This is so because according to Burns & Grove (2005), a
questionnaire with open-ended and closed- ended questions allows every possible question to
have a response. The questionnaire was structured in six parts: general information, price,
product attributes, promotional activities, place and consumption of MICE products.
The Likert scale was used to collect the psychometric responses (Mugenda, 2008) on factors
behind the need for MICE products, choice of MICE venue, product attributes and the
various factors influencing choice of product, influence of promotional factors, distribution
issues and factors influencing choice of distribution channel as well as the status of Kenya’s
MICE industry.
3.5 Research Procedure
A pilot study was carried out to test the effectiveness, validity and reliability issues of the
research instrument. The objective of conducting a pilot test is to detect weakness in design
and instrumentation and to provide alternative data for selection of a probability sample
(Kothari, 2008). According to Mugenda & Mugenda (2003), the purpose of pre-testing is to
ensure that items in the tool bear the same meaning to all respondents and to assess the
average time that is required to administer the instrument. Pilot test ensures validity and
reliability of the instrument (Kumar, 2005).
Page 42
29
The questionnaire was administered to eight respondents and the responses checked against
the research objectives. The results and recommendations of the pilot test were used to
further develop the instrument. Mugenda & Mugenda (2003) posit that 1 -10% of the target
population is subject to pilot study. As such 8 respondents; 2% of the target population was
used in the pilot study.
Joppe (2000) argues that it is vital to determine whether the research truly measures that
which it is intended to measure or determine the truthfulness of the results. This is basically
achieved through the measure of validity and reliability of the research instrument. Mugenda
(2008) describe validity as the accuracy and meaningfulness of inferences which are based
on research results; the degree to which results obtained from the analysis of the data actually
represent the phenomenon under study. The usual procedure of assessing validity is to use
professionals or experts in the particular field Mugenda (2008). To this end, validity in this
study was determined by use of face validity expert judgment where the items in the
instrument were discussed with the professionals and scholars in the field of tourism at
United States International University (USIU). Specifically, the questionnaires were
administered to 5 scholars (including the researcher’s supervisor). They indicated against
each item in the questionnaire whether it measured what it is meant to measure or not.
Content validity index of those that measured was then computed (0.72) where according to
Liptak (2005) an index of above 0.5 implied that the instrument was valid.
According to Neuman (2000); Mugenda (2008) reliability is a measure of the degree to
which a research instrument yields consistent results or data after repeated trials. Reliability
of a research instrument according to Coleman & Briggs (2002) is the probability that
repeating a research procedure or method would produce identical or similar results. To test
the reliability of the instrument to be used in this study, internal consistency technique was
used where the internal consistency of data was determined from scores obtained from a
single test administered by the researcher to a sample of subjects. Cronbach’s Coefficient
Alpha was then computed (they were all greater that 0.7) to determine how the items
correlated among themselves (Mugenda, 2008). An alpha of 0.6 to 0.7 indicates acceptable
reliability while 0.8 or higher indicates good reliability (Cronbach, Lee, & Richard, 2004).
Page 43
30
Before collection of the data, an introductory letter indicating the purpose of the study was
presented to the management of the targeted respondents for their consent and approval to
collect data on their institutions. Thereafter, the questionnaires were administered by the
researcher and trained data collection assistants to the respondents in view of clarifications to
the respondents if need be. Questionnaires were then left with the respondent to be collected
at a later date/ time. The questionnaire administrators however, worked towards collecting
the questionnaires upon issue where possible so as save time. Each respondent received the
same set of questions.
3.6 Data Analysis Methods
Descriptive statistics was used to analyze quantitative data. Descriptive statistics provides for
meaningful distribution of scores using statistical measures of central tendencies, dispersion
and distribution (Kothari, 2008). As such, percentages, and measures of dispersion were
employed to allow for simpler interpretation of the data. The importance of using percentages
is that they simplify data by reducing all the numbers to range between 0 and 100, and they
translate the data into standard form with a base of 100 allowing for relative comparisons and
easier interpretations of the data (Cooper & Schindler, 2008).
Statistical Package for Social Sciences (SPSS) was used to aid the processing and analysis of
the data collected. Muijs (2004) describes SPSS to have capability of offering extensive data
handling and numerous statistical analysis routines that can analyze small to very large data
statistics. Cross- tabulation technique was employed where data was coded, interpreted and
the frequencies determined. This technique is significant particularly in comparing two
classification variables using tables with rows and columns that correspond to the level or
values of each variable’s categories (Cooper & Schindler, 2003).
Inference Statistics was used. Regression analysis was used to show the relationship between
variables i.e. to ascertain the causal effect of one variable upon another while Pearson
product-moment correlation was used to show whether the relationship between the variables
was significant thus generalize the results of analysis to the population. This is because the
variables studied were measured at ratio or interval scales and were continuous (Muijs,
2004). The advantages associated with multiple regression analysis according to Lewis-Beck
(1995) are that the process offers a more accurate explanation of the dependent variable in
Page 44
31
that more variables are included in the analysis, and that the effect of a particular independent
variable is made more certain, since the possibility of distorting influences from other
independent variables is removed.
The following regression model guided the study.
CoMICE=β0 + β1(P) + β2 (PAt) + β3(PAc )+ β4(P) + ℮
Where
CoMICE is Consumption of MICE products (dependent variable)
P is Price
PAt is Product Attributes
PAc is Promotional Activities
P is Place
While ℮ is the error of prediction
β0 is a constant which is the value of dependent variable when all the independent variables
are 0.
Qualitative analysis was made possible by use of likert-scale which according to Nordin
(2009) helps to minimize subjectivity. The likert-scale as described by Mugenda & Mugenda
(2003) is commonly used because of its capability to measure attitude, perception, values and
behavior. These basically, are numbers and descriptions which are used to rank the subjective
and intangible components in research (id). Frequency tables, graphs, bar and pie charts were
used to present the analyzed data.
3.7 Chapter Summary
This chapter has presented the methodology employed by the study. It has discussed in detail
descriptive research design and justification for its adoption, the geographical area and
justification for the choice of the area, the target population (399) as the institutional clients
of KICC for the period of 2010-2012, sampling frame; the list provided by KICC, the sample
Page 45
32
size of 40 as the 10% recommended by Mugenda & Mugenda (2003) and the sampling
technique; purposive. The chapter also looked into the data collection methods, details the
pilot study as well as analysis and presentation of data. The next chapter presents the results
and findings of the study.
Page 46
33
CHAPTER FOUR
4.0 RESULTS AND FINDINGS
4.1Introduction
This chapter presents the analysis and interpretation of the research findings. Descriptive
statistics were used to analyze the data; presented in frequency tables, charts and graphs.
Correlation and regression analysis was done to determine the relationships among the
variables. The study sought factors influencing the consumption of MICE products in Kenya.
4.2 General Information
4.2.1 Category/Industry of Operation
The study sought to investigate the industry in which the MICE consumers operate. Majority
(47.1%) of the respondents were in the Banking industry, those operating in Tourism and
hospitality industry came in second with 32.4% while those operating in Housing and
construction came in third with 8.8%. Few were in Medical and Politics and governance
recording 1% each. The study therefore observes that the banking industry takes the lead in
consumption of MICE products.
Table 4.1 Category/Industry of Operation
Category Frequency Percent
Banking 16 47.1
Manufacturing 1 2.9
Housing and Construction 3 8.8
Medical 1 2.9
Tourism and Hospitality 11 32.4
Politics and Governance 2 5.9
Total 34 100.0
Page 47
34
4.2.2 Events Commonly Held
The study sought to investigate the events commonly held by the respondents. Majority
(44.1%) of the respondents held exhibitions, while 26.5% and 20.6% held conferences and
meetings respectively. Few (3%) recorded incentives. The study therefore observes that
exhibitions, conferences and meetings are the most consumed MICE products; ranked in that
order.
Table 4.2 Events Commonly Held
Event Frequency Percent
Meetings 7 20.6
Incentives 3 8.8
Conferences 9 26.5
Exhibitions 15 44.1
Total 34 100.0
4.2.3 Reasons for Holding the Events
The study also sought to investigate the reasons why the respondents held the events.
Majority (47.1%) held the events for the basic reason of complying with the law
requirements while 20.4% held the events for the purposes of employee or member
development. Few, 14.7% and 8.8% held the events for the purposes of launching new
products and strategic reasons respectively. This study therefore, observes these three factors;
legal and regulatory frameworks/ the need to comply with law requirements, new product
launch, and employee/member development (the need to grow and expand a community of
members, as key demand drivers to consumption of MICE products.
Page 48
35
Table 4.3 Reasons for Holding Events
Reason Frequency Percent
It is a requirement by law 16 47.1
Constantly launching new products 5 14.7
For strategic purposes 3 8.8
Employee/member development 10 29.4
Total 34 100.0
4.2.4 Venues Hired for Events
The study sought to investigate the venues where the respondents held the events. Majority
(32.4%) of the respondents held their events at Sarit Center while 20.6% held their events at
Safari Park Hotel. Few (17.6%) recorded KICC as the venue where they held their events
while a few (8.8%) sought other venues such Intercontinental Hotel, Strathmore Business
School, Panafric Hotel and other venues in the outcast of Nairobi. The study observes that
Sarit Center, Safari Park Hotel, and KICC (ranked in that order) take the lead in hosting
meetings, conferences and exhibitions. Other preferred venues include Intercontinental Hotel,
Panafric Hotel and Strathmore Business School.
Table 4.4 Venues Hired for Events
Venue Frequency Percent
KICC 6 17.6
Bomas of Kenya 5 17.7
Safari Park Hotel 7 20.6
Sarit Center 11 32.4
KIA 2 5.9
Other 3 8.8
Total 34 100%
Page 49
36
4.3 Price and Influence on Consumption of MICE Products
4.3.1 Price Factors Influencing choice of Venue
The study sought to investigate how price factors influence the choice of venue. The findings
are summarized in table 4.6 below. Majority of the respondents (47%) strongly agreed that
the budget in place at the time of event greatly influences their choice of the venue in which
to hold the event. Majority (55.9%) also agreed that the ongoing promotions on the available
venues inform their choice of venue. Similarly, majority of the respondents (70.6%) strongly
cited the cost of the venue; space and facilities provided as a strong influencer of their choice
of venue. Majority (79.4%) however, went neutral on the ‘price factor’ that they receive
discounts and these discounts influence their choices of the venue. Majority of the
respondents (64.8%) and (50%) agreed that flexible payment terms and packages on offer
respectively, informed their choice of venue. The study observes that budget allocations,
ongoing promotions, cost of the venue and flexible payment terms are key components of
price factor influencing the choice of the MICE venue.
Table 4.5 Price Factors Influencing choice of Venue
Factor Strongly
Disagree
Disagree Neutral Agree Strongly
Agree
Total
Budget in place 0
(0%)
4
(11.8%)
2
(5.9%)
12
(35.3%)
16
(47 %)
34
(100%)
Ongoing promotions
3
(8.8%)
0
(0%)
1
(2.9%)
19
(55.9%)
11
(32.4%)
34
(100%)
Cost: space and
facilities
0
(0%)
0
(0%)
1
(2.9%)
9
(26.5%)
24
(70.6%)
34
(100%)
Discounts are offered
2
(5.9%)
0 (0%) 27
(79.4%)
3
(8.8%)
2
(5.9%)
34
(100%)
Flexible payment terms
1
(2.9%)
0 (0%) 1
(2.9%)
22
(64.8%)
10
(29.4%)
34
(100%)
Packages on offer 1
(2.9%)
0 (0%) 5
(14.7%)
17
(50%)
11
(32.4%)
34
(100%)
Page 50
37
4.3.2 Compare Prices before Making hire Decision
The study sought to find out whether the MICE products consumers under study compared
prices offered by different venues before making the decision to hire. Figure 4.1 below
represents the findings of the study. Majority (80%) of the respondents agreed that they
compare prices offered by different MICE venues before making their decision to hire. From
the findings, the study observes that the consumers of MICE products tend to compare the
prices offered by various service providers before making hire decisions.
Figure 4.1 Compare Prices Before Making hire Decision
4.3.3 Find the Prices of the MICE venues Dynamic
Figure 4.2 below represent the study’s findings on whether the MICE products consumers
under study find the prices of the venues dynamic. Majority (87%) were in agreement that
the prices of MICE venues are indeed dynamic while only 13% disagreed to the same.
Majority of those in agreement related the price dynamism to quality of service, location of
the venue and space particularly parking space. This implies price dynamism in the sector; a
factor that defines the sector’s demand and supply principles.
87%
13%
Yes
No
Figure 4.2 Find the Prices of the MICE Venues Dynamic
Page 51
38
4.4 Product Attributes and Influence on Consumption of MICE Products
4.4.1 Carry out Research on MICE venue before making the hire Decision
The study set out to investigate whether the respondents carry our research on the preferred
MICE venue before making the hire decision. Figure 4.3 below presents these findings.
Majority of the respondents (93%) said ‘yes’ to the statement that they carry out research on
the MICE venue before making the hire commitments. Few, (7%) do not carry out this
research. Those who carry out the research do so for reasons of efficiency and effectiveness
in regard to service delivery. The study therefore, makes an observation that MICE
consumers are very keen on the ‘product’ on offer and will scrutinize the product to detail to
ensure that it matches or meets their needs.
Figure 4.3 Carry out Research on MICE Venue Before Making the hire Decision
4.4.2 Extent of Influence of Product Attributes on choice of MICE venue
The study also sought to investigate the extent to which product (venue) attributes influence
the MICE products consumers’ choice of venue. Table 4.7 below presents the findings.
Majority of the respondents were in agreement that to a very large extent, attributes of the
venue inform their choice and decision to hire. Majority (50%) on renowned brand; 76.5% on
accessibility of the venue; 70.6% on parking space; 61.7% on friendly staff; 70.6% on
security measures; 94.2% on one-stop shop; and 70.6% on cleanliness and organization of
the venue; pointed these attributes to influence their choice of venue to a very large extent.
Page 52
39
This study therefore presents the observation that one-stop-shop, venue accessibility, parking
space, cleanliness and organization, and security and safety measures are key attributes of a
venue that inform the choice and decision of MICE consumers.
Table 4.6 Extent of Influence of Product Attributes on choice of MICE venue
Attribute To a very
large extent
To a
large
extent
To some
extent
To a little
extent
To no
extent
Total
Renowned brand
17
(50%)
9
(26.5%)
6
(17.6%)
2
(5.9%)
0
(0%)
34
(100%)
Accessibility of the
venue
26
(76.5%)
6
(17.6%)
2
(5.9%)
0
(0%)
0
(0%)
34
(100%)
Parking Space 24
(70.6%)
9
(26.5%)
1
(2.9%)
0
(0%)
0
(0%)
34
(100%)
Friendly Staff
21
(61.7%)
8
(23.6%)
5
(14.7%)
0
(0%)
0
(0%)
34
(100%)
Security and safety
measures
29
(70.6%)
4
(11.8%)
1
(2.9%)
0
(0%)
0
(0%)
34
(100%)
Operating hours 11
(32.4%)
21
(61.7%)
2
(5.9%)
0
(0%)
0
(0%)
34
(100%)
One Stop Shop 32
(94.2%)
1
(2.9%)
1
(2.9%)
0
(0%)
0
(0%)
34
(100%)
Cleanliness and
organization
24
(70.6%)
10
(29.4%)
0
(0%)
0
(0%)
0
(0%)
34
(100%)
Page 53
40
4.4.3 Buy MICE Products as a Package or as Individual Elements
The study sought to investigate whether the respondents prefer to buy the MICE products
(hire the venues) as a package or buy/hire individual elements. Figure 4.4 below presents the
findings. Majority (86%) prefer to buy as a package while few (14%) prefer to buy individual
elements. The observation made here is that MICE consumers have a preference to packaged
‘products ‘over individual elements.
86%
14%
As a package
As individual elements
Figure 4.4 Buy MICE Products as a Package or as Individual Elements
4.4.4 Concern About Availability of MICE Venue
The study sought to investigate the whether the respondents are always concerned about the
availability of MICE venues requiring them to do bookings months before the event.
Majority (92%) agreed that they do bookings months before the day of the event to ensure
availability of the venue. Only 7% disagreed to the same. This shows that MICE consumers
will do the venue bookings months before the event for reasons of demand and cost
considerations.
Page 54
41
92%
7%
1%
0% 20% 40% 60% 80% 100%
Agree
Disgree
Don't know
Percentages
Response
Figure 4.5 Concern about Availability of MICE venue
4.5 Promotional Activities and Influence on Consumption of MICE Products
4.5.1 Source of Information About MICE Venue (KICC)
Table 4.8 presents the sources of information; how the respondents who hired MICE venues
came to learn about the venues. Majority (38.2%) got to learn about venue through word of
mouth while 29.4% learnt through public relations. Few, 11.8% and 8.8% learnt through
advertising and sales promotion respectively. The study observes word-of-mouth to be the
most popular medium through which the MICE consumers learnt about the venues they
hired.
Table 4.7 Source of Information About MICE venue
Source of Information Frequency Percent
Word of mouth 13 38.2
Advertising 4 11.8
Sales promotion 3 8.8
Magazines 2 5.9
Public Relations 10 29.4
Personal selling 2 5.9
Total 34 100
Page 55
42
4.5.2 Promotion Factors Influencing choice of MICE Venue
The study sought to investigate the promotional factors that inform the respondents’ choice
of MICE venue. Majority were in agreement that advertising (50%), brand awareness
(55.9%), customer awareness (76.5%), quality venue (88.2%), and taste and preferences
(79.5%) influence their choice of venue. This implies that among the promotional factors
informing consumers’ choice of the venue, communication about the quality of the venue,
consumer’s tastes and preferences, consumer awareness, renowned brands and advertising
are observed to primarily influence these choices.
Table 4.8 Promotion Factors Influencing choice of Venue
Factor Strongly
Disagree
Disagree Neutral Agree Strongly
Agree
Total
Advertising 1
(2.9%)
0
(0%)
0
(0%)
17
(50%)
16
(47.1%)
34
(100%)
Brand Awareness
0
(0%)
0
(0%)
1
(2.9%)
19
(55.9%)
11
(32.4%)
34
(100%)
Customer
Awareness
0
(0%)
0
(0%)
1
(2.9%)
26
(76.5%)
7
(20.6%)
34
(100%)
Quality venue
0
(0%)
0
(0%)
1
(2.9%)
30
(88.2%)
3
(8.8%)
34
(100%)
Taste and preference 0
(0%)
0
(0%)
1
(2.9%)
27
(79.5%)
6
(17.6%)
34
(100%)
4.5.3 Learning about upcoming Conferences and Exhibitions of Interest
Table 4.10 below presents the sources of information about upcoming conferences and
exhibitions. Majority (35.3%) of the respondents learn about these events through press and
public relations while 29.4% learn through visiting websites. Marketing agencies rank third
with 20.6%. Few, (2% and 3%) learn through brochures and personal selling respectively.
Page 56
43
The study observes the popularity of press/public relations and websites in reaching out to
and informing MICE consumers about up-coming conferences and exhibitions.
Table 4.9 Learning about upcoming Conferences and Exhibitions of Interest
Source Frequency Percent
Websites 10 29.4
Marketing Agencies 7 20.6
Brochures 2 5.9
Press and Public Relations 12 35.3
Personal Selling 3 8.8
Total 34 100
Page 57
44
4.6 Place/Distribution and Influence on Consumption of MICE Products
4.6.1 Channel of Distribution
The study also sought to investigate the channels used by the respondents in hiring the MICE
venues. Majority (87%) contacted the venue proprietors directly while few (13%) opted for
agencies/ intermediaries to carry out the transactions on their behalf. The study therefore
observes the popularity of the ‘Consumer Service provider’ or direct channel of distribution
in the MICE market.
87%
13%
Direct
Intermediaries
Figure 4.6 Channel of Distribution
4.6.2 Distribution Factors Influencing Choice of MICE Venue
The study sought to investigate the distribution factors influencing the choice of MICE
venue. Majority agreed that the factors under study influenced their choice of MICE venue.
Majority (52.9%) agreed that the distribution channel employed by the service provider
influence their choice of venue to large extent. Majority (76.5%) cited the means of service
delivery to influence their choice to a large extent, while 64.7% and 79.4% cited negotiations
and established contacts to influence their choice of venue to a very large extent.
The study observes the already established contacts and negotiation agreements between the
consumers and the venue proprietors to primarily influence the MICE consumers’ choice of
the venues.
Page 58
45
Table 4.10 Distribution Factors Influencing Choice of MICE Venue
Factor To a very
large
extent
To a large
extent
To some
extent
To a
little
extent
To no
extent
Total
Distribution channel
used by service
provider
9
(26.5%)
18
(52.9%)
6
(17.7%)
1
(2.9%)
0
(0%)
34
(100%)
Means of delivering
the service
7
(20.6%)
26
(76.5%)
1
(2.9%)
0
(0%)
0
(0%)
34
(100%)
Negotiations/
arrangements
22
(64.7%)
10
(29.4%)
2
(5.9%)
0
(0%)
0
(0%)
34
(100%)
Established contacts
27
(79.4%)
4
(11.8%)
3
(8.8%)
0
(0%)
0
(0%)
34
(100%)
4.7 Consumption of MICE Products
4.7.1 Mice Tourism as an Effective Platform for Marketing Tourism Industry to the
world.
The study sought to find out whether MICE tourism aids in marketing and promoting
Kenya’s tourism industry. Figure 4.7 below presents these findings. Majority (92%) agreed
that MICE tourism is a great way of marketing the Kenya’s tourism industry to both the local
and international markets. Only a few (8%) disagreed to the same. MICE tourism therefore is
observed to be instrumental in marketing the tourism industry as a whole.
Page 59
46
92%
8%
Yes
No
Figure 4.7 MICE Tourism as an Effective Platform for Marketing Tourism Industry to
the world.
4.7.2 MICE Tourism and Economy
The study also sought to investigate the economic value of MICE tourism. Majority (52.9%)
strongly agreed that MICE tourism is a great source of both direct and indirect revenue for
both entrepreneurs and the government. Majority (55.9%) also agreed that MICE tourism
offers all year-round employment opportunities while majority (64.7%) were of the opinion
that MICE tourism extends business to the off-peak seasons. Majority (76.5%) thought that
MICE tourism is environmental friendly.
The study therefore observes that MICE tourism is of great economic value to the country. It
is a significant source of revenue for the government and entrepreneurs, offers employment,
provides economic cushion for the seasonal business activities and more importantly
promotes the green economy.
Page 60
47
Table 4.11 MICE Tourism and Economy
Economic Value Strongly
Disagree
Disagree Neutral Agree Strongly
Agree
Total
Source of revenue 0
(0%)
0
(0%)
0
(0%)
16
(47.1%)
18
(52.9%)
34
(100%)
Offers employment
0
(0%)
0
(0%)
0
(0%)
19
(55.9%)
15
(44.1%)
34
(100%)
Extends business to
off-peak seasons
0
(0%)
0
(0%)
1
(2.9%)
22
(64.7%)
11
(32.4%)
34
(100%)
Environmental
friendly
0
(0%)
0 (0%) 7
(20.6%)
26
(76.5%)
1
(2.9%)
34
(100%)
4.8 Correlation Analysis Results
Correlation analysis (Pearson’s product Moment Correlation) was carried out at a 95%
confidence level and the correlation coefficients recorded. This type of correlation is used
when both variables under study are measured at ratio or interval scales and are continuous
(Mugenda, 2008). The correlation coefficient ranges between -1 and 1with a value of 0
implying no relationship, 1 implying a perfect positive relationship and -1 implying a perfect
negative relationship.
Price correlates positively with product attributes at a coefficient of 0.723. This indicates a
strong relationship between the two. Product attributes has a significant positive correlation
with promotional activities at a coefficient of 0.748. Price is positively correlated to
distribution/place at a coefficient of 0. 679. There is a positive and strong correlation at a
level of 0. 637 between product attributes and distribution. Price significantly correlates to
consumption of MICE products at a coefficient of 0.752. There is a strong and positive
relationship between place and consumption of MICE products at a coefficient of 0. 763.
Page 61
48
Table 4.12 Correlations
Price
Product
Attributes
Promotional
Activities
Place
Consumption of
MICE products
Price 1
Product Attributes .723* 1
Promotional
Activities .642
* .748
* 1
Place/Distribution .679 .637* .561 1
Consumption of
MICE products .752
* .692 .637 .763
* 1
Correlation is significant at the 0.05 level (2-tailed).
4.9 Regression Analysis Results
Regression analysis was conducted to establish whether there existed a relationship between
consumption of MICE products in Kenya, price, product attributes, promotional activities,
and place/distribution. Regression results are presented in table 4.14 below.
Table 4.13 Regression Analysis
Variable Coefficient T-Statistic P Value
Price 0.421 2.241 0.00
Product Attributes 0.490 2.352 0.02
Promotional Activities 0.413 2.320 0.04
Place/ Distribution 0.213 2.153 0.03
Constant Term 0.140 2.46 0.02
Statistic P Value
R-squared 0.7052 0.00
Adjusted R-squared 0.62
Durbin-Watson value 2.21
F-statistic 4.31
Page 62
49
The resulting regression model is:
CoMICE=β0 + β10.421 + β2 0.490 + β30.413 + β40.213 + ℮
Where
CoMICE is Consumption of MICE products (dependent variable)
P is Price
PAt is Product Attributes
PAc is Promotional Activities
P is Place
While ℮ is the error of prediction
β0 is a constant which is the value of dependent variable when all the independent variables
are 0.
Adjusted R2
of 0.62 implies that price, product attributes, promotional activities and place
explain 62% of consumption of MICE products in Kenya. The joint distribution of all the
independent variables was significant in predicting the dependent variable as shown by an F-
value of 4.31and a p-value of 0.00 at 95% confidence interval. An F-value greater than 4.0 is
significant (Neuman, 2006). Therefore, the variables were significant. According to Patton
(2002), P-values of less than 0.05 imply positive significance. A Durbin Watson value of 2.0
and above indicates that there is no serial correlation (Verbeek, 2001). Therefore, Durbin
Watson value of 2.21indicated absence of serial correlation.
The table shows the regression analysis results based on t-ratio and the sign of the
coefficient. The analysis shows that the constant has a t-ratio of 2.46 implying that there
other factors that are statistically significant and influence consumption of MICE products in
Kenya but have not been included in the model. The sign of the constant is positive implying
that these factors will positively impact on the consumption of these products.
Page 63
50
4.9.1 Inferences
Price
There is a positive relationship between consumption of MICE products in Kenya and price.
Price is statistically significant as indicated by a coefficient of t-ratio of 2.241. Price
therefore, influences the consumption of MICE products in Kenya.
Product Attributes
Product Attributes positively relate to the consumption of MICE products in Kenya. The
coefficient is statistically significant as shown by a t-ratio of 2.352. The more appealing the
product (venue) is, the higher the higher the demand and consumption.
Promotional Activities
Promotional activities are also positively related to the consumption of MICE products in
Kenya. The coefficient is statistically significant at a 2.320 t-ratio. The more the promotional
activities the higher the consumption of MICE products in Kenya.
Place/ Distribution
Place is positively related to consumption of MICE products in Kenya. It is statistically
significant at a t-ratio of 2.153.
4.10 Chapter Summary
The chapter presented the findings of the study as guided by the study’s objectives. The first
section presented the general information regarding consumption of MICE products, the
second section presented price factors influencing choice of MICE venue, the third section
looked into the product attributes as they influence consumption of MICE products, the
fourth section presented the influence of promotional activities on consumption of MICE
products the fifth section looked into the influence of place or distribution and the last section
presented the findings on consumption of MICE products. The next chapter presents the
discussion, conclusion and recommendations of the study.
Page 64
51
CHAPTER FIVE
5.0 DISCUSSION, CONCLUSION AND RECOMMENDATION
5.1 Introduction
This chapter presents the summary, discussions, conclusions and the recommendations of the
study in that order. The summary includes the objectives of the study, the methodology and
the findings of the study. The discussions section presents a discussion of the findings of the
study as guided by the study’s specific objectives. Similarly, the conclusions are also guided
by the study’s specific objectives and informed by the findings of the study. The
recommendations section presents both the recommendations for improvement and for
further research.
5.2 Summary
The study investigated the factors that influence the consumption of MICE products in
Kenya; a case of Kenya International Conference Center (KICC). The specific objectives
were: to identify the influence of price on consumption of MICE products, to establish
whether promotional activities influence consumption of MICE products, to investigate the
influence of product attributes on the consumption of MICE products and to find out whether
place influences the consumption of MICE products.
The study adopted descriptive research design. A total of 399 corporates, political parties and
other institutions situated in Nairobi that consume MICE products at the Kenyatta
International Conference Centre (KICC) constituted the target population while 10% of this
population (40) formed the sample size. The 40 consumers of MICE products were selected
using purposive sampling technique on the basis of repeat customers for the period 2010-
2012. Questionnaires were used to collect data. Data was then coded and entered for analysis
where Statistical Package for Social Sciences (SPSS) was used for analysis. Regression and
correlation analysis were done. Tables and charts were used to present the analyzed data.
The study showed that the components of price factor influencing the choice of the MICE
venue include: organizations’ budget allocations, ongoing promotions, cost of the venue and
flexible payment terms. Consumers also tend to compare the prices offered by various
Page 65
52
service providers before making hire decisions and this is informed by the price dynamism in
the industry.
Consumers were also very keen on the ‘product’ on offer and carry out extensive research
before making the hire decision. Product attributes; one-stop-shop, venue accessibility,
parking space, cleanliness and organization, and security and safety measures were more
appealing to these consumers and thus highly influenced consumption. Already packaged
products were more preferred over purchasing individual elements. For the reasons of
demand and cost considerations, the study showed that MICE products consumers booked
the desired venues months before the actual event.
The study also showed that among the promotional factors informing consumers’ choice of
the venue, communication about the quality of the venue, consumer’s tastes and preferences,
consumer awareness, renowned brands and advertising were primary. Press/public relations
and websites were found to be the popular medium through which the consumers of MICE
products accessed information about up-coming conferences and exhibitions. Word-of-mouth
was the most popular medium through which the MICE consumers learnt about the venues
they hired.
Consumers preferred to deal directly with the service providers thus Direct channel of
distribution was most adopted. Consumers however, engaged the intermediaries when
organizing the event deemed complex; covering a large geographical area and large numbers
of participants.
While industries; Banking, Medical and Tourism and hospitality are key participants and
giant consumers of MICE products, key sectors that are currently driving the economy;
Agriculture, Wholesale and Retail, Transport and Communication and Manufacturing are
conspicuously left out in the MICE industry. Incentives; events held to reward participants on
previous performance are not commonly carried out in a giant way but rather seldom and
done in a silent manner and usually organized and hosted by the individual organizations.
MICE tourism is of great economic value to the country. It is a significant source of revenue
for the government and entrepreneurs, offers employment, provides economic cushion for the
Page 66
53
seasonal business activities and more importantly promotes the green economy. MICE
tourism is also instrumental in promoting the overall tourism industry to the international
world through ensuring excellent and phenomenon experiences to the international business
tourists. These tourists, through word- of-mouth, become tourism ambassadors of the
country.
5.3 Discussions
5.3.1 General Information
The study revealed that the banking industry takes the lead in the consumption of MICE
products in Kenya. Other key consumers of MICE products include the tourism and
hospitality industry, housing and construction, medical sector, and politics and governance.
Exhibitions, conferences and meetings were the most consumed MICE products among these
industries/sectors. Incentives however, were not popular as they were seldom held and when
held were usually organized and hosted by the MICE organizations.
The study also revealed that when majority of these events (conferences, exhibitions and
meetings) were held, they were usually guided by the purposes of legal and regulatory
frameworks/ the need to comply with law requirements. This means organizations such as
constitutional bodies which are required to meet or hold events at certain times or for a
certain number of times by the law. Other reasons included new product launches, and
employee/member development (the need to grow and expand a community of members by
an organization or organizations). These include meetings for employee or member training
and also events for acquiring new members or customers.
Sarit Center, Safari Park Hotel, and KICC were the most popular (ranked in that order) hosts
for these events. Other venues included Intercontinental Hotel, Panafric Hotel, Strathmore
Business School and other venues in the outskirts of Nairobi. The purpose of the event,
capacity/ number of attendees, proximity and convenience, accessibility and availability are
important factors to consider in choosing a MICE venue (Toth & David, 2010; Zang, Leung
& Qu, 2007).
Page 67
54
5.3.2 Influence of Price on Consumption of MICE Products in Kenya
The study found out that among the components of price factor influencing the choice of the
MICE venue by consumers, the main components include organizations’ budget allocations,
ongoing promotions, cost of the venue and flexible payment terms. Without funds available
and designated to facilitate for MICE, holding such events is infeasible. Business travellers
are sensitive to price and before settling for a particular destination, they tend to consider a
variety of competing destinations. This finding corresponds to the findings in Zang, Leung &
Qu (2007) that consumers will look at various destinations before choosing the location with
the best price and value for their money.
Visitors also look out for the existence of ongoing promotions or discounts in price before
choosing a MICE venue. Many of the organizations that participated in the study agreed that
the presence of a discount influenced their choice of a particular MICE venue as opposed to a
different venue. This was true especially for organizations that have used a venue for more
than one time or plan to use it for more than one time. The discount enhances customer
loyalty as customers are more likely to come back as it is an incentive to the customer.
Another component of price that visitors consider before choosing a MICE venue is the
flexibility of payment terms. The more suitable the payment terms, the more likely the
consumer is going to choose a particular venue. The study showed that consumer’s preferred
having a good agreement in terms of the payment method and terms as opposed to a rigid
system dictated by the MICE venue to the consumer.
The study revealed that consumers of MICE products tend to compare the prices offered by
various service providers before making hire decisions. This is informed by the price
dynamism in the industry as dynamic pricing strategy is the prevalent pricing strategy
employed in the MICE sector. This strategy has become a commonly practiced price
discrimination strategy used by sellers to maximize profits by charging different prices for
very similar or essentially the same products or services according to the amount of money
individual customer is willing to pay (Dai, 2010). These consumers related the price
dynamism to a number of factors, among them; quality of service, location of the venue and
space particularly parking space.
Page 68
55
The price dynamism influences consumption of MICE facilities as prices are agreed upon
between the consumer and the MICE venue based on various factors specific to the customer.
The price being dynamic is attractive to the customer as they do not have to incur
unnecessary costs for instance where they require some facilities but they don’t require
others. They get a price specific to their requirements. Price dynamism also features
whereby there are different rates for peak and off peak seasons in the MICE industry. This
means that when it is off peak season, consumers are likely to pay much less than they would
during the peak season. For this reason, a consumer could stage their event around this time
to take advantage of the lower price. Giving a customer their own rate is also key in
increasing customer loyalty. This is because you could offer them a discount as well as other
incentives.
Packaged pricing is a popular occurrence in the MICE industry currently. This corresponds
with the findings in Kokkomaki, Laukkanen & Komppula (2009). Consumers are more likely
to purchase several products as a package as opposed to purchasing the individual products
by themselves. This is because the consumer is more likely to be charged a lower rate when
they buy the package. Buying the product as a package also leads to convenience as a
consumer pays at one time and they have everything they need during their whole stay at the
MICE venue. The convenience and the decrease in cost serve as an incentive and helps
acquire consumers for the MICE venue.
5.3.3 Influence of Product Attributes on Consumption of MICE products in Kenya
The study revealed that MICE consumers carry out extensive research on venues before
making their hire decision. These consumers are very keen on the ‘product’ on offer and
scrutinize the ‘product’ to the very detail to ensure that it matches or meets their specific and
unique needs. Key product attributes that influenced these consumers’ choice of MICE venue
included among others; one-stop-shop, venue accessibility, parking space, cleanliness and
organization, and security and safety measures. Packages composed of all these elements
were more appealing to these consumers.
According to the study, a MICE venue has to have the equipment/ facilities that the consumer
requires before the consumer decides to acquire their services. Facilities such as seating
capacity, equipment required such as projectors, sound equipment and other facilities
Page 69
56
required by a specific consumer have to be available at the MICE venue if they are going to
buy their services. Things that the consumer needs have to be available throughout their stay
without there being instances where they run out. This is where the capacity of a MICE
venue comes into play as well as the individual needs of the consumer and the number of
guests projected to be at the event. The product availability is one of the most important
factors influencing consumption of MICE products if not the most important. This is because
if the product does not exist, there will be no consumer. Product availability also results in
customer loyalty as there are few inconveniences. Consumers prefer companies where
availability is assured just like in the findings in Jones (2007).
Another product factor that influences consumption of MICE venues is accessibility.
Consumers look at factors such as how accessible a venue is i.e. the means of transport, the
roads to be used to get there and various other factors. Consumers require visitors to attend
their events, and if an event venue is inaccessible, it could undoubtedly compromise their
business. This factor could thus determine if a consumer acquires the services of a particular
MICE venue over another. This corresponds with the findings by Zang, Leung & Qu (2007)
that destination accessibility is essential to consumers.
The study revealed that security is also a prime concern for consumers of MICE products. If
there are threats to security to consumers or their property, it causes a negative perception in
the minds of consumers about the venue. This may then hurt the business of the MICE venue
as potential customers will choose to take their business to their competitors who offer a
more secure location.
The study also shows that consumers preferred renowned brands as opposed to venues that
weren’t really as well known. A high percentage of the respondents in the study attributed a
good brand to symbolizing good quality service and thus this influenced their preference of
such brands. A well renowned brand also raises the status of the event being held there.
The study also revealed that consumers of MICE products prefer already packaged ‘products
‘over individual elements. Buying a packaged product provides the customer with the
benefits of easier budgeting for trips; the customer pays at one time and has a good idea of
the total cost; increased convenience and greater economy; as the cost to the customer is
Page 70
57
usually more economical than purchasing the package components individually (Hudson,
2008). However, for reasons of availability, demand and cost considerations, these
consumers book the desired venues months before the actual event.
5.3.4 Influence of Promotional Activities on Consumption of MICE products in Kenya
The study revealed word-of-mouth as the most popular medium through which the MICE
consumers learnt about the venues they hired. Marketing a MICE venue does not differ in
principle from the marketing of any other product or service; it involves defining what you
have to offer, identifying your market segment and promoting your product to potential
customers accordingly (Baloglu & Love, 2005).
The study also revealed that among the promotional factors informing consumers’ choice of
the venue, consumer awareness, communication about the quality of the venue, consumer’s
tastes and preferences, renowned brands and advertising were primary.
Advertising is used to establish a basic awareness of the product or service in the minds of
potential customers and to build up knowledge about it (Chen, 2006). It is necessary for
customers to be aware of the availability/ existence of a certain product in order for them to
acquire it. MICE venues undertake various advertising in order to capture the customer that
they wish to get. Different ways of advertising have different results with some methods
being more effective than others.
Brochures, press and public relations, personal selling, and advertisements through websites
are key marketing tools through which marketing destination organizations reach their
prospective consumers (Hudson, 2008). Press/public relations and websites were found to be
the popular medium through which the consumers of MICE products accessed information
about up-coming conferences and exhibitions.
A high percentage of the respondents in the study attributed their purchase of a certain MICE
products to customer awareness and the quality of the venue. This shows that MICE venues
where customers have the knowledge of the services they offer and the level of quality that
they promise will be more likely to have more consumers unlike those that do not. It is thus
necessary to ensure that advertisements and awareness campaigns aimed at potential
Page 71
58
customers show the quality of service the MICE venue offers as this is essential to
consumers.
Brand awareness is also an essential component of promotion that positively influences
consumption of MICE services and products. Kotler (2010) defines a brand as a name,
symbol, term, a design or a combination of all these that enables customers differentiate the
products of one company from those of its competitors. A brand enables a customer to
identify certain values and attributes of a company that they identify it with and that appeal to
them (Kotler, 2010). It is important for MICE products to be well branded. This enables a
customer to distinguish them from competitors. It also ensures that customers are aware of
the standards and the level of quality that a particular brand offers. This study shows that it is
essential for a MICE venue to have a strong band and that MICE venues which are well
known have higher chances of getting customers as it displays consumer awareness of the
product.
Taste and preference is a factor in choosing MICE products/ services to use as this study has
shown from the high percentage of respondents who agreed with this. Before choosing a
particular venue, customers enquire about the availability of the facilities that they require
and the various facilities present at the venue. They then make a choice from a variety of
alternatives to pick their preferred option. Customers prefer to use products/ services which
they like and this is a factor in their choice of venue. Customer awareness is important as a
venue could have facilities that consumers would love but they are not aware of so they
cannot acquire them. MICE venues also have to tailor their products according to consumers’
needs in order to acquire more customers.
5.3.5 Influence of Place/ Distribution on Consumption of MICE products in Kenya
Direct channel; ‘Consumer Service provider’ was found to be the most popular channel
of distribution among the consumers of MICE products. Consumers preferred to deal directly
with the service providers as opposed to engaging through intermediaries/ agents. Companies
usually do not use an intermediary to organize a meeting close to their location but directly
book conference facilities for example from a hotel or from an educational institution
(Fenich, 2005).
Page 72
59
However, consumers engaged the intermediaries when organizing the event deemed
complex; covering a large geographical area and large numbers of participants. The study
also revealed that contacts and negotiation agreements between the consumers and the venue
proprietors are instrumental in influencing the MICE consumers’ choice of the venues. The
Contacts and platforms for negotiations are vital for a company’s distribution system to
operate effectively (Hudson, 2008).
The study shows that negotiation agreements and established contacts between the venues
and consumers and venue proprietors influenced MICE consumers’ choice of venues over
factors such as already established distribution channel by the service provider. This shows
that consumers preferred a distribution channel specific to them as opposed to predetermined
distribution channel. The channel which they negotiate for with the service producer is made
according to their individual tastes and preference. This shows customer satisfaction as a
result of being able to choose or negotiate their own channel. It also shows customer loyalty
as a result as customers establish contacts with the venue for a continuous business
relationship.
According to Hudson (2008) organizations have to ensure that their distribution systems
make a product or service available to the consumer by moving the consumer to the product.
It is thus necessary to ensure product availability to the consumer and to cater for their needs.
As this study has shown customers prefer to communicate to the service provider directly in
order to acquire what they want. It is thus essential for companies to ensure that their
products can be reached easily and that they can also be contacted easily. Customers prefer to
be able to contact the organization and discuss about the product on offer, their specific
requirements, and negotiate on the price. This is convenient to the customer and they are able
to acquire what they want. Many organizations/ consumers know the requirements that they
have and thus in most instances they just contact the venue themselves.
Instances where organizations use intermediaries are mostly where the event is a large event
probably covering a large geographical area or several areas at once. This means that the
logistics involved in carrying out the event are huge and they could require a specialist in the
field to organize the facilities and other products required for the event. This corresponds
with the findings by Sa´nchez, Callarisa, Rodrı´guez, & Moliner (2006). On the contrary,
Page 73
60
organizations that are holding events close to their location usually do not use an
intermediary as shown by the study. This corresponds with findings by Fenich (2005).
This study shows the need for MICE companies to ensure there is contact with customers in
order to facilitate distribution. A high majority of the respondents showed that they prefer to
contact the companies and negotiate for the product. Without this contact, consumers would
not be aware of the product’s benefit and there would be no sale/ distribution. This supports
the findings in Hudson (2008).
5.4 Conclusions
5.4.1 Influence of Price on Consumption of MICE Products in Kenya
In regard to price, the study concluded that budget allocations, ongoing promotions in regard
to discounts offered, cost of the venue and flexible payment terms are the key components of
price factor that influence the choice of the MICE product. Budgetary allocations for MICE
events allow organizations to comfortably plan and hold meeting and incentive events and
participate in conferences and exhibitions. Promotions (discounts offered) act as bait to
participation in MICE events while reasonable costs and flexible payment terms enhance
consumer-service provider relationships thereby informing choice of venue.
Highly priced MICE venues shift demand to comfortably affordable venues making price
competitiveness a fundamental factor in the overall tourism competitiveness of the country.
Price dynamism is the pricing strategy employed in the MICE industry but while the service
providers want to maximize their profits, consumers want the best bargain they can get in the
market while at the same time get value for their money.
5.4.2 Influence of Product Attributes on Consumption of MICE products in Kenya
The study also draws conclusion that MICE consumers are very keen on the ‘product’ on
offer and will carry out extensive research to ensure that the ‘product’ matches or meets their
needs. It is therefore critical to assess and match consumer needs with ‘products’ before
presenting them for consumption. While venue packages with the attributes of a one-stop-
shop, venue accessibility, parking space, cleanliness and organization, and security and
safety measures are more appealing to MICE product consumers, venues that exhibit
Page 74
61
difficulties in accessibility may give the consumer ; particularly in regard to incentives, the
aesthetic value of originality and uniqueness. Consumer tastes and preferences are paramount
in designing products and services. Consumers buy more than the ‘product’ itself to include
convenience and economy; are they able to save time, money and energies. In regard to
venue availability, MICE products consumers also want to avoid the crisis of high demand-
high cost; thus will plan and do early bookings of venues of interest.
5.4.3 Influence of Promotional Activities on Consumption of MICE Products in Kenya
Regarding promotional activities, the study concludes that being in the service sector, past
experience is vital in convincing (and winning) prospective customers about consuming your
service. Word-of- mouth is a powerful marketing tool in communicating past experience;
thus, the popularity of this tool among MICE product consumers. However, in the wake of
the digital age, consumers can access information with ease and within the shortest time
through the electronic media. Consumers have become technology savvy and medium such
as websites and social sites are instrumental particularly in accessing and disseminating
relevant and timely information of interest. Quality of the venue, consumer’s tastes and
preferences, consumer awareness, renowned brands and advertising are primarily promotion
factors influencing the choice of MICE venue. To this premise, image/brand building
campaigns anchored on advertising elements of quality and tailor-made services designed to
specifically meet the unique needs, tastes and preferences of individual customers are
paramount.
5.4.4 Influence of Place/ Distribution on Consumption of MICE products in Kenya
The study also draws conclusion that MICE Consumers prefer to ‘buy’ directly from the
service providers over using of intermediaries. This is so particularly when the event is
believed to be simple and can be held locally. However, these consumers will engage the
expertise of professional personnel of an intermediary organization particularly when
organizing the meeting or conference is deemed to be complex; covering lager geographical
areas and large number of participants. Consumers have established relationships with
service providers in the MICE industry and are confident about the services and benefits of
Page 75
62
the services provided by these proprietors. Negotiations in regard to price and operations are
thus made possible and easy thereby highly influencing these consumers’ choices.
5.5 Recommendations
5.5.1 Recommendations for Improvement
5.5.1.1 Influence of Price on Consumption of MICE Products in Kenya
While service providers in the MICE industry extensively take advantage of the price
dynamism strategy, they must also ensure quality of the services they provide. Consumers
want value for their money and will source from service providers that offer reasonable or
least prices without compromising quality. To further enhance their competitiveness, service
providers in this industry must endeavor to ‘provide more for less’. They must devise
strategies that will economically enable them to offer phenomenon services; that exceed their
consumers’ expectations, at reasonable prices.
5.5.1.2 Influence of Product Attributes on Consumption of MICE products in Kenya
Service providers in the MICE industry should also endeavor to understand to detail their
target markets before presenting the ‘products’ to the market or even before planning for
further investments in the same industry. Consumer tastes and preferences are dynamic and
informed by both internal and external factors. As such it is mandatory that these service
providers endeavor to design and package ‘products’ that not only meet the unique needs,
tastes and preferences of these consumers but also exceed their expectations.
Moreover, these consumers want to buy more than the ‘product’ itself to include convenience
and economy; in regard to saving time, money and efforts/energies and service providers
therefore, must also incorporate this aspect of ‘product’ design. Keeping at pace with the ever
changing technology is critical. To attract the international clientele and to gain a competitive
edge in the market, being technology savvy is inevitable. Therefore, proprietors in the MICE
industry must incorporate new technology in their services.
Page 76
63
5.5.1.3 Influence of Promotional Activities on Consumption of MICE Products in Kenya
Extensive marketing is paramount. Proprietors in the MICE industry must also ensure that
they avail as much information as possible to both the local and international markets. In the
wake of the digital generation, use of marketing tools such as websites and having presence
in the online social sites such as Facebook, Twitter, MySpace is inevitable.
To gain a competitive edge, service providers in this industry must ensure that entities in
their target markets are not only able to carry out research on products/services offered but
also able to do so with a lot of ease and within the least time possible. This can be done by
enabling desk-research. Previous satisfactory experience is a relatively important attribute
that guide the consumer in choice of the venue; and these attributes enhance the overall
quality of experience. Service providers must endeavor to offer phenomenon experiences to
the business tourists as these tourists; particularly the international business tourists are
instrumental in marketing not only the MICE destination but also Kenya’s tourism industry
to the international world through word- of- mouth.
In their marketing strategies proprietors in the MICE industry should strongly highlight ‘past
experiences’ particularly from renowned organizations or personalities. This can be done
through endorsements from these organizations or personalities. Brand influence the
consumers’ choice of venue. Brand/image building therefore is vital and aggressive brand
building campaign is necessary. These efforts should be anchored on advertising elements of
quality and tailor-made services designed to specifically meet the unique needs, tastes and
preferences of individual customers.
5.5.1.4 Influence of Place/ Distribution on Consumption of MICE products in Kenya
Finally, proprietors in the MICE industry should strengthen their relationships with their
consumers. Contacts and platforms for negotiations in regard to price, organization and
operations are key determinants of the consumers’ choice of venue/ MICE destination, and
healthy and strong relationships enhance the service provider’s competitive edge. Moreover,
customers are the lifeblood of any business and so, due attention should be directed to them.
These proprietors in the MICE industry should also work closely with the intermediaries
Page 77
64
operating in the same industry to enhance and ensure efficiency and effectiveness in
satisfactory delivery of services to the consumers.
5.5.2 Recommendation for Further Studies
Studies should be carried out to explore other factors that influence consumption of MICE
products in Kenya. Further study should be carried out on the relationship between venue
attributes and incentive; the influence of venue attributes on incentives. Similar studies
should be carried out in other parts of the country or on a different case study to validate the
results of this study.
Page 78
65
REFERENCES
Aalto-Setala V,. & Raijas, A. (2003). Actual market prices and consumer price knowledge.
Journal of Production and Brand Management. 12(3):180-192
Adhiambo, K. (2006). The Impact of Promotion Strategies on Consumption of Domestic
Tourism Products: A Case Study of Residents of Kisii Town, Kenya. Available:
http://www.egerton.ac.ke/theses/the%20impact%20of%20promotion%20strategies%20
on%20consumption.pdf
Ailawadi, K., & Keller, K. (2004). Understanding retail branding: Conceptual insights and
research priorities. Journal of Retailing. Vol. 80, No.4, pp.331-342.
Alba, J., Mela, C., Shimp, T., & Urbany, J. (2009). The Effect of Discount Frequency and
Depth on Consumer Price Judgements. Journal of Consumer Behavior. 26: 99 –114
Astroff, M. & Abbey, J. (2006). Convention Management and Service, 7th ed. Educational
Institute American Hotel and Lodging Association, Lansing, MI.
Baloglu, S., & Love, C. (2005). Association Meeting Planners’ perceptions and intentions for
five major US convention cities: the structured unstructured images. Tourism
Managament, 26, (5), 743-752.
Baum, T., Deery, M., Hanlon, C., Lockstone, L., & Smith, K. (2009). People and Work in
Events and Conventions: A Research Perspective. UK: CAB International.
Bernard, H., (2002). Research Methods in Anthropology: Qualitative and Quantitative
Methods. 3rd edition. Walnut Creek, California: AltaMira Press.
Boniface, B. & Cooper, C. (2005). Worldwide Destinations: The Geography of Travel and
Tourism. 4th ed. Burlington: Butterworth Heinemann.
Braley, F. (2008). Meetings Market Report. Meetings and Conventions, Vol. 41, pp. 1-22.
Brassington, F. (2011). Principles of Marketing. New York, NY: Pearson Publishers
Page 79
66
British Tourist Authority (2008). The Meeting and Conference Market: Do you really know
your market? Retrieved April 10, 2013
fromhttp://www.businesstourismpartnership.com/pubs/mtg%20mkt.pdf
Center for Exhibition Industry Research, (2009). Annual CEIR Index, CEIR, Dallas, TX.
Chen, C. (2006). Applying the Analytical Hierarchy Process (AHP). Approach to Convention
Site Selection. Journal of Travel Research, 45, (2), 167-174.
Coleman, M. & Briggs, A. (2002). Research Methods in Education, leadership and
Management. London: Sage Publications.
Conlon, C., & Mortimer, J. (2010). Effects of Product Availability: Experimental Evidence
Retrieved November 25, 2012 from http://www.bc.edu/
Cooper, C., Fletcher, J., Fyall, A., Gilbert, D. & Wanhill, S. (2008). Tourism Principles and
Practice. 4th ed. Harlow: Financial Times Prentice Hall.
Cooper, D. & Schindler, P. (2003). Business research methods (8th
ed). New Delhi: Tata
McGraw-Hill Publishing Company.
Cooper, D. & Schinder, P. (2008). Business Research Methods 10th
Ed.New York:McGraw
Hill.
Cronbach, L. & Shavelson, R. (2004). My Current Thoughts on Coefficient Alpha and
Successor procedures. Educational and psychological Measurement 64, no. 3 9 June 1):
391-418.
Crouch, G. & Louviere, J. (2004). The Determinants of Convention Site Selection: A
Logistic Choice Model from Experimental Data. Journal of Travel Research, 43, (2),
118-130.
Crouch, G. & Ritchie, J., (1998). Convention site selection Research: A Review, Conceptual
Model, and Propositional Framework. Journal of Convention & Exhibition
Management, 1, (1), 49-69.
Page 80
67
Dai, B. (2010). The Impact of Perceived Price Fairness of Dynamic Pricing on Customer
Satisfaction and Behavioral Intentions: The Moderating Role of Customer Loyalty.
Available:http://etd.auburn.edu/etd/bitstream/handle/10415/2217/Bo.Dissertation.Fina
l.07.12.pdf?sequence=2
Davidson, R. (2007). Business Tourism. 10th Tourism Congress: University and Company
Conventions, Congresses and Incentive travel. Valencia: Tirant lo Blanch.
Dibley, A., & Baker, S. (2001). Uncovering the links between brand choice and personal
values among young British and Spanish girls. Journal of Consumer Behavior, 1(1),
77-93.
DIS. (2012). Meeting, Incentive, Convention, and Exhibition (MICE) Industry: Analysis and
Investment Opportunities. Taiwan, Ministry of Economic Affairs. Retrieved April 19,
2013 from http://investtaiwan.nat.gov.tw/doc/industry/13MICE_Industry_eng.pdf
Dwyer, L. & Forsyth, P. (2008). Economic Measures of Tourism Yield: What Markets to
Target? International Journal of Tourism Research, 10 (2), 155-168.
Easingwood, C. J. (1986). New product development for service companies. Journal of
Product Innovation Management, 3(3), 296–312.
Fenich, G. (2008). Meetings, Expositions, Events, and Conventions: An Introduction to the
Industry. Pearson Prentice Hall, Upper Saddle River, NJ.
Festinger, L. (I 954). A theory of social comparison processes. Human Relations, 7, 117-140.
Garbarino, E., & Lee, O. (2003). Dynamic Pricing in Internet retail: Effects on consumer
trust. Psychology &Marketing, 20(6), 495–513.
Getz, D. (2008). Event tourism: Definition, evolution, and research. Tourism Management,
29, (3), 403-428.
Girod, A. (2009). Analysis of the Development of MICE Industry: A Case Study of Lyon,
Available: http://www.du.se/PageFiles/18846/GirodAur%C3%A9lie.pdf
Page 81
68
Goethals, G. R., & Darley, J. (1977). Social comparison theory: An attributional approach. In
J. M. Suis & R. L. Miller (Eds.), Social comparison processes: Theoretical and
empirical perspectives (pp. 86-109). Washington, DC: Hemisphere.
Government of Kenya. (2007). Kenya Vision 2030. Nairobi: Government Printer
Government of Kenya, (2012). Strategic Plan, 2008-2012. Kenya: Ministry of Tourism
Gutman, J. (1982). A means-end chain model based on consumer categorization processes.
Journal of Marketing, 46(2), 60-72.
Gutman, J. (1981). A means-end model for facilitating analysis of product markets based on
consumer judgement. Advances in Consumer Research, 8, pp. 116-21.
Herrmann, A., Xia, L., Monroe, K., & Huber, F. (2007). The Influence of Price Fairness on
Customer Satisfaction: An Empirical Test in the Context of Automobile Purchases.
Journal of Product and Brand Management, 16(1), 49-58.
Holloway, J. (2006). The Business of Tourism. 7th ed. Harlow: Pearson Education.
Horner, S. & Swarbrooke, J. (2004). International Cases in Tourism Management. London:
Elsevier
Hudson, S. (2008). Tourism and Hospitality Marketing. A Global perspective. New Delhi:
Sage Publications Ltd.
Isler, T. (2008). Convention Center Performance Review: Meetings and Conventions.
Available:http://www.meetings-conventions.com/articles/convention
centerperformance-review/c11312.aspx
Jones, P. (2007). When Ads Work: New Proof that Advertising Triggers Sales. NY: M.E.
Sharpe Publishers
Jones, P., Hudson, S., & Costis, P. (1997) New product development in the UK tour-
operating industry, Progress in Tourism and Hospitality Research, 3(4), 283–294;
Joppe, H. (2000). The Research Process. Available: www.ryrson.com/mjoppe,rp.html
Page 82
69
Keller, K. (2003). Strategic brand management: Building, measuring, and managing brand
equity. NJ: Pearson Prentice Hall.
KICC, (2013). Kenyatta International Conference Centre. Available: http://www.kicc.co.ke
Kokkomaki, J., Laukkanen, T., & Komppula, R. (2009). Determinants Affecting the Use of
an Intermediary when Buying Meeting Services. International Journal of Hospitality
and Tourism. Vol 1, No.2, Jan-Jun 2012
Kothari, C. (2004). Research Methodology: Methods and Techniques. New Delhi: New Age
International (P) Limited Publishers.
Kothari, C. (2008). Research Methodology: Methods & Techniques, (2nd
Rev. Ed.) New
Delhi. New Age International Limited Publishers.
Kotler, P. (2010). Marketing Management: Analysis, Planning, Implementation and Control.
(8th ed.). Pearson Prentice Hall; Upper Paddle River, NJ.
Kotler. P., & Armstrong, G (2000). Principles of Marketing, 9th
edition. Prentice Hall; Upper
Paddle River; NJ.
Kotler, P., Kevin, K., & Manceau, D. (2012). Marketing Management. (8th
ed.). NJ: Pearson
Prentice Hall.
Kombo & Tromp (2006.) Proposal and Thesis writing, an Introduction. Africa: Pauline
Publication.
Kruglanski, W., & Mayseless, O. (1990). Classic and Current Social Comparison Research:
Expanding the Perspective. Psychological Bulletin 1990, Vol. 108, No. 2, 195-208
Kumar, R. (2005).Research Methodology: A Step by Step Guide for Beginners,(2nd
Ed.). New
Delhi. Sage Publication.
Kuppusamy Senguttuvan (2009). Customs- import- export. Customer valuation vs. transfer
Pricing 08.08.2009. India
Page 83
70
Lawrence, M., & McCabe, V. (2001). Managing Conferences in Regional Areas: A Practical
Evaluation in Conference Management. International Journal of Contemporary
Hospitality Management, 13 (4), 204-207.
Lewis-Beck, M. (1995). Data Analysis: An Introduction. Thousand Oaks: Sage
Publications.
Liptak, G.B. (2005). Instrument Engineer’s Handbook: process Control and optimization. 4th
Edition. CRS Press. Connecticut. USA.
Lovelock, T., & Wirtz, L. (2007). Services Marketing 6th edition. New York: Prentice Hall.
Mansfeld, Y., & Pizam, A., (2006). Tourism, Security And Safety: From Theory to Practice,
UK: Elsevier Butterworth-Heinemann
Martin-Consuegra, D., & Molina, A., & Esteban, A. (2007). An Integrated Model of Price,
Satisfaction and Loyalty: An Empirical Analysis in the Service Sector. Journal of
Product & Brand Management, 16(7), 459-468.
Mugenda, A.G., (2008). Social Science Research. Acts Press. Nairobi. Kenya.
Mugenda, O. & Mugenda, G. (2003). Research Methods: Quantitative and Qualitative
Approaches. Acts Press. Nairobi. Kenya.
Muijs, D. (2004). Doing Quantitative Research in Education: With SPSS. SAGE Publications
Ltd.
Neuman, W. (2000). Social research methods: Qualitative and quantitative approaches.
Boston: Allyn & Bacon Publishers.
Neuman, W. (2006). Social Research Methods: Qualitative and quantitative approaches.
Needham Heights: Allyn & Bacon.
Odunga, P., Besloy, S., Nthinga, R., & Maingi, S. (2011). Conference Tourism in Kenya:
Towards Tourism Product Development and Extension. Retrieved April, 19, 2013
Page 84
71
fromhttp://irlibrary.ku.ac.ke/ir/bitstream/handle/123456789/1463/Maingi,%20S.W.pdf
?sequence=1
Opperman, M., (2006). Convention Destination Images: Analysis of Association Meeting
Planners’ Perceptions. Tourism Management, 17, (3), 175-182.
Page, S. ( 2003). Tourism Management: Managing for change. Oxford: Butterworth-
Heinemann.
Page, S., & Connell, J. (2006). Tourism: A Modern Synthesis. 2nd ed. London: Thomson
Learning.
Pearlman, D. (2008). Key Performance Indicators of the MICE Industry and the Top 25
United States and Canadian CVBs. Journal of Convention and Event Tourism, 9 (2),
95-118.
Rogers, T. (2003). Conferences and Conventions – a Global Industry. Oxford: Butterworth
Rotich, D., Nthiga, R., Bor, T., & Logola, B. (2012). Product diversification for
sustainable tourism development: exploring the strengths and challenges of Kisumu
region, Kenya. European Journal of Business and Social Sciences. Vol 1, No 9,
December, 2012.
Sarova Hotels (2011). Hotels see benefits in Africa. Available on www.sarovahotels.com
Sérgio, C., & André Luiz, M. ( 2007). The Means-End Approach to Understanding
Customer
Swarbrooke, J., & Horner, S. (2007). Consumer Behaviour in Tourism. 2nd ed. Oxford:
Butterworth Heinemann.
Values of an On-Line Newspaper. Retrieved April 26, 2013 from
http://www.anpad.org.br/bar
Toth, G., & David, L. (2010). The Connection between Accessibility and Tourism. Delhi
Business Review Vol. 11, No. 1 January - June 2010.
Page 85
72
Trope, Y., & Liberman, N. (2000). Temporal construal and time-dependent changes in
preference. Journal of Personality and Social Psychology,79,876–889.
Trope, Y., & Liberman, N. (2003). Temporal construal. Psychological Review, 110,403–421.
Trope, Y., Liberman, N., & Wakslak, C. J. (2007). Construal levels and psychological
distance: Effects on representation, prediction, evaluation, and behavior. Journal of
Consumer Psychology, 17,83–95.
UNWTO, (2007). Definition of Tourism. Retrieved April 4, 2013 from:
http://pub.unwto.org/WebRoot/Store/Shops/Infoshop/4745/A7FE/108F/5CF1/39BB/C0
A8/0164/0B61/071122_study_social_solidarity_tpurism_africa_excerpt.pdf
UNWTO, 2008. Tourist Arrivals by Purpose of Visit 2008. Retrieved April 4, 2013 from
http://www.unwto.org/facts/menu.html
UNWTO, (2012). MICE Industry: An Asia-Pacific Perspective. Available:
http://pub.unwto.org/WebRoot/Store/Shops/Infoshop/5074/2890/C02C/66D1/5CC5/C0
A8/0164/7541/MICE_Industry_Asia_4-4_excerpt.pdf
UNWTO World Tourism Barometer. (2009). The Evolution of International Tourist Arrivals.
Retrieved April, 4 from:
http://www.eunwto.org.libezproxy.bournemouth.ac.uk/content/v432141q45340460/?p=
39181ba894814984889c3ff06bf09ee3&pi=0
Valette-Florence, P., & Rapacchi, B. (1991). Improvements in means-end chains analysis:
using graph theory and correspondence analysis. Journal of Advertising Research,
31(1), 31, 30-45.
Verbeek, J (2001), "Underestimating value addition costs: Error or Lie?"
Journal of the European Planning Association, vol. 68, no. 3, 279-295.
Victoria Safaris, (2007). Conference Tourism in Africa. Retrieved 19, April, 2013 from
http://www.victoriasafaris.com/conferencetours.htm
Page 86
73
Weber, K. (2001). Meeting Planners’ Use and Evaluation of Convention and Visitor
Bureaus. Tourism Management, Vol. 22 No. 6, pp. 599-606.
Weber, K., Chon, S. (2002). Convention tourism: International research and industry
perspectives. Binghamton, NY: Hawaorth Hospitality Press Inc.
Wood, C., Brotherton, B. (2008). The SAGE Handbook of Hospitality Management
London: Sage Publications Ltd .
Woodruff, R. B., & Gardial, S. F. (1996). Know your customer: new approaches to
understanding customer value and satisfaction. Malden: Blackwell Business.
World Tourism Organization, (2006). Measuring the economic importance of the meeting
industry. World Tourism Organization, Madrid, Spain
Yang, L., & Gu, Z. (2012). Capacity optimization analysis for the MICE industry in Las
Vegas. International Journal of Contemporary Hospitality Management. Vol. 24 Iss: 2
pp. 335 - 349
Zhang, L, & Ying, L. (2008). MICE Industry Clusters Usiing Location Quotient Estimation.
A Case from GuangZhou Cithy of China. Retrieved April 4, 2013 from
http://siteresources.worldbank.org/KENYAEXTN/Resources/Tourism_Report-
ESW_Kenya_Final_May_2010.pdf
Zhang, Q., Leung, V., & Qu, H. (2007). A Refined Model of Factors affecting Convention
Participation Decision-making. Tourism Management, 28: 1123-1127.
Zutt, J. (2010). Kenya’s Tourism: Polishing The Jewel. Retrieved April 12, 2013 from
http://siteresources.worldbank.org/KENYAEXTN/Resources/Tourism_Report-
ESW_Kenya_Final_May_2010.pdf
Page 87
74
APPENDICES
APPENDIX I - INTRODUCTORY LETTER
NJOROGE MARY WAITHIRA,
UNITED STATES INTERNATIONAL UNIVERSITY,
P.O. BOX 14634 – 00800,
NAIROBI – KENYA.
Dear Sir/ Madam,
RE: REQUEST TO PARTICIPATE IN MY RESEARCH.
I am a final year master’s student at United States International University pursuing a
Masters Degree in Business Administration in Marketing. In order to fulfill my degree, I am
required to write a research paper and in accordance, I have decided to write a thesis on the
factors that influence the consumption of MICE products.
The study focused on the following research objectives: to examine the effects of pricing on
the choice of MICE products by corporate companies, to evaluate the effects of product
attributes on MICE products consumption by corporate companies and to analyze the effects
of promotional activities on MICE products consumption by corporate companies.
For this research to be successful, I will need your assistance in answering the questions
attached. The information you give will be used for academic purposes and will be treated
with strict confidence. If you are interested in the results findings, please do not hesitate to
ask for them.
YOURS SINCERELY
NJOROGE MARY WAITHIRA.
Page 88
75
APPENDIX II: QUESTIONNAIRE
FACTORS INFLUENCING CONSUMPTION OF MICE PRODUCTS IN KENYA.
A CASE OF KENYA INTERNATIONAL CONFERENCE CENTER (KICC).
PART A: GENERAL INFORMATION
1. Entity Category (Please tick)
Corporate Politics and Governance
2. If corporate, which industry is your organization in? (Please tick)
i) Housing and Construction
ii) Banking
iii) Manufacturing
iv) Medical
v) Tourism and Hospitality
vi) Other (please Specify)
…………………………………………..
3. Which of the following events do you hold? (Please tick)
i) Meetings
ii) Incentives
iii) Conferences
iv) Exhibition
4. How many times in a year do you hold the event(s) No. 5 above? (Please tick)
i) 1-2
ii) 3-4
iii) More than 5
Page 89
76
5. Why do you hold event(s) No. 5 above? (Please tick)
i) It is a requirement by law
ii) We are constantly launching new products
iii) For strategic purposes
iv) Employee/member developments
v) Other (Please specify)
…………………………………
6. Which of the following venues do you hire for the events of No. 5 above?
i) KICC
ii) BOMAS of Kenya
iii) Safari Park Hotel
iv) Sarit Center
v) KIA
vi) Other (Please specify) …………………………………………..
7. Why you prefer the venue(s) stated above? (Please detail).
…………………………………………………………………………………………
…………………………………………………………………………………………
…………………………………………………………………………………………
…………………………………………………………………………………………
……………………
Page 90
77
PART B: PRICE
8. Do the following factors influence your choice of the venue?
Factor
Str
on
gly
dis
agre
e
Dis
agre
e
Neu
tral
Agre
e
Str
on
gly
agre
e
a The Budget in place for use at the time 1 2 3 4 5
b The ongoing promotions 1 2 3 4 5
c Cost for hire of space and facilities 1 2 3 4 5
d Free giveaways at the venue 1 2 3 4 5
e My company gets discounts 1 2 3 4 5
f Flexible payment terms 1 2 3 4 5
g Various packages on offer 1 2 3 4 5
9. Do you compare prices of various MICE venues before making your purchase
decision?
Yes No
If No, why? ………………………………………………………………………..
10. Do you find the prices of the MICE venues dynamic?
Yes No
If Yes, how does that influence your purchase decision?
………………………………………………………………………………….
………………………………………………………………………………….
11. Do you prefer hiring MICE venues as a package?
Yes No
If Yes, why? ……………………………………………………………………..
Page 91
78
PART C: PRODUCT ATTRIBUTES
12. Do you carry out research on the MICE venue and its physical facilities and
amenities before making the purchase? (please tick)
Yes No
13. If Yes or No to the above, why?
…………………………………………………………………………………………
…………………………………………………………………………………………
………………………………………………………………………………
14. To what extent does the following influence your choice of MICE venue? (Please
tick)
Factor
1.
To a
very
large
extent
2.
To a
large
extent
3.
To
some
extent
4.
To a
little
extent
5.
To no
extent
a Renowned brand
b Accessibility of the venue
c Forecourt and backcourt
d Parking Space
e Friendly Staff and their willingness to serve
clients
f One Stop Shop for a variety of services
g Security and safety measures highly observed
h Good clean toilet facilities
i Operating hours
Page 92
79
j State of the art technology
k Physical facilities and amenities
l Size of facilities vis a vis the type of event
m Reputation especially from previous experience
n Reliability of service delivery
o Appropriate skills, knowledge and
professionalism
p Audio Visual Equipment
15. The MICE venue of choice (KICC) offers an opportunity to explore other
tourism activities (Please tick).
Agree Disagree Don’t know
16. We are always concerned and worried about the MICE venue availability and
thus do our bookings months before the event. (Please tick)
Yes No
PART D: PROMOTIONAL ACTIVITIES
17. How did you come to know about the KICC?
i) Word of mouth
ii) Advertising
iii) Sales promotion
iv) Trade and professional magazines
v) Public Relations
vi) Personal selling
vii) Other (specify) ………………………………..
Page 93
80
18. The following factors influence your choice of MICE venue (Please tick
appropriately).
Factor
Str
on
gly
dis
agre
e
Dis
agre
e Neu
tral
Agre
e
Str
on
gly
agre
e
A Advertising 1 2 3 4 5
b Brand Awareness 1 2 3 4 5
c Customer Awareness 1 2 3 4 5
d Quality Venue 1 2 3 4 5
e Taste and preference 1 2 3 4 5
19. Do you ever change the MICE venues?
Yes No
20. If yes to No 22, to which
one?.............................................................................................
…………………………………………………………………………………………
……
21. If Yes to No. 22 above, why do you change the MICE venue?
…………………………………………………………………………………………
…………………………………………………………………………………………
…………………………………………………………………………………………
………………
22. How do you learn about upcoming conferences and exhibitions of interest?
i. Websites
ii. Intermediaries/marketing agencies
iii. Brochures
iv. Press and public relations
v. Personal selling
Page 94
81
vi. Other (specify)
……………………………………….
23. Do you think the mode of promotion used by your MICE service provider is
efficient?
Yes No
24. If Yes or No to No. 26 above, why?
…………………………………………………………………………………………
…………………………………………………………………………………………
…………
PART E: PLACE/DISTRIBUTION
25. We hire MICE venues in (Please tick)
i. Whole package
ii. Individual elements
26. Why do you hire MICE venues in the form stated in No. 28 above?
…………………………………………………………………………………………
…………………………………………………………………………………………
…………………………………………………………………………………………
…………………………………………………………………………………………
…………………..
27. We hire MICE venues (Please tick)
i. Directly from the service provider
ii. From specialist independent intermediaries/agents
28. Why do you prefer the channel stated in No. 30 above?
…………………………………………………………………………………………
…………………………………………………………………………………………
Page 95
82
…………………………………………………………………………………………
………………
29. To what extent do the following factors influence your choice of MICE Venue?
(Please tick)
1.
To a very
large
extent
2.
To a
large
extent
3.
To
some
extent
4.
To a
little
extent
5.
To no
extent
The distribution channel used by the service
provider
Physical distribution/ the means of delivering
the service
Negotiations of high- quality arrangements and
contracts
Established contacts
30. Do you believe that the distribution channel employed by your MICE service
provider is effective?
Yes No Don’t Know
PART F: CONSUMPTION OF MICE PRODUCTS
38. MICE tourism offers an effective platform for marketing tourism industry to the
world.
Yes
No
39. How do you agree to the following statements? (Please tick)
Page 96
83
STATEMENT Stron
gly
disagr
ee
Disagr
ee
Unde
cided
Agre
e
Stron
gly
agree
a) MICE tourism is a great source of both direct and
indirect revenue for entrepreneurs and the
government
1 2 3 4 5
b) MICE industry offers all year-round employment
opportunities
1 2 3 4 5
c) MICE tourism extends business to the off-peak
seasons
1 2 3 4 5
d) MICE tourism is environmental friendly 1 2 3 4 5
40. What is your recommendation regarding consumption of MICE products in
Kenya?
___________________________________________________________________________
___________________________________________________________________________
___________________________________________________________________________
___________________________________________________________________________
____________________________________________________________
Thank You