Page 1
FACTORS REGULATING UREA-NITROGEN RECYCLING IN
RUMINANTS
A Thesis Submitted to
the College of Graduate Studies and Research
in Partial Fulfillment of the Requirements for
the Degree of Doctor of Philosophy
in the Department of Animal and Poultry Science
University of Saskatchewan
Saskatoon, SK
Canada
By
KIRAN DORANALLI
Copyright Kiran Doranalli, December, 2010. All rights reserved.
Page 2
i
PERMISSION TO USE
In presenting this thesis in partial fulfillment of the requirements for a Postgraduate
degree from the University of Saskatchewan, I agree that the Libraries of this University may
make it freely available for inspection. I further agree that permission for copying of this thesis
in any manner, in whole or in part, for scholarly purposes may be granted by the professor or
professors who supervised my thesis work or, in their absence, by the Head of the Department or
the Dean of the College in which my thesis work was done. It is understood that any copying or
publication or use of this thesis or parts thereof for financial gain shall not be allowed without
my written permission. It is also understood that due recognition shall be given to me and to the
university of Saskatchewan in any scholarly use which may be made of any material in my
thesis.
Requests for permission to copy or to make other use of material in this thesis in whole or
part should be addressed to:
Head of the Department of Animal and Poultry Science
University of Saskatchewan
51 Campus Drive, Saskatoon SK, S7N 5A8
Canada
Page 3
ii
ABSTRACT
A series of experiments were conducted to investigate how dietary and ruminal factors
regulate urea-N recycling in ruminants. In Experiments 1, 2, and 3, urea-N kinetics were
measured using 4-d intra-jugular infusions of [15
N15
N]-urea. In Experiment 1, the objective was
to determine how interactions between dietary ruminally-degradable protein (RDP) level and
ruminally-fermentable carbohydrate (RFC) may alter urea-N transfer to the gastrointestinal tract
(GIT) and the utilization of this recycled urea-N in rapidly-growing lambs fed high N diets. The
dietary factors were: 1) dry-rolled barley (DRB) vs. pelleted barley (PB) as the principal source
of RFC; and 2) dietary levels of RDP of 60 vs. 70% (% of CP). Nitrogen intake, fecal and
urinary N excretion increased as dietary RDP level increased; however, method of barley
processing had no effect on N use. Dietary treatment had no effect on urea-N kinetics; however,
endogenous production of urea-N (UER) exceeded N intake. For all diets, 0.669 to 0.742 of UER
was recycled to the GIT; however, 0.636 to 0.756 of the GER was returned to the ornithine
cycle. In Experiment 2, the objective was to delineate the effects of partial defaunation of the
rumen on urea-N kinetics in lambs fed low or high N diets. Treatments were: 1) partial
defaunation (PDFAUN) vs. faunation (FAUN); and 2) low (10%, LOW) vs. high (15%, HIGH)
dietary CP. Linoleic acid-rich sunflower oil was fed as a partially-defaunating agent. Partial
defaunation decreased ruminal NH3-N concentrations. The UER and urinary urea-N excretion
(UUE) were lower, and the GER tended to be lower in PDFAUN as compared to FAUN lambs;
however, as a proportion of UER, GER was higher and the proportion of recycled urea-N that
was utilized for anabolism (i.e., UUA) tended to be higher in PDFAUN lambs. The UER, GER
and UUE were higher in lambs fed diet HIGH; however, as a proportion of UER, GER and its
anabolic use were higher in lambs fed diet LOW. In Experiment 3, the objective was to delineate
how, at similar N intakes, interactions between ruminal partial defaunation and altering dietary
RFC may alter urea-N kinetics and N metabolism in lambs. Treatments were: 1) PDFAUN vs.
FAUN; and 2) DRB vs. PB. Urinary N excretion was lower and retained N was higher in
PDFAUN compared to FAUN lambs. The UER was similar across treatments; however, the
GER, expressed as absolute amounts or as a proportion of UER, UUA, and microbial N supply
were higher in PDFAUN compared to FAUN lambs. As a proportion of UER, GER was higher,
whereas UUE was lower in lambs fed PB compared to those fed DRB. In Experiment 4, the
Page 4
iii
objective was to determine the effects of feeding oscillating dietary CP compared to static dietary
CP concentration on N retention and in vitro urea flux across ruminal epithelia. Dietary
treatments consisted of a medium CP diet (MEDIUM; 12.8% CP) or diets with oscillating CP
content (OSC) fed in two different sequences i.e., 2 d of low CP (9.7% CP) followed by 2 d of
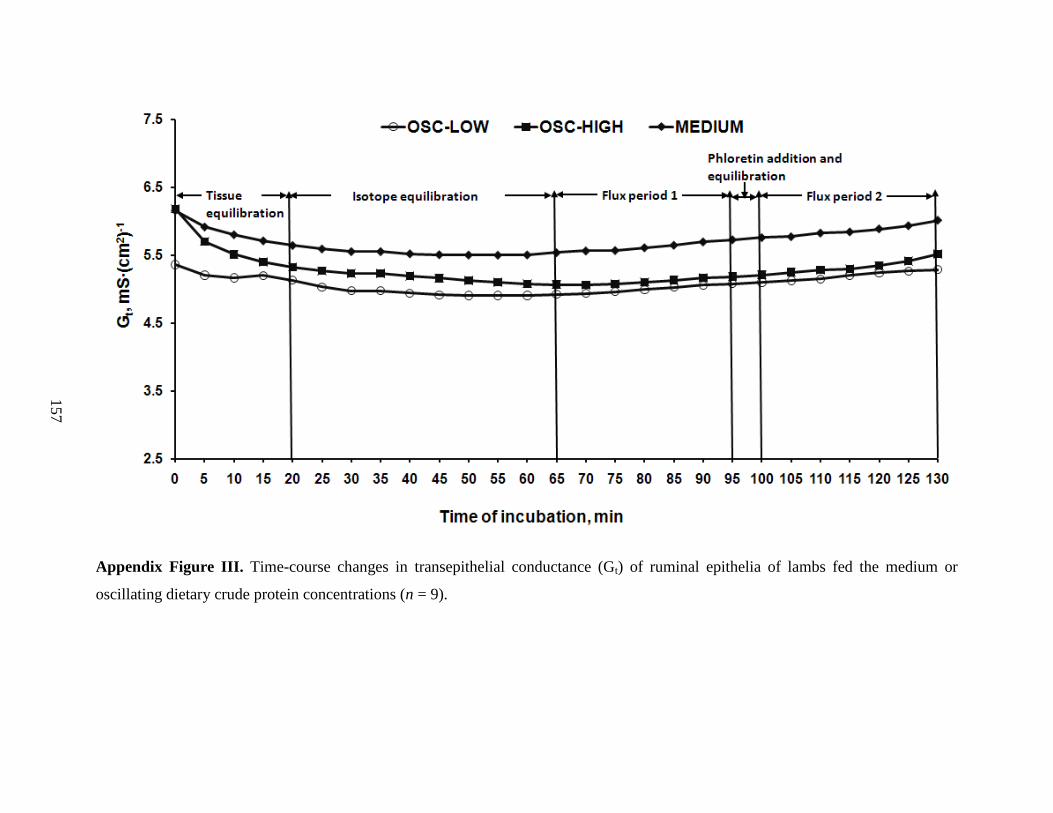
high CP (16.1% CP; OSC-HIGH) or vice-versa (OSC-LOW). Ruminal epithelial tissues were
collected and mounted in Ussing chambers under short-circuit conditions and the serosal-to-
mucosal urea flux (Jsm-urea) was measured using 14
C-urea. Although N intake was similar,
retained N and microbial N supply were greater in lambs fed the OSC diets compared to those
fed the MEDIUM diet. The total Jsm-urea was higher in lambs fed the OSC-LOW compared to
those fed the OSC-HIGH diet. Across diets, the addition of phloretin (a known specific inhibitor
of facilitative urea transporter-B; UT-B) reduced Jsm-urea; however, phloretin-insensitive Jsm-urea
was the predominant route for transepithelial urea transfer. In summary, data presented in this
thesis provide new insights that the improved N retention typically observed in defaunated
ruminants and in ruminants fed oscillating dietary CP concentrations is partly mediated via
increased urea-N recycling to the GIT and utilization of recycled urea-N for anabolic purposes.
Page 5
iv
ACKNOWLEDGEMENTS
I wish to express sincere gratitude to my supervisor, Dr. Tim Mutsvangwa, for his
resolute encouragement, generous support and constructive criticism during my entire Ph.D.
program. It is on the account of scientific training that he has imparted to me, that I wish and, I
can hope to continue and contribute to science. I truly value his friendship and guidance. Thanks
to Drs. John McKinnon, Andrew Van Kessel, Darren Korber, and Bernard Laarveld (Graduate
Chair) for taking time out of their busy schedules to serve on my committee. Appreciation is
extended to Dr. Héléne Lapierre for serving as an external examiner and for her valuable
suggestions and constructive criticism.
Special thanks to my friend Prabha, for introducing me to Dr. Mutsvangwa. I would also
like to thank Dr. Greg Penner for his valuable time, suggestions and guidance for setting up
Ussing chambers, and in conducting my last experiment.
I gratefully thank Andy Hanson, Réal Lepage and staff of Livestock Research Building
for their assistance in setting up metabolism crates and for animal care. No journey is complete
without tremendous help and support from fellow students and staff. I would like to extend my
sincere thanks Gwen Kipfer, Kate Davies, Dr. George Gozho, Gwinyai Chibisa, and Rachel
Claassen for their assistance with animal care, sample collection and laboratory analysis. I am
grateful to the University of Saskatchewan for providing the infrastructure and facilities to
conduct my research, and to the Natural Sciences and Engineering Research Council of Canada
(NSERC) for funding the research. I would also like to especially thank Jason Marshall, for his
help with qPCR. Appreciation is also extended to Dr. Mulvaney, Professor, Department of
Natural Resources and Environmental Sciences, University of Illinois at Urbana-Champaign, for
urinary [15
N15
N]-urea analysis and Mr. Myles Stocki, Manager, Stable Isotope Laboratory,
Department of Soil Science, University of Saskatchewan for his technical help in fecal 15
N
analysis. I appreciate Dr. Srinivas Seekallu‟s help for showing me how to put jugular vein
catheters in sheep and in addition, thanks to Drs. S. Kanagal, P. G. Medihala, M. A. Munegouda,
S. Channabasappa, M. Vijay Kumar and C. S. Umeshappa, for their help to put jugular vein
catheters on weekends for all my experiments. I would also like to acknowledge researchers,
faculty and staff of the Department of Animal and Poultry Science for their support and
friendship.
Page 6
v
Thanks to my friends in Saskatoon; Prabha, Sri, Seena, Reddy, Tarakka, Naveen, Nag,
Vijay, Raghu, Manju, Keshav and Shankar, for their support and friendship. Special thanks are
due to Dr. Renuka and Dr. Sujatha Prasad (Sir and Attige to me) for providing me a home away
from home.
I am short of words to express my deepest gratitude and feelings to my parents (Amma
and Appaji), my brothers (Mahesh and Vijay), Babhis (Shivaleela and Veena), Aunty and Uncle,
Ashok and Pampu mama, and to all my family back home in India for their everlasting support,
love and motivation. Finally, I want to thank my wife Gouri. I am not sure how I would have
gotten through the last few years without you. You are my love and my inspiration.
Page 7
vi
Dedicated to
My Late Grandmother Smt. Channamma Hallur
For her sacrifices, support, and unconditional love to all
the family members. Your demise is an irreparable loss to
the whole family, but you are still with us. I pledge to keep
your dreams and visions.
Page 8
vii
TABLE OF CONTENTS
PERMISSION TO USE.………………………………………………………………….. i
ABSTRACT.………………………………………………………………………………. ii
ACKNOWLEDGEMENTS .……………………………………………………………... iv
DEDICATION.……………………………………………………………………………. vi
TABLE OF CONTENTS …………………………………………………………………. vii
LIST OF TABLES ……………………………………………………………………….... xii
LIST OF FIGURES ………………………………………………………………………. xv
LIST OF ABBREVIATION ……………………………………………………………… xviii
1. GENERAL INTRODUCTION …………………………………………………... 1
2. REVIEW OF LITERATURE ……………………………………………………. 3
2.1 Nitrogen Metabolism in the Rumen ………………………………………………... 3
2.1.1 Mechanism of Dietary Protein Degradation in the Rumen ………………… 5
2.1.2 Ammonia Absorption across the Ruminal Epithelium ……………………. 6
2.2 Ammonia Detoxification in the Liver ……………………………………………… 9
2.3 Urea-N Recycling …………………………………………………………………... 11
2.4 Sites of Urea-N Recycling to the GIT ……………………………………………… 13
2.4.1 Urea-N Entry into the Rumen ……………………………………………… 13
2.4.1.1 Urea-N Entry into the Rumen via Transfer Across the Ruminal wall 13
2.4.1.2 Urea-N Entry into the Rumen via Salivary Secretions …………….. 15
2.4.2 Urea-N Entry into the Small Intestine ……………………………………… 16
2.4.3 Urea-N Entry into the Large Intestine ……………………………………… 16
2.5 Magnitude of Urea-N Recycling to the GIT ……………………………………….. 16
2.6 Factors Regulating Urea-N Recycling to the GIT ………………………………….. 18
Page 9
viii
2.6.1 Dietary Factors ……………………………………………………………... 18
2.6.1.1 Dietary N Concentration and Intake ……………………………….. 18
2.6.1.2 Frequency of Dietary Protein Supplementation ……………………. 19
2.6.1.3 Ruminally-Degradable Protein and Protein Solubility …………….. 20
2.6.1.4 Dietary Ruminally-Fermentable Carbohydrate …………………….. 21
2.6.2 Ruminal factors …………………………………………………………….. 23
2.6.2.1 Ruminal NH3-N Concentration …………………………………….. 23
2.6.2.2 Ruminal CO2 ……………………………………………………….. 24
2.6.2.3 Ruminal VFA and pH ……………………………………………… 24
2.6.2 Plasma Urea-N ……………………………………………………………... 25
2.7 Conclusions ………………………………………………………………………… 26
3. EFFECTS OF BARLEY GRAIN PROCESSING AND DIETARY
RUMINALLY-DEGRADABLE PROTEIN ON UREA-NITROGEN
RECYCLING AND NITROGEN METABOLISM IN GROWING LAMBS …
27
3.1 Abstract …………………………………………………………………………….. 27
3.2 Introduction ………………………………………………………………………… 28
3.3 Materials and Methods ……………………………………………………………... 29
3.3.1 Animals and Experimental Design …………………………………………. 29
3.3.2 Experimental Treatments and Feeding Management ………………………. 29
3.3.3 Sample Collection ………………………………………………………….. 31
3.3.4 Sample Analyses …………………………………………………………… 33
3.3.5 Calculations of Urea-N Kinetics …………………………………………… 35
3.3.6 Statistical Analysis …………………………………………………………. 35
3.4 Results and Discussion ……………………………………………………………... 36
Page 10
ix
3.4.1 Diet Characteristics ………………………………………………………… 36
3.4.2 Intakes, N balance, Urea-N kinetics, and Microbial NAN Supply ………… 38
3.4.3 Conclusions ………………………………………………………………… 47
4. EFFECTS OF PARTIAL RUMINAL DEFAUNATION ON UREA-
NITROGEN RECYCLING, NITROGEN METABOLISM, AND
MICROBIAL NITROGEN SUPPLY IN GROWING LAMBS FED LOW OR
HIGH DIETARY CRUDE PROTEIN CONCENTRATIONS …………………
48
4.1 Abstract …………………………………………………………………………….. 48
4.2 Introduction ………………………………………………………………………… 49
4.3 Materials and Methods ……………………………………………………………... 49
4.3.1 Animals and Experimental Design …………………………………………. 49
4.3.2 Experimental Treatments and Feeding Management ………………………. 50
4.3.3 Partial Defaunation and Refaunation ………………………………………. 50
4.3.4 Sample Collection ………………………………………………………….. 52
4.3.5 Sample Analyses …………………………………………………………… 53
4.3.6 Urea Transporter-B Gene Expression Analysis ……………………………. 55
4.3.7 Calculations of Urea-N Kinetics and Statistical Analysis ………………….. 56
4.4 Results and Discussion ……………………………………………………………... 56
4.4.1 Diet Characteristics ………………………………………………………… 56
4.4.2 Ruminal Protozoal Numbers and Fermentation Characteristics …………… 57
4.4.3 Dry Matter Intake and Total Tract Digestibilities ………………………….. 60
4.4.4 Nitrogen Balance …………………………………………………………… 62
4.4.5 Urea-N Kinetics, Expression of Urea Transporter-B, and Microbial NAN
Supply ………………………………………………………………………
65
Page 11
x
4.5 Conclusions ………………………………………………………………………… 74
5. FEEDING SUNFLOWER OIL TO PARTIALLY DEFAUNATE THE
RUMEN INCREASES NITROGEN RETENTION, UREA-NITROGEN
RECYCLING TO THE GASTROINTESTINAL TRACT AND ANABOLIC
USE OF RECYCLED UREA-NITROGEN IN GROWING LAMBS …………
75
5.1 Abstract …………………………………………………………………………….. 75
5.2 Introduction ………………………………………………………………………… 76
5.3 Materials and Methods ……………………………………………………………... 77
5.3.1 Animals and Experimental Design …………………………………………. 77
5.3.2 Experimental Treatments and Feeding Management ………………………. 78
5.3.3 Partial Defaunation and Refaunation ………………………………………. 78
5.3.4 Sample Collection ………………………………………………………….. 80
5.3.5 Sample Analyses …………………………………………………………… 81
5.3.7 Calculations of Urea-N Kinetics and Statistical Analysis ………………….. 83
5.4 Results ……………………………………………………………………………… 83
5.4.1 In Situ Ruminal Starch Degradation Kinetics ……………………………… 83
5.4.2 Dry Matter Intake and Total Tract Nutrient Digestibilities ………………... 83
5.4.3 Ruminal Protozoa Counts and Fermentation Characteristics ………………. 86
5.4.4 Nitrogen Balance and Plasma Urea-N Concentration ……………………… 88
5.4.5 Urea-N Kinetics, mRNA abundance of Urea Transporter-B, and Microbial
NAN Supply …………………………………………………………………
88
5.5 Discussion ………………………………………………………………………….. 95
5.6 Conclusions ………………………………………………………………………… 101
6. FEEDING OSCILLATING DIETARY PROTEIN CONCENTRATIONS
INCREASES NITROGEN UTILIZATION IN GROWING LAMBS AND
Page 12
xi
THIS RESPONSE IS PARTLY ATTRIBUTABLE TO INCREASED UREA
TRANSFER TO THE RUMEN …………………………………………………..
102
6.1 Abstract …………………………………………………………………………….. 102
6.2 Introduction ………………………………………………………………………… 103
6.3 Materials and Methods ……………………………………………………………... 104
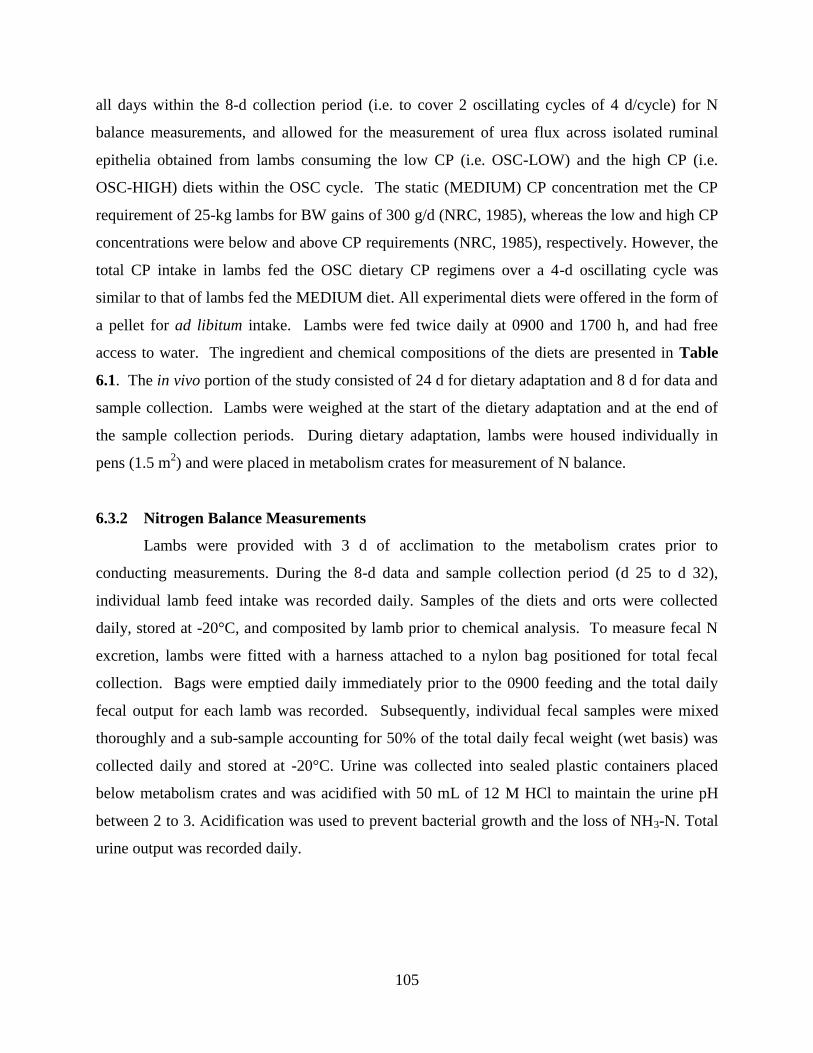
6.3.1 Animals, Experimental Treatments and Feeding Management ……………. 104
6.3.2 Nitrogen Balance Measurements …………………………………………... 105
6.3.3 Ussing Chamber Measurements ……………………………………………. 107
6.3.4 Sample Analyses …………………………………………………………… 109
6.3.5 Calculations and Statistical Analysis ………………………………………. 110
6.4 Results ……………………………………………………………………………… 111
6.4.1 Dry Matter and Organic Matter Intake, Organic Matter Digestibility and N
Balance ……………………………………………………………………...
111
6.4.2 Ruminal Characteristics ……………………………………………………. 111
6.4.3 Microbial NAN Supply …………………………………………………….. 115
6.4.4 Urea Flux across the Ruminal Epithelium ………………………………… 115
6.5 Discussion ………………………………………………………………………….. 121
6.6 Conclusions ………………………………………………………………………… 126
7. GENERAL DISCUSSION ………………………………………………………... 127
8. OVERALL CONCLUSIONS …………………………………………………….. 131
9. REFERENCES ……………………………………………………………………. 132
10. APPENDICES …………………………………………………………………….. 148
10.1 Appendix Tables …………………………………………………………………... 148
10.2 Appendix Figures ………………………………………………………………….. 155
Page 13
xii
LIST OF TABLES
Table 2.1 Urea-N kinetics in different species…………………………………………. 12
Table 3.1 Ingredient and chemical composition of concentrates mixtures with low or
high ruminally-degradable protein (RDP) containing dry rolled barley
(DRB) or pelleted barley (PB)………………………………………………..
30
Table 3.2 Chemical composition of total mixed rations containing 80% concentrate
mixture and 20% barley silage (DM basis) with low or high ruminally-
degradable protein (RDP) and dry rolled (DRB) or pelleted barley (PB)……
32
Table 3.3 In situ ruminal degradation kinetics of CP and starch in total mixed rations
with low or high ruminally-degradable protein (RDP) containing dry-rolled
(DRB) or pelleted barley (PB)………………………………………………..
37
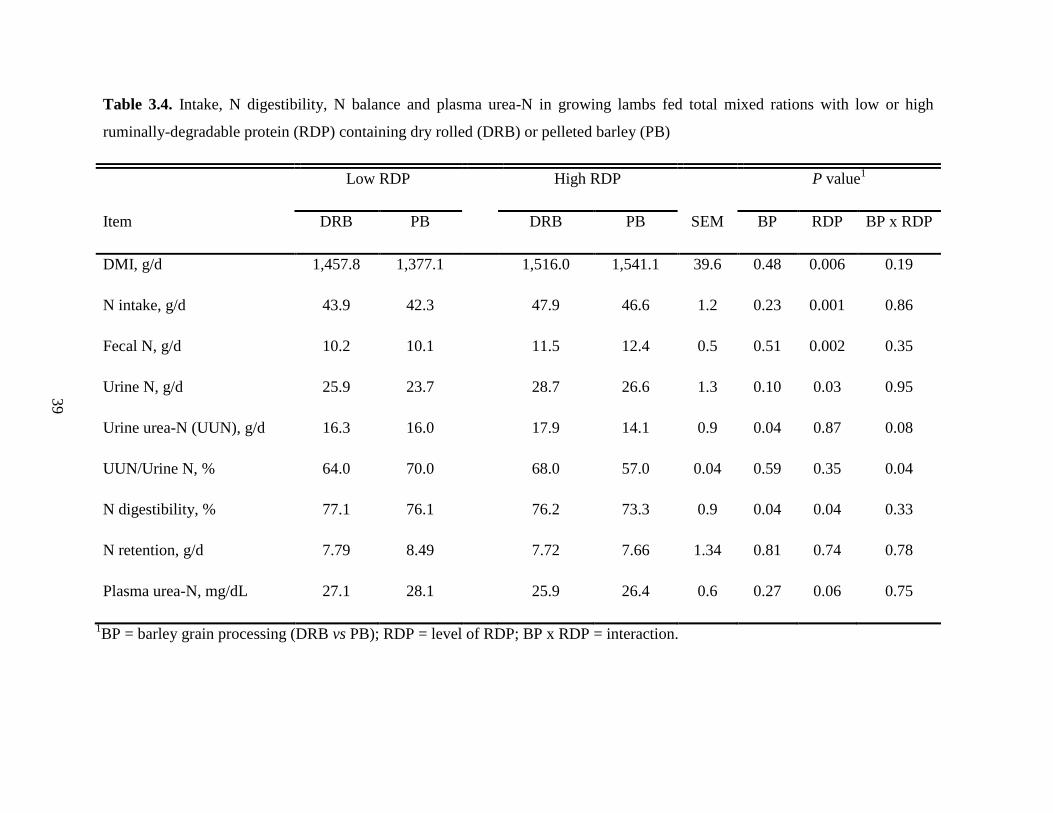
Table 3.4 Intake, N digestibility, N balance and plasma urea-N in growing lambs fed
total mixed rations with low or high ruminally-degradable protein (RDP)
containing dry rolled (DRB) or pelleted barley (PB)………………………...
39
Table 3.5 Urea-N recycling kinetics as measured using 4-d continuous jugular
infusions of [15
N15
N]-urea in growing lambs fed total mixed rations with
low or high ruminally-degradable protein (RDP) containing dry rolled
(DRB) or pelleted barley (PB)………………………………………………..
43
Table 3.6 Organic matter intake and OM digestibility, urinary purine derivative (PD)
excretion and microbial non-ammonia nitrogen (NAN) supply in growing
lambs fed total mixed rations with low or high ruminally-degradable protein
(RDP) containing dry rolled (DRB) or pelleted barley (PB)………………...
46
Table 4.1 Ingredient and nutrient composition of experimental diets………………….. 51
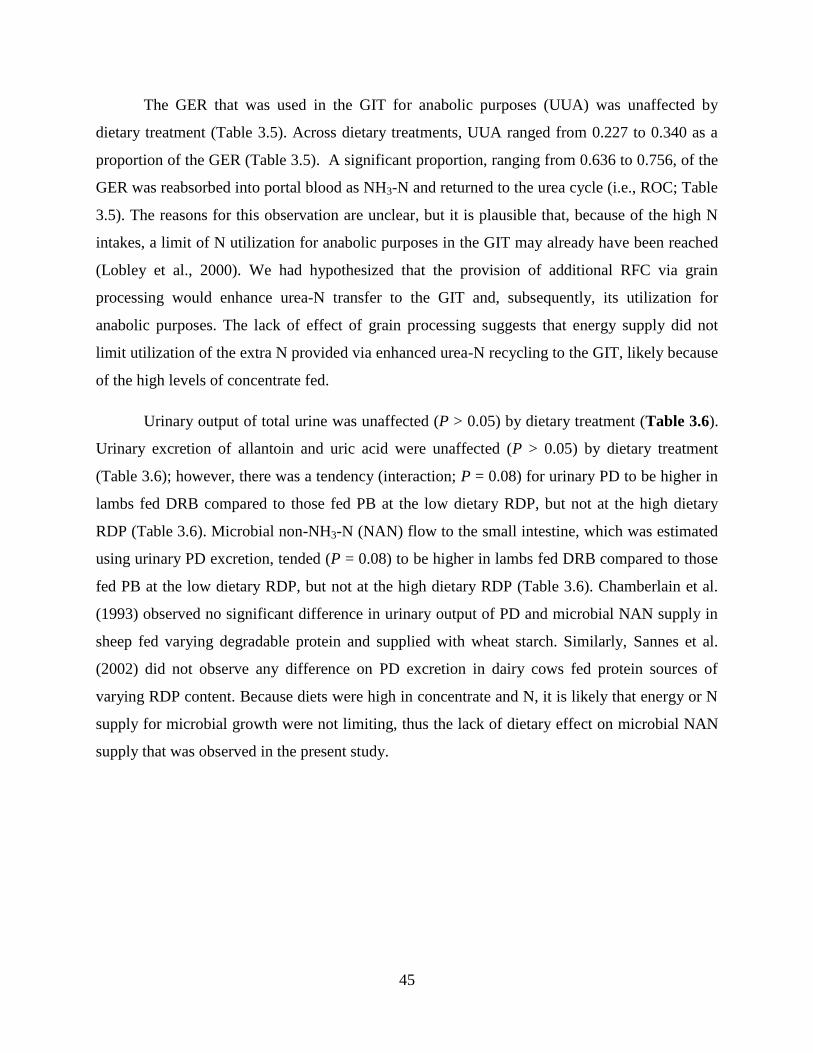
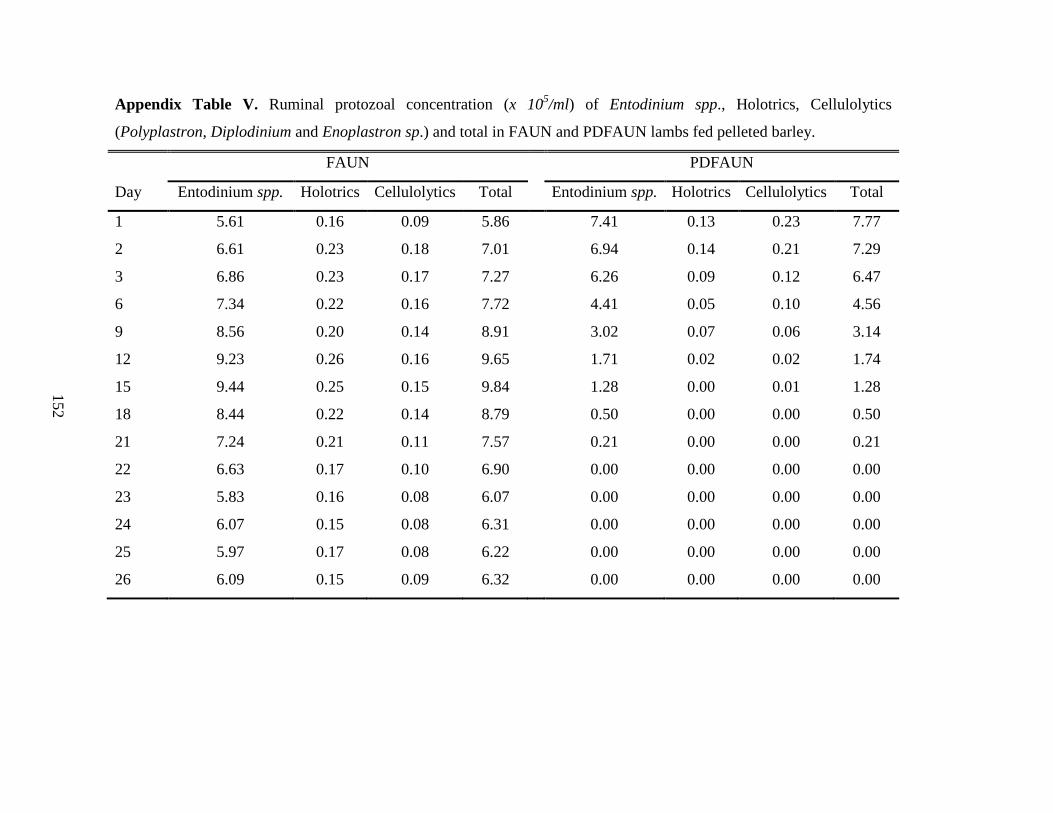
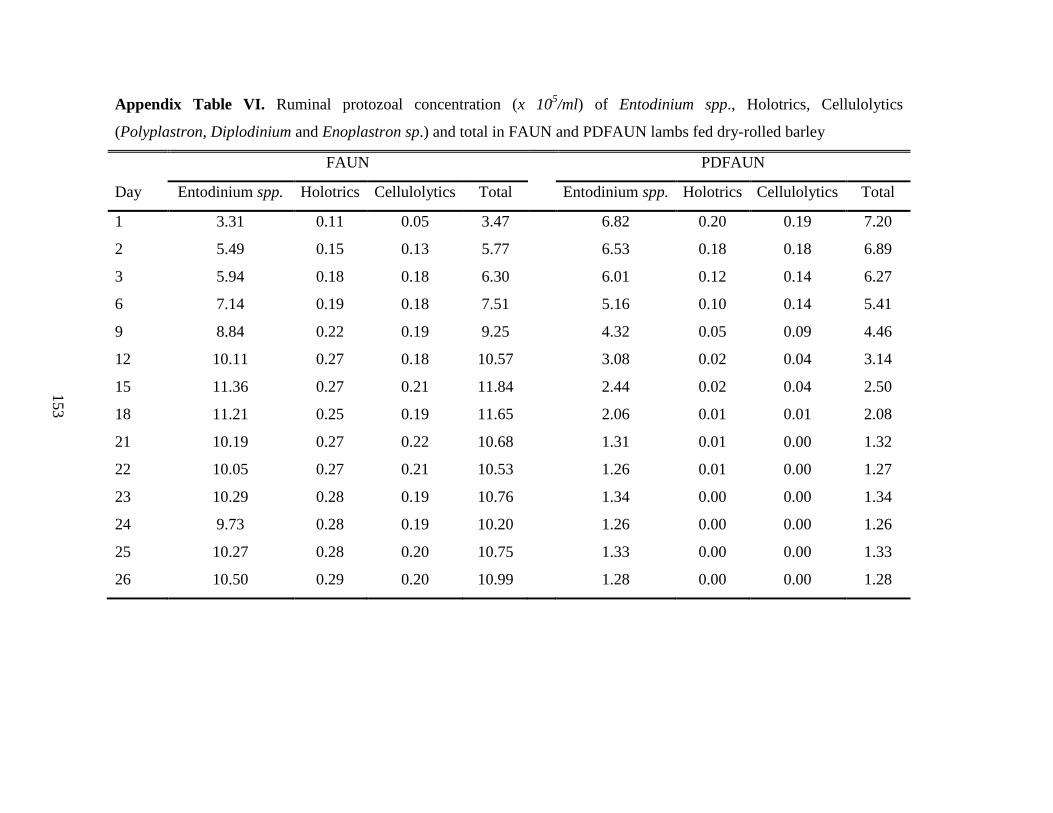
Table 4.2 Ruminal protozoal numbers and ruminal fermentation characteristics in
partially-defaunated (PDFAUN) or faunated (FAUN) growing lambs fed
LOW or HIGH dietary crude protein levels………………………………….
58
Table 4.3 Dry matter (DM), energy and organic matter (OM) intakes, and total tract
nutrient digestibility in partially-defaunated (PDFAUN) or faunated
(FAUN) growing lambs fed LOW or HIGH dietary crude protein levels……
61
Page 14
xiii
Table 4.4 Nitrogen (N) intake, N balance, and plasma-urea nitrogen in partially-
defaunated (PDFAUN) or faunated (FAUN) growing lambs fed LOW or
HIGH dietary crude protein levels……………………………………………
63
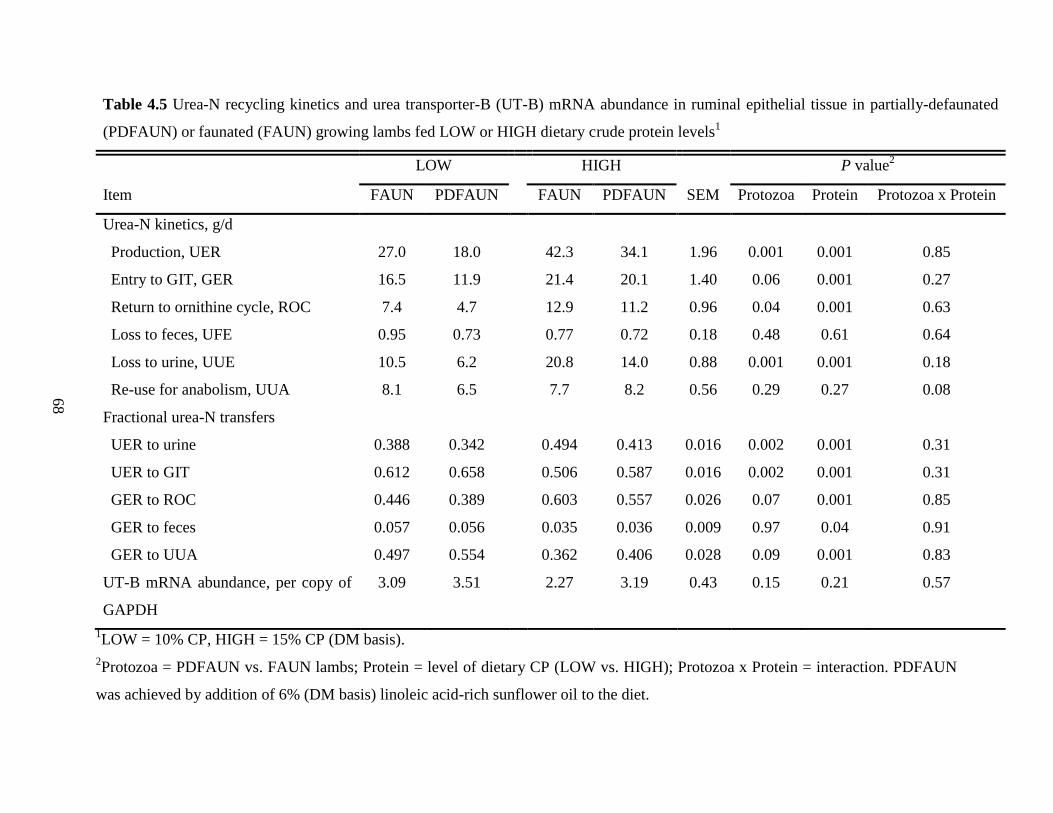
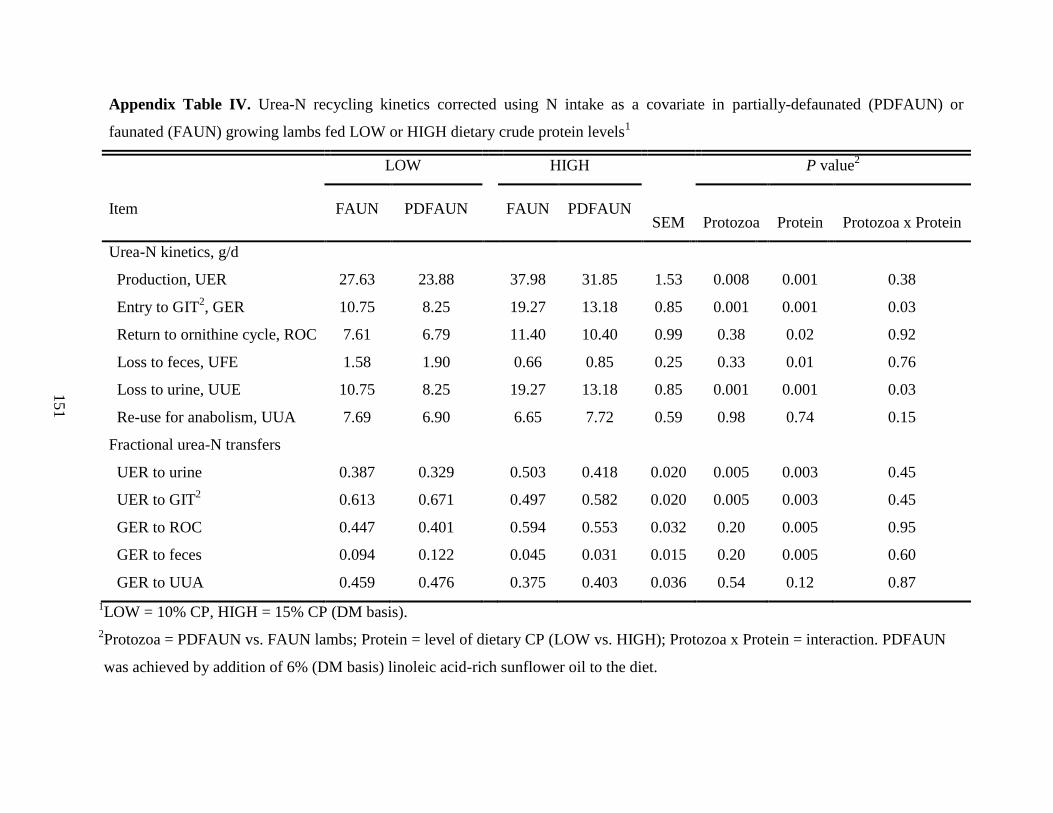
Table 4.5 Urea-N recycling kinetics and urea transporter-B (UT-B) mRNA abundance
in ruminal epithelial tissue in partially-defaunated (PDFAUN) or faunated
(FAUN) growing lambs fed LOW or HIGH dietary crude protein levels……
68
Table 4.6 Urinary output, urinary purine derivative (PD) excretion, and microbial non-
ammonia nitrogen (NAN) supply in partially-defaunated (PDFAUN) or
faunated (FAUN) growing lambs fed LOW or HIGH dietary CP levels…….
72
Table 5.1 Ingredient and chemical composition of experimental diets………………… 79
Table 5.2 In situ ruminal degradation kinetics of starch in experimental diets
containing dry-rolled barley or pelleted barley………………………………
84
Table 5.3 Sunflower oil (SFO), dry matter (DM), and organic matter (OM) intakes,
and total tract nutrient digestibility in partially-defaunated (PDFAUN) or
faunated (FAUN) growing lambs fed dry-rolled or pelleted barley………….
85
Table 5.4 Ruminal fermentation characteristics and protozoa numbers in partially-
defaunated (PDFAUN) or faunated (FAUN) growing lambs fed dry-rolled
or pelleted barley……………………………………………………………..
87
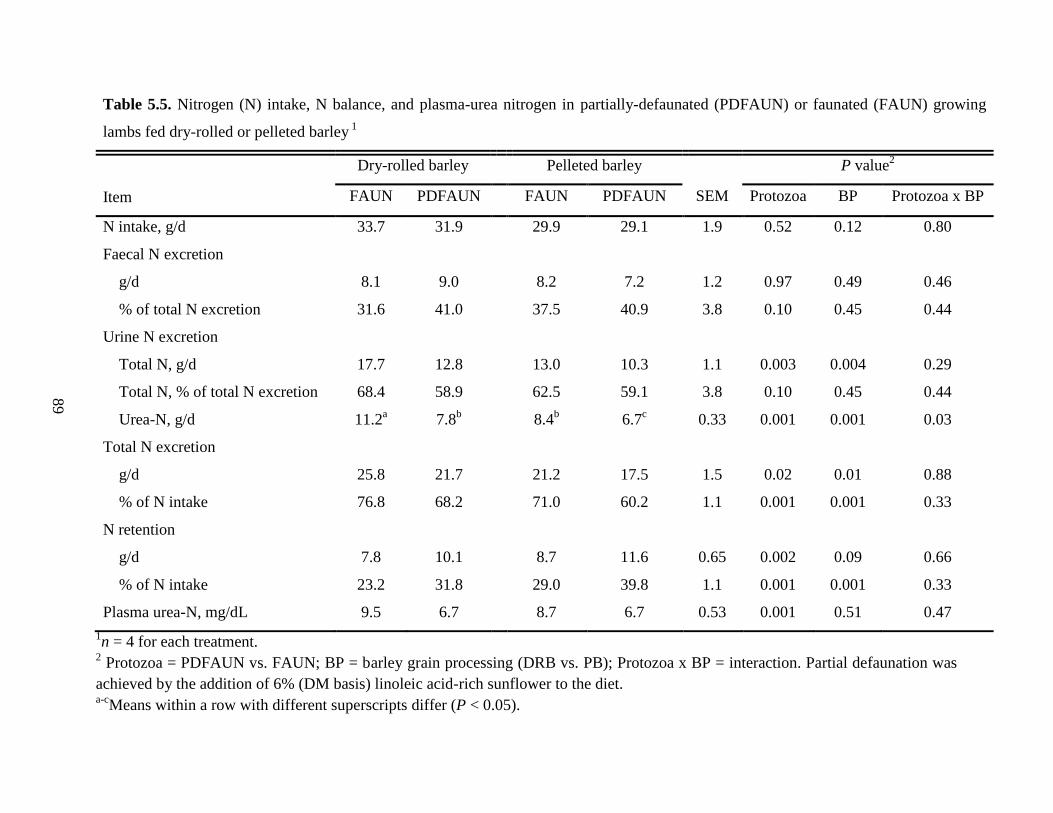
Table 5.5 Nitrogen (N) intake, N balance, and plasma-urea nitrogen in partially-
defaunated (PDFAUN) or faunated (FAUN) growing lambs fed dry-rolled
or pelleted barley……………………………………………………………..
89
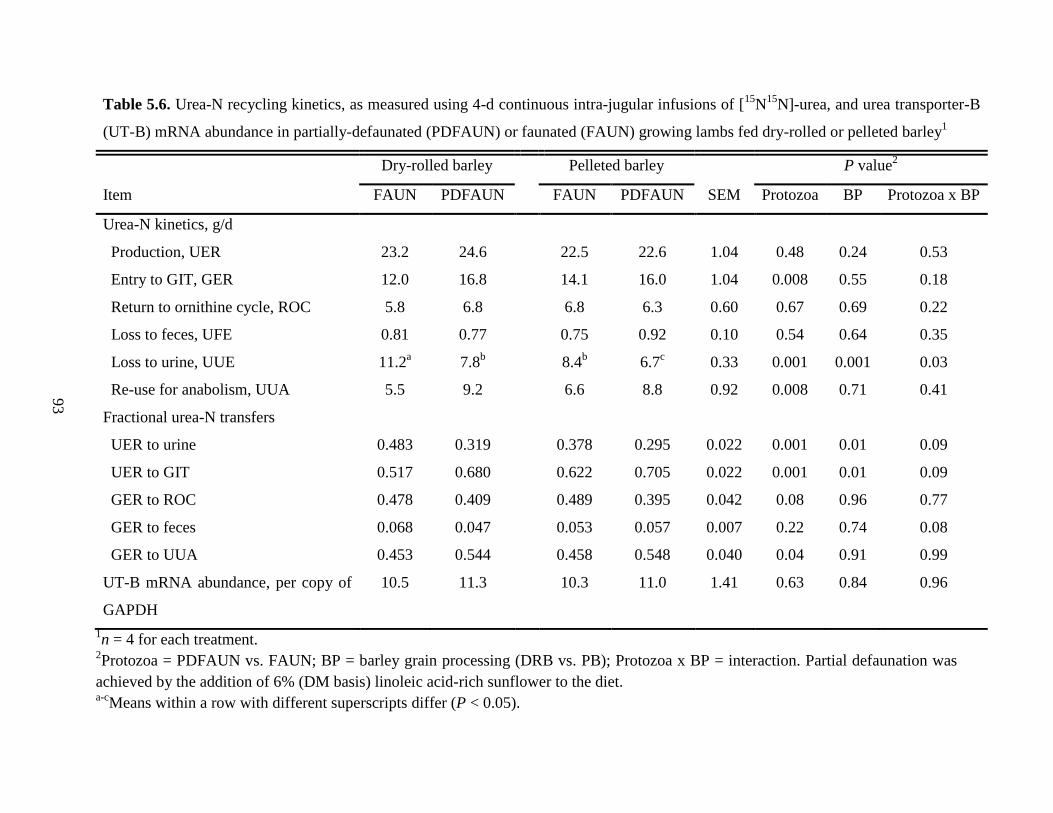
Table 5.6 Urea-N recycling kinetics, as measured using 4-d continuous intra-jugular
infusions of [15
N15
N]-urea, and urea transporter-B (UT-B) mRNA
abundance in partially-defaunated (PDFAUN) or faunated (FAUN) growing
lambs fed dry-rolled or pelleted barley……………………………………….
93
Table 5.7 Urinary output, urinary purine derivative (PD) excretion, and microbial non-
ammonia nitrogen (NAN) supply in in partially-defaunated (PDFAUN) or
faunated (FAUN) growing lambs fed dry-rolled or pelleted barley………….
94
Table 6.1 Ingredient and chemical composition of experimental diets………………… 106
Page 15
xiv
Table 6.2 Dry matter (DM), organic matter (OM) and nitrogen (N) intakes, total-tract
OM digestibility, N balance, and ADG in growing lambs fed medium or
oscillating (OSC) dietary crude protein content……………………………...
112
Table 6.3 Ruminal characteristics at the time of slaughter in growing lambs fed
medium or oscillating (OSC) dietary crude protein content………………….
114
Table 6.4 Urinary purine derivative (PD) excretion and microbial non-ammonia
nitrogen (NAN) supply in growing lambs fed medium or oscillating (OSC)
dietary crude protein content…………………………………………………
116
Table 6.5 Serosal-to-mucosal urea flux (Jsm-urea) rates in ruminal epithelial tissues
obtained from lambs slaughtered after feeding fed a medium CP diet
(MEDIUM) or oscillating (OSC) dietary CP level…………………………...
118
Page 16
xv
LIST OF FIGURES
Figure 2.1 Overview of nitrogen metabolism in the rumen……………………………... 4
Figure 2.2 Ammonia absorption across the ruminal epithelium (modified from Rémond
et al., 1996 and Abdoun et al., 2007)…………………………………………
8
Figure 2.3 Detoxification of ammonia in the liver (adapted from Meijer et al., 1990). 10
Figure 2.4 Urea transport across the ruminal epithelium (modified from Abdoun et al.,
2010)………………………………………………………………………….
14
Figure 2.5 Fates of urea-N synthesized in the liver in ruminants. Compiled from:
Sarasecca et al., 1998; Lobley et al., 2000; Archibeque et al., 2001; Marini
and Van Amburgh, 2003; Marini et al., 2004; Sunny et al., 2007; Gozho et
al., 2008; Wickersham et al., 2008a, b……………………………………….
17
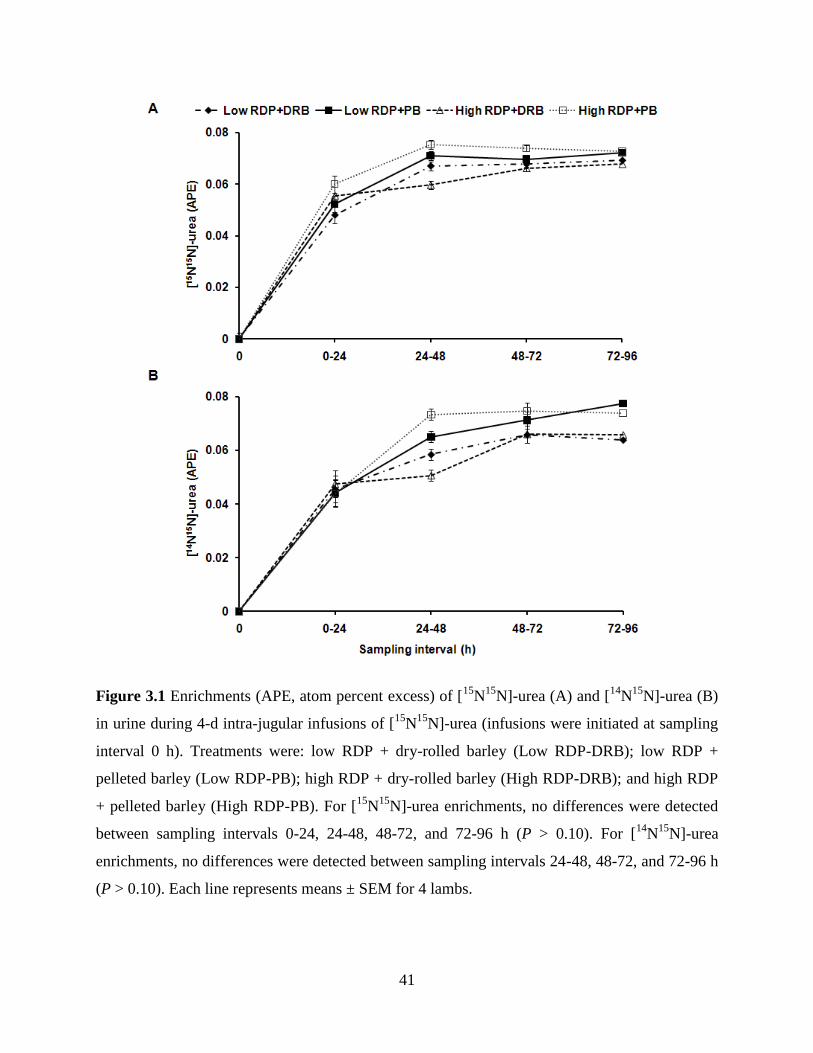
Figure 3.1 Enrichments (APE, atom percent excess) of [15
N15
N]-urea (A) and [14
N15
N]-
urea (B) in urine during 4-d intra-jugular infusions of [15
N15
N]-urea
(infusions were initiated at sampling interval 0 h). Treatments were: low
RDP + dry-rolled barley (Low RDP-DRB); low RDP + pelleted barley
(Low RDP-PB); high RDP + dry-rolled barley (High RDP-DRB); and high
RDP + pelleted barley (High RDP-PB). For [15
N15
N]-urea enrichments, no
differences were detected between sampling intervals 0-24, 24-48, 48-72,
and 72-96 h (P > 0.10). For [14
N15
N]-urea enrichments, no differences were
detected between sampling intervals 24-48, 48-72, and 72-96 h (P > 0.10).
Each line represents means ± SEM for 4 lambs……………………………...
41
Figure 3.2 Enrichments (APE, atom percent excess) of fecal 15
N during 4-d intra-
jugular infusions of [15
N15
N]-urea (infusions were initiated at sampling
interval 0 h). Treatments were: low RDP + dry-rolled barley (Low RDP-
DRB); low RDP + pelleted barley (Low RDP-PB); high RDP + dry-rolled
barley (High RDP-DRB); and high RDP + pelleted barley (High RDP-PB).
Differences were detected in fecal 15
N enrichments between sampling
intervals 0-24, 24-48, 48-72, and 72-96 h (P = 0.001), indicating that fecal
15N enrichment did not reach a definite plateau. Each line represents means
± SEM for 4 lambs……………………………………………………………
42
Page 17
xvi
Figure 4.1 Enrichments (APE, atom percent excess) of [15
N15
N]-urea (A) and [14
N15
N]-
urea (B) in urine during 4-d intra-jugular infusions of [15
N15
N]-urea
(infusions were initiated at sampling interval 0 h). Treatments were:
faunated + low CP (FAUN-LOW); faunated + high CP (FAUN-HIGH);
partially-defaunated + low CP (PDFAUN-LOW); and partially-defaunated
+ high CP (PDFAUN-HIGH). For [15
N15
N]-urea enrichments, no
differences were detected between sampling intervals 0-24, 24-48, 48-72,
and 72-96 h (P > 0.10). For [14
N15
N]-urea enrichments, no differences were
detected between sampling intervals 24-48, 48-72, and 72-96 h (P > 0.10).
Each line represents means ± SEM for 4 lambs……………………………...
66
Figure 4.2 Enrichments (APE, atom percent excess) of fecal 15
N during 4-d intra-
jugular infusions of [15
N15
N]-urea (infusions were initiated at sampling
interval 0 h). Treatments were: faunated + low CP (FAUN-LOW); faunated
+ high CP (FAUN-HIGH); partially-defaunated + low CP (PDFAUN-
LOW); and partially-defaunated + high CP (PDFAUN-HIGH). Differences
were detected in fecal 15
N enrichments between sampling intervals 0-24, 24-
48, 48-72, and 72-96 h (P = 0.001), indicating that fecal 15
N enrichment did
not reach a definite plateau. Each line represents means ± SEM for 4 lambs..
67
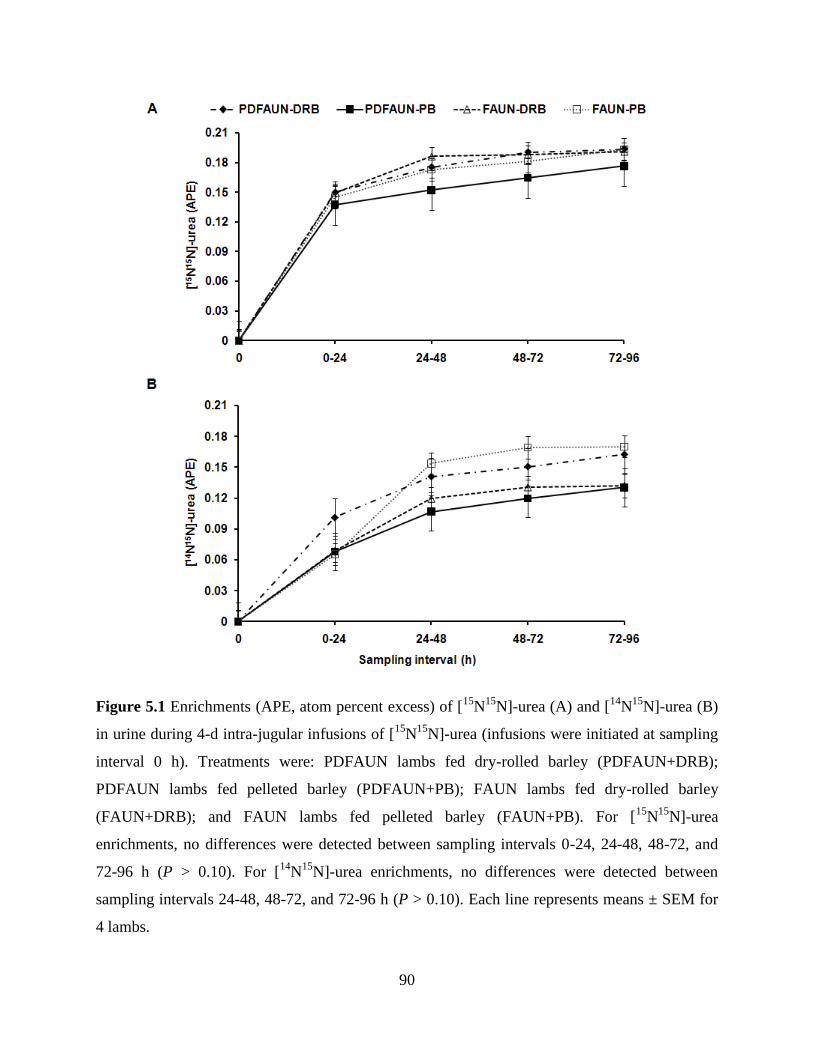
Figure 5.1 Enrichments (APE, atom percent excess) of [15
N15
N]-urea (A) and [14
N15
N]-
urea (B) in urine during 4-d intra-jugular infusions of [15
N15
N]-urea
(infusions were initiated at sampling interval 0 h). Treatments were:
PDFAUN lambs fed dry-rolled barley (PDFAUN+DRB); PDFAUN lambs
fed pelleted barley (PDFAUN+PB); FAUN lambs fed dry-rolled barley
(FAUN+DRB); and FAUN lambs fed pelleted barley (FAUN+PB). For
[15
N15
N]-urea enrichments, no differences were detected between sampling
intervals 0-24, 24-48, 48-72, and 72-96 h (P > 0.10). For [14
N15
N]-urea
enrichments, no differences were detected between sampling intervals 24-
48, 48-72, and 72-96 h (P > 0.10). Each line represents means ± SEM for 4
lambs………………………………………………………………………….
90
Page 18
xvii
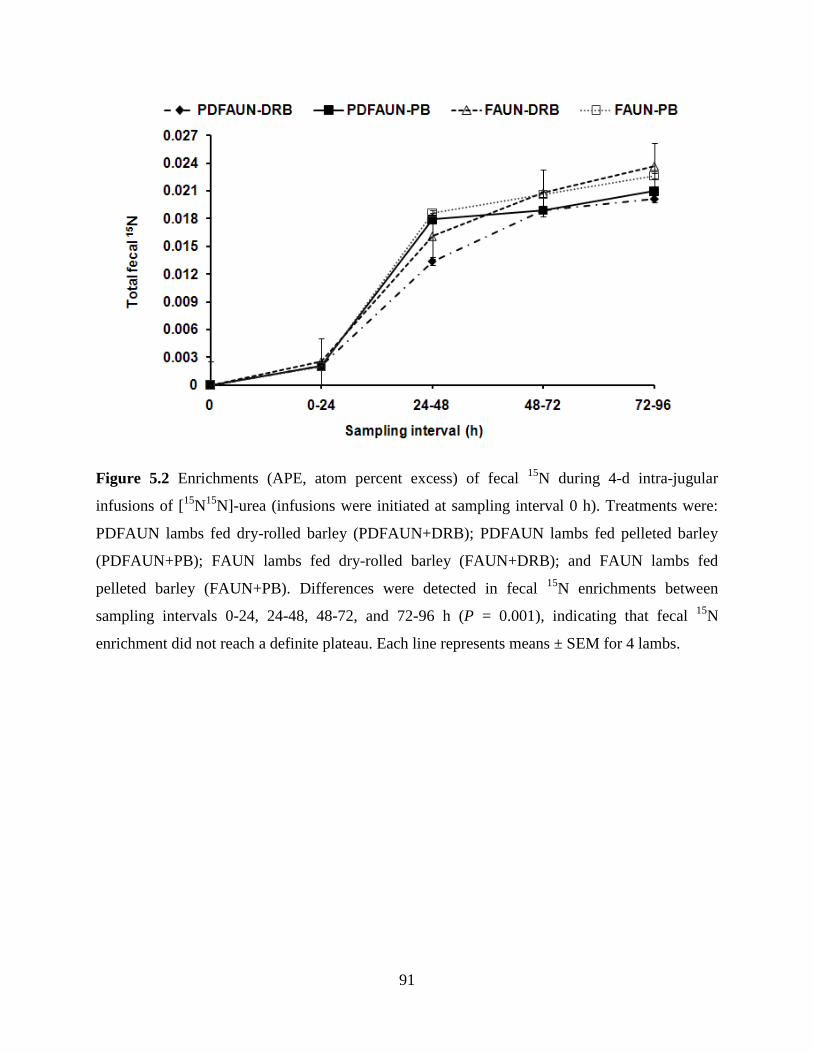
Figure 5.2 Enrichments (APE, atom percent excess) of fecal 15
N during 4-d intra-
jugular infusions of [15
N15
N]-urea (infusions were initiated at sampling
interval 0 h). Treatments were: PDFAUN lambs fed dry-rolled barley
(PDFAUN+DRB); PDFAUN lambs fed pelleted barley (PDFAUN+PB);
FAUN lambs fed dry-rolled barley (FAUN+DRB); and FAUN lambs fed
pelleted barley (FAUN+PB). Differences were detected in fecal 15
N
enrichments between sampling intervals 0-24, 24-48, 48-72, and 72-96 h (P
= 0.001), indicating that fecal 15
N enrichment did not reach a definite
plateau. Each line represents means ± SEM for 4 lambs……………………..
91
Figure 6.1 The relationship between serosal-to-mucosal urea flux (Jsm-urea) across the
ruminal epithelia obtained from lambs (n = 27) with transepithelial
conductance (Gt). There was no significant correlation (r2 = 0.001, slope P =
0.99)…………………………………………………………………………..
119
Figure 6.2 Relationship between serosal-to-mucosal urea flux (Jsm-urea) across the
ruminal epithelia and ruminal ammonia-N concentration (r2 = 0.29, slope P
< 0.001) in lambs (n = 27) fed OSC-LOW, OSC-HIGH and MEDIUM
dietary treatments…………………………………………………………….
120
Page 19
xviii
LIST OF ABBREVIATIONS
[15
N15
N]-urea Double-labelled urea
AA Amino acids
ADF Acid detergent fiber
AOAC Association of Official Analytical Chemists
BW Body weight
CP Crude protein
DM Dry matter
DRB Dry-rolled barley
FAUN Faunated
FAB Fluid-associated bacteria
GER GIT entry rate (amount of recycled urea-N entering the GIT)
GIT Gastrointestinal tract
Gt Transepithelial conductance
Jsm-urea Serosal-to-mucosal urea flux
MEDIUM Medium CP diet
MDV Mesenteric-drained viscera
N Nitrogen
NAN Non-NH3-N
NDF Neutral detergent fiber
NH3 Ammonia
NH4+ Ammonium ion
NPN Non-protein N
OM Organic matter
OSC Oscillating CP content
OSC-HIGH Feeding 2 d of low CP followed by 2 d of high CP
OSC-LOW Feeding 2 d of high CP followed by 2 d of low CP
PAB Particle-associated bacteria
PB Pelleted barley
PD Purine derivatives
Page 20
xix
PDFAUN Partially-defaunated
PDV Portal-drained viscera
PUN Plasma urea-N
RDP Ruminally-degradable protein
RFC Ruminally-fermentable carbohydrate
ROC Urea-N re-entering the ornithine cycle in the liver
RUDP Ruminally-undegradable protein
SCFA Short-chain fatty acids
SFO Linoleic acid-rich sunflower oil
TMR Total mixed rations
UER Urea-N entry rate (total endogenous urea-N production)
UFE Urea-N in feces
UT Urea transporter(s)
UUA Urea-N utilized for anabolism
UUE Urinary urea-N elimination
UUN Urinary urea-N
VFA Volatile fatty acids
Page 21
1
1. GENERAL INTRODUCTION
In ruminants, under a wide range of dietary conditions, the efficiency of dietary nitrogen
(N) conversion into edible protein products such as milk and meat is often low. In dairy cows,
only 25 to 30% of dietary N is utilized for milk protein synthesis (Tamminga, 1992), while 70 to
75% of dietary N is excreted in urine and feces. The efficiency of N utilization in beef cattle is
even lower with only 10 to 15% of dietary N retained in tissues (Bierman, 1999; Galyean, 1996).
Inefficient rates of dietary N utilization, accompanied by extensive losses of N in the manure
leads to environmental degradation. Partitioning of N excretion in urine and feces is also very
important. Nitrogen excreted in feces is composed mostly of undigested feed, microbial protein
and endogenous sources, while N excreted in the urine is predominantly from ruminal N loss due
to extensive degradation of protein in the rumen. About 60 to 80% of total N is excreted through
the urine, and large proportion of that N is in the form of urea-N (Van Horn et al., 1996), which
accounts for about 29 to 81% of total urinary N (Marini et al., 2004). Urinary urea-N (UUN) is
rapidly lost (as ammonia; NH3) into the environment via volatilization (CAST, 2002). Ammonia
(from urine and feces) is also released into the soil, where it undergoes nitrification through the
action of soil and fecal microbes and resultant nitrate or nitrous oxide acts as a source of N for
plants (Van Horn et al., 1996). However, excess nitrate or nitrous oxide production in the soil
will contaminate ground water posing health hazards in humans through drinking water. Reports
from Environment Canada (2008) indicate that animal agriculture account for 65.5% of national
NH3 inventory in Canada. Hence, considerable research efforts have been directed towards
improving the efficiency of N utilization in ruminants, so as to reduce feed costs and
environmental pollution.
One of the major problems associated with inefficient utilization of N in ruminants is the
significant loss of N from the rumen as a result of extensive ruminal degradation of dietary
protein. Major end products of ruminal dietary protein degradation are peptides, amino acids
(AA) and NH3. Ammonia, along with AA and peptides, are N precursors for microbial protein
synthesis. However, under most dietary conditions, ruminal NH3-N concentrations are usually in
excess of microbial requirement, because of extensive proteolytic activity of ruminal protozoa
and bacteria (Broderick et al., 1991). In addition, microbial lysis and bacterial protein breakdown
(intra-ruminal N recycling) also increase ruminal NH3-N concentration. Ammonia-N in excess of
Page 22
2
microbial requirement is absorbed across the ruminal wall into portal blood, and most of it is
detoxified to urea in the liver. In most mammalian species, a large amount of endogenous urea-N
is excreted via the urine. However, ruminants have evolved a mechanism that allows constant
recycling of urea-N to the gastrointestinal tract (GIT), particularly to the rumen, where urea-N
can be used as a source of N for microbial protein, which is the major contributor to the
metabolizable protein supply to the small intestine.
Urea-N recycling to the GIT and its utilization for anabolic use is influenced by several
dietary and ruminal factors. Major dietary factors which regulate the proportion of hepatic urea-
N output returning to the GIT and its subsequent fate are: dietary N concentration and N intake
(Bunting et al., 1987; Marini et al., 2004); total dry matter intake (Sarraseca et al., 1998); feed
processing (Kennedy and Milligan, 1980; Huntington, 1989; Theurer et al., 2002); oscillating
dietary N levels (Cole, 1999; Archibeque et al., 2007); and amount as well as frequency of
feeding dietary N that is degraded in the rumen (Wickersham et al., 2008a; Rémond et al., 2009).
In juxtaposition with dietary factors, ruminal factors such as ruminal NH3-N concentration,
ruminal bacterial urease activity, ruminally-fermentable carbohydrate (RFC), ruminal
concentrations of volatile fatty acids (VFA) and CO2, and ruminal pH also play a significant role
in trans-epithelial movement of blood urea-N into the rumen (Kennedy and Milligan, 1980).
However, there is limited research on how manipulating dietary factors and associated ruminal
factors could impact urea-N recycling to the GIT and its subsequent utilization for anabolic
purposes (primarily microbial protein synthesis in the rumen). Hence, the aim of this thesis was
to delineate how various dietary and ruminal factors interact to influence urea-N recycling in
ruminants.
Page 23
3
2. REVIEW OF LITERATURE
The ruminant stomach is complex in its nature as compared to monogastrics, because of
its anatomical structure and the presence of diverse microorganisms (bacterial, protozoa, fungi,
archaea and bacteriophages) in the rumen (Orpin and Joblin, 1988). As the rumen hosts several
groups of microbes and these microbes, in turn, provide nutrients for the host animal, the whole
system can be termed as a “cooperative” or “symbiotic” system in which both the microbes and
the animal benefit. Major advantages of this symbiotic relationship to the host animal are
degradation of cellulolytic material by microbial cellulases, as well as synthesis of microbial
protein from non-protein N (NPN). However, the proteolytic activity of microbes within the
rumen poses several disadvantages in terms of dietary protein utilization. To this end, one of the
major disadvantages is loss of dietary protein from the rumen in the form NH3, due to the
extensive degradation of dietary protein by ruminal microbes. Even though ruminal NH3-N is
utilized for microbial protein synthesis, most of the NH3-N in excess of bacterial requirements is
absorbed across the ruminal wall and detoxified to urea in the liver, part of which is excreted in
urine. Since, feed protein ingredients are expensive, and there is ever-increasing public pressure
to reduce the environmental pollution that is caused by intensive livestock operations, efforts
have been directed in recent years towards optimizing N utilization in ruminants.
2.1 Nitrogen Metabolism in the Rumen
Nitrogen metabolism in the rumen is a result of mainly the metabolic activity of rumen
microbes as the majority of microbes have proteolytic activity (Prins et al., 1983). Degradation
activity of these proteolytic microbes depends on the chemistry and structure of dietary proteins,
as well as ruminal pH and predominant species of microbes present in the rumen (Huntington
and Archibeque, 2000). Dietary protein entering the rumen is degraded (RDP) and the
undegraded portion (ruminally-undegraded dietary protein; RUDP) enters the small intestine,
where it is further digested (Figure 2.1). The RDP is comprised of true protein and NPN. True
protein is degraded to peptides, AA and NH3-N, whereas NPN is comprised of N present in
nucleic acids, NH3-N, AA, small peptides, amides and amines (Bach et al., 2005). Microbial
protein synthesized in the rumen, along with RUDP and endogenous N, are the major sources of
AA available at the small intestine.
Page 24
Figure 2.1 Overview of nitrogen metabolism in the rumen. NPN, non-protein nitrogen; RDP, ruminally-degradable protein; RUDP,
ruminally-undegradable protein; AA, amino acids; MP, microbial protein.
4
Page 25
5
Among these three fractions, microbial protein is the major contributor of AA entering
the duodenum, and it accounts for about 50 to 80% of total absorbable metabolizable protein
from the small intestine (Storm and Orskov, 1983).
2.1.1 Mechanisms of Dietary Protein Degradation in the Rumen
The first step in ruminal protein degradation is attachment of rumen microbes to feed
particles followed by the action of extra-cellular microbial proteases (Brock et al., 1982). About
30 to 50% of ruminal bacteria that attach to undigested feed particles in the rumen have
proteolytic activity (Prins et al., 1983). The major proteolytic ruminal bacteria are Prevotella
spp., Butyrivibrio sp., Ruminobacter sp., and Selenomomas sp. (Prins et al., 1983). Dietary
protein is comprised of a large number of various types of bonds, hence a combination of
different proteases are necessary to complete protein degradation (Wallace et al., 1997). The
resultant NH3, AA and peptides are translocated into the bacterial cell. Inside the cell, peptides
are further degraded to AA by intracellular peptidases and the resulting AA, along with NH3, are
utilized for synthesis of microbial protein. The majority of the ruminal bacteria do not have a
mechanism or transport system to excrete AA out of cell; hence, AA are deaminated to NH3,
VFA (including branched chain VFA), and CO2 (Tamminga, 1979). Utilization of NH3 and AA
for microbial protein synthesis or deamination depends on ruminal available energy (Bach et al.,
2005).
Apart from ruminal bacteria, protozoa also play a major role in ruminal protein
degradation. Though available literature indicates that protozoa can contribute to about 20 to
70% of the total ruminal microbial biomass, their contribution to the microbial protein outflow is
very low because of their longer generation time (6 to 60 h) and slower turn-over rate (Jouany,
1996). Ruminal protozoa consist largely of Entodinium spp., Holotrichs and cellulolytic protozoa
(Ogimoto and Imai, 1981), with Entodinium spp., representing up to 90% of the total ruminal
protozoal population with their preferred N source being insoluble protein (Jouany, 1996).
Proteases are present at high concentration inside the entodiniomorphid cells and, thus, aid in the
degradation of insoluble protein to peptides, AA and NH3. As opposed to the ruminal bacteria,
ruminal protozoa cannot utilize NH3-N as a source of N for protein synthesis; instead, they
require preformed AA. Ruminal protozoa indiscriminately degrade dietary, bacteria and
endogenous proteins, thus elevating ruminal NH3-N levels; consequently, defaunation i.e., the
Page 26
6
removal of ruminal protozoa, is consistently associated with decreased ruminal NH3-N levels
(Jouany, 1996).
Free AA concentration in the ruminal fluid is usually low (Wright and Hungate, 1967),
possibly because of high microbial deaminase activity (Chalupa, 1976). Approximately 50% of
the total N supplied to the rumen enters the ruminal NH3-N pool (Huntington and Archibeque,
2000). Ruminal NH3-N concentration varies between 0.8 to 56 mg/dL and increases as the
dietary CP concentration increases (Satter and Roffler, 1974). Because of extensive fermentative
activity of ruminal microbes, ruminants are relatively inefficient in converting dietary protein
into usable N, as compared to non-ruminants (Broderick et al., 1991). However, Bryant (1973)
demonstrated that 82% of cellulolytic and methanogeneic ruminal bacteria can utilize NH3-N for
protein synthesis. As NH3-N is the primary source of N for several species of ruminal bacteria
including, Bacteroides amylophilus, Bacteroides succinogenes, Eubacterium ruminantium,
Methanobacterium ruminantium, Ruminicoccus albus, and Ruminicoccus flavefaciens (Hungate,
1966), sequestration of ruminal NH3-N into bacterial protein is the primary route of its
disappearance from the rumen (Leng and Nolan, 1984). Studies with 15
N indicate that 50 to 75 %
of the bacterial N in the rumen of animals fed common diets is derived from the ruminal NH3-N
pool (Oldham, 1980). Even though, available literature indicates that NH3-N can potentially be
used as a source of N for microbial protein synthesis (Bryant and Robinson, 1963), a significant
portion of dietary N that is degraded to NH3-N in the rumen is not incorporated into microbial
protein, thus elevating ruminal NH3-N concentration and is eventually absorbed into the portal
blood across the ruminal wall.
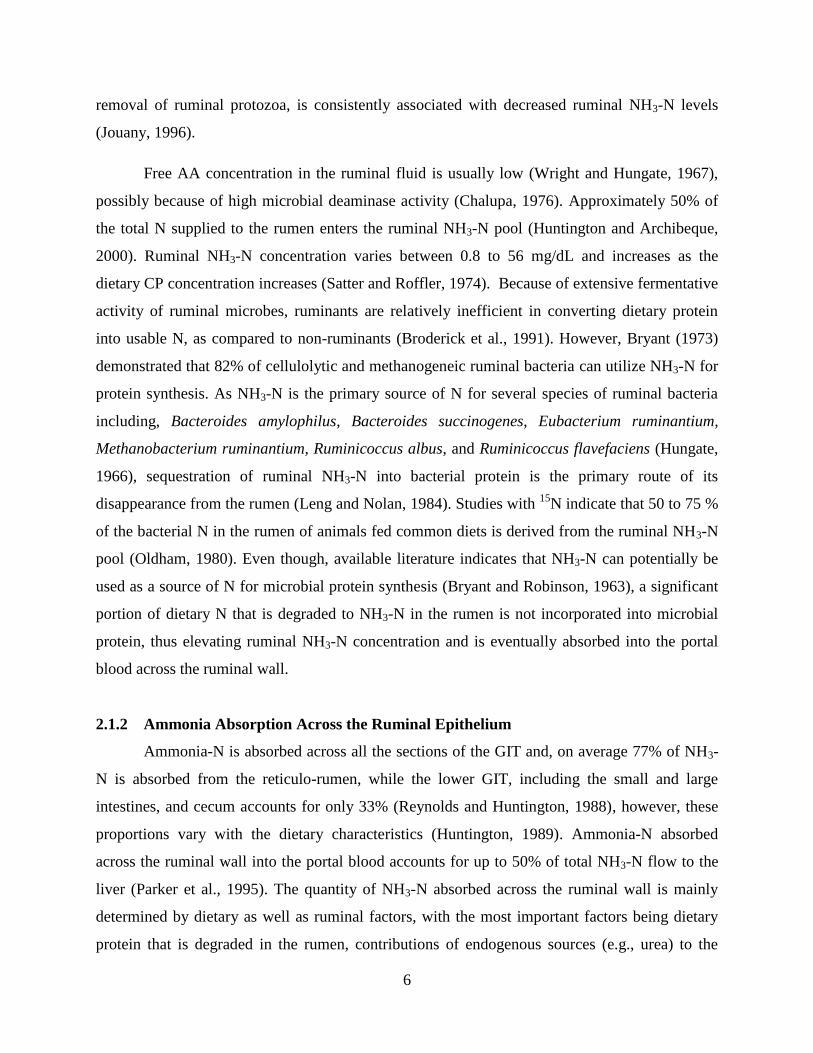
2.1.2 Ammonia Absorption Across the Ruminal Epithelium
Ammonia-N is absorbed across all the sections of the GIT and, on average 77% of NH3-
N is absorbed from the reticulo-rumen, while the lower GIT, including the small and large
intestines, and cecum accounts for only 33% (Reynolds and Huntington, 1988), however, these
proportions vary with the dietary characteristics (Huntington, 1989). Ammonia-N absorbed
across the ruminal wall into the portal blood accounts for up to 50% of total NH3-N flow to the
liver (Parker et al., 1995). The quantity of NH3-N absorbed across the ruminal wall is mainly
determined by dietary as well as ruminal factors, with the most important factors being dietary
protein that is degraded in the rumen, contributions of endogenous sources (e.g., urea) to the
Page 27
7
ruminal NH3-N pool, and dietary ruminally-available energy (Reynolds and Kristensen, 2008).
Under a wide variety of dietary and physiological conditions in growing and lactating cattle,
Firkins and Reynolds (2005) concluded that NH3-N absorption across the GIT accounts for about
42% of dietary N intake. Sequestration of ruminal NH3-N into the bacterial protein in the rumen
is energy dependent and, hence, providing adequate ruminally-available energy is associated
with lower ruminal NH3-N concentration and, consequently, reduced NH3-N absorption into
portal blood. Using the arterio-venous difference technique, Delgado-Elorduy (2002)
demonstrated that feeding steam flaked sorghum grain to increase ruminal degradable starch
decreased net NH3-N absorption across the portal-drained viscera (PDV) as compared to feeding
dry-rolled sorghum grain. In addition, Reynolds (1996) demonstrated a decrease in NH3-N
absorption across the PDV when starch was infused intra-ruminally and intra-abomasally,
possibly due to increased microbial protein synthesis in the rumen and hind gut, respectively.
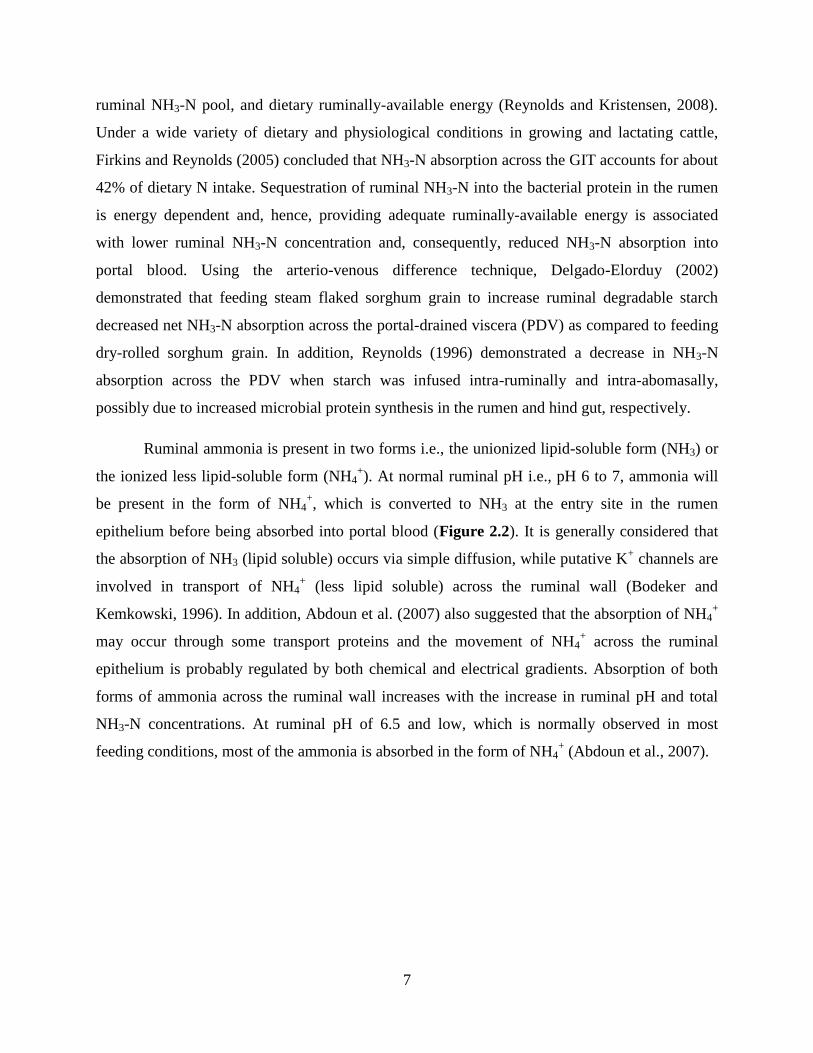
Ruminal ammonia is present in two forms i.e., the unionized lipid-soluble form (NH3) or
the ionized less lipid-soluble form (NH4+). At normal ruminal pH i.e., pH 6 to 7, ammonia will
be present in the form of NH4+, which is converted to NH3 at the entry site in the rumen
epithelium before being absorbed into portal blood (Figure 2.2). It is generally considered that
the absorption of NH3 (lipid soluble) occurs via simple diffusion, while putative K+ channels are
involved in transport of NH4+ (less lipid soluble) across the ruminal wall (Bodeker and
Kemkowski, 1996). In addition, Abdoun et al. (2007) also suggested that the absorption of NH4+
may occur through some transport proteins and the movement of NH4+ across the ruminal
epithelium is probably regulated by both chemical and electrical gradients. Absorption of both
forms of ammonia across the ruminal wall increases with the increase in ruminal pH and total
NH3-N concentrations. At ruminal pH of 6.5 and low, which is normally observed in most
feeding conditions, most of the ammonia is absorbed in the form of NH4+ (Abdoun et al., 2007).
Page 28
8
Figure 2.2 Ammonia absorption across the ruminal epithelium (modified from Rémond et al.,
1996 and Abdoun et al., 2007). Ammonia diffuses down the concentration gradient into the
epithelial cell by simple diffusion. However, under most dietary conditions ruminal pH is
between 6 to 7 and most of the ammonia is absorbed as less lipid soluble form i.e., NH4+. After
absorption, NH4+ dissociates into NH3 and H
+. Thus, this mechanism favors absorption of NH4
+
into the epithelial cell. Absorption of more lipid-soluble form of ammonia i.e., NH3 is favored by
forming NH4+ using H
+ ions produced from the dissociation of H2CO3 to HCO3
- + H
+ and release
of H+ from dissociation of ionized SCFA (RCOOH) to unionized SCFA (RCOO
-). Less lipid
soluble form of ammonia i.e., NH4+ diffuses into the epithelial cell facilitated by putative K
channel compared to simple diffusion of more lipid soluble form of ammonia i.e., NH3.
Page 29
9
2.2 Ammonia Detoxification in the Liver
Ammonia that is absorbed into the portal blood is highly toxic and can lead to tetany and
death of an animal, if not detoxified. Hence, NH3 reaching the liver in portal blood is detoxified
primarily to urea in the ornithine cycle, which occurs in periportal cells of the liver which is „low
affinity, high capacity‟ system (Haussinger, 1983; Haussinger et al., 1992). Urea synthesis in the
liver occurs in five major steps, each step catalyzed by key enzymes distributed both in the
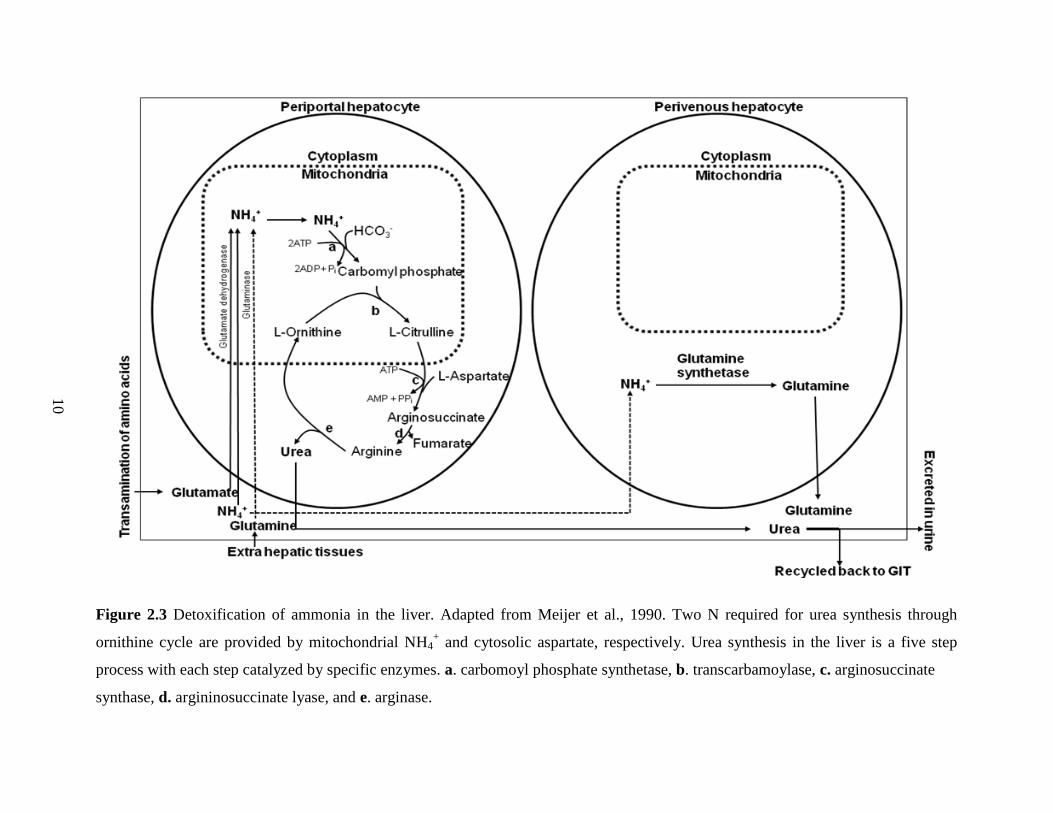
cytosol and mitochondrial compartments (Figure 2.3). The first step in the ornithine cycle is the
formation of carbamoyl phosphate by condensation of NH3 with bicarbonate (HCO3-) in the
mitochondria, a reaction catalyzed by carbamoyl phosphate synthetase (Meijer et al., 1990). The
second step is formation of citrulline, which occurs when carbamoyl-phosphate reacts with
ornithine in the mitochondria, a reaction that is catalyzed by ornithine transcarbomoylase.
Citrulline is then translocated across the mitochondrial membrane into the cytosol, where it
condenses with aspartate to form arginosuccinate, a reaction catalyzed by arginosuccinate
synthase. Subsequently, in the fourth step, argininosuccinate lyase removes fumarate, which can
enter the tricarboxylic acid cycle and serve as an intermediate for aspartate production, leaving
arginine. Finally, in the fifth step, arginase completes the ornithine cycle by hydrolyzing arginine
to ornithine and urea. Any NH3 that escapes ureagenesis in periportal hepatocytes enters
perivenous hepatocytes, which are a „high affinity, low capacity‟ system (Haussinger et al.,
1992). Perivenous hepatocytes have high glutamine synthetase activity which eliminates any
excess NH3 that was not removed by periportal hepatocytes via glutamine synthesis. Thus,
synthesis of glutamine also serves as a mechanism for NH3 detoxification. In addition, glutamine
that passes through periportal cells is catalyzed by glutaminase, and thus provides amide-N for
urea synthesis through the ornithine cycle. Carbamoyl phosphate provides the first N for urea
synthesis, with the second N being provided by aspartate. It is most essential that the supply of N
sources from mitochondrial NH3 and cytosolic aspartate for hepatic ureagenesis is coordinated
(Lobley et al., 1995). A significant portion of urea formed in the liver is excreted in the urine;
however, in ruminants 40 to 80% of total endogenous urea production is recycled to digestive
tract via saliva (Huntington, 1989) or by direct transfer from blood to the lumen of GIT via
simple diffusion down the concentration gradient (Houpt and Houpt, 1968) and/or via carrier-
mediated facilitative transport (Ritzhaupt et al., 1998; Stewart et al., 2005).
Page 30
Figure 2.3 Detoxification of ammonia in the liver. Adapted from Meijer et al., 1990. Two N required for urea synthesis through
ornithine cycle are provided by mitochondrial NH4+ and cytosolic aspartate, respectively. Urea synthesis in the liver is a five step
process with each step catalyzed by specific enzymes. a. carbomoyl phosphate synthetase, b. transcarbamoylase, c. arginosuccinate
synthase, d. argininosuccinate lyase, and e. arginase.
10
Page 31
11
The urea-N recycled to the GIT can be an important N source for ruminal microbial
protein synthesis, particularly under conditions of dietary N deficiency or low supply of RDP.
2.3 Urea-N Recycling
Hepatic urea-N synthesis has two fates i.e., it is either excreted in the urine or is recycled
back to the GIT via salivary secretions or by the direct transfer across the epithelial tissues of the
digestive tract (Reynolds and Kristensen, 2008). All mammalian species have the mechanism of
urea-N recycling to the GIT (Table 2.1). However, in ruminants, data compiled from a variety of
studies (Table 2.1) show that the amount of urea-N recycled to the GIT (as a proportion of total
hepatic urea-N output) varies between 29 to 99%, which is much greater compared to non-
ruminants (15 to 39%). This highlights the potential importance of the mechanism of urea-N
recycling in ruminants as opposed to non-ruminants. In ruminants, N transfer across the GIT can
be much greater than N intake, and urea-N recycling to the GIT is considered as an evolutionary
mechanism, wherein, under conditions of N deficiency, urea-N recycled to the rumen serves as a
N precursor for microbial protein synthesis and as a result ruminants can survive when N supply
through diet is inadequate to meet their N requirement (Reynolds and Kristensen, 2008).
However, for high producing and rapidly growing ruminants, dietary N supply is usually high
enough to meet their protein requirement. Even under such conditions where in animals are fed
high N diets, total hepatic urea-N production often exceeds apparent digestible N, and if some of
the urea-N is not recycled to the GIT, then those animals would be in negative or zero N balance
(Lapierre and Lobley, 2001). Hence, the mechanism of urea-N recycling plays an important role
to maintain ruminant animals in positive N balance, and also to meet their protein requirement.
In addition, the mechanism of urea-N recycling provides an opportunity to decrease excretion of
total N (mainly UUN) into the environment, is part of that recycled urea-N is incorporated into
microbial protein.
Page 32
Table 2.1. Urea-N kinetics in different species
Item N intake,
g N/d
Digestible N,
g N/d
UER,
g N/d
GER,
g N/d
UER: N intake,
%
GER: UER,
%
Citations
Dairy cow 450 - 653 301 - 463 262 - 483 171 - 483 58 - 74 65 - 99 Lapierre et al., unpublished;
Gozho et al., 2008
Steers 39 - 128 14 - 88 20 - 127 20 - 106 51 - 99 84 - 99 Archibeque et al., 2001;
Wickersham et al., 2008a,b;
Dairy Heifers 87 - 203 47 - 75 31 - 135 26 - 39 36 - 67 29 - 84 Marini and Van Amburgh, 2004
Sheep 9 - 29 3 - 21 3 - 22 2 - 17 33 - 76 67 - 77 Sarasecca et al., 1998; Lobley et
al., 2000; Marini et al., 2004;
Sunny et al., 2007
Human 10.3 - 11.3 4.4 109 39.0 McClelland and Jackson, 1996
Cat 1.7 1.5 1.1 0.2 65 15.0 Russell et al., 2000
UER = total endogenous urea-N production; GER = urea-N entry to the GIT
12
Page 33
13
2.4 Sites of Urea-N Recycling to the GIT
Urea-N can enter all compartments of the GIT (i.e., the fore-gut: the rumen, mid-gut:
small intestine and the hind-gut: the large intestine) through transfer across epithelial lining, and
also through salivary, gastric, biliary and pancreatic secretions (Nolan and Leng, 1972; Varady et
al., 1979). Even though up to 70% of urea-N may be recycled (as proportion of total portal
drained viscera flux) to the post-stomach compartments (mesenteric drained viscera flux) ,
utilization for anabolic purposes in post-stomach compartments in terms of amino acid supply to
productive functions is still questionable (Lapierre and Lobley, 2001). However, transfer of urea-
N into the rumen (Houpt, 1959; Kennedy and Milligan, 1980; Egan et al., 1986) is very
important in ruminants, wherein urea-N can be used as a source of N for microbial protein
synthesis (Lapierre and Lobley, 2001).
2.4.1 Urea-N Entry into the Rumen
Available data from literature (Kennedy and Milligan, 1978; Siddons et al., 1985; Koenig
et al., 2000) shows that between 27 to 60% (combined salivary contributions and transfer across
the rumen wall) of the GIT entry is to the rumen. The quantity of urea-N transfer to different
sections of the GIT is regulated by characteristics of the ruminant diet. Huntington (1989)
demonstrated that in steers fed high concentrate diets, up to 95% of urea-N (as a proportion of
urea-N entry to the GIT) enters the rumen, as compared to 62.5% in steers fed high forage diet.
Urea-N can enter the rumen via direct transfer of blood urea-N across the ruminal wall or via
salivary secretions.
2.4.1.1 Urea-N Entry into the Rumen via Transfer Across the Ruminal Wall
Urea-N transfer across the ruminal epithelium is the major route of urea-N transfer into
the rumen especially when ruminants are fed high concentrate diets. The mechanism behind
blood urea-N transfer across the ruminal epithelium was earlier thought to be only by simple
diffusion (Houpt and Houpt, 1968) down a concentration gradient facilitated by bacterial urease
activity (Figure 2.4). The mechanism behind simple diffusion is that bacterial urease penetrates
the stratum corneum layer of ruminal epithelia and hydrolyses the urea molecule, creating a
positive concentration gradient favorable for diffusion of urea-N into the rumen (Wallace et al.,
1979; Rémond et al., 1996).
Page 34
14
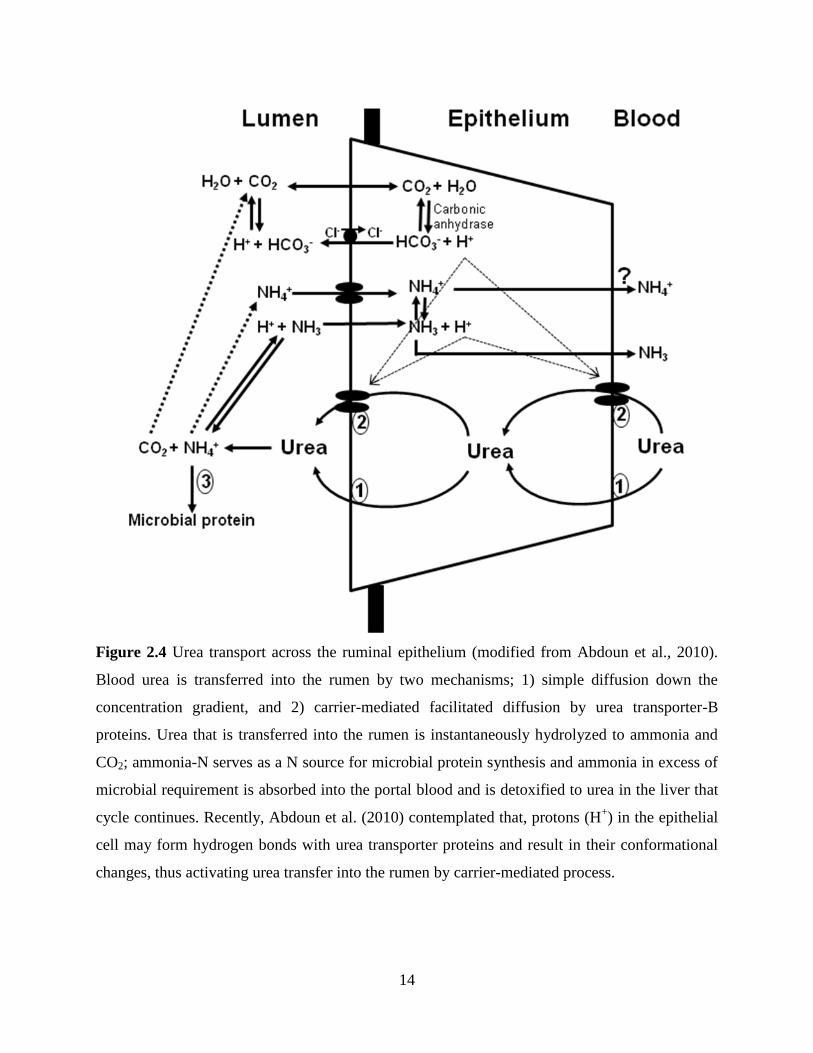
Figure 2.4 Urea transport across the ruminal epithelium (modified from Abdoun et al., 2010).
Blood urea is transferred into the rumen by two mechanisms; 1) simple diffusion down the
concentration gradient, and 2) carrier-mediated facilitated diffusion by urea transporter-B
proteins. Urea that is transferred into the rumen is instantaneously hydrolyzed to ammonia and
CO2; ammonia-N serves as a N source for microbial protein synthesis and ammonia in excess of
microbial requirement is absorbed into the portal blood and is detoxified to urea in the liver that
cycle continues. Recently, Abdoun et al. (2010) contemplated that, protons (H+) in the epithelial
cell may form hydrogen bonds with urea transporter proteins and result in their conformational
changes, thus activating urea transfer into the rumen by carrier-mediated process.
Page 35
15
Ritzhaupt et al. (1997; 1998) reported the existence of bidirectional facilitative urea
transporter (UT) proteins in the ovine colon and ruminal epithelia (Figure 2.4) and demonstrated
that urea-N transport across the ruminal epithelium also occurs by carrier-mediated facilitative
transport. Additionally, functional studies to measure whether urea transporter proteins plays a
role in facilitative urea transport across the ruminal epithelium were made by mounting isolated
ruminal epithelium in the Ussing chambers under short-circuit conditions (Stewart et al. 2005;
Abdoun et al., 2010: Muscher et al., 2010) using phloretin as a urea transporter inhibitor.
Phloretin inhibited the trans-epithelial urea flux by 50% compared to control tissues (Abdoun et
al., 2010) and thus, signifies that urea transport occurs through both paracellular (simple
diffusion) and transcellular (carrier-mediated diffusion) pathways. The UT are derived from two
major gene variants, namely UT-A and UT-B (Stewart et al., 2005), and mRNA expression of
UT-A has been characterized in ovine duodenum as well as that of UT-B in the ruminal
epithelium of bovine (Marini and Van Amburgh, 2003; Stewart et al., 2005), ovine (Marini et al.,
2004) and caprine (Muscher et al., 2010). Recently, Ludden et al. (2009) reported that UT-B
mRNA expression was higher in response to daily supplementation of RDP as opposed to
alternate day supplementation in lambs. Oba et al. (2004) demonstrated in vitro that ureagenesis
may take place in the ruminal epithelial and duodenal mucosal cells; consequently, UT-B may
serve as an excretory role rather than secretory role in the ruminal epithelium. Simmons et al.
(2009) demonstrated that UT-B mRNA and protein expression in ruminal epithelium were higher
in steers fed high concentrate as compared to high roughage diets. However, the mechanisms
involved in the regulation of different gene variants of UT and their role in transepithelial urea-N
transfer in ruminants in response to dietary characteristics needs future investigations (Reynolds
and Kristensen, 2008).
2.4.1.2 Urea-N Entry into the Rumen via Salivary Secretions
As outlined in the review by Lapierre and Lobley (2001), earlier studies in sheep have
shown that contributions from salivary flow to urea-N entry to the rumen can vary between 15 to
100% depending on the type of the diet. Salivary urea-N entry to the rumen calculated as
difference between total splanchnic flux and urinary excretions rate as a percent of total hepatic
urea-N production represented 72% in steers fed high forage diets as compared to 21% in those
fed high concentrate diet (Huntington, 1989). High roughage diets stimulate rumination, thus
Page 36
16
increasing the flow of salivary secretions to the rumen. Reports from other studies also show that
salivary flow of urea-N into the rumen as a percent of total urea-N entry to the GIT was 36% in
forage-fed (Taniguchi et al., 1995) and 16% in concentrate-fed (Guerino et al., 1991) ruminants.
Recently, Ludden et al. (2009) showed that UT-B proteins are present in the parotid gland in
sheep and may be involved in the facilitated carrier-mediated transfer of urea-N into the saliva.
2.4.2 Urea-N Entry into the Small Intestine
In ruminants, up to 70% of the total portal-drained viscera flux of urea can enter post-
stomach compartments (Lapierre and Lobley, 2001) of which up to 90% of total portal-drained
viscera flux of urea is to the mesenteric-drained viscera in animals fed high fiber diets
(Huntington, 1989) as compared to only 19% in animals fed high concentrate diets (Reynolds
and Huntington, 1988). However, most of the urea-N that enters post-stomach compartments is
returned back to the ornithine cycle as NH3 for re-synthesis of urea (Lapierre and Lobley, 2001).
2.4.3 Urea-N Entry into the Large Intestine
Small amounts of urea-N are recycled to the hind gut (cecum and colon) and, even
though bacteria residing in the hind gut utilize recycled urea-N for protein synthesis, because
there are no mechanisms for digestion and absorption of microbial protein formed in the hind
gut, it is eventually lost in the feces. Kennedy and Milligan (1980) estimated that about 2 to 10%
of urea-N entering the GIT is lost in the feces and that proportion increases to 10 to 25% by
providing fermentable energy sources to the hind-gut.
2.5 Magnitude of Urea-N Recycling to the GIT
Urea-N recycling to the GIT occurs in all mammals; however, the magnitude of urea-N
recycling is much greater in ruminants. Data from a variety of studies indicate that hepatic urea-
N synthesis may be as high as digestible N intake (33 to 99%) and often exceeds digestible N
intake (Figure 2.5). In high-producing and rapidly growing ruminants, urea-N recycling to the
GIT is so important that it can increase the N availability to the GIT from 43 to 130% (Lapierre
and Lobley, 2001).
Page 37
Figure 2.5 Fates of urea-N synthesized in the liver in ruminants. Compiled from: Sarasecca et al., 1998; Lobley et al., 2000;
Archibeque et al., 2001; Marini and Van Amburgh, 2003; Marini et al., 2004; Sunny et al., 2007; Gozho et al., 2008; Wickersham et
al., 2008a, b. Total urea synthesis in the liver can be as high as 33 to 99% of N intake. Of that total endogenous hepatic urea-N
production in the liver, 1 to 71% of urea-N is excreted in the urine and about 29 to 99% enters the GIT. In the GIT 16 to 70% of urea-
N (as a proportion that enters the GIT) is utilized for anabolic purposes and 3 to 21% is lost in feces. Unutilized urea-N (i.e., NH3-N)
is returned to the ornithine cycle (17 to 80% of urea-N that enters GIT) for urea synthesis. The data depicted in this figure are obtained
from urea-N kinetic measurements obtained from intra-jugular infusion of 15
N15
N-urea (Lobley et al., 2000).
17
Page 38
18
On average, between 29 to 99% of the total hepatic urea-N output is recycled to the GIT,
with 16 to 70% of urea-N that is recycled to the GIT could potentially being utilized for anabolic
purposes, 3 to 21% lost in feces, and 17 to 80% returned to ornithine cycle for re-synthesis of
urea (Figure 2.5). Recent observations from Wickersham et al. (2008a, b) showed that as much
as 72% of GER can be incorporated into microbial protein. Other research has shown that 46 to
63% of urea-N that is recycled to the GIT can be utilized for anabolic purposes depending on the
dietary factors such as level of feed intake, type of the diet and degradable energy intake
(Sarasecca et al., 1998; Lobley et al., 2000; Archibeque et al., 2000). Data compiled from
numerous studies in steers fed a wide variety of diets showed that the proportion of urea-N that
was recycled to the ornithine cycle as a proportion of total endogenous urea-N production ranged
from 12 to 32% (Huntington et al., 2009). In addition, there was no correlation between the
proportion of urea-N that was returned to the ornithine cycle and total endogenous production of
urea-N or the amount of urea-N that was recycled to the GIT. The magnitude of urea-N recycling
to the GIT, and its utilization for anabolic purposes is regulated by several dietary and ruminal
factors.
2.6 Factors Regulating Urea-N Recycling to the GIT
2.6.1 Dietary Factors
2.6.1.1 Dietary N Concentration and Intake
Dietary N intake and total endogenous urea-N production have a positive relationship
(Kennedy and Milligan, 1980). As N intake increases, total endogenous production of urea-N
also increases and as percent of N intake, total endogenous urea-N production varied from 77 to
95% (Lobley et al., 2000), clearly indicating the magnitude of the transit of N into the urea pool
and the perpetual reliance of ruminants on urea-N recycling to the GIT in order to maintain a
positive N balance. Several studies have demonstrated that feeding diets low in dietary N content
results in lower total endogenous urea-N production, lower plasma urea-N concentration (PUN),
and lower urinary excretions of urea-N, associated with decreased urea-N recycling to the GIT
(in absolute amounts; Marini and Van Amburgh, 2003; Marini et al., 2004; Reynolds and
Kristensen, 2008; Huntington et al., 2009). On the contrary, it is important to note that, in
Page 39
19
ruminants fed low N diets, the quantity of urea-N recycled to the GIT, as a proportion of total
endogenous urea-N production, and its utilization for anabolic purposes is greater compared to
those fed high N diets; consequently, ruminants can survive for limited period of time under
protein deficient situations through the mechanism of urea-N recycling. A study was conducted
to examine the effect of two forages (gama grass and switch grass) at two levels of N fertilization
application, and found an improved N efficiency at low N intakes as a result of higher absolute
movement of N across the GIT (by 11.4% units) in steers fed forage fertilized with low N
fertilization compared to those fed forages fertilized with high N (Archibeque et al., 2001).
Marini et al. (2004) demonstrated that as dietary N concentration increased, the absolute
amount (g N/d) of urea-N that is recycled to GIT also increased; however, as a percent of total
dietary N intake and as proportion of total endogenous urea-N production, the quantity of urea-N
recycled to the GIT was greater in sheep fed a low N diet compared to those fed a high N diet. In
addition, renal urea clearance rates decreased as a result of decreasing dietary N content in sheep
(Marini et al., 2004) and heifers (Marini and Van Amburgh, 2003). Furthermore, urea-N recycled
to the GIT as a proportion of total endogenous urea-N production varied from 29 to 42% even
when dietary N concentrations were 34.0 to 25.0 g N/kg of DM (Marini and Van Amburgh,
2003). According to NRC (2001), dietary N content in dairy diets varies from 25.6 to 32.0 g
N/kg of DM, the range similar to that was used in the study of Marini and Van Amburgh (2003).
Hence, such a wide range in the amount of urea-N that is recycled to the GIT (as a percent of
total endogenous urea-N production) paves way to manipulate urea-N recycling to the GIT in
ruminants to increase utilization of recycled urea-N for microbial use such that excretions of total
N in the manure decreases and efficiency of dietary N utilization increases in ruminants fed high
N diets.
2.6.1.2 Frequency of Dietary Protein Supplementation
Oscillating dietary CP concentrations on a 2-d basis enhanced N retention in ruminants
(Cole, 1999; Cole et al., 2003; Ludden et al., 2003; Kiran and Mutsvangwa, 2009), possibly due
to an increase in urea-N recycling to the GIT (Cole, 1999). Archibeque et al. (2007), using the
venous-arterial difference technique, observed a tendency for a greater net flux of urea-N across
the PDV in growing wethers fed oscillating dietary CP concentrations compared to those fed a
medium (12.5%) dietary CP concentration. A recent study (Kiran and Mutsvangwa, 2009)
Page 40
20
showed an increase in N retention associated with improved microbial NAN supply to the
duodenum in lambs fed oscillating dietary CP compared to those fed medium CP.
In cow-calf beef operations, supplementing protein to low quality forages is commonly
practised. Such supplementation strategies are associated with increase in cost of production in
terms of labour and machinery. Hence, attempts were made to increase N efficiency by
increasing urea-N recycling to the GIT and its capture for microbial protein synthesis in
ruminants by altering the frequency of RDP supplementation (Wickersham et al., 2008b). The
urea-N entry to the GIT (g N/d) was higher and its anabolic use were lower in steers fed a RDP
source (Casein) on daily basis (daily supplementation of 183 mg of N/kg of body weight; BW) as
compared to those fed a similar amount of RDP once in three days (549 mg of N/kg of BW fed
every third day) (Wickersham et al., 2008b). Adopting such strategies (i.e., infrequent protein
supplementation) can potentially increase dietary N utilization and decrease N losses in to the
environment as well as reduces cost of labour, time and machinery for producers. Though several
studies have shown an improvement in N retention by adopting oscillating dietary regimen, there
is no definitive evidence to prove that the increase in N utilization is due to an increase in urea-N
recycling to the GIT when ruminants are fed low N diets for 2-d in a 4 d oscillating cycle.
2.6.1.3 Ruminally-Degradable Protein and Protein Solubility
The ruminal NH3-N concentration is negatively correlated with rate of urea-N transfer
across the ruminal wall (Kennedy and Milligan, 1980). Hence, the form of N in the diet,
particularly RDP and/or protein solubility, are important and determine how much of the dietary
protein is directed towards ruminal NH3-N (Lapierre and Lobley, 2001). In ruminants fed high
RDP level, an increase in ruminal NH3-N concentration is associated with a decrease in ruminal
urease activity, thus a decrease in urea-N transfer from blood into the rumen. Recently,
Wickersham et al. (2009) showed that in steers fed low dietary N, increasing the amounts of
RDP by infusing casein into the rumen linearly increased the quantity of urea-N that was
recycled to the GIT (in absolute amounts) and the amount of recycled urea-N that was
sequestered into microbial protein (using 15
N isotope) ranged from 55.9 to 64.0%. Fecal
excretion of recycled urea-N linearly increased as dietary RDP level was increased (Wickersham
et al., 2009). These data indicate that, in ruminants fed low N diets supplying additional RDP
could benefit to conserve N (i.e., increased urea-N recycling to the GIT and supply of readily
Page 41
21
available N source for microbial protein synthesis) for productive functions. Using arterio-
venous difference Ferrell et al. (2001) demonstrated in sheep that urea-N transfer to the GIT
averaged 62.3, 47.2, 47.5, and 39.2% for control, urea, soybean meal and mixture of
feather/blood meal, respectively. These data indicate that with higher RUDP and lower RDP
fraction in feather/blood meal diet, urea-N transfer to the GIT was lower. Recently, Wickersham
et al. (2008a) also showed in steers consuming low quality forage that increasing the amount of
digestible protein intake increased total endogenous urea-N production as well as urea-N transfer
to the rumen. Archibeque et al. (2002) showed that urea-N entry rate was greater in steers fed
gamagrass and switchgrass as compared to those fed tall fescue, due to higher slowly RDP (i.e.,
B2 fraction of protein) in gamagrass and switchgrass as compared to tall fescue. Processing of
legume seeds especially extrusion is commonly practised to decrease RDP and increase RUDP.
Recently, Rémond et al. (2009) using arterio-venous difference technique reported that the urea-
N transfer across the ruminal epithelium (in absolute amounts) was not altered in sheep fed either
extruded or raw pea. However, urea-N transfer across the rumen as a percent of total portal-
drained viscera (PDV) flux was 72% in sheep fed extruded compared to 52% in those fed raw
pea, possibly due to a lower ruminal NH3-N concentration prevailing in sheep fed raw pea
(Rémond et al., 2009). The overall conclusion from that study was that even though the net
transfer of urea-N to the rumen did not differ, shifting protein digestion from the rumen to the
small intestine by feeding extruded pea increased overall urea-N efficiency by higher transfer of
hepatic urea-N output to GIT.
2.6.1.4 Dietary Ruminally-Fermentable Carbohydrate
Dietary energy content can be increased by supplementing grain, starch or sucrose, which
would significantly provide ruminal available energy, thus increasing the utilization of NH3-N
for microbial protein synthesis. Greater sequestration of ruminal NH3-N into microbial protein
would decrease the ruminal NH3-N concentrations, which, in turn, would increase urea-N
transfer to the rumen. In addition, higher urea-N transfer to the rumen could probably be
attributable to an increase in the amount and rate of organic matter degradation or decrease in the
ruminal NH3-N concentration or combination of both (Kennedy and Milligan, 1980). Providing
higher amounts of dietary RFC is associated with increased urea-N transfer to the rumen
(Kennedy, 1980; Kennedy and Milligan, 1980; Huntington, 1989) as opposed to post gastric
Page 42
22
tissues (Reynolds and Huntington, 1988; Huntington, 1997), and also increases sequestration of
NH3-N into microbial protein. Recently, Huntington et al. (2009) demonstrated that
supplementing carbohydrate in forage fed steers was accompanied by decreased return of urea-N
to the ornithine cycle (as a proportion of recycled urea-N to the GIT). In addition, urea-N utilized
for anabolic purposes (as a proportion of recycled urea-N to the GIT) was associated with
improved efficiency of N utilization (Huntington et al., 2009). Kim et al. (1999) observed
improved N retention and an increase in urea-N entry to the GIT and its utilization for anabolic
purposes when propionate was infused into the abomasum, however underlying mechanisms
needs future investigations.
Processing of feeds, especially dietary starch sources, is done to shift the site of digestion
from post-ruminal compartments to the rumen particularly to synchronize the supply of starch
and N to ruminal microbes, thereby increasing microbial protein synthesis and reduce losses of N
from the rumen (Huntington, 1997). Grain processing is associated with increase in the ruminal
available energy (i.e. increased ruminal starch fermentation) that increases utilization of NH3-N
for microbial protein synthesis. As a result, ruminal NH3-N concentration decreases and thus
urea-N recycling to rumen increases. Theurer et al. (2002) demonstrated that shifting
carbohydrate digestion from the small intestine to the rumen via steam-flaking compared to dry-
rolling of sorghum grain increased urea-N transfer to the rumen by 30% in beef steers, possibly
because of increased sequestration of N into microbial protein, thus resulting in a greater post-
ruminal flow of microbial protein in beef and dairy cattle (Theurer et al., 1999). Alio et al.
(2000) also demonstrated that urea-N recycling to the PDV (as a percent of total hepatic urea-N
output) was 64% in beef steers fed steam-flaked compared to 50% in those fed dry-rolled
sorghum grain and in addition, increasing the degree of processing by decreasing sorghum grain
flake-density resulted in greater transfer of urea-N to the PDV. Barley is the major source of
carbohydrates in beef and dairy diets across Western Canada and processing of barley (grinding,
pelleting and dry-rolling) is commonly practiced to increase the RFC from cereal grains
(Huntington, 1997). However, there is limited research on how grain processing would impact
urea-N recycling in ruminants.
Page 43
23
2.6.2 Ruminal Factors
2.6.2.1 Ruminal NH3-N Concentration
Ruminal NH3-N concentration has direct effect on urea-N transfer in to the rumen by
increasing the ruminal epithelium‟s permeability to urea-N (as ruminal NH3-N concentration
decrease). Houpt and Houpt (1968) demonstrated using ruminal pouch preparations that urea-N
transfer across the ruminal epithelium decreased in response to a decrease in urease activity.
Urea-N transfer across the ruminal wall is facilitated by bacterial urease activity (Rémond et al.,
1996). Bacterial ureases rapidly hydrolyze urea-N entering the rumen to NH3 and CO2 and thus
favor the diffusion of urea-N across the rumen wall by maintaining a positive concentration
gradient (Rémond et al., 1996). Cheng and Wallace (1979) demonstrated that as ruminal NH3-N
concentration increases, bacterial urease activity decreases. Therefore, high ruminal NH3-N
concentrations will decrease urea-N transfer into the rumen (Kennedy and Milligan, 1980),
possibly due to decrease in bacterial urease activity and the ruminal epithelium‟s permeability to
the urea-N. Recently, Marini et al. (2004) reported a linear decrease in the ruminal bacterial
urease activity as a result of increasing dietary N levels. Though ruminal NH3-N concentrations
were not measured in that study (Marini et al., 2004), it is plausible that higher N intakes would
have led to increased degradation of dietary N in the rumen, thus increasing ruminal NH3-N
concentrations resulting in decreased bacterial urease activity. A possible theory behind the
decrease in ruminal urease activity as ruminal NH3-N concentration increases is that the rumen is
a highly reducing environment with a pKa of NH3 (unionized lipid-soluble form) of 9.3, which
quickly gets converted to NH4+ (ionized less lipid-soluble form) leading to its accumulation in
the rumen, and thus an increase in ruminal NH4+ concentration would probably inhibit ruminal
urease activity; however, ruminal NH3-N concentrations in the range of 5 to 8 mg/dL in cattle are
associated with maximum urea-N transfer across the ruminal wall (Kennedy and Milligan, 1978).
Contrary to other reports, Bunting et al. (1987) reported only a marginal decrease in ruminal
urease activity as a result of higher ruminal NH3-N concentrations in growing heifers fed high
dietary N as compared to those fed low dietary N.
In order to maximize urea-N transfer into the rumen and its subsequent utilization for
microbial protein synthesis, ruminal NH3-N levels have to be reduced by means of altering
dietary protein degraded in the rumen. One possible method to decrease RDP in feed ingredients
Page 44
24
(especially leguminous seeds) is by extrusion. Rémond et al. (2009) demonstrated that ruminal N
loss (as NH3-N) was lower in sheep fed extruded pea (low RDP) compared to those fed raw pea
(high RDP) associated with increased efficiency in urea-N recycling the GIT i.e., greater urea-N
flux into the rumen compared to post-stomach compartments in sheep fed extruded pea. As
ruminal protozoa are highly proteolytic, eliminating ruminal protozoa (i.e., defaunation) is
another possible means to reduce dietary protein degradation in the rumen (and thus reduce
ruminal NH3-N concentrations). Microbial lysis as well as bacterial protein degradation (by
ruminal protozoa) termed as „intra-ruminal N recycling‟ (Jouany, 1996) contribute to ruminal
NH3-N concentrations. Available data from the literature indicates that complete or partial
defaunation is consistently associated with a decrease in the ruminal NH3-N concentrations
(Jouany, 1996; Ivan et al., 2001), in addition to improving bacterial protein supply to the
duodenum (Koenig et al., 2000). As ruminal NH3-N concentration is negatively correlated with
urea-N transfer to the rumen (Kennedy and Milligan, 1980), it is possible that the removal of
ruminal protozoa may increase urea-N transfer to the rumen.
2.6.2.2 Ruminal CO2
Stimulatory effects of CO2 on urea-N transfer across the ruminal wall were first
demonstrated in vivo using isolated rumen pouches (Thorlacius et al., 1971). Further, Rémond et
al. (1993) demonstrated that urea-N transfer across the ruminal epithelium increases in response
to bubbling of CO2 and this response is seen as early as 15 min after CO2 bubbling. A possible
theory for increased urea-N transfer into the rumen could be due to increased blood flow to the
ruminal wall, which in turn increases the rate of absorption of permeable substances (e.g., urea)
from interstitial spaces in response to CO2 bubbling (Mailman, 1982). Recently, Abdoun et al.
(2010) demonstrated in vitro using isolated ruminal epithelium in Ussing chambers that the
magnitude of urea-N transfer across the ruminal epithelium increased in response to CO2 supply,
and this increase was highest at a mucosal pH of 6.4 compared to marginal increase at a pH of
7.4.
2.6.2.3 Ruminal VFA and pH
Effects of ruminal VFA and pH are closely related and therefore will be discussed
collectively. Engelhardt et al. (1978) reported that ruminal VFA, particularly butyrate, has a
Page 45
25
stimulatory effect on urea-N transfer across the ruminal epithelium. In addition, Norton et al.
(1982) demonstrated in sheep that prolonged exposure (2 weeks) to increased ruminal butyrate
concentration increased urea-N transfer into the rumen. However, Rémond et al. (1993) found
that infusing butyrate into the rumen for short duration (1 h) did not increase urea-N transfer and,
in fact, butyrate infusion reduced urea-N transfer into the rumen. Simmons et al. (2009) reported
a higher bUT-B2 mRNA and protein expression in steers fed concentrate-based diet compared to
those fed silage-based diet. In that study, ruminal butyrate concentration was numerically higher
(9.3 vs. 11.7 as % of total VFA) in steers fed concentrate-based compared to silage-based diet
and, may play a role in expression of bUT-B2 thus, increasing urea-N transfer into the rumen.
Earlier work of Rémond et al. (1993) showed that shifts in the ruminal pH relative to fed
and fasting-state of an animal may play a role in urea-N transfer across the ruminal epithelium.
Recently, Abdoun et al. (2010) demonstrated in vitro using isolated ruminal epithelium in Ussing
chambers that in presence of short-chain fatty acids, reducing ruminal mucosal buffer pH from
7.4 to 5.4 showed a bell-shaped curve for urea transport from serosal to mucosal direction with
highest rate of urea transport between pH 6.0 to 6.4. If the ruminal pH is approximately in the
range of 6.0 to 6.4, the range which is typically observed under in vivo physiological conditions
in the rumen, changing the ruminal factors (e.g., VFA) may have a positive impact on urea-N
recycling to the rumen (Abdoun et al., 2010). The ruminal pH in the study of Rémond et al.
(1993) was 6.75 and because of such a high pH, ruminal concentration of NH4+ (less lipid
soluble) rise in turn elevating total ruminal NH3-N levels, and thus decrease urea-N transfer into
the rumen. In addition, it was also demonstrated in vitro that, cytosolic pH of an isolated ruminal
epithelial cell may play an important role in conformational changes to the UT-B proteins that
are involved in the transport of urea across the ruminal epithelium (Abdoun et al., 2010).
2.6.3 Plasma Urea-N
Plasma urea-N (PUN) concentration is another major factor that influences urea-N
recycled to the GIT. Houpt and Houpt (1968) proposed a mechanism that blood urea-N enters
rumen by simple diffusion across the ruminal wall. As proposed by Huntington and Archibeque
(2000), urea-N entry into the rumen depends on the amount of urea-N circulating in the blood
(supply or push) and the amount of urea-N hydrolyzed by microbial ureases in the rumen after its
transfer into the rumen (use, or pull). Harmeyer and Martens (1980) indicated that amount of
Page 46
26
urea-N recycled to the GIT (through salivary secretions and transfer across the ruminal wall) is
positively correlated to the PUN concentration; however, this relationship is true only if the PUN
are below 6 mM (sheep) and below 4 mM (cattle) (Lapierre and Lobley, 2001). Plasma urea-N
concentrations were lower and its entry across the PDV was higher in sheep fed high concentrate
diets compared to high forage diets (Reynolds and Huntington, 1988). Recently, Sunny et al.
(2007), using an intra-jugular urea infusion protocol to increase blood urea-N concentrations,
clearly demonstrated that urea-N transfer from blood to the GIT was elevated as PUN
concentration increased. In addition, there was a positive correlation between PUN and urea-N
recycling to the GIT in sheep fed a basal diet low in dietary N content, and these data provide
evidence that PUN plays a very important role in regulating urea-N transfer to the rumen at least
in ruminant fed low N diets. However, across a wide range of PUN in cattle fed a wide variety of
diets, Lapierre and Lobley (2001) did not find any relationship between arterial urea
concentration, and net PDV removal of urea in ruminants fed high N diets (PDV removal,
however, did not include salivary urea-N recycling). Hence, in ruminants fed high N diets,
whether PUN has any positive relationship with urea-N recycling to the GIT needs future
investigations.
2.7 Conclusions
Dietary N consumed by ruminants is extensively degraded in the rumen, leading to
significant loss of N from the rumen in the form of ammonia. Most of that ammonia that is
absorbed into the portal blood is converted to urea-N in the liver. Ruminants have developed an
evolutionary mechanism of urea-N recycling, wherein part of that urea-N is recycled back to the
GIT. Part of urea-N that is recycled to the rumen can potentially be incorporated into the
microbial protein, thus increasing the AA supply to the duodenum. Hence, mechanism of urea-N
recycling plays a very important role in keeping ruminants in positive N balance. Both dietary
and ruminal factors play an important role in regulating urea-N recycling in ruminants. However,
there is limited research on how interaction between different dietary as well as ruminal factors
could influence urea-N recycling in high-producing and rapidly growing animals. Hence, the
broad objective of this thesis was to understand the factors regulating urea-N recycling and its
impact on the efficiency of N utilization in ruminants.
Page 47
27
3. EFFECTS OF BARLEY GRAIN PROCESSING AND DIETARY RUMINALLY-
DEGRADABLE PROTEIN ON UREA-NITROGEN RECYCLING AND
NITROGEN METABOLISM IN GROWING LAMBS1
3.1 Abstract
The objective of this study was to determine how interactions between dietary ruminally-
degradable protein (RDP) level and ruminally-fermentable carbohydrate (RFC) may alter urea-N
transfer to the gastrointestinal tract (GIT) and the utilization of this recycled urea-N in rapidly-
growing lambs fed high N diets. Four Suffolk ram lambs (34.8 ± 0.5 kg BW) were used in a 4 x
4 Latin square design with 21-d periods and a 2 x 2 factorial arrangement of dietary treatments.
The dietary factors studied were: 1) dry-rolled barley (DRB) vs. pelleted barley (PB) as the
principal source of RFC; and 2) dietary levels of RDP of 60 vs. 70%. All diets contained 28.8 g
N/kg DM. Experimental diets were fed twice daily at 0900 and 1700 h as total mixed rations,
composed of 80% concentrate mixture and 20% barley silage (DM basis). Nitrogen balance was
measured from d 15 to d 20, while urea-N kinetics were measured from d 15 to d 19 using intra-
jugular infusions of [15
N15
N]-urea. Nitrogen intake (P = 0.001), and fecal (P = 0.002) and urinary
(P = 0.034) N excretion increased as dietary RDP level increased; however, method of barley
processing had no effect on these parameters. Feeding DRB compared to PB (P = 0.04), and
feeding 60% RDP compared to 70% RDP (P = 0.04) resulted in a higher N digestibility. Whole-
body N retention was unaffected (P > 0.05) by dietary treatment. Dietary treatments had no
effect on endogenous production of urea-N and its recycling to the GIT; however, across dietary
treatments, endogenous production of urea-N was high (45.8 to 50.9 g/d), exceeding N intake
(42.3 to 47.9 g/d). Across dietary treatments, 30.6 to 38.5 g/d of urea-N were recycled to the
GIT, representing 0.669 to 0.742 of endogenous urea-N production; however, 0.636 to 0.756 of
urea-N recycled to the GIT was returned to the ornithine cycle. In summary, although dietary
treatment did not alter urea-N kinetics, however substantial amounts of hepatic urea-N output
were recycled to the GIT under the dietary conditions employed in this study, and additional
1A version of this chapter has been published: Kiran, D., and T. Mutsvangwa. 2007. Effect of barley grain
processing and dietary ruminally degradable protein on urea nitrogen recycling and nitrogen metabolism in growing
lambs. J. Anim. Sci. 85: 3391-3399.
Page 48
28
research is required to determine how this recycled urea-N can be efficiently captured by bacteria
within the GIT.
3.2 Introduction
In ruminants, hepatic urea-N output often exceeds apparent digestible N intake; however,
animals maintain a positive N balance primarily by recycling 40 to 80% of hepatic urea-N output
to the GIT (Lapierre and Lobley, 2001). Urea that is recycled to the GIT is an important source
of N for microbial growth. Increasing dietary amounts of RFC
(Huntington, 1989; Rémond et al.,
1996) or shifting carbohydrate digestion from the small intestine to the rumen
via steam-flaking
compared with dry-rolling of sorghum grain (Theurer et al., 2002) increased urea-N transfer to
the rumen, in addition to increasing N sequestration into microbial protein.
In ruminants fed low-N diets, a greater proportion of endogenous urea-N production is
recycled to the GIT compared with animals fed adequate levels of N (Siddons et al., 1985;
Marini et al., 2004). However, under practical feeding conditions, high-producing ruminants
(e.g., dairy cows fed for high levels of milk yield) are usually fed high levels of dietary N (25.6
to 32.0 g of N/kg of DM; NRC, 2001) to adequately meet protein requirements. Marini and
Van
Amburgh (2003) demonstrated in Holstein heifers that, even at high levels of N intake (25.0 to
34.0 g of N/kg of DM), there was a wide range (29 to 42%) in the proportion of hepatic urea-N
output that was recycled to the GIT. Clearly, therefore, there is opportunity for manipulation of
urea-N recycling to the GIT, even in ruminants fed high-N diets, to improve N efficiency
of
ruminants. Because ruminal NH3-N concentration is negatively correlated with the rate of urea-N
transfer into the rumen (Kennedy and Milligan, 1980), the form of the N fed, particularly the
proportion of RDP, is important because it determines how much N is directed toward ruminal
NH3-N (Lapierre and Lobley, 2001). However, limited information
is available on how
concomitant changes in dietary content of RFC and RDP might influence urea-N kinetics in
ruminants fed high N diets.
The hypothesis was that changes in the proportion of dietary N that is degraded in the
rumen (by varying dietary RDP level) would alter urea-N recycling to the rumen, and that this
effect would be more pronounced with more extensive barley grain processing,
which would
increase ruminal starch digestion and subsequently urea-N recycling to the rumen and microbial
N sequestration. The objective of this study was to determine how interactions
between dietary
Page 49
29
concentrations of RDP and RFC alter urea-N transfer to the GIT and the utilization of this
recycled urea-N in lambs.
3.3 Materials and Methods
3.3.1 Animals and Experimental Design
The lambs were cared for and handled in accordance with regulations of the Canadian
Council on Animal Care (1993), and their use in this experiment was approved by the University
of Saskatchewan Animal Care Committee (UCACS Protocol No. 20040048).
Four Suffolk ram
lambs (34.8 ± 0.5 kg of initial BW) were used in this study. The experiment used a 4 x 4 Latin
square design with 21-d periods and a 2 x 2 factorial arrangement of
dietary treatments. Each
experimental period consisted of 14
d of dietary adaptation and 7 d of data collection.
Throughout the experiment, lambs were housed at the Livestock Research
Building (University
of Saskatchewan) in a temperature-controlled environment (18 to 22°C). Lambs were housed in
individual floor pens (during dietary adaptation) or in metabolism crates
(during the 7-d data
collection period) to facilitate total urine and feces collection. It was decided to use rapidly
growing lambs as an experimental model because of their high N demands
for rapid growth.
Most previous research investigating regulatory mechanisms that impact urea-N recycling in
ruminants has been conducted using slow-growing ruminants, ruminants fed at low
intakes, non-
lactating cows, or low-producing lactating cows (Lapierre and Lobley, 2001), yet the productive
state of the animal is important because it dictates biological N requirements.
3.3.2 Experimental Treatments and Feeding Management
Four dietary treatments were formulated by combining 2 factors, each with 2 levels. The
dietary factors studied were 1) dry-rolled barley (DRB) vs. pelleted barley (PB) as the principal
source of RFC and 2) dietary levels of RDP of 60 vs. 70% (% of CP, DM basis). The ingredient
and chemical composition for 4 concentrate mixtures used to formulate the experimental diets are
presented in Table 3.1. Barley grain obtained from one source was used for both DRB and PB
throughout the experiment. The DRB was prepared by passing whole barley grains through large
rollers (23 x 58 cm). For pelleting, whole barley grains were ground through a 6.35-mm screen in
a hammer mill and then pelleted using a California pellet mill.
Page 50
30
Table 3.1 Ingredient and chemical composition of concentrates mixtures with low or high
ruminally-degradable protein (RDP) containing dry rolled barley (DRB) or pelleted barley (PB)
Low RDP High RDP
Item DRB PB DRB PB
Ingredients, % DM
Barley, dry rolled 45.0 - 45.0 -
Barley, pelleted - 45.0 - 45.0
Alfalfa meal 30.0 30.0 30.0 30.0
Soybean meal 1.0 1.0 1.0 1.0
Tallow 1.0 1.0 1.0 1.0
Molasses 2.0 2.0 2.0 2.0
Canola meal 2.5 2.5 8.0 8.0
Corn gluten meal 9.5 9.5 1.5 1.5
Distillers grain, dry 2.0 2.0 3.5 3.5
Ground limestone 4.0 4.0 4.0 4.0
Urea - - 1.0 1.0
Salt, Co-I1 0.7 0.7 0.7 0.7
Salt, white 1.3 1.3 1.3 1.3
Mineral vitamin supplement2 1.0 1.0 1.0 1.0
Chemical composition
DM, % 92.1 92.4 92.0 92.0
OM, % of DM 89.2 88.9 88.0 88.3
CP, % of DM 20.5 20.5 21.3 21.4
RDP, % of CP 56.9 57.7 68.9 67.8
NDF, % of DM 30.2 28.4 31.5 30.2
ADF, % of DM 17.4 18.4 19.2 18.9
EE, % of DM 3.6 4.1 4.1 4.2
1Salt, cobalt and iodine mix
2Contained per kg of supplement DM : CuO, 3.3 mg; ZnO, 22 mg; MnO, 18.5 mg; vitamin A,
1,495 IU; vitamin D, 125.5 IU; vitamin E, 22 IU; sodium selenite, 0.1 mg; and rumensin, 10.2
mg.
Page 51
31
Experimental diets were fed twice daily for ad libitum intake at 0900 and 1700 as total
mixed rations (TMR), composed of 80% concentrate mixture and 20% barley silage (DM basis),
which were hand mixed thoroughly just before feeding. Barley silage contained 35.5% DM and
its chemical composition (DM basis) was 90.9% OM, 11.3% CP, 54.7%
NDF, 35.8% ADF, and
3.42% ether extract. At the beginning of the experiment, lambs were adapted to high-grain
diets
by the gradual introduction of the concentrate mixtures over a 12-d period. Briefly, on d 1, lambs
were fed a TMR containing 30% concentrate and 70% barley silage (DM basis). Proportions
of
the concentrate mixture in the TMR were increased by 10% every alternate day, such that by d
10, the TMR contained 80% concentrate. This grain adaptation protocol was used to limit
the risk
of digestive upsets. Experimental TMR were formulated to contain 28.8 g of N/kg of DM (18%
CP). The chemical composition of experimental TMR is presented in Table 3.2. Lambs had free
access to water and were weighed weekly.
3.3.3 Sample Collection
Experimental lambs were moved from individual floor pens into individual metabolism
crates on d 12 of each experimental period to allow acclimation before the initiation of data
collection on d 15. During the 7-d data collection period, individual lamb
feed intake was
recorded daily. Samples of experimental TMR and orts were collected daily, stored at -20°C, and
composited per lamb for each experimental period before chemical analysis.
On d 14 of each experimental period, lambs were fitted with
temporary vinyl catheters
(0.86-mm i.d. x 1.32-mm o.d.; Scientific Commodities Inc., Lake Havasu City, AZ) in the right
and left jugular veins to allow for simultaneous isotope infusion and
blood sampling. Urea
transfer to the GIT and whole-body N balance were determined between d 15 and 21,
as
described by Lobley et al. (2000). Briefly, background samples of urine, feces, and blood were
collected on d 14 to measure the natural abundance of
15N.
Page 52
32
Table 3.2 Chemical composition of total mixed rations containing 80% concentrate mixture
and 20% barley silage (DM basis) with low or high ruminally-degradable protein (RDP) and
dry rolled (DRB) or pelleted barley (PB)
Low RDP High RDP
Item DRB PB DRB PB
DM, % 91.7 92.2 92.0 92.0
OM, % of DM 89.7 89.6 88.7 88.8
CP, % of DM 18.7 18.3 19.1 18.7
RDP, % of CP 60.3 60.8 70.1 68.6
NDF, % of DM 33.1 33.7 35.4 34.8
ADF, % of DM 20.9 21.9 23.9 23.8
EE, % of DM 3.8 3.9 4.0 4.0
Page 53
33
Beginning on d 15 of each experimental period, double-labeled urea ([
15N
15N]-urea), 99.8
atom % 15
N, Cambridge Isotope Laboratories, Andover, MA) prepared in 0.15
M sterile saline
was infused continuously into a jugular vein at a rate of 1.2 mmol of N/d using a peristalitic
pump (Model 60 rpm/7524-10, Masterflex L/S Microprocessor Pump Drive, Vernon
Hills, IL)
for 96 h (d 15 to 19). Total feces and urine were collected daily between d 15 to
21 before the
0900 feeding to determine daily outputs. Feces were collected using fecal bags, which were fitted
2 d before the start of collection to allow acclimation. Bags were emptied
daily at 0900 during
total collection periods. Total daily fecal
output for each lamb was mixed thoroughly,
quantitatively transferred into a preweighed plastic container and weighed. A 25% subsample
was taken daily and stored at –20°C. Urine was collected into sealed plastic containers placed
below metabolic crates. Plastic containers had 40 mL of 12 M HCl to maintain the urine
pH
between 2 to 3 to prevent bacterial growth and the loss of NH3. Total urine output was recorded
daily. A 50-mL subsample of urine was collected daily (d 16 to 19) and stored at –20°C
until
analyzed for proportions of [15
N15
N]-, [14
N15
N]-, and [
14N
14N]-urea in urinary urea. In addition, a
2-mL subsample of urine was diluted with 8 mL of distilled water and stored
at –20°C for later
determination of urea-N and purine derivatives (PD). All daily urinary output was composited by
period and animal and stored at –20°C until analyzed for total N. Blood samples were collected
daily from the contralateral jugular vein in vacutainers containing heparin just before the
0900
feeding. Blood samples were centrifuged at 1,500 x g for 15 min at 4°C, and the plasma obtained
was stored at –20°C until analyzed for urea-N.
3.3.4 Sample Analyses
At the end of the trial, frozen TMR, orts, and fecal subsamples were thawed overnight at
room temperature and analyzed for DM by drying in an oven at 60°C for 48 h (AOAC, 1990;
method 930.15). Dried TMR, orts, and feces were then ground through
a 1-mm screen using a
Christy-Norris mill (Christy and Norris Ltd., Chelmsford, UK). Ground TMR, orts, and feces
samples were pooled per lamb for each experimental period and analyzed for
organic matter
(OM) by ashing at 600°C for at least 8 h, crude protein (CP) using the macro-Kjeldahl procedure
(AOAC, 1990; method 990.03), ether extract (AOAC, 1990; method 920.39), acid-detergent
fiber (ADF; AOAC, 1990), and neutral-detergent fiber (NDF; Van Soest et al., 1991). Amylase
and sodium sulfite were used for NDF determination. Dietary content of RDP in experimental
Page 54
34
TMR and ruminal starch degradation were determined using the in situ method, as described
by
Yu et al. (2003). Briefly, air-equilibrated experimental TMR samples (approximately 7 g) were
weighed into nylon bags and incubated in the rumen of a steer fed barley silage for
2, 4, 8, 12, 24,
and 48 h. The rumen incubation protocol, nylon bags, and washing and drying procedures for
nylon bags were as described by Yu et al. (2003). Samples of TMR and nylon bag
residues were
analyzed for CP using the macro-Kjeldahl procedure (AOAC, 1990; method 990.03) and for total
starch (AOAC, 1990;
method 996.11) using a commercial kit (Total Starch Assay Kit,
Megazyme International Ireland Ltd., Wicklow, Ireland). Rumen degradation characteristics of
CP and starch were analyzed using the NLIN procedure (SAS Institute Inc., Cary, NC) using
iterative least squares regression (Gauss-Newton method), as described
by Yu et al. (2003).
Total N in pooled urine was determined using the macro-Kjeldahl procedure (AOAC,
1990). Daily dilute urine subsamples were pooled by lamb and experimental period and analyzed
for allantoin and xanthine plus hypoxanthine (Chen and Gomes, 1992), and for uric
acid by a
quantitative enzymatic colorimetric method using a
commercial kit (Stanbio Uric Acid
Liquicolor Kit, Procedure No. 1045, Stanbio Laboratories, Boerne, TX). Total PD excretion
per
day was calculated as: allantoin + uric acid + xanthine plus hypoxanthine. Microbial non NH3-N
(NAN) supply was calculated based on total PD excretion in urine (Chen and Gomes, 1992),
using BW measurements obtained on d 14. The ratio of purine N:total N in ruminal microbes was
assumed constant at 11.6:100 (Chen and Gomes, 1992). Plasma urea-N (PUN) and UUN were
determined by the diacetyl monoxime method of Marsh et al. (1957) using a commercial kit
(Stanbio Urea Nitrogen Kit, Procedure No. 0580, Stanbio Laboratories).
To determine the proportions of [15
N15
N]-, [14
N15
N]-, and [14
N14
N]-urea in daily urine
samples, urinary urea was isolated by applying urine containing 1.5 mg of urea-N through
prepacked cation exchange resin columns (AG-50W-x8 Resin, 100–200 mesh, H
+ form,
BioRad,
Richmond, CA) as described by Archibeque et al. (2001). Previous studies have determined that
this concentration of urea-N was suitable to ensure sufficient amounts of gas for
analysis, yet
minimized the occurrence of non-monomolecular degradation of urea (Sarasecca et al., 1998;
Archibeque et al., 2001; Marini and Van Amburgh, 2003). After the urine was applied to the
column, 7 mL of N-free water was applied to the columns, and the eluate
discarded. Urea was
then eluted by applying 20 mL of N-free water to the columns, which was collected into test
Page 55
35
tubes. The eluate was air-dried at 60°C, and urea was quantitatively
transferred into 17- x 60-mm
borosilicate glass tubes using three 1-mL rinses of N-free water. The urea samples were then
freeze-dried and the proportions of [15
N15
N]-, [14
N15
N]-, and [14
N14
N]-urea in urinary urea were
analyzed by isotope ratio mass
spectrometry (Lobley et al., 2000) at the N-15 Analysis
Laboratory, University of Illinois (Urbana-Champaign). Under the conditions
of this assay,
[14
N14
N]-, [14
N15
N]-, and [15
N15
N]-urea molecules should yield ions with mass/charge (m/z)
values of 28, 29, and 30, respectively. To account for non-monomolecular reactions,
standards
that were prepared from [15
N15
N]-urea (99.8 atom % 15
N) and [14
N14
N]-urea (natural abundance
urea; 0.364 atoms %
15N) were also analyzed and the necessary corrections for
[
14N
15N]-urea that
is produced by non-monomolecular reactions were then made (Lobley et al., 2000). Fecal
samples collected daily (d 15 to 19) were analyzed for total
15N enrichment by
combustion to N2
in an elemental analyzer and continuous flow isotope ratio-mass spectrometry, as described by
Lobley et al. (2000).
3.3.5 Calculation of Urea-N Kinetics
Urea-N kinetics was calculated according to the model of Lobley et al. (2000), using
urinary 15
N enrichment of [15
N15
N] and [14
N15
N]-urea and total 15
N excretion in feces. The
enrichments of [15
N15
N]-urea are expressed relative to sum of [14
N15
N] and [14
N14
N], while
enrichments of [14
N15
N]-urea are expressed relative to sum of [15
N15
N] and [14
N14
N]. In this
model, a portion of urea-N synthesized in the liver (urea-N entry rate, UER) is lost via the urine
(urinary urea-N elimination, UUE), and the remainder enters the GIT (GIT entry rate, GER). The
GER undergoes bacterial degradation liberating NH3. A portion of this NH3 is excreted in feces
(urea-N in feces, UFE), some is reabsorbed into portal blood and it re-enters the ornithine cycle
in the liver (ROC), and the remainder is used for anabolic purposes i.e., synthesis of microbial
protein (urea-N utilized for anabolism, UUA) (Lobley et al., 2000).
3.3.6 Statistical Analysis
All data were analyzed using PROC MIXED of SAS for a 4 x 4 Latin square design
according to the following model: Y = µ + P + L + R + G + (R x G) + E, where Y is the
dependent variable, µ is the overall mean, P is the effect of period, L is
the effect of lamb, R is
the effect of dietary RDP level, G is the effect of method of barley grain processing, R x G is
the
Page 56
36
interaction between dietary RDP level and method of barley grain processing, and E is the
residual error. All terms were considered fixed, except L and E, which were considered random.
When there was a significant method of barley processing x level of RDP interaction, means
were separated by Tukey‟s honestly significant differences test. Treatment differences were
considered significant when P ≤ 0.05 and tendencies are discussed when
0.05 < P ≤ 0.10.
3.4 Results and Discussion
3.4.1 Diet Characteristics
The chemical compositions of experimental TMR fed to growing lambs are presented in
Table 3.2. The TMR were formulated to be isonitrogenous at 28.8 g of N/kg of DM (18.5% CP),
and chemical analysis showed only marginal deviations in dietary N content
across the TMR,
with a CV of 1.9% (Table 3.2). Experimental TMR contained 60 and 70% RDP (as % of CP), or
11.1 and 13.1% (as % of DM; Table 3.3). The actual RDP levels as determined using
the in situ
technique indicated only marginal deviations from these intended dietary RDP contents (Table
3.2). The NRC (2001) recommendations for dietary RDP levels are 10.9 to 11.3% (as
% of DM)
for cows producing up to 40 kg/d of milk. However, Reynal and Broderick (2005) fed dairy cows
diets with RDP levels
ranging from 13.2 to 10.6% (as % of DM) and concluded that
recommended levels of RDP should fall between 11.7 and 12.2%. The RDP levels
that were
tested in our study are comparable to that recommended RDP range. As expected, the in situ
soluble CP fraction (P < 0.001), the degradation rate of the degradable CP fraction (P
= 0.004),
and effective CP degradability (P < 0.001) of the high-RDP diet were greater than that of the
low-RDP diet; however, the degradable CP fraction was smaller (P < 0.001) for the
high-RDP
diet compared with the low-RDP diet (Table 3.3). In this experiment, fine grinding of barley
grain before pelleting was expected to increase ruminal starch digestion compared with
dry-
rolling, thus increasing the ruminal energy availability for microbial protein production. The
results of the in-situ study indicated that method of barley grain processing had significant
effects
on ruminal starch digestion (Table 3.3).
Page 57
Table 3.3 In situ ruminal degradation kinetics of CP and starch in total mixed rations with low or high ruminally-degradable
protein (RDP) containing dry-rolled (DRB) or pelleted barley (PB)
Low RDP High RDP P value1
Item DRB PB DRB PB SEM BP RDP BP x RDP
CP
Soluble fraction, % 26.5 29.5 47.5 46.6 0.92 0.32 <0.001 0.11
Degradable fraction, % 64.1 62.0 41.6 42.5 1.73 0.76 <0.001 0.43
Degradation rate, %/h 6.8 6.1 6.9 7.1 0.09 0.07 0.004 0.008
Effective degradability2, % 60.3 60.8 70.1 68.6 0.55 0.81 <0.001 0.77
Starch
Soluble fraction, % 10.6 15.7 11.6 16.9 1.71 0.04 0.15 0.33
Degradable fraction, % 86.0 81.1 85.0 80.8 1.83 0.07 0.11 0.14
Degradation rate, %/h 13.3 15.9 12.3 16.7 1.11 0.03 0.92 0.44
Effective degradability2, % 71.5 76.1 71.7 76.9 1.21 0.02 0.70 0.80
1BP = barley grain processing (DRB vs. PB); RDP = dietary level of RDP; BP x RDP = interaction.
2Calculated assuming a ruminal outflow rate of 6%/h.
37
Page 58
38
As expected, the in situ soluble starch fraction (P = 0.04), degradation
rate of the
degradable starch fraction (P = 0.03), and effective starch degradability (P = 0.02) of the TMR
containing PB were greater than that of the TMR containing DRB; however, the degradable
starch fraction tended to be lower (P = 0.07) in the TMR containing PB compared
with those
containing DRB. Data comparing ruminal starch digestion in ruminants fed DRB or pelleted
barley are scarce. Feeding PB increased ruminal starch digestion,
decreased ruminal pH, and
increased VFA concentrations compared with feeding DRB in dairy cows (Gozho et al., 2008).
We did not measure ruminal starch digestion in lambs used in the current study; however, based
on the in situ ruminal starch digestion measurements, we can surmise that ruminal starch
digestion was altered by barley grain processing.
3.4.2 Intakes, N Balance, Urea-N Kinetics, and Microbial NAN Supply
As expected, all experimental lambs gained weight (200 ± 3.5 g/d on average) during the
experiment, however there was difference in average daily gain in body weight across treatments
(P > 0.05). Interactions between the level of dietary RDP and method of barley grain processing
influenced N metabolism in lambs (Table 3.4). Lambs fed the high dietary RDP consumed 111
g/d more DM compared with those fed the low dietary RDP (P = 0.006); consequently, lambs fed
the high dietary RDP consumed 4.2 g/d more N compared with those
fed the low dietary RDP (P
= 0.001). Compared with the high dietary RDP, excretion of fecal N (P = 0.002) and urinary N
(P
= 0.03) were 1.8 and 2.9 g/d lower, respectively, in lambs fed the low dietary RDP. The greater
N intake (4.2 g/d) in lambs fed the high dietary RDP was similar to the extra N (4.7 g/d)
that was
voided in feces and urine. Nitrogen digestibility was greater (P = 0.04) in lambs fed DRB
compared with those fed PB. In addition, N digestibility was greater (P = 0.04) in lambs fed the
low dietary RDP compared to those fed the high dietary RDP. Retained N was unaffected (P
0.74) by dietary treatment, and all experimental animals were in positive N balance. Previous
research with lambs fed varying dietary N levels reported that N retention reached a
plateau at
dietary N contents around 28 g of N/kg of DM (Marini et al., 2004), which is equivalent to the
dietary N content used in our study. Plasma urea-N concentration was unaffected
(P = 0.27) by
barley processing, but it tended (P = 0.06) to be greater in lambs fed the low dietary RDP
compared with those fed the high dietary RDP.
Page 59
Table 3.4. Intake, N digestibility, N balance and plasma urea-N in growing lambs fed total mixed rations with low or high
ruminally-degradable protein (RDP) containing dry rolled (DRB) or pelleted barley (PB)
Low RDP High RDP P value1
Item DRB PB DRB PB SEM BP RDP BP x RDP
DMI, g/d 1,457.8 1,377.1 1,516.0 1,541.1 39.6 0.48 0.006 0.19
N intake, g/d 43.9 42.3 47.9 46.6 1.2 0.23 0.001 0.86
Fecal N, g/d 10.2 10.1 11.5 12.4 0.5 0.51 0.002 0.35
Urine N, g/d 25.9 23.7 28.7 26.6 1.3 0.10 0.03 0.95
Urine urea-N (UUN), g/d 16.3 16.0 17.9 14.1 0.9 0.04 0.87 0.08
UUN/Urine N, % 64.0 70.0 68.0 57.0 0.04 0.59 0.35 0.04
N digestibility, % 77.1 76.1 76.2 73.3 0.9 0.04 0.04 0.33
N retention, g/d 7.79 8.49 7.72 7.66 1.34 0.81 0.74 0.78
Plasma urea-N, mg/dL 27.1 28.1 25.9 26.4 0.6 0.27 0.06 0.75
1BP = barley grain processing (DRB vs PB); RDP = level of RDP; BP x RDP = interaction.
39
Page 60
40
Lambs fed high-concentrate diets with N contents comparable to those used in our study
( 27.2 g of N/kg of DM) had similar PUN concentrations (Dabiri and Thonney,
2004; Marini et
al., 2004). The greater PUN concentration in lambs fed the low-RDP diet was unexpected,
especially considering that these lambs had lower intake of ruminally fermentable N,
which
would have decreased post-absorptive NH3-N supply for hepatic ureagenesis; the reasons for this
observation are unclear.
The primary objective of the present study was to determine how interactions between
dietary RDP level and RFC might potentially alter urea-N transfer to the GIT and the utilization
of this recycled urea-N in growing lambs fed high N diets (i.e., 28.8 g N/kg DM) that are more
representative of practical feeding conditions in North America. Previous studies (Kennedy and
Milligan, 1980; Marini and Amburgh, 2003; Marini et al., 2004) have clearly demonstrated that a
higher proportion of hepatic urea-N output is transferred to the GIT in ruminants fed low N diets;
however, under practical feeding conditions during lactation or growth, productive ruminants are
rarely fed low N diets. In Holstein heifers fed high N diets, there was a wide range (29 to 42%)
in the proportion of hepatic urea-N output that was recycled to the GIT (Marini and Amburgh,
2003), thus indicating that, even at high levels of N intake there is opportunity to enhance N
efficiency of ruminants by manipulating the extent of urea-N recycling to the GIT. Therefore, it
is important to delineate regulatory mechanisms that dictate urea-N transfer to the GIT and the
subsequent fate of recycled urea-N in ruminants fed high N diets. Across treatments, urinary
[15
N15
N]-urea enrichment reached a plateau within 24 to 48 h of isotopic infusion, whereas
plateau enrichment of [14
N15
N]-urea in urine was not attained until between 48 and 72 h of
isotopic infusion (Figure 3.1). This time course in the urinary enrichments of [14
N15
N]- and
[15
N15
N]-urea is consistent with previous research using sheep (Lobley et al., 2000; Sunny et al.,
2007). Fecal 15
N enrichments increased daily over the 4-d isotopic infusion without attaining a
definite plateau (Figure 3.2); therefore, for calculations of urea-N kinetics, urinary [14
N15
N]- and
[15
N15
N]-urea and fecal 15
N enrichments over the final 72 to 96 h of infusion were used, similar
to previous research (Lobley et al., 2000; Sunny et al., 2007). In the present study, dietary
treatment did not alter (P > 0.05) urea kinetics as measured by the intra-jugular [15
N15
N]-urea
infusion protocol (Table 3.5); however, UFE was higher (P = 0.01) in lambs fed DRB compared
to those fed PB (Table 3.5).
Page 61
41
Figure 3.1 Enrichments (APE, atom percent excess) of [15
N15
N]-urea (A) and [14
N15
N]-urea (B)
in urine during 4-d intra-jugular infusions of [15
N15
N]-urea (infusions were initiated at sampling
interval 0 h). Treatments were: low RDP + dry-rolled barley (Low RDP-DRB); low RDP +
pelleted barley (Low RDP-PB); high RDP + dry-rolled barley (High RDP-DRB); and high RDP
+ pelleted barley (High RDP-PB). For [15
N15
N]-urea enrichments, no differences were detected
between sampling intervals 0-24, 24-48, 48-72, and 72-96 h (P > 0.10). For [14
N15
N]-urea
enrichments, no differences were detected between sampling intervals 24-48, 48-72, and 72-96 h
(P > 0.10). Each line represents means ± SEM for 4 lambs.
Page 62
42
Figure 3.2 Enrichments (APE, atom percent excess) of fecal 15
N during 4-d intra-jugular
infusions of [15
N15
N]-urea (infusions were initiated at sampling interval 0 h). Treatments were:
low RDP + dry-rolled barley (Low RDP-DRB); low RDP + pelleted barley (Low RDP-PB); high
RDP + dry-rolled barley (High RDP-DRB); and high RDP + pelleted barley (High RDP-PB).
Differences were detected in fecal 15
N enrichments between sampling intervals 0-24, 24-48, 48-
72, and 72-96 h (P = 0.001), indicating that fecal 15
N enrichment did not reach a definite plateau.
Each line represents means ± SEM for 4 lambs.
Page 63
Table 3.5. Urea-N recycling kinetics as measured using 4-d continuous jugular infusions of [15
N15
N]-urea in growing lambs fed
total mixed rations with low or high ruminally-degradable protein (RDP) containing dry rolled (DRB) or pelleted barley (PB)
Low RDP High RDP P value1
Item DRB PB DRB PB SEM BP RDP BP x RDP
Urea-N kinetics, g/d
Production, UER 49.76 45.78 50.98 50.18 4.99 0.22 0.35 0.58
Entry to GIT, GER 35.17 30.59 38.54 36.54 6.12 0.50 0.22 0.71
Return to ornithine cycle, ROC 22.22 23.24 23.70 24.72 3.55 0.34 0.48 0.99
Loss to feces, UFE 0.74 0.47 0.87 0.57 0.09 0.01 0.08 0.78
Loss to urine, UUE 14.59 15.19 12.44 13.63 5.19 0.68 0.54 0.92
Re-use for anabolism, UUA 12.21 6.88 13.97 11.25 5.66 0.47 0.38 0.69
Fractional urea-N transfers
UER to urine 0.296 0.331 0.257 0.263 0.109 0.92 0.41 0.81
UER to GIT 0.704 0.669 0.742 0.737 0.109 0.92 0.41 0.81
GER to ROC 0.641 0.756 0.636 0.666 0.105 0.46 0.45 0.49
GER to feces 0.022 0.017 0.023 0.015 0.004 0.09 0.84 0.46
GER to UUA 0.338 0.227 0.340 0.319 0.106 0.51 0.45 0.47
1BP = barley grain processing (DRB vs PB); RDP = level of RDP; BP x RDP = interaction.
43
Page 64
44
Previous research showed that the proportion of GER that is lost via the feces is largely
influenced by the supply of fermentable energy to the hind-gut (Thornton et al., 1970; Oncuer et
al., 1990). In the present study, fermentable energy supply to the hind-gut was not measured, but
it can be surmised that, compared to feeding PB, feeding DRB provided more fermentable
energy to the hind-gut, thus a higher transfer of GER to the hind-gut and subsequent loss via the
feces. Urea-N transfer to feces tended (P = 0.08) to be higher in lambs fed the high dietary RDP
compared to those fed the low dietary RDP (Table 3.5). Fractional urea-N transfers of the GER
to feces ranged from 0.015 to 0.022 across diets, and this represented the smallest proportion of
GER (Table 3.5). Across dietary treatments, the UER was 1.06 to 1.13 of N intake (Table 3.4). In
growing ruminants, hepatic output of urea-N can exceed N intake under a wide variety of dietary
conditions, and is positively correlated with N intake. The UER:N intake ratios obtained in sheep
by other workers (0.77 to 0.95, Lobley et al., 2000; 0.73 to 0.99, Sunny et al., 2007) indicate that
the UER:N intake ratio can vary considerably depending on dietary conditions. However, in
these studies, N intakes (range of 14.3 to 22.0 g/d) were lower compared to those in the present
study (42.3 to 47.9 g/d), and this difference might explain the higher UER:N intake ratios that we
observed in the present study. The quantity of hepatic urea-N output transferred to the GIT (i.e.,
GER), expressed as a proportion of UER was high at 0.669 to 0.742 (Table 3.5). In ruminants,
the proportion of hepatic urea-N output that can be recycled to the GIT is influenced by a wide
variety of factors (Lapierre and Lobley, 2001), and can vary from 0.10 to 0.95 (Harmeyer and
Martens, 1980). Various workers, using sheep at N intakes ranging from 8.9 to 25 g/d (i.e., lower
N intakes as compared to the present study) observed that the GER:UER ratios ranged from 0.75
to 0.61 (Sarraseca et al., 1998; Lobley et al., 2001; Marini et al., 2004), and were negatively
correlated with N intake. Another important factor influencing the GER:UER ratio appears to be
blood concentrations of urea-N (Harmeyer and Martens, 1980). Recently, Sunny et al. (2007),
using an intra-jugular urea infusion protocol to increase blood urea-N concentrations, clearly
demonstrated that urea-N transfer from blood to the GIT was elevated as blood urea-N
concentration increased. In the present study, PUN concentrations (25.9 to 28.1 mg/dL) across
dietary treatments were higher than reported in other studies (Lobley et al., 2001; Marini et al.,
2004), so it is plausible that the higher GER:UER ratios observed, even with higher N intakes,
could be attributable to the higher PUN concentrations.
Page 65
45
The GER that was used in the GIT for anabolic purposes (UUA) was unaffected by
dietary treatment (Table 3.5). Across dietary treatments, UUA ranged from 0.227 to 0.340 as a
proportion of the GER (Table 3.5). A significant proportion, ranging from 0.636 to 0.756, of the
GER was reabsorbed into portal blood as NH3-N and returned to the urea cycle (i.e., ROC; Table
3.5). The reasons for this observation are unclear, but it is plausible that, because of the high N
intakes, a limit of N utilization for anabolic purposes in the GIT may already have been reached
(Lobley et al., 2000). We had hypothesized that the provision of additional RFC via grain
processing would enhance urea-N transfer to the GIT and, subsequently, its utilization for
anabolic purposes. The lack of effect of grain processing suggests that energy supply did not
limit utilization of the extra N provided via enhanced urea-N recycling to the GIT, likely because
of the high levels of concentrate fed.
Urinary output of total urine was unaffected (P > 0.05) by dietary treatment (Table 3.6).
Urinary excretion of allantoin and uric acid were unaffected (P > 0.05) by dietary treatment
(Table 3.6); however, there was a tendency (interaction; P = 0.08) for urinary PD to be higher in
lambs fed DRB compared to those fed PB at the low dietary RDP, but not at the high dietary
RDP (Table 3.6). Microbial non-NH3-N (NAN) flow to the small intestine, which was estimated
using urinary PD excretion, tended (P = 0.08) to be higher in lambs fed DRB compared to those
fed PB at the low dietary RDP, but not at the high dietary RDP (Table 3.6). Chamberlain et al.
(1993) observed no significant difference in urinary output of PD and microbial NAN supply in
sheep fed varying degradable protein and supplied with wheat starch. Similarly, Sannes et al.
(2002) did not observe any difference on PD excretion in dairy cows fed protein sources of
varying RDP content. Because diets were high in concentrate and N, it is likely that energy or N
supply for microbial growth were not limiting, thus the lack of dietary effect on microbial NAN
supply that was observed in the present study.
Page 66
Table 3.6 Organic matter intake and OM digestibility, urinary purine derivative (PD) excretion and microbial non-ammonia
nitrogen (NAN) supply in growing lambs fed total mixed rations with low or high ruminally-degradable protein (RDP)
containing dry rolled (DRB) or pelleted barley (PB)
Low RDP High RDP P value1
Item DRB PB DRB PB SEM BP RDP BP x RDP
OM intake, g/d 1,310 1,230 1,352 1,377 11.4 0.86 0.006 0.18
OM digestibility, % 71.7 69.9 69.2 70.6 0.96 0.79 0.36 0.10
Urinary excretion
Total urine output, g/d 2.33 2.66 2.30 2.59 0.54 0.58 0.93 0.97
Uric acid excretion, mmol/d 2.96 3.31 3.28 3.44 0.39 0.52 0.57 0.81
Allantoin excretion, mmol/d 21.6 18.9 19.9 21.6 0.72 0.06 0.45 0.12
Total PD excretion, mmol/d 24.6 22.3 23.2 23.0 0.58 0.05 0.58 0.08
Microbial NAN supply2
g microbial N/d 21.3 19.3 20.1 19.9 0.49 0.05 0.58 0.08
g microbial N/kg DOMR 23.1 22.7 22.1 20.8 1.82 0.66 0.43 0.81
1BP = barley grain processing (DRB vs PB); RDP = level of RDP; BP x RDP = interaction.
2Microbial NAN supply was calculated according to Chen and Gomes (1992); DOMR = digestible organic matter in rumen, which
was calculated as 0.65 * DOMI (Chen and Gomes, 1992).
46
Page 67
47
3.5 Conclusions
Concomitant changes in dietary RDP level and method of barley grain processing did not
alter hepatic urea-N output and urea-N recycled to the GIT. Although substantial amounts of
hepatic urea-N output were transferred to the GIT, most of this N was returned to the ornithine
cycle. Because of the high N intakes, it is plausible that a plateau in N utilization
may already
have been reached, thus limiting the utilization of the extra N supplied from recycled urea-N.
Hence, under practical feeding systems demanding greater production in terms of protein
accretion for growth, urea recycling seems to be of little importance when the dietary N
concentrations are adequate or marginally above the adequate levels.
Page 68
48
4. EFFECTS OF PARTIAL RUMINAL DEFAUNATION ON UREA-NITROGEN
RECYCLING, NITROGEN METABOLISM, AND MICROBIAL NITROGEN
SUPPLY IN GROWING LAMBS FED LOW OR HIGH DIETARY CRUDE
PROTEIN CONCENTRATIONS1
4.1 Abstract
Urea-N recycling to the gastrointestinal tract (GIT), N metabolism and urea transporter-
(UT)-B mRNA abundance in ruminal epithelium were evaluated in partially-defaunated
(PDFAUN) and faunated (FAUN) growing lambs fed two levels (10%, LOW or 15%, HIGH) of
dietary CP (DM basis). Four Suffolk ram lambs (43.9 ± 1.4 kg initial BW) were used in a 4 x 4
Latin square design with 27-d periods. Sunflower oil was fed (6%; DM basis) as an anti-
protozoal agent. Nitrogen balance was measured from d 22 to d 26, with concurrent
measurement of urea-N kinetics using continuous intra-jugular infusions of [15
N15
N]-urea.
Feeding sunflower oil decreased (P < 0.01) total ruminal protozoa by 88%, and this was
associated with a decrease (P < 0.01) in ruminal NH3-N concentrations. Endogenous production
of urea-N (UER; 26.1 vs. 34.6 g/d) and urinary urea-N excretion (UUE; 10.1 vs. 15.7 g/d) were
lower (P < 0.01), and the amount of urea-N recycled to the GIT (GER; 16.0 vs. 18.9 g/d) tended
to be lower (P = 0.06) in PDFAUN as compared to FAUN lambs. However, as a proportion of
UER, GER was higher (P < 0.01) and the proportion of recycled urea-N that was utilized for
anabolism (i.e., UUA) tended to be higher (P = 0.09) in PDFAUN lambs. Microbial N supply
was higher (P < 0.01) in PDFAUN compared to FAUN lambs. The UER, GER and UUE were
higher (P < 0.01) in lambs fed diet HIGH. However, as a proportion of UER, GER and its
anabolic use were higher (P < 0.01) in lambs fed diet LOW. The expression of UT-B mRNA in
PDFAUN lambs was numerically higher (by 20%; P = 0.15) as compared to FAUN lambs. In
summary, results indicate that part of the mechanisms for improved N utilization in defaunated
ruminants is an increase in the proportion of endogenous urea-N output that is recycled to the
GIT, thus potentially providing additional N for microbial growth.
1A version of this chapter has been published: Kiran, D., and T. Mutsvangwa. 2010. Effects of partial ruminal
defaunation on urea-nitrogen recycling, nitrogen metabolism, and microbial nitrogen supply in growing lambs fed
low or high dietary crude protein concentrations. J. Anim. Sci. 88: 1034-1047.
Page 69
49
4.2 Introduction
In ruminants, protozoa account for 20 to 70% of the ruminal microbial biomass, but their
contribution to microbial protein flow at the duodenum is limited to only 20 to 40% (Jouany,
1996). Defaunation improves N utilization, mainly by decreasing intra-ruminal N recycling and
the NH3-N pool (Koenig et al., 2000), and by increasing the sequestration of NH3-N into
bacterial protein (Firkins et al., 2007). It is plausible that the positive effects of defaunation on N
utilization may also result from an increase in urea-N recycling to the rumen. Protozoa degrade
dietary and bacterial proteins, thus elevating ruminal NH3-N level; consequently, defaunation
consistently decreases ruminal NH3-N level (Jouany, 1996). Ruminal NH3-N level is negatively
correlated with urea-N transfer into the rumen (Kennedy and Milligan, 1980), as a high NH3-N
level decreases the ruminal epithelium‟s permeability to urea-N (Egan et al., 1986). Also, urea-N
transfer into the rumen is facilitated by bacterial urease activity which maintains a favorable
concentration gradient (Rémond et al., 1996), and urease activity is negatively correlated with
ruminal NH3-N level (Cheng and Wallace, 1979). Therefore, it is possible that the decreased
ruminal NH3-N level with defaunation may increase urea-N recycling by increasing both urease
activity and the ruminal epithelium‟s permeability to urea-N. Effects of defaunation on ruminal
NH3-N level decrease with dietary N level (Eugène et al., 2004), and the benefits of defaunation
on N utilization are greater in protein-deficient animals (Leng and Nolan, 1984), suggesting that
there might be interactions between defaunation and dietary N level on N use.
Therefore, the objective was to delineate how interactions between defaunation and
dietary N level may alter urea-N kinetics in lambs. The hypothesis was that defaunation would
increase urea-N recycling to the rumen and its utilization for anabolic purposes, and that these
effects would be more pronounced in protein deficient lambs.
4.3 Materials and Methods
4.3.1 Animals and Experimental Design
The lambs were cared for and handled in accordance with regulations of the Canadian
Council on Animal Care (1993), and their use in this experiment was approved by the University
of Saskatchewan Animal Care Committee (UCACS Protocol No. 20040048).
Four Suffolk ram
lambs (43.9 ± 1.4 kg initial BW) fitted with ruminal cannulae were used in a 4 x 4 Latin square
Page 70
50
design experiment with 27-d periods and a 2 x 2 factorial arrangement of dietary treatments.
Each experimental period consisted of 21 d of dietary adaptation and 6 d of data collection.
Throughout the experiment, lambs were housed at the Livestock Research Building (University
of Saskatchewan) in a temperature-controlled environment (18 to 22°C). Lambs were housed in
individual floor pens (during the 21-d dietary adaptation) or in metabolism crates (during the 6-d
data collection period) to facilitate total urine and feces collection.
4.3.2 Experimental Treatments and Feeding Management
The treatment factors were: 1) partially-defaunated (PDFAUN) vs. faunated (FAUN)
lambs; and 2) low (10%, LOW) vs. high (15%, HIGH) dietary CP (DM basis). The ingredient
and chemical composition of the LOW and HIGH experimental diets are presented in Table 4.1.
Diets were offered in the form of a meal for ad libitum intake twice daily in equal portions at
0900 and 1700 h ensuring that 10% of orts remained each day. Lambs had free access to water.
Lambs were weighed weekly, before access to feed and water.
4.3.3 Partial Defaunation and Refaunation
Linoleic acid-rich sunflower oil (SFO; SafewayTM
Canada, Saskatoon, SK, Canada) was
fed (6%, DM basis) as an anti-protozoal agent. The protocol for ruminal defaunation was based
on previous research (Ivan et al., 2001). The SFO contained (%) 6.24, 3.87, 26.15, 67.07, and
0.49 of palmitic (C16:0), stearic (C18:0), oleic (C18:1), linoleic (C18:2(n-6), and linolenic
(C18:3(n-3) acid, respectively. At each feeding, half the daily allotment of SFO was thoroughly
hand-mixed with 250 g of feed and then the SFO-feed mixture was offered initially to
experimental animals in order to ensure complete consumption of the oil. Thereafter, the rest of
the feed was offered. To avoid cross-inoculation of PDFAUN lambs by FAUN lambs via direct
physical contact, individual floor pens and metabolism crates housing PDFAUN lambs were
spaced several meters away from those housing FAUN lambs. In addition, ruminal fluid
sampling of PDFAUN lambs was conducted prior to FAUN lambs in order to minimize the risk
of cross-inoculation. Ruminal contents (approximately 200 mL) were sampled at 1100 h on d 1
to d 3, d 6, d 9, d 12, d 15, d 18, and d 21 to d 26. Ruminal contents were squeezed through two
layers of cheesecloth. A 10-mL aliquot of ruminal fluid was mixed with an equal amount of 10%
formalin and transported to the laboratory where protozoa were enumerated immediately.
Page 71
51
Table 4.1 Ingredient and nutrient composition of experimental diets1
Item LOW HIGH
Ingredients, % of DM
Alfalfa meal 6.0 6.0
Barley (Dry rolled) 45.0 32.6
Canola meal 2.0 2.0
Corn gluten meal 0.5 4.0
Oat hulls 35.0 35.0
Soybean meal 1.5 10.4
Canola oil 1.0 1.0
Liquid molasses 2.0 2.0
Ground limestone 4.0 4.0
Salt, Co-I2 0.7 0.7
Salt white 1.3 1.3
Mineral vitamin supplement3 1.0 1.0
Chemical composition
DM, % 94.6 95.1
OM, % of DM 91.7 91.6
CP, % of DM 10.3 15.6
Neutral detergent fiber, % of DM 40.2 39.1
Acid detergent fiber, % of DM 20.2 19.2
Ether extract, % of DM 3.6 3.8
Ruminally-degradable protein4, % of CP 63.6 60.6
Metabolizable energy4, MCal/kg DM 1.8 1.8
1LOW = 10% CP, HIGH = 15% CP (DM basis).
2Salt, cobalt and iodine mix: Co, 100 mg/kg: and I, 150 mg/kg.
3Provided per kg of DM: CuO, 3.3 mg; ZnO, 22 mg; MnO, 18.5 mg; vitamin A, 1,495 IU;
vitamin D, 125.5 IU; vitamin E, 22 IU; and sodium selenite, 0.1 mg.
4Calculated according to NRC (1985) guidelines.
Page 72
52
Ruminal protozoa were enumerated microscopically (Ogimoto and Imai, 1981) using a
Neubauer improved Bright Line Hematocytometer (Hausser Scientific, Horsham, PA). Each
ruminal fluid sample was counted twice and if the average of the duplicates differed by more
than 10%, counts were repeated. In addition to total protozoal counts, protozoa were also
differentiated into different genera as Entodinium spp., Holotrichs, and cellulolytic protozoa
(Ogimoto and Imai, 1981). Partially-defaunated lambs were refaunated at the start of an
experimental period by a 3-d administration of approximately 300 mL of sampled ruminal
contents that were obtained from 2 faunated spare lambs that were fed equal proportions of the 2
experimental diets.
4.3.4 Sample Collection
Experimental lambs were moved from individual floor pens into individual metabolism
crates on d 19 of each experimental period to allow acclimation before the initiation of data
collection on d 22. During the 6-d data collection period, individual lamb feed intake was
recorded daily. Samples of experimental diets and orts were collected daily, stored at -20°C, and
composited per lamb for each experimental period prior to chemical analysis. On d 21 of each
experimental period, lambs were fitted with temporary vinyl catheters (0.86 mm I.D. x 1.32 mm
O.D.; Scientific Commodities Inc., Lake Havasu City, Arizona) in the right and left jugular veins
to allow for simultaneous isotope infusion and blood sampling. Urea transfer to the GIT and
whole-body N balance were determined between d 22 and 26 as described by Lobley et al.
(2000). Briefly, background samples of urine and feces were collected on d 21 to measure the
15N natural abundance. Starting on d 22 of each experimental period, double-labeled urea
([15
N15
N]-urea, 99 atom % 15
N; Cambridge Isotope Laboratories, Andover, MA) prepared in 0.15
M sterile saline was infused continuously into a jugular vein using a peristalitic pump (Model 60
RPM/7524-10, Masterflex L/S Microprocessor Pump Drive, Vernon Hills, IL) for 96 h (d 22 to d
26). Daily dosage rates of [15
N15
N]-urea ranged from 332 to 744 mg per lamb depending on N
intake, such that the predicted plateau enrichment of [15
N15
N]-urea in urine was 0.15 atom
percent excess above the background. Total feces and urine were collected daily between d 22
and d 26 before the 0900 h feeding to determine daily outputs. Collection, processing, and
sampling of feces and urine for N, fecal 15
N enrichment, urinary enrichment of [15
N15
N]-,
Page 73
53
[14
N15
N]- and [14
N14
N]-urea, and urinary PD analysis was as previously described (Kiran and
Mutsvangwa, 2007).
On d 26, ruminal contents (approximately 200 mL) were sampled at 0900, 1100, 1300,
1500 and 1700 h and squeezed through two layers of cheesecloth. Ruminal pH was then
immediately determined using a Model 265A portable pH meter (Orion Research Inc., Beverly,
MA). A 10-mL aliquot of ruminal fluid was preserved with 2 mL of metaphosphoric acid (25%
wt/vol) and a second 10-mL aliquot of ruminal fluid was preserved with 2 mL of 1% sulfuric
acid and stored at -20°C for later analyses. At the same time points corresponding to ruminal
fluid sampling, blood samples were drawn from a jugular vein catheter into vacutainers
containing heparin. Blood samples were centrifuged at 1,500 x g for 15 minutes at 4°C and the
plasma obtained was stored at -20°C for later analysis. On d 27, ruminal epithelial tissue biopsies
were taken at 2 h after the morning feeding. Briefly, whole ruminal contents were evacuated
using suction vacuum into a large container which was placed in warm (approximately 40oC)
water. Approximately 6 mm of ruminal mucosal tissue with papillae was clipped carefully from
the ventral sac of the rumen using a sterile clipper, immediately snap frozen in liquid N and
stored at -80°C. The biopsy procedure for all the 4 lambs was completed within 1 h in order to
minimize possible variations with time due to circadian effects. Ruminal contents were returned
to respective lambs.
4.3.5 Sample Analyses
At the end of the trial, frozen samples of experimental diets, orts and feces were thawed
overnight at room temperature and analyzed for DM by drying in an oven at 60°C for 48 h
(AOAC, 1995; method 930.15). Dried diets, orts and feces were then ground through a 1-mm
screen using a Christy-Norris mill (Christy and Norris Ltd., Chelmsford, England). Ground diets,
orts and fecal samples were pooled per lamb and analyzed for OM by ashing at 600°C for at least
8 h (AOAC 1995; method 942.05), CP using the macro-Kjeldahl procedure (AOAC, 1995;
method 2001.11), ether extract (AOAC, 1995; method 920.39), and ADF and NDF (Van Soest et
al., 1991). Amylase and sodium sulfite were used for neutral detergent fiber determination.
Ruminal fluid samples that were preserved with metaphosphoric acid were thawed at
room temperature, centrifuged at 18,000 x g for 15 min, and filtered through a 0.45-µm
Page 74
54
membrane. A sub-sample (0.1 mL) of the supernatant was transferred into a 1.7 mL micro
centrifuge tube, and 0.5 mL of 1mM trimethyl acetic acid was then added to each tube as an
internal standard. The volume was made up to 1.5 mL with acetonitrile, contents were then
centrifuged at 18,000 x g for 5 min and the supernatant was quantitatively transferred to clean,
dry vials. Volatile fatty acids (VFA) were separated and quantified by GC (Agilent 6890,
Mississauga, ON) as described by Erwin et al. (1961). Ruminal fluid samples that were
preserved with sulphuric acid were also thawed, centrifuged for 10 min at 18,000 x g to obtain a
clear supernatant, and analyzed for NH3-N using a phenol-hypochlorite assay (Broderick and
Kang, 1980). Total N in pooled urine was determined using the macro-Kjeldahl procedure
(AOAC, 1990). Daily urine samples (2 mL) that were diluted with distilled water (8 mL) were
pooled per lamb proportionally to daily urine output and analyzed for allantoin, and xanthine
plus hypoxanthine (Chen and Gomes, 1992), and for uric acid by a quantitative enzymatic
colorimetric method using a commercial assay kit (Stanbio Uric Acid Liquicolor Kit, Procedure
No. 1045; Stanbio Laboratories, Boerne, TX). Total PD excretion per day was calculated as
allantoin + uric acid + xanthine plus hypoxanthine. Microbial NAN supply was calculated based
on total PD excretion in urine (Chen and Gomes, 1992), using BW measurements obtained on d
19. Plasma urea-N (PUN) and UUN were determined by the diacetyl monoxime method (Marsh
et al., 1957) using a commercial kit (Stanbio Urea-N Kit, Procedure No. 0580; Stanbio
Laboratories).
To determine the proportions of [15
N15
N]-, [14
N15
N]- and [14
N14
N]-urea in pooled urine
and background urine samples, urinary urea was isolated by applying urine containing 1.5 mg of
urea-N through pre-packed cation exchange resin columns (AG-50W-×8 Resin, 100-200 mesh,
H+ form; Biorad, Richmond, CA) as described by Archibeque et al. (2001). Previous studies
have determined that 1.5 mg urea-N was suitable to ensure sufficient amounts of N2 gas for
analysis, yet minimizing the occurrence of non-monomolecular degradation of urea (Archibeque
et al., 2001; Marini and Van Amburgh, 2003). The procedure to isolate UUN was described
previously (Kiran and Mutsvangwa, 2007). The urea samples were then freeze-dried and the
proportions of [15
N15
N]-, [14
N15
N]-, and [14
N14
N]-urea in urinary urea-N were analyzed by
isotope ratio-mass spectrometry (Lobley et al., 2000) at the N-15 Analysis Laboratory,
University of Illinois at Urbana-Champaign. Under the conditions of this assay, [14
N14
N]-,
[14
N15
N]-, and [15
N15
N]-urea molecules should yield ions with mass/charge (m/z) values of 28,
Page 75
55
29, and 30, respectively. To account for non-monomolecular reactions, standards which were
prepared from [15
N15
N]-urea (99.8 atom % 15
N) and [14
N14
N]-urea (natural abundance urea;
0.364 atoms % 15
N) were also analyzed and the necessary corrections for [14
N15
N]-urea that is
produced by non-monomolecular reactions were then made (Lobley et al., 2000). Fecal samples
were analyzed for total 15
N enrichment by combustion to N2 gas in an elemental analyzer and
continuous flow isotope ratio-mass spectrometry (Lobley et al., 2000).
4.3.6 Urea Transporter-B Gene Expression Analysis
Ruminal epithelial tissue samples were pulverized with a mortar and pestle under liquid
N. Total RNA was extracted from 20 to 30 mg tissue sample using an RNAeasy Mini Kit
(Qiagen, Mississauga, Ontario, Canada), followed by digestion with RNase-free DNase
(Qiagen). Amount of RNA was quantified with PicoGreen (Molecular Probes, Eugene, OR)
using a fluorometer (Fluoroscan Ascent FL, Thermo Labsystems, Waltham, MA) and 1 µg of
RNA was used to generate first-strand cDNA using High-Capacity cDNA Reverse Transcription
kit (Applied Biosystems). The cDNA obtained was stored at -20oC until analyzed. Gene
transcript abundance was quantified using qPCR (iCycler iQ Real-Time PCR detection system,
BioRad) using SYBR Green fluorescence detection. The primers used for UT-B and ovine
glyceraldehyde 3-phosphate dehydrogenase (ovine-GAPDH; NCBI Accession no.: BC102589)
were previously reported (Stewart et al., 2005; Ludden et al., 2009). Ovine-GAPDH was used as
an internal reference to normalize UT-B mRNA expression. Briefly, the PCR primers were UT-
B (forward, 5′ /ggacctgcctgtcttcactc/ 3′; reverse, 5′ /gatcaaggtgcttgggaaaa/ 3′) and ovine GAPDH
(forward, 5′ /gattgtcagcaatgcctcct/ 3′; reverse, 5′ /ggtcataagtccctccacga/ 3′) with amplicon size of
97 and 94 bp, respectively. Amplification conditions for ovine GAPDH and UT-B included a
pre-dwell for 3 min at 95oC and 35 cycles of denaturing for 30 sec at 95
oC, and annealing for 30
sec at 58oC. The qPCR reaction mixture used for each gene consisted of 12.5 μL of Platinum
SYBR Green qPCR SuperMix-UDG (Invitrogen, Burlington, Ontario, Canada), 0.5 μL of each
primer (25 μM), and 1.0 μL of template cDNA, made up to 25 μL. The amplification efficiency
was 100.1%. To confirm the quality of amplification, melting curve analysis was done after
qPCR amplification of incubation products for 5 sec at each step with increase in temperature by
0.5oC from 65
oC to 95
oC in each cycle. The results are presented as target gene transcript
abundance normalized to GAPDH transcript abundance. Expression of GAPDH mRNA in equal
Page 76
56
amounts of total RNA indicated that GAPDH in rumen epithelial tissue was stable and
unaffected by the experimental conditions that were employed.
4.3.7 Calculation of Urea-N Kinetics and Statistical Analysis
Urea-N kinetics was calculated according to the model of Lobley et al. (2000), using
urinary 15
N enrichment of [15
N15
N]- and [14
N15
N]-urea and total 15
N excretion in feces. All data
were analyzed using ANOVA as a 4 x 4 Latin square using the Proc Mixed procedure of SAS
(2004) with period and animal as the random effects. The model used included the following
independent variables: animal, period, ruminal protozoal status (PDFAUN vs. FAUN), level of
dietary CP (LOW vs. HIGH), and the ruminal protozoal status x level of dietary CP interaction.
Because N intake differed due to protozoal status (Table 4.4), and because of the positive
correlation between N intake and hepatic output of urea-N (Marini et al., 2004; Wickersham et
al., 2009), data on urea-N recycling kinetics were initially adjusted by covariance analysis using
N intake within sheep and collection period as a covariate (Huntington et al., 2009). For the
major dependent variables quantifying urea-N recycling kinetics, statistical trends for adjusted
(data not shown) and unadjusted data were similar; hence unadjusted data are presented in Table
4.5. Data on ruminal pH, and ruminal concentrations of VFA and NH3-N were analyzed
accounting for repeated measures as recommended by Wang and Goonewardene (2004). Data for
these repeated measurements were analyzed by including in the model a REPEATED model
statement, as well as terms for time (hour or day), and interactions (level of dietary CP x
time,
ruminal protozoal status x time, and time x level of dietary CP x ruminal protozoal status) in the
model described previously. For protozoal counts, statistical analysis was performed on log10
transformed data. When significant treatment effects were detected, means were compared using
the Tukey-Kramer multiple comparison test. Treatment differences were considered significant
when P ≤ 0.05 and tendencies are discussed when 0.05 < P ≤ 0.10.
4.4 Results and Discussion
4.4.1 Diet Characteristics
Experimental diets were formulated to have a similar chemical composition, except for
the CP content (Table 4.1). Experimental diets were originally formulated to contain 10 and 15%
Page 77
57
CP (DM basis) for the LOW and HIGH treatments, respectively, and chemical analysis showed
only marginal deviations (+0.3% and +0.6% units, respectively) in dietary CP content (Table
4.1). Dietary CP was manipulated by varying the inclusion rates of corn gluten meal and soybean
meal, such that both experimental diets contained the same protein ingredients (albeit, in varying
amounts) in order to ensure a similar AA profile.
4.4.2 Ruminal Protozoal Numbers and Fermentation Characteristics
The experimental protocol that was used for ruminal defaunation was based on previous
research (Ivan et al., 2001) which demonstrated that SFO fed at 6% of diet DM was a potent anti-
protozoal agent, decreasing ruminal protozoal counts by more than 80% within 6 d when
compared to a control diet. Several methods are available for eliminating protozoa from the
rumen, and they are mostly based on the use of chemicals (e.g., copper sulfate and calcium
peroxide) which have toxic effects on ruminal protozoa (Jouany, 1996). A major drawback of
using chemicals to eliminate ruminal protozoa is that they can be toxic to experimental animals
and they can also alter other aspects of the ruminal microbial ecosystem (Veira et al., 1983),
hence our decision to use SFO as a defaunating agent in the present experiment. Although
complete defaunation was not achieved in the present study, substantial reductions in ruminal
protozoal populations were achieved, coupled with positive responses in N utilization. Also,
partial defaunation can be beneficial as it has been associated with a greater flow of NAN to the
duodenum (Punia and Leibholz, 1987), improved feed:gain ratio in sheep (Ivan et al., 2004) and
increases in milk yield in dairy cows (Moate, 1989). Ruminal protozoa consist largely of
Entodinium spp., Holotrichs and cellulolytic protozoa (Ogimoto and Imai, 1981) and, in the
present study the distribution of these protozoa in faunated lambs was 94% Entodinium, 2 to 3%
Holotrichs, and 2 to 4% cellulolytic protozoa (Table 4.2). Feeding SFO resulted in substantial
reductions in total ruminal protozoal counts by d 6, with the maximum decrease achieved by d
22 and this was maintained throughout the measurement period (Appendix Tables I and II).
During the measurement period (d 22 to d 27), feeding sunflower oil decreased (P = 0.001) total
ruminal protozoal counts by, on average, 88%, with all protozoa virtually eliminated during that
period in lambs fed diet LOW (Table 4.2). In PDFAUN lambs fed diet HIGH, Entodinium spp.
comprised virtually all of the remaining protozoal population (Table 4.2).
Page 78
Table 4.2 Ruminal protozoal numbers and ruminal fermentation characteristics in partially-defaunated (PDFAUN) or faunated (FAUN)
growing lambs fed LOW or HIGH dietary crude protein levels1
LOW HIGH P value2
Item FAUN PDFAUN FAUN PDFAUN SEM Protozoa Protein Protozoa x Protein
Protozoa, x 105/ml
Entodinium spp. 11.2 - 16.2 3.8 0.40 0.001 0.001 0.32
Holotrichs 0.38 - 0.38 - 0.02 0.001 0.82 0.82
Cellulolytics3 0.29 0.09 0.74 0.13 0.04 0.001 0.02 0.02
Total 11.9 0.09 17.3 4.0 0.97 0.001 0.001 0.26
Ruminal pH 5.8 6.1 5.8 6.2 0.04 0.001 0.14 0.84
Ruminal NH3-N, mg/dL 9.6 5.8 14.9 11.6 0.37 0.001 0.001 0.57
Ruminal VFA, mM
Total 96.4 92.0 98.6 79.4 2.57 0.001 0.07 0.01
Acetate 60.3 52.7 59.9 45.1 1.31 0.001 0.09 0.02
Propionate 18.3 24.7 16.8 20.5 1.04 0.001 0.02 0.21
Butyrate 14.3 11.1 17.6 10.6 1.04 0.001 0.18 0.09
Isobutyrate 0.69 0.69 0.94 0.65 0.03 0.001 0.01 0.001
Valerate 1.5 1.4 1.6 1.1 0.13 0.02 0.44 0.16
Isovalerate 1.3 1.5 1.7 1.5 0.31 0.97 0.62 0.59
Acetate to propionate ratio 3.44 2.15 3.62 2.27 0.16 0.001 0.37 0.84
1LOW = 10% CP, HIGH = 15% CP (DM basis).
2Protozoa = PDFAUN vs. FAUN lambs; Protein = level of dietary CP (LOW vs. HIGH); Protozoa x Protein = interaction. PDFAUN
was achieved by addition of 6% (DM basis) linoleic acid-rich sunflower oil to the diet. 3Includes Polyplastron, Diplodinium and Enoplastron sp.
58
Page 79
59
This suggests that measurements (d 22 to 27) were taken when ruminal protozoal
populations and ruminal function had recovered. Protozoal populations remained relatively
stable after pre-defaunation levels had been restored or attained (Appendix Table III). Feeding
diet HIGH increased (P = 0.001) ruminal protozoal counts (Table 4.2), likely reflecting a greater
availability of substrates (e.g., preformed AA) for protozoal growth. As expected, ruminal
defaunation was accompanied by a decrease (P = 0.001) in ruminal NH3-N concentrations (Table
4.2). Numerous published studies have also reported decreases in ruminal NH3-N concentrations
as a result of partial (Ikwuegbu and Sutton, 1982; Ivan et al., 2001) or complete (Newbold et al.,
1986; Koenig et al., 2000) defaunation. This decrease in ruminal NH3-N concentrations is mainly
attributed to decreased intra-ruminal bacterial N recycling, coupled with increased MP synthesis
due to a larger bacterial population (Koenig et al., 2000), and decreased ruminal proteolysis of
dietary nitrogenous compounds (Wallace et al., 1987). Ruminal pH in PDFAUN lambs was
higher (P = 0.001) compared to FAUN lambs (Table 4.2), which is in agreement with other
research (Ivan et al., 2001; 2004). Ruminal protozoa engulf and store starch, thereby preventing
or slowing down starch fermentation by bacteria. As a result, the presence of protozoa is
generally associated with a higher and more stable ruminal pH (Veira et al., 1983), which is in
contrast to our observations. It is noteworthy that partial defaunation by the addition of SFO
resulted in a decrease in total ruminal VFA concentrations, primarily due to a decrease in acetate
and butyrate concentrations (Table 4.2). Ruminal concentration of propionate was higher (P =
0.001), whereas that of butyrate and valerate was lower (P = 0.001) in PDFAUN compared to
FAUN lambs (Table 4.2), supporting previous findings (Koenig et al., 2000). Ruminal
concentration of isobutyrate was higher (interaction, P = 0.001) and that of butyrate was
numerically higher (interaction, P = 0.09) in FAUN lambs fed HIGH as compared to those fed
LOW. Similarly, higher ruminal concentrations of butyrate and iso-butyrate have been reported
in dairy cows fed high dietary CP (Ipharraguerre et al, 2005), possibly reflecting oxidative
deamination and decarboxylation of AA from true protein originating from a higher dietary CP
intake. This decrease in total VFA concentrations could be responsible for the higher ruminal pH
that was observed in PDFAUN lambs. Ruminal fiber digestion was not measured in this study,
but it is plausible that anti-microbial effects of added oil on cellulolytic bacteria (Pantoja et al.,
1994) could have inhibited fiber digestion, thus decreasing VFA production. Also, some species
of protozoa appear to have cellulolytic activity (Jouany et al., 1988) and their absence in
Page 80
60
PDFAUN lambs could also have contributed to the lower VFA concentrations. However,
because SFO was added only to PDFAUN, it is difficult to ascertain that alterations in ruminal
function (e.g., changes in ruminal VFA concentrations) are due to the partial elimination of
protozoa and not due to anti-bacterial properties of SFO.
4.4.3 Dry Matter Intake and Total Tract Digestibilities
Partially-defaunated lambs consumed 125 to 591 g/d less DM compared to FAUN lambs
(P = 0.03; Table 4.3), supporting previous research that reported that feeding linoleic acid-rich
oil sources was associated with a decrease in DM intake (Ivan et al., 2004). A preponderance of
the available research indicates that defaunation has little effect on DM intake (Eugène et al.,
2004). Although ruminal fiber digestion was not mesured, the decrease in DM intake that was
observed in protozoa-free animals in the present study can be partly attributable to perturbations
of fiber digestion in the rumen as unsaturated oils have been shown to inhibit ruminal cellulolytic
bacteria (Pantoja et al., 1994). Total tract digestibilities of DM, OM, ADF, and NDF were
unaffected by ruminal defaunation and dietary CP level (Table 4.3). This lack of effect of partial
defaunation on total tract fiber digestion is somewhat surprising. This is particularly so
considering the decrease in ruminal total VFA and acetate concentrations (and, presumably, their
ruminal production) that was observed in PDFAUN lambs, which would imply reduced ruminal
fiber digestion. Perusal of the literature indicates that the effects of defaunation on fiber digestion
in the rumen and total tract are inconsistent. A decrease in ruminal fiber digestion has been
observed in some studies (Oldick and Firkins, 2000; Koenig et al., 2000), but not others (Hristov
et al., 2004). For total tract digestion, Koenig et al. (2000) observed a reduction in fiber digestion
due to defaunation. More recently, Ivan et al. (2004) observed a reduction in total tract fiber
digestion in defaunated lambs fed high forage diets, whereas total tract fiber digestion was
increased in defaunated lambs fed high concentrate diets. It is plausible that the lack of effect of
partial defaunation on total tract fiber digestion in our study could be due to a higher hindgut
fermentation of fiber in PDFAUN lambs, which would compensate for any reduction in ruminal
fiber digestion that might have occurred; however, this is uncertain as fiber digestion in the
rumen or hindgut was not measured. Such variation in the impact of defaunation on nutrient
digestion likely is attributable to dietary differences, and the associated changes in ruminal
microbial populations and patterns of ruminal fermentation (Koenig et al., 2000).
Page 81
Table 4.3. Dry matter (DM), energy and organic matter (OM) intakes, and total tract nutrient digestibility in partially-defaunated
(PDFAUN) or faunated (FAUN) growing lambs fed LOW or HIGH dietary crude protein levels1
LOW HIGH P value2
Item FAUN PDFAUN FAUN PDFAUN SEM Protozoa Protein Protozoa x Protein
DM intake, g/d 2,244 1,653 1,807 1,682 147.2 0.03 0.19 0.14
Energy intake, MCal/kg DM3
Diet 4.04 2.96 3.25 3.03 0.27 0.03 0.19 0.14
Sunflower oil 0.0 0.87 0.0 0.89 0.06 0.001 0.90 0.90
Total 4.04 3.84 3.25 3.91 0.32 0.47 0.27 0.20
OM intake, g/d 2,056 1,515 1,653 1,539 133.5 0.03 0.18 0.14
Nutrient digestibility, %
DM 59.9 59.2 60.2 59.2 3.1 0.79 0.96 0.97
OM 63.0 62.5 62.8 62.2 2.9 0.85 0.95 0.99
N 72.3 77.5 81.7 83.2 2.2 0.15 0.005 0.41
ADF 25.3 25.8 23.7 24.8 4.1 0.84 0.76 0.95
NDF 27.6 31.5 26.9 27.2 4.1 0.62 0.55 0.67
1LOW = 10% CP, HIGH = 15% CP (DM basis).
2Protozoa = PDFAUN vs. FAUN lambs; Protein = level of dietary CP (LOW vs. HIGH); Protozoa x Protein = interaction. PDFAUN
was achieved by addition of 6% (DM basis) linoleic acid-rich sunflower oil to the diet.
3Dietary energy intake was calculated as 1.8 * DM intake, where 1.8 is energy content (MCal/kg DM) of the diets calculated based on
NRC (1985) guidelines. Energy intake from sunflower oil was calculated as (8.8 * ((DM intake in kg)* 60)) / 1000, where 8.8 is
energy content (MCal/kg) of sunflower oil and 60 is amount (g) of oil fed to PDFAUN lambs per kg of DM intake.
61
Page 82
62
4.4.4 Nitrogen Balance
Faunated lambs consumed 3.5 to 9.2 g/d more N compared to PDFAUN lambs (P = 0.04;
Table 4.4), reflecting observed differences in DM intake. Fecal N excretion, expressed in
absolute amounts, was unaffected (P = 0.35) by defaunation; however, when expressed as a
proportion of total N excretion, fecal N excretion was greater (P = 001) in PDFAUN compared
to FAUN lambs (Table 4.4). There is general agreement in the literature that defaunation
increases fecal N losses (Koenig et al., 2000; Jouany, 1996). This might reflect a shift in the
digestion of cell-wall carbohydrates to the hindgut, leading to greater bacterial protein synthesis
(Ushida et al., 1991). Because there is no hindgut mechanism for the digestion and absorption of
the resultant bacterial protein, it is subsequently excreted in the feces. Conversely, urinary N
excretion, when expressed in absolute amounts (P = 0.001) or as a proportion of N intake (P =
0.001), was decreased by defaunation (Table 4.4). Ruminal absorption of NH3-N into the portal
blood is positively correlated to the ruminal NH3-N concentration (Leng and Nolan, 1982).
As ruminal NH3-N concentration was lower in PDFAUN compared to FAUN lambs, we
can surmise that the concentration-dependent absorption of NH3-N from the rumen was
decreased in the PDFAUN lambs. Most of the NH3-N taken up by the portal vein would be
detoxified by conversion to urea in the liver, a decreased absorption of NH3-N would result in
decreased total hepatic ureagenesis, and thus resulted in lower (P = 0.001) urinary urea-N
excretion in PDFAUN compared to FAUN lambs. In addition, the decrease in urinary N
excretion in PDFAUN lambs could also result from a greater proportion of urea-N output being
recycled to the GIT and its increased sequestration for microbial protein synthesis in the rumen
and/or hindgut. In agreement with our results, other workers (Punia and Leibhloz, 1987;
Ikwuegbu and Sutton, 1982) have also observed decreases in urinary N excretion as a result of
defaunation. Total N losses were 5.2 to 9.0 g/d lower (P = 0.004) in PDFAUN compared to
FAUN lambs; as a proportion of N intake, PDFAUN lambs excreted 5.4 to 6.8% units less (P =
0.06) N compared to FAUN lambs. However, N retention (g/d) was unaffected (P = 0.63) by
protozoal status, even if PDFAUN lambs consumed 8 to 25% less N compared to FAUN lambs.
Daily CP requirements for lambs weighing 40 to 50 kg range from 234 to 240 g (NRC, 1985).
Average CP (N x 6.25) intake in PDFAUN lambs was 216 g/d, which was deficient, yet their N
retention (when expressed as a proportion of N intake) was 4.7 to 6.8 percentage units higher (P
= 0.05) than in FAUN lambs (Table 4.4).
Page 83
Table 4.4. Nitrogen (N) intake, N balance, and plasma-urea nitrogen in partially-defaunated (PDFAUN) or faunated (FAUN) growing
lambs fed LOW or HIGH dietary crude protein levels1
LOW HIGH P value2
Item FAUN PDFAUN FAUN PDFAUN SEM Protozoa Protein Protozoa x Protein
N intake, g/d 36.6 27.4 45.3 41.8 2.8 0.04 0.001 0.33
Fecal N excretion
g/d 8.9 8.7 9.1 10.9 0.84 0.35 0.19 0.28
% of total N excretion 31.1 44.2 25.4 36.0 2.2 0.001 0.007 0.56
Urine N excretion
Total N, g/d 19.9 10.9 26.6 19.6 1.6 0.001 0.001 0.58
Total N, % of total N excretion 68.9 55.8 74.6 63.9 2.2 0.001 0.007 0.56
Urea-N, g/d 10.5 6.2 20.8 14.0 0.88 0.001 0.001 0.18
Total N excretion
g/d 28.7 19.7 35.7 30.5 2.1 0.004 0.001 0.37
% of N intake 78.6 71.8 78.6 73.2 2.7 0.06 0.71 0.71
N retention, g/d
g/d 7.8 7.7 9.6 11.3 1.6 0.63 0.12 0.58
% of N intake 21.4 28.2 21.4 26.1 2.7 0.05 0.71 0.71
Plasma urea-N, mg/dL 12.1 10.1 18.3 17.0 1.8 0.39 0.002 0.98
1LOW = 10% CP, HIGH = 15% CP (DM basis).
2Protozoa = PDFAUN vs. FAUN lambs; Protein = level of dietary CP (LOW vs. HIGH); Protozoa x Protein = interaction. PDFAUN
was achieved by addition of 6% (DM basis) linoleic acid-rich sunflower oil to the diet.
63
Page 84
64
Our data suggests a greater efficiency of N utilization in protozoa-free lambs, which can
be partly attributed to a higher proportion of urea-N production being recycled to the GIT. Both
total energy intake and the source of energy can affect the efficiency of post-absorptive N use.
Assuming that the energy content of SFO is 8.8 Mcal/kg, dietary inclusion of 6% SFO
contributed 0.87 to 0.89 Mcal to total energy intake of PDFAUN lambs. However, because
PDFAUN lambs consumed less feed compared to FAUN lambs, total energy intake was
unaffected by protozoal status. It is unlikely, therefore, that results are confounded by total
energy intake. While total energy intakes did not differ between FAUN and PDFAUN lambs, it
is important to note that energy sources in the diets were different. In growing steers receiving
supplemental fat, the efficiency of N use (i.e., greater N retention and lower N excretion) was
improved when compared to unsupplemented controls (Schroeder et al., 2006); however, in
contrast to the present study, total energy intakes differed in that previous study. Supplemental
energy intake as fat could provide a potential glucose precursor (glycerol) that could spare AA
from being used for gluconeogenesis, thus making more AA available for protein accretion and
improving N use. In the present study, N use was more efficient in lambs fed SFO; however, this
cannot be definitively attributed to an effect of SFO or the absence of protozoa. Other workers
(Bird et al., 1994) have reported increases in N retention due to defaunation.
The level of dietary CP also altered N balance (Table 4.4). As expected, lambs fed HIGH
consumed 8.7 to 14.4 g/d more N compared to those fed LOW (P = 0.04), reflecting the higher
dietary CP in diet HIGH as DM intake was unaltered. However, most of the additional N intake
was excreted in urine as lambs fed HIGH excreted 6.7 to 8.7 g/d more urinary N compared to
those fed LOW (P = 0.001). Consequently, N retention expressed in absolute amounts (P = 0.12)
or as a proportion of N intake (P = 0.71), was unaffected by dietary CP level (Table 4.4). These
observations are consistent with published literature (Kiran and Mutsvangwa, 2007; Marini et al.,
2004). Surprisingly, PUN concentration was unaffected (P = 0.39) by protozoal status, although
PUN levels were 8 to 20% numerically greater in FAUN compared to PDFAUN lambs (Table
4.4). As expected, PUN concentration was greater (P = 0.002) in lambs fed HIGH compared to
those fed LOW, reflecting the higher N intake and higher rates of ruminal NH3-N absorption in
lambs fed HIGH.
Page 85
65
4.4.5 Urea-N Kinetics, Expression of Urea Transporter-B, and Microbial NAN Supply
Across treatments, urinary [15
N15
N]-urea enrichment reached a plateau within 24 to 48 h
of isotopic infusion, whereas plateau enrichment of [14
N15
N]-urea in urine was not attained until
between 48 and 72 h of isotopic infusion (Figure 4.1). This time course in the urinary
enrichments of [14
N15
N]- and [15
N15
N]-urea is consistent with previous research using sheep
(Lobley et al., 2000; Sunny et al., 2007). Fecal 15
N enrichments increased daily over the 4-d
isotopic infusion without attaining a definite plateau (Figure 4.2); therefore, for calculations of
urea-N kinetics, urinary [14
N15
N]- and [15
N15
N]-urea and fecal 15
N enrichments over the final 72
to 96 h of infusion were used, similar to previous research (Lobley et al., 2000; Sunny et al.,
2007).
The primary objective of the present study was to determine how interactions between
ruminal defaunation and dietary CP level might potentially alter urea-N transfer to the GIT and
the utilization of this recycled urea-N in ruminants. Endogenous production of urea-N (UER;
26.1 vs. 34.6 g/d) was lower (P = 0.001) in PDFAUN compared to FAUN lambs (Table 4.5),
possibly reflecting differences in N intake as has been demonstrated by others (Marini et al.,
2004; Wickersham et al., 2009). It is noteworthy that adjusting urea-N kinetics data using
covariance analysis for differences in N intake that were observed between FAUN and PDFAUN
lambs resulted in similar statistical trends (Appendix Table IV). This indicates that data on the
effects of partial defaunation on urea-N recycling kinetics were likely not confounded by
differences in N intake. Across treatments, UER ranged from 0.75 to 0.84 of N intake, which
compares favorably with UER:N intake ratios obtained in sheep (0.77 to 0.95, Lobley et al.,
2000; 0.73 to 0.99, Sunny et al., 2007). The quantity of hepatic urea-N output that was
transferred to the GIT (i.e., GER), when expressed in absolute amounts (16.0 vs. 18.9 g/d),
tended (P = 0.06) to be lower in PDFAUN compared to FAUN lambs; however, and most
interestingly, when expressed as a proportion of UER (0.623 vs. 0.559), GER was greater in
PDFAUN compared to FAUN lambs. Ruminal NH3-N concentration has been reported to be
negatively correlated with urea-N transfer into the rumen (Kennedy and Milligan, 1980),
possibly because high ruminal NH3-N concentration decreases the ruminal epithelium‟s
permeability to urea (Egan et al., 1986), and ruminal urease activity (Cheng and Wallace, 1979).
Page 86
66
Figure 4.1 Enrichments (APE, atom percent excess) of [15
N15
N]-urea (A) and [14
N15
N]-urea (B)
in urine during 4-d intra-jugular infusions of [15
N15
N]-urea (infusions were initiated at sampling
interval 0 h). Treatments were: faunated + low CP (FAUN-LOW); faunated + high CP (FAUN-
HIGH); partially-defaunated + low CP (PDFAUN-LOW); and partially-defaunated + high CP
(PDFAUN-HIGH). PDFAUN was achieved by the addition of 6% (DM basis) linoleic acid-rich
sunflower to the diet. For [15
N15
N]-urea enrichments, no differences were detected between
sampling intervals 0-24, 24-48, 48-72, and 72-96 h (P > 0.10). For [14
N15
N]-urea enrichments,
no differences were detected between sampling intervals 24-48, 48-72, and 72-96 h (P > 0.10).
Each line represents means ± SEM for 4 lambs.
Page 87
67
Figure 4.2 Enrichments (APE, atom percent excess) of fecal 15
N during 4-d intra-jugular
infusions of [15
N15
N]-urea (infusions were initiated at sampling interval 0 h). Treatments were:
faunated + low CP (FAUN-LOW); faunated + high CP (FAUN-HIGH); partially-defaunated +
low CP (PDFAUN-LOW); and partially-defaunated + high CP (PDFAUN-HIGH). PDFAUN
was achieved by the addition of 6% (DM basis) linoleic acid-rich sunflower to the diet.
Differences were detected in fecal 15
N enrichments between sampling intervals 0-24, 24-48, 48-
72, and 72-96 h (P = 0.001), indicating that fecal 15
N enrichment did not reach a definite plateau.
Each line represents means ± SEM for 4 lambs.
Page 88
Table 4.5 Urea-N recycling kinetics and urea transporter-B (UT-B) mRNA abundance in ruminal epithelial tissue in partially-defaunated
(PDFAUN) or faunated (FAUN) growing lambs fed LOW or HIGH dietary crude protein levels1
LOW HIGH P value2
Item FAUN PDFAUN FAUN PDFAUN SEM Protozoa Protein Protozoa x Protein
Urea-N kinetics, g/d
Production, UER 27.0 18.0 42.3 34.1 1.96 0.001 0.001 0.85
Entry to GIT, GER 16.5 11.9 21.4 20.1 1.40 0.06 0.001 0.27
Return to ornithine cycle, ROC 7.4 4.7 12.9 11.2 0.96 0.04 0.001 0.63
Loss to feces, UFE 0.95 0.73 0.77 0.72 0.18 0.48 0.61 0.64
Loss to urine, UUE 10.5 6.2 20.8 14.0 0.88 0.001 0.001 0.18
Re-use for anabolism, UUA 8.1 6.5 7.7 8.2 0.56 0.29 0.27 0.08
Fractional urea-N transfers
UER to urine 0.388 0.342 0.494 0.413 0.016 0.002 0.001 0.31
UER to GIT 0.612 0.658 0.506 0.587 0.016 0.002 0.001 0.31
GER to ROC 0.446 0.389 0.603 0.557 0.026 0.07 0.001 0.85
GER to feces 0.057 0.056 0.035 0.036 0.009 0.97 0.04 0.91
GER to UUA 0.497 0.554 0.362 0.406 0.028 0.09 0.001 0.83
UT-B mRNA abundance, per copy of
GAPDH
3.09 3.51 2.27 3.19 0.43 0.15 0.21 0.57
1LOW = 10% CP, HIGH = 15% CP (DM basis).
2Protozoa = PDFAUN vs. FAUN lambs; Protein = level of dietary CP (LOW vs. HIGH); Protozoa x Protein = interaction. PDFAUN
was achieved by addition of 6% (DM basis) linoleic acid-rich sunflower oil to the diet.
68
Page 89
69
In the present study, partial defaunation resulted in a lower ruminal NH3-N concentration,
which would facilitate the transfer of a greater proportion of UER to the GIT in PDFAUN
compared to FAUN lambs. I am not aware of any previous research in which urea-N recycling to
the GIT has been reported in defaunated compared to faunated ruminants. These data indicate
that partial elimination of protozoa results in a greater proportion of endogenous urea-N output
being recycled to the GIT. Endogenous urea-N can diffuse through all compartments of the GIT
(Lapierre and Lobley, 2001) and, although the [15
N15
N]-urea infusion technique that was used in
the present study cannot distinguish between urea-N transfer to the fore-stomach and post-
stomach compartments of the GIT, it is generally accepted that a significant proportion of the
GER is transferred to the rumen (as opposed to post-ruminal compartments). Urea-N that is
recycled to the rumen would buffer the rumen from the lower NH3-N concentrations prevailing
in PDFAUN lambs, thus providing additional N that can be used for MP synthesis. Overall, this
could potentially increase post-ruminal metabolizable protein supply and, consequently, improve
N retention as has been consistently observed in defaunated compared to faunated ruminants.
The absolute amount of GER that was used for anabolic purposes (UUA; primarily MP
synthesis) was unaffected (P = 0.56) by defaunation. However, anabolic use of recycled urea-N
expressed as a proportion of GER (i.e., GER to UUA; 0.480 vs. 0.429) tended to be greater (P =
0.09) in PDFAUN compared to FAUN lambs. Although we did not measure the direct
incorporation of recycled 15
N into microbial protein, these data suggest a greater microbial
incorporation of recycled urea-N into microbial protein, as most of the anabolic use of recycled
urea-N (i.e., UUA) is predominantly as sequestration of liberated NH3-N into microbial protein
(Lobley et al., 2000). As discussed elsewhere in this paper, microbial NAN supply as assessed by
urinary PD excretion, was also greater (P = 0.001) in PDFAUN compared to FAUN lambs
(Table 4.6), thus further suggesting a greater anabolic use of recycled urea-N via incorporation
into microbial protein. Concomitant with the tendency for a greater utilization of recycled urea-N
for anabolic purposes, urea-N that was returned to the ornithine cycle (i.e., ROC), when
expressed in absolute amounts was lower (8.0 vs. 10.2 g/d; P = 0.04), or when expressed as a
proportion of GER tended to be lower (0.473 vs. 0.525; P = 0.07) in PDFAUN compared to
FAUN lambs, suggesting improved N efficiency.
Page 90
70
Urinary urea-N excretion (UUE), expressed in absolute amounts (10.1 vs. 15.7 g/d; P <
0.001) or as a proportion of UER (i.e., fractional transfer of UER to urine; 0.378 vs. 0.441; P <
0.001) was lower in PDFAUN lambs compared to FAUN lambs. In ruminants, a major portion of
the urea-N released from the liver originates from NH3-N absorbed from the portal drained
viscera. Because ruminal NH3-N concentration was lower in PDFAUN compared to FAUN
lambs, it is likely that ruminal absorption of NH3-N was decreased in PDFAUN lambs as this is a
concentration-dependent process. That would result in decreased UUE. Urea-N that was
eliminated in feces (i.e., UFE) was unaffected (P = 0.48) by defaunation (Table 4.5).
Endogenous production of urea-N (38.2 vs. 22.5 g/d), GER (20.8 vs. 14.2 g/d), and UUE
(17.4 vs. 8.3 g/d) were greater (P = 0.001) in lambs fed HIGH compared to those fed LOW diet.
However, when expressed as a proportion of UER, the GER and its anabolic use (primarily
microbial protein synthesis) were greater (P = 0.001) in lambs fed LOW compared to those fed
HIGH (Table 4.5). Increases in UER, GER and UUE as dietary CP concentration increases are
likely associated with the higher N intakes that were imposed. Greater levels of UER, GER and
UUE with increasing N intakes have been reported in ruminants (Archibeque et al., 2001; Marini
et al., 2003). Across dietary CP levels, UER was 0.70 to 0.87 of N intake, which is in agreement
with previous research (Lobley et al., 2000). Clearly, these ratios indicate the magnitude of the
transit of N into the urea pool and the perpetual dependence of ruminants on urea-N recycling to
the GIT in order to maintain a positive N balance.
The presence of carrier-mediated, facilitative urea transporter (UT) proteins in ruminant
GIT tissues was originally demonstrated by Ritzhaupt et al. (1997; 1998), and subsequently
confirmed by other workers (Marini and Van Amburgh, 2003; Marini et al., 2004; Stewart et al.,
2005). These UT are derived from 2 major gene variants, namely UT-A and UT-B (Stewart et
al., 2005), and mRNA expression for UT-A has been characterized in ovine duodenum, and that
of UT-B in the rumen of both bovines (Marini and Van Amburgh, 2003; Stewart et al., 2005) and
ovines (Marini et al., 2004). In addition to measurement of urea-N kinetics, we also quantified
UT-B mRNA expression using qPCR. Expression of UT-B mRNA (copies/copy of ovine-
GAPDH) was unaffected by defaunation (P = 0.15) or dietary CP level (P = 0.21) (Table 4.5).
However, expression of UT-B mRNA in PDFAUN lambs was numerically greater (by 20%)
compared to FAUN lambs. A closer examination of these data on UT-B gene expression
Page 91
71
indicates that there was considerable variation among experimental lambs; as such, it is
conceivable that treatment differences could have approached statistical significance with a
larger number of lambs per treatment. Our data on UT-B gene expression further confirm our
findings using the [15
N15
N]-urea infusion technique where partial defaunation was associated
with a greater transfer of urea-N output to the GIT. Also, UT-B mRNA abundance in lambs fed
LOW was numerically greater (by 17%) compared to those fed HIGH, which is consistent with
the greater GER:UER ratio that was observed for lambs fed LOW compared to those fed HIGH.
The expression of UT in ruminal epithelium was altered by dietary protein level (Marini and Van
Amburgh, 2003); however, a subsequent study (Marini et al., 2004) failed to detect any changes
in UT expression due to dietary manipulation. The quantitative significance of these UT in trans-
epithelial urea-N transfer in ruminants has yet to be determined (Reynolds and Kristensen,
2008).
In this study, the effects of ruminal defaunation on microbial NAN supply were also
determined. In ruminants, the measurement of urinary PD excretion is now routinely used as an
indicator of ruminal microbial protein production under a wide range of dietary conditions (Chen
and Gomes, 1992). The calculation of microbial protein supply using urinary PD excretion
requires knowledge of the purine:N ratio in mixed ruminal microorganisms; however, in the
present study, this ratio was not measured, so assumed that it was constant at 11.6:100 and that it
remained unchanged by dietary treatment (Chen and Gomes, 1992). There is evidence that
factors such as diet (Ranilla and Carro, 2003) and time relative to feeding (Cecava et al., 1990)
may alter the purine:N ratio of ruminal microorganisms, so the use of a constant ratio is still a
matter of considerable debate. Despite these limitations, the PD technique is a non-invasive,
qualitative tool that can predict relative changes in MP supply. Partially-defaunating lambs
increased allantoin (P = 0.001) and total PD (P = 0.003) excretion (Table 4.6), supporting the
findings of Fujihara et al. (2003). Microbial NAN (expressed as g/d; P = 0.03) and microbial
efficiency (expressed as microbial N/kg of DOMR; P = 0.001) were higher in PDFAUN lambs
compared to FAUN lambs (Table 4.6). Numerous workers have observed that MP flow to the
duodenum increases after defaunation (Jouany, 1996; Koenig et al., 2000), and this response has
been attributable primarily to decreased protozoal predation on bacteria and decreased
competition from protozoa for growth substrates (Joauny, 1996).
Page 92
Table 4.6 Urinary output, urinary purine derivative (PD) excretion, and microbial non-ammonia nitrogen (NAN) supply in partially-
defaunated (PDFAUN) or faunated (FAUN) growing lambs fed LOW or HIGH dietary crude protein levels1
LOW HIGH P value2
Item FAUN PDFAUN FAUN PDFAUN SEM Protozoa Protein Protozoa x Protein
Urinary excretion
Total output, kg/d 2.3 1.7 1.9 2.8 0.43 0.66 0.46 0.12
Allantoin excretion, mmol/d 6.1 9.6 12.1 14.0 0.59 0.001 0.001 0.19
Uric acid excretion, mmol/d 2.5 2.5 3.9 3.8 0.21 0.86 0.001 0.82
Xanthine plus Hypoxanthine,
mmol/d
0.92 1.1 1.2 0.97 0.14 0.79 0.58 0.24
Total PD excretion, mmol/d 9.5 13.1 17.2 18.7 0.69 0.003 0.001 0.16
Microbial NAN supply3
g microbial N/d 8.1 11.3 14.8 16.2 0.61 0.003 0.001 0.15
g microbial N/kg DOMR 9.7 18.8 22.2 26.8 1.61 0.001 0.001 0.18
1LOW = 10% CP, HIGH = 15% CP (DM basis).
2Protozoa = PDFAUN vs. FAUN lambs; Protein = level of dietary CP (LOW vs. HIGH); Protozoa x Protein = interaction. PDFAUN
was achieved by addition of 6% (DM basis) linoleic acid-rich sunflower oil to the diet.
3Microbial NAN supply was calculated according to Chen and Gomes (1992); DOMR = digestible organic matter in rumen, which
was calculated as 0.65 * DOMI (Chen and Gomes, 1992).
72
Page 93
73
Also, our results provide some evidence that increased urea-N recycling to the GIT in
defaunated animals might provide additional ruminally degradable N for bacterial growth, as the
proportion of recycled urea-N that was used for anabolic purposes (i.e., GER to UUA) tended to
increase with defaunation. When microbial NAN supply is expressed as g microbial N/kg of
DOMR, the improvement in microbial protein synthesis due to defaunation ranges from 20 to
94%, which compares favorably with a range of 40 to 125% that has reported from summarized
literature data (Jouany, 1996). However, these data on microbial efficiency need to be interpreted
somewhat cautiously as I did not directly measure ruminal OM digestion in the present study;
rather, ruminal OM digestion was estimated as 0.65 x digestible OM intake (Chen and Gomes,
1992). Although any impact of defaunation on total tract OM digestion was not observed, limited
research indicates that ruminal OM digestion might be suppressed in protozoa-free ruminants
(Williams and Coleman, 1992). If ruminal OM digestion was altered in the present study, then
that would also alter microbial efficiency. Compared to those fed the LOW, lambs fed the HIGH
excreted more allantoin (P = 0.001), uric acid (P = 0.001), and total PD (P = 0.001); however,
xanthine plus hypoxanthine excretion did not differ (P = 0.58) (Table 4.6). Numerous workers
have observed that MP flow to the duodenum increases after defaunation (Jouany, 1996; Koenig
et al., 2000), and this response has been attributable primarily to decreased protozoal predation
on bacteria and decreased competition from protozoa for growth substrates (Joauny, 1996).
Similarly, Gabler and Heinrichs (2003) reported a linear increase in urinary output of allantoin
and total PD as dietary CP concentration increased. Microbial NAN (expressed as, g microbial
N/kg of DOMR or g microbial N/d) flow to the small intestine was higher (P < 0.01) in lambs
fed HIGH compared to those fed LOW.
It was anticipated that there would be interactions between protozoal status and dietary
CP level on N metabolism; however, no interactions were detected for any of the important
measures of N balance (P ≥ 0.18; Table 4.4), urea-N kinetics (P ≥ 0.18; Table 4.5), or microbial
N production (P ≥ 0.12; Table 4.6). Diet LOW was formulated to contain 10% CP, which was
markedly below CP requirements for growth (14.5% CP; NRC, 1985). On the other hand, HIGH
was formulated to contain 15% CP, which met growth requirements. Hence, there was a large
disparity in dietary CP levels. Because the benefits of defaunation on N utilization are greater
when animals are protein-deficient (Leng and Nolan, 1984), it was anticipated significant
interactions between protozoal status and dietary CP level would occur. Based on a meta-
Page 94
74
analysis of available data on the effects of defaunation on N metabolism from 75 studies, the
effects of defaunation on ruminal NH3-N concentration decreased with dietary N level (Eugène
et al., 2004), indicating that there might be important interactions between protozoal status and
dietary CP level. In that meta-analysis, the decrease in ruminal NH3-N concentration as a result
of defaunation was >5.0 mg/dL, whereas in the present study, defaunation decreased ruminal
NH3-N concentration by only 3.74 and 3.31 mg/dL in lambs fed LOW and HIGH, respectively.
It is noteworthy that the difference in ruminal NH3-N concentration between PDFAUN and
FAUN animals was similar across CP levels and, ostensibly, this decrease was not large enough
to elicit any interactions between defaunation and dietary CP level on N utilization.
4.5 Conclusions
Linoleic acid-rich sunflower oil fed at 6% of dietary DM was efficacious in partially
defaunating the rumen. Partially-defaunated lambs consumed less N, and exhibited lower
ruminal NH3-N concentrations compared to faunated lambs. Partially-defaunated animals
excreted smaller amounts of total N and, as a result, retained more N when expressed as a
proportion of N intake. Although urea-N recycling to the GIT (in g/d) was unaffected by
protozoal status, partially-defaunated animals recycled a greater proportion of their endogenous
urea-N output to the GIT (i.e., UER to GIT, +0.046 to 0.081) compared to faunated animals. In
addition, the proportion of recycled urea-N that was used for anabolic purposes (primarily MP
production) tended to be higher, and microbial N supply at the duodenum was higher, in
partially-defaunated compared to faunated animals. When taken together, these findings support
our hypothesis that improved N utilization in partially-defaunated ruminants is partly mediated
via increased urea-N recycling to the GIT, with subsequent utilization of that recycled urea-N for
anabolic purposes.
Page 95
75
5. FEEDING SUNFLOWER OIL TO PARTIALLY DEFAUNATE THE RUMEN
INCREASES NITROGEN RETENTION, UREA-NITROGEN RECYCLING TO
THE GASTROINTESTINAL TRACT AND THE ANABOLIC USE OF
RECYCLED UREA-NITROGEN IN GROWING LAMBS1
5.1 Abstract
The objective of this study was to delineate how interactions between ruminal partial
defaunation and altering dietary ruminally-fermentable carbohydrate (RFC) may alter urea-N
kinetics and N metabolism in lambs. Four Suffolk ram lambs (61.5 ± 4.0 kg) were used in a 4 x 4
Latin square design with a 2 x 2 factorial arrangement of treatments. Treatments were: partially-
defaunated (PDFAUN) vs. faunated (FAUN) lambs, and dry-rolled barley (DRB) vs. pelleted
barley (PB) barley as the principal sources of RFC. Linoleic acid-rich sunflower oil (SFO) was
fed as a defaunating agent. Nitrogen balance was measured over 4 d, with concurrent
measurement of urea-N kinetics using continuous intra-jugular infusions of [15
N15
N]-urea.
Feeding SFO decreased (P = 0.001) ruminal protozoa and ammonia-N concentrations. Urinary N
excretion was lower (P = 0.003) and retained N was higher (P = 0.002) in PDFAUN compared to
FAUN lambs. Endogenous production of urea-N (i.e., UER) was similar across treatments. The
urea-N recycled to the gastrointestinal tract (GER), expressed as absolute amounts (16.4 vs. 13.1
g/d) or as a proportion of UER (0.693 vs. 0.570), its anabolic use (9.0 vs. 6.0 g/d), and microbial
N supply (14.6 vs. 10.9 g/d) were higher (P ≤ 0.001) in PDFAUN compared to FAUN lambs. As
a proportion of UER, GER was higher, whereas urinary urea-N excretion was lower in lambs fed
PB compared to those fed DRB (P = 0.01). In summary, feeding SFO increased urea-N recycling
to the GIT and microbial NAN supply, thus providing new evidence that the improved efficiency
of N utilization in partially-defaunated ruminants could be partly mediated by an increase in
urea-N recycling.
1A version of this chapter has been accepted for publication: Kiran, D., and T. Mutsvangwa. 2010. Feeding
sunflower oil to partially defaunate the rumen increases N retention, urea-N recycling to the gastrointestinal tract
and anabolic use of recycled urea-N in growing lambs . British Journal of Nutrition (in press).
Page 96
76
5.2 Introduction
In ruminants, it is well-recognized that endogenous urea-N production often exceeds
apparent digestible N intake, yet ruminants still maintain a positive N balance by recycling 40 to
80% of this urea-N to the GIT (Lapierre and Lobley, 2001). Urea-N that passes into the rumen
can provide ruminally-available N for the synthesis of microbial protein, which is a major
contributor to the metabolizable protein that is available for intestinal digestion (Lapierre and
Lobley, 2001). In a previous experiment it was demonstrated that feeding SFO to partially
defaunate the rumen was associated with: 1) an increase in the proportion of endogenous urea-N
that was recycled to the GIT; and 2) a tendency to increase the proportion of recycled urea-N that
was utilized for anabolic purposes (Kiran and Mutsvangwa, 2010). Previously, the removal of
protozoa (i.e., defaunation) has been reported to improve N utilization, mainly by decreasing the
ruminal NH3-N pool, coupled with a greater sequestration of NH3-N into bacterial protein
(Firkins et al., 2007), and by decreasing intra-ruminal N recycling (Jouany, 1996). Previous
research showed that the positive effects of defaunation on N utilization may also result from an
increase in urea-N recycling to the rumen (Kiran and Mutsvangwa, 2010). Because defaunation
decreases ruminal NH3-N level (Jouany, 1996), this could potentially increase trans-epithelial
urea-N transfer as ruminal NH3-N level is negatively correlated with urea-N transfer into the
rumen (Kennedy and Milligan, 1980). In addition, trans-epithelial movement of urea-N by
passive diffusion into the rumen is facilitated by bacterial urease activity, which maintains a
favorable concentration gradient (Rémond et al., 1996). Cheng and Wallace (1979) demonstrated
that urease activity in ruminal contents was negatively correlated with ruminal NH3-N level.
Although results of previous experiment showed that a higher proportion of endogenous
urea-N production was recycled to the GIT in partially-defaunated ruminants, N intake differed
with protozoal status in that study as a result of decreased DM intake (Kiran and Mutsvangwa,
2010). Because of the positive correlation between N intake and hepatic output of urea-N
(Marini et al., 2004; Wickersham et al., 2009), data on urea-N recycling kinetics could have been
confounded due to differences in N intake. In addition, the use of recycled urea-N for anabolic
purposes showed only a tendency to be higher in partially-defaunated compared to faunated
animals (Kiran and Mutsvangwa, 2010), suggesting that ruminal energy supply might have
limited microbial use of recycled urea-N for protein synthesis. Increasing dietary amounts of
RFC (Huntington, 1989) or shifting carbohydrate digestion from the small intestine to the rumen
Page 97
77
via steam-flaking compared to dry-rolling of sorghum grain (Theurer et al., 2002) has been
shown to increase urea-N transfer to the rumen, in addition to increasing N sequestration into
microbial protein as energy supply from RFC is the major driver for microbial growth (Russell,
1998; Koenig et al., 2003). Also, substantial decreases in ruminal protozoal populations have
been reported in ruminants fed high-grain diets or extensively-processed barley (Koenig et al.,
2003; Eadie et al., 1970). Providing more RFC therefore could improve N utilization by
stimulating both urea-N recycling to the GIT and microbial protein production. In Western
Canada and parts of the Northern USA, barley grain is the principal cereal grain that is included
in ruminant diets, and it is commonly fed either in a dry-rolled or pelleted form. Pelleting
decreases particle size, thus shifting the site of carbohydrate digestion from post-ruminal sites to
the rumen, and previous in situ studies in our laboratory clearly indicated a higher soluble starch
fraction, a higher degradation rate of the degradable starch fraction, and a higher effective starch
degradability of PB when compared to DRB (Kiran and Mutsvangwa, 2007). Based on this
previous research, it can be expected that ruminal starch digestibility would be higher for PB
compared to DRB, which could potentially alter urea-N recycling to the GIT and microbial
protein synthesis in the rumen. The major objective of this study was to delineate how
interactions between feeding SFO to partially defaunate the rumen and dietary RFC may alter
urea-N kinetics and N metabolism in growing lambs. The hypothesis was that feeding SFO to
partially defaunate the rumen would increase urea-N recycling to the GIT and the utilization of
recycled urea-N for anabolic purposes, and that these effects would be more pronounced if
ruminal energy supply was increased by feeding PB compared to DRB.
5.3 Materials and Methods
5.3.1 Animals and Experimental Design
Four Suffolk ram lambs (61.5 ± 4.0 kg initial BW) that were fitted with ruminal cannulae
were used. The experiment was run as a 4 x 4 Latin square design with 27-d periods and a 2 x 2
factorial arrangement of treatments. Experimental periods consisted of 21 d of dietary adaptation
and 6 d of data collection. Lambs were housed in individual floor pens (during dietary
adaptation) or in metabolism crates (during data collection) and were handled in accordance with
Page 98
78
the guidelines of the Canadian Council of Animal Care (1993). Their use was approved by the
University of Saskatchewan Animal Care Committee (UCACS Protocol No. 20040048).
5.3.2 Experimental Treatments and Feeding Management
The treatment factors were: 1) PDFAUN vs. FAUN; and 2) DRB vs. PB as the principal
source of RFC. The ingredient and chemical composition of the experimental diets containing
DRB or PB are presented in Table 5.1. Experimental diets were formulated to be iso-nitrogenous
at 16 g N/kg DM. The preparation of DRB and PB was as described by Kiran and Mutsvangwa
(2007). Dry-rolled barley or PB was fed as the principal sources of dietary RFC in order to
manipulate ruminal energy availability for microbial growth. Diets were offered in the form of a
meal for ad libitum intake twice daily in equal portions at 0900 and 1700 h, ensuring that 10%
orts remained each day. Lambs had free access to water.
5.3.3 Partial Defaunation and Refaunation
Linoleic acid-rich SFO (SafewayTM
Canada, Saskatoon, SK, Canada) was fed (60 g/kg
DM) as an anti-protozoal agent. The protocol for ruminal defaunation was based on previous
research (Ivan et al., 2001) and similar to Kiran and Mutsvangwa (2010). The measured fatty
acid composition (%) of SFO was: 6.24, 3.87, 26.15, 67.07, and 0.49 of palmitic (C16:0), stearic
(C18:0), oleic (C18:1), linoleic (C18:2n-6), and linolenic (C18:3n-3) acid, respectively. For
lambs receiving SFO, daily allotments were calculated based on the previous day‟s DM intake.
To avoid cross-inoculation of PDFAUN lambs by FAUN lambs via direct physical contact,
individual floor pens and metabolism crates housing PDFAUN lambs were spaced several meters
away from those housing FAUN lambs. In addition, ruminal fluid sampling of PDFAUN lambs was
conducted prior to FAUN lambs in order to minimize the risk of cross-inoculation. To enumerate
protozoa, 200 mL of ruminal contents were sampled at 1100 h on d 1 to d 3, d 6, d 9, d 12, d 15,
d 18, and d 21 to d 26. The processing of ruminal contents for protozoal counting was conducted
as described by Kiran and Mutsvangwa (2010), and protozoal enumeration and differentiation
into different genera (i.e., Entodinium spp., Holotrichs, and cellulolytic protozoa) was conducted
as described by Ogimoto and Imai (1981). Partially-defaunated lambs were refaunated at the
start of an experimental period as previously described (Kiran and Mutsvangwa, 2010).
Page 99
79
Table 5.1. Ingredient and chemical composition of experimental diets
Item Dry-rolled barley Pelleted barley
Ingredients, % DM
Alfalfa meal 6.0 6.0
Barley (Dry rolled) 45.0 -
Barley (Pelleted) - 45.0
Canola meal 2.0 2.0
Corn gluten meal 0.5 0.5
Oat hulls 35.0 35.0
Soybean meal 1.5 1.5
Canola oil 1.0 1.0
Liquid molasses 2.0 2.0
Ground limestone 4.0 4.0
Salt, Co-I1 0.7 0.7
Salt white 1.3 1.3
Mineral vitamin supplement2 1.0 1.0
Chemical composition
DM, % 93.8 93.1
OM, % of DM 91.2 90.9
CP, % of DM 9.92 9.99
NDF, % of DM 40.4 39.7
ADF, % of DM 20.7 20.9
EE, % of DM 3.6 3.7
RDP3, % of CP 63.6 63.6
ME3, MCal/kg 1.7 1.7
1Salt, cobalt and iodine mix: Co, 100 mg/kg: and I, 150 mg/kg.
2Provided per kg of concentrate DM: CuO, 3.3 mg; ZnO, 22 mg; MnO, 18.5 mg; vitamin A,
1,495 IU; vitamin D, 125.5 IU; vitamin E, 22 IU; and sodium selenite, 0.1 mg.
3Calculated according to NRC (1985) guidelines.
Page 100
80
5.3.4 Sample Collection
Experimental lambs were moved from individual floor pens into individual metabolism
crates on d 19 of each experimental period to allow acclimation before the initiation of data
collection on d 22. During the 6-d data collection period, individual lamb feed intake was
recorded daily. Samples of experimental diets and orts were collected daily, stored at -20°C, and
composited per lamb for each experimental period prior to chemical analysis. On d 21 of each
experimental period, lambs were fitted with temporary vinyl catheters (0.86 mm I.D. x 1.32 mm
O.D.; Scientific Commodities Inc., Lake Havasu City, Arizona, USA) in the right and left jugular
veins to allow for simultaneous isotope infusion and blood sampling. Urea-N transfer to the GIT
and whole-body N balance were determined between d 22 and 26 as described by Lobley et al.
(2000). Briefly, background samples of urine and feces were collected on d 21 to measure 15
N
natural abundance. Starting on d 22 of each experimental period, [15
N15
N]-urea (99 atom % 15
N;
Cambridge Isotope Laboratories, Andover, MA) prepared in 0.15 M sterile saline was infused
continuously into a jugular vein using a peristaltic pump for 96 h. Daily dosage rates of [15
N15
N]-
urea ranged from 324 to 582 mg per lamb depending on N intake, such that the predicted plateau
enrichment of [15
N15
N]-urea in urine was 0.15 mole percent excess. Total feces and urine were
collected daily between d 22 and d 26 before the 0900 h feeding to determine daily outputs.
Collection, processing, and sampling of feces and urine for N, fecal 15
N enrichment, urinary
enrichment of [15
N15
N]-, [14
N15
N]- and [14
N14
N]-urea, and urinary purine derivatives (PD)
analysis was as previously described (Kiran and Mutsvangwa, 2010).
On d 26, 200 mL of ruminal contents were sampled at 0900, 1100, 1300, 1500 and 1700
h and squeezed through two layers of cheesecloth. Ruminal pH was immediately determined and
10-mL aliquots of ruminal fluid were preserved as previously described (Kiran and Mutsvangwa,
2010) for NH3-N and VFA analysis. The remaining ruminal fluid was kept frozen at -20°C for
the isolation of ruminal microbes. At the same time points corresponding to ruminal fluid
sampling, blood samples were drawn from a jugular vein catheter into vacutainers containing
heparin and plasma was obtained as previously described (Kiran and Mutsvangwa, 2010) for
PUN analysis. On d 27, ruminal epithelial tissue biopsies were taken by clipping at 2 h after the
morning feeding as previously described (Kiran and Mutsvangwa, 2010).
Page 101
81
Ruminal starch degradation in diets containing DRB and PB were determined using the
in situ method as described by Yu et al. (2003). Briefly, approximately 7 g of each diet were
weighed into nylon bags and incubated in the rumen of a dry cow fed barley silage for 2, 4, 6, 8,
12, 24 and 48 h. The rumen incubation protocol, nylon bags, washing and drying procedures for
nylon bags were as described by Yu et al. (2003). Dried samples of diet and nylon bag residues
were analyzed later for starch.
5.3.5 Sample Analyses
At the end of the trial, frozen samples of experimental diets, orts and feces were thawed
overnight at room temperature and analyzed for DM by drying in an oven at 60°C for 48 h
(method 930.15) (AOAC, 1995). Dried diets, orts and feces were then ground through a 1-mm
screen using a Christy-Norris mill (Christy and Norris Ltd., Chelmsford, England). Ground diets,
orts and fecal samples were pooled per lamb and analyzed for OM (method 942.05), N using the
macro-Kjeldahl procedure (method 2001.11), total starch (method 996.11) using a commercial
kit (Total Starch Assay Kit, Megazyme International Ireland Ltd., Wicklow, Ireland), ether
extract (method 2003.05) (AOAC, 1995), and ADF and NDF (Van Soest et al., 1991). Amylase
and sodium sulfite were used for NDF determination. Total N in pooled urine was determined
using the macro-Kjeldahl procedure (AOAC, 1995). Dried nylon bag residues were analyzed for
total starch (method 996.11) using a commercial kit. The fatty acid composition of SFO was
determined using GC (Agilent 6890, Mississauga, ON, Canada) as described by Soita et al.
(2005).
Preserved ruminal fluid samples were analyzed for VFA by GC as described by Erwin et
al. (1961), and for NH3-N using a phenol-hypochlorite assay (Broderick and Kang, 1980).
Frozen ruminal fluid samples for microbial isolation were thawed at room temperature and
centrifuged at 20,000 x g at 4°C for 20 min, and the supernatant fraction was discarded. The
microbial pellet was washed with double-distilled water and centrifuged at 20,000 x g at 4°C for
20 min and this process was repeated two more times (Makkar and Becker, 1999). The microbial
pellet was then freeze-dried, ground with a mortar and pestle, and analyzed for total N and
individual purines as described by Makkar and Becker (1999). Daily urine samples (2 mL) that
were diluted with distilled water (8 mL) were pooled per lamb proportionally to daily urine
output and analyzed for allantoin, and xanthine plus hypoxanthine (Chen and Gomes, 1992), and
Page 102
82
for uric acid by a quantitative enzymatic colorimetric method using a commercial assay kit
(Stanbio Uric Acid Liquicolor Kit, Procedure No. 1045; Stanbio Laboratories, Boerne, TX,
USA). Total PD excretion per day was calculated as allantoin + uric acid + xanthine plus
hypoxanthine. Microbial non-NH3-N (NAN) supply was calculated based on total PD excretion
in urine (Chen and Gomes, 1992), using the determined purine N:microbial N ratios and BW
measurements obtained on d 19. Plasma urea-N (PUN) and urinary urea-N (UUN) were
determined by the diacetyl monoxime method (Marsh et al., 1957) using a commercial kit
(Stanbio Urea-N Kit, Procedure No. 0580; Stanbio Laboratories).
To determine the proportions of [15
N15
N]-, [14
N15
N]- and [14
N14
N]-urea in daily urine and
background urine samples, urinary urea was isolated by applying urine containing 1.5 mg of
urea-N through pre-packed cation exchange resin columns (AG-50W-×8 Resin, 100-200 mesh,
H+ form; Biorad, Richmond, CA) as described by Archibeque et al. (2001). The proportions of
[15
N15
N]-, [14
N15
N]-, and [14
N14
N]-urea in isolated UUN were analyzed by isotope ratio-mass
spectrometry (Lobley et al., 2000) at the N-15 Analysis Laboratory, University of Illinois at
Urbana-Champaign. Under the conditions of this assay, [14
N14
N]-, [14
N15
N]-, and [15
N15
N]-urea
molecules should yield ions with mass/charge (m/z) values of 28, 29, and 30, respectively. To
account for non-monomolecular reactions, standards which were prepared from [15
N15
N]-urea
(99.8 atom % 15
N) and [14
N14
N]-urea (natural abundance urea; 0.364 atom % 15
N) were also
analyzed and the necessary corrections for [14
N15
N]-urea that is produced by non-monomolecular
reactions were then made (Lobley et al., 2000). Fecal samples were analyzed for total 15
N
enrichment by combustion to N2 gas in an elemental analyzer and continuous flow isotope ratio-
mass spectrometry (Lobley et al., 2000). For UT-B gene expression analysis, processing of
ruminal epithelial tissue, RNA extraction, cDNA generation, and quantification of gene
transcript abundance using qPCR were conducted as previously described (Kiran and
Mutsvangwa, 2010). Ovine-GAPDH was used as an internal reference to UT-B mRNA
expression. The results are presented as target gene transcript abundance normalized to GAPDH
transcript abundance. Expression of GAPDH mRNA in equal amounts of total RNA indicated
that GAPDH in rumen epithelial tissue was stable and unaffected by the experimental conditions
that were employed.
Page 103
83
5.3.6 Calculation of Urea-N Kinetics and Statistical Analysis
Rumen degradation characteristics of starch were analyzed using the NLIN procedure
(SAS, 2004) using iterative least squares regression (Gauss-Newton method) as described by Yu
et al. (2003). Urea-N kinetics was calculated according to the model of Lobley et al. (2000),
using urinary 15
N enrichment of [15
N15
N]- and [14
N15
N]-urea and total 15
N excretion in feces. All
data were analyzed using ANOVA as a 4 x 4 Latin square using the Proc Mixed procedure of
SAS (2004) with animal and period as the random effects. The model used included the
following independent variables: animal, period, SFO (-SFO vs. +SFO), barley grain processing
(DRB vs. PB), and the SFO x barley grain processing interaction. When significant SFO x barley
grain processing interactions were detected, treatments means were compared using the Tukey-
Kramer multiple comparison test. Data on PUN, ruminal pH, and ruminal concentrations of VFA
and NH3-N were analyzed accounting for repeated measures (Wang and Goonewardene, 2004).
For protozoal counts, statistical analysis was performed on log10-transformed data. Treatment
differences were considered significant when P ≤ 0.05 and tendencies are discussed when 0.05 <
P ≤ 0.10. Data are presented as means ± SEM.
5.4 Results
5.4.1 In Situ Ruminal Starch Degradation Kinetics
The in situ ruminal starch degradation kinetics are presented in Table 5.2. The in situ
soluble and degradable starch fractions, the degradation rate of the degradable starch fraction,
and the effective starch degradability were greater (P ≤ 0.02) in the diet that contained PB when
compared to that containing DRB.
5.4.2 Dry Matter Intake and Total Tract Nutrient Digestibilities
Dry matter and organic matter (OM) intakes were unaffected (P ≥ 0.14) by treatment
(Table 5.3). Total tract digestibilities of DM, OM, N, ADF, and NDF were unaffected (P ≥ 0.24)
by feeding SFO and method of barley grain processing. Total tract digestibility of starch was
greater (P = 0.001) in lambs fed PB compared to those fed DRB, but was unaffected by
protozoal status.
Page 104
84
Table 5.2 In situ ruminal degradation kinetics of starch in experimental diets containing dry-
rolled barley or pelleted barley
Item
Dry-rolled
barley
Pelleted
barley SEM P value
Soluble fraction, % 9.5 15.1 0.72 0.002
Degradable fraction, % 79.6 81.0 0.35 0.02
Degradation rate, %/h 13.7 16.4 0.56 0.009
Effective degradability1, % 65.2 74.5 0.92 0.001
1Calculated assuming a ruminal passage rate of 6%/h.
Page 105
Table 5.3 Sunflower oil (SFO), basal dry matter (DM), and total organic matter (OM) intakes, and total tract nutrient digestibility in
partially-defaunated (PDFAUN) or faunated (FAUN) growing lambs fed dry-rolled or pelleted barley1
Dry-rolled barley Pelleted barley P value2
Item FAUN PDFAUN FAUN PDFAUN SEM Protozoa BP Protozoa x BP
Intakes, g/d
SFO - 118.2 - 108.5 - - - -
Basal DM3 2,074 1,970 1,856 1,809 119.6 0.54 0.14 0.82
Total OM4 1,901 2,039 1,701 1,872 115.9 0.21 0.14 0.88
Nutrient digestibility, %
DM 62.4 57.9 60.9 62.4 2.4 0.55 0.54 0.24
OM 65.2 63.9 63.7 67.8 2.1 0.51 0.59 0.22
Starch 88.6 87.8 96.6 97.3 1.8 0.94 0.001 0.38
N 75.7 72.0 73.3 75.3 2.8 0.77 0.86 0.33
ADF 30.6 26.0 30.0 28.6 5.6 0.60 0.86 0.79
NDF 32.2 28.9 28.5 28.1 5.6 0.74 0.70 0.79
1n = 4 for each treatment.
2 Protozoa = PDFAUN vs. FAUN; BP = barley grain processing (DRB vs. PB); Protozoa x BP = interaction. Partial defaunation was
achieved by the addition of 6% (DM basis) linoleic acid-rich sunflower to the diet.
3Basal DM intake does not include SFO intake.
4Total OM intake includes SFO intake.
85
Page 106
86
5.4.3 Ruminal Protozoa Counts and Fermentation Characteristics
Ruminal counts of total protozoa, Entodinium spp., Holotrichs, and cellulolytic protozoa
were greater in FAUN lambs fed DRB compared those fed PB (Table 5.4; P < 0.01);
consequently, there was a greater difference in ruminal counts of total protozoa, Entodinium
spp., Holotrichs, and cellulolytic protozoa between FAUN and PDFAUN lambs fed DRB
compared to those fed PB (interaction; P < 0.01). Experimental lambs were successfully
refaunated by the administration of ruminal fluid from naturally-faunated sheep over 3 d, and
populations (mean ± SE; n = 4) for total protozoa (10.6 ± 0.3 x 10⁵ /ml), Entodinium spp. (10.2 ±
0.3 x 10⁵/ml), Holotrichs (0.24 ± 0.02 x 10
5 /ml), and cellulolytic protozoa (0.20 ± 0.02 x 10
5/ml)
were restored to pre-defaunation levels in previously PDFAUN lambs by d 15 of the
experimental period (Appendix Tables V, VI and VII).
For ruminal pH, and NH3-N and VFA concentrations, sampling time x barley grain
processing x ruminal protozoal status interactions were minor, so treatment means are presented
(Table 5.4). Ruminal pH was higher (P = 0.001) in PDFAUN compared to FAUN lambs.
Ruminal pH was lower (P = 0.02) in lambs fed PB compared to those fed DRB. Ruminal NH3-N
concentration was lower (P = 0.001) in PDFAUN compared to FAUN lambs, and the difference
in ruminal NH3-N concentration between PDFAUN and FAUN lambs was greater with DRB
than with PB (interaction; P < 0.01). Ruminal total VFA, acetate and butyrate were lower (P =
0.001), whereas that of propionate was higher (P = 0.001) in PDFAUN compared to FAUN
lambs; consequently, the acetate to propionate ratio was lower (P = 0.001) in PDFAUN
compared to FAUN lambs. Ruminal concentrations of total and individual VFA were similar in
lambs fed either DRB or PB, except for a higher (P = 0.001) ruminal concentration of valerate
and a lower (P = 0.009) acetate to propionate ratio in lambs fed PB compared to those fed DRB.
Page 107
Table 5.4 Ruminal fermentation characteristics and protozoa numbers in partially-defaunated (PDFAUN) or faunated (FAUN)
growing lambs fed dry-rolled or pelleted barley 1
Dry-rolled barley Pelleted barley P value2
Item FAUN PDFAUN FAUN PDFAUN SEM Protozoa BP Protozoa x BP
Protozoa, x 105/ml
3
Entodinium spp. 10.2a 1.3
c 6.2
b ND
4 0.25 0.001 0.001 0.001
Holotrichs 0.28a 0.01
c 0.16
b ND 0.02 0.001 0.007 0.008
Cellulolytics5 0.20
a ND 0.09
b ND 0.02 0.001 0.003 0.003
Total 10.7a 1.3
c 6.4
b ND 0.27 0.001 0.001 0.001
pH 5.8 6.2 5.7 6.0 0.05 0.001 0.02 0.86
NH3-N, mg/dL 9.7a 6.0
c 7.7
b 5.6
c 0.22 0.001 0.001 0.002
VFA concentration, mmol/L
Total 100.3 92.8 98.2 94.1 1.13 0.001 0.72 0.15
Acetate 62.1 55.4 59.2 55.3 1.08 0.001 0.19 0.22
Propionate 18.5 21.5 19.3 22.3 0.48 0.001 0.13 0.99
Butyrate 16.3 11.5 15.9 12.6 0.55 0.001 0.55 0.24
Isobutyrate 0.79 0.71 0.83 0.72 0.07 0.18 0.73 0.84
Valerate 1.3 1.4 1.6 1.6 0.06 0.26 0.01 0.32
Isovalerate 1.2 1.4 1.4 1.7 0.29 0.09 0.36 0.32
Acetate to propionate ratio 3.4 2.6 3.1 2.5 0.06 0.001 0.009 0.17 1n = 4 for each treatment.
2Protozoa = PDFAUN vs. FAUN; BP = barley grain processing (DRB vs. PB); Protozoa x BP = interaction. Partial defaunation was
achieved by the addition of 6% (DM basis) linoleic acid-rich sunflower to the diet. 3Treatment means for ruminal counts of protozoa during the measurement period (d 22 to d 27).
4Not detectable
5Includes Polyplastron, Diplodinium and Enoplastron sp.
a-cMeans within a row with different superscripts differ (P < 0.05).
87
Page 108
88
5.4.4 Nitrogen Balance and Plasma Urea-N Concentration
Intakes of N were similar across treatments (Table 5.5). Urinary excretion of total N was
2.7 to 4.9 g/d less (P = 0.003) in PDFAUN compared to FAUN lambs; consequently, total N
excretion, when expressed as absolute amounts (P = 0.02) or as a proportion of N intake (P =
0.001), was lower, and N retention, when expressed as absolute amounts (P = 0.002) or as a
proportion of N intake (P = 0.001), was higher in PDFAUN compared to FAUN lambs. Lambs
fed PB excreted 2.5 to 4.7 g/d less (P = 0.004) urinary N compared to those fed DRB. Total N
loss, when expressed in absolute amounts (P = 0.01) or as a proportion of N intake (P = 0.001),
was lower in lambs fed PB compared to those fed DRB. Consequently, N retention when
expressed in absolute amounts tended to be greater (P = 0.09), or when expressed as a proportion
of N intake was greater (P = 0.001) in lambs fed PB compared to those fed DRB. The PUN
concentration was greater (P = 0.001) in FAUN compared to PDFAUN lambs, but method of
barley grain processing had no effect on PUN concentration.
5.4.5 Urea-N Kinetics, mRNA Abundance of Urea Transporter-B and Microbial NAN
Supply
Across treatments, urinary [15
N15
N]-urea enrichment reached a plateau within 24 to 48 h
of isotopic infusion, whereas plateau enrichment of [14
N15
N]-urea in urine was not attained until
between 48 and 72 h of isotopic infusion (Figure 5.1). Fecal 15
N enrichments increased daily
over the 4-d isotopic infusion without attaining a definite plateau (Figure 5.2); therefore, for
calculations of urea-N kinetics, urinary [14
N15
N]- and [15
N15
N]-urea and fecal 15
N enrichments
over the final 72 to 96 h of infusion were used, similar to previous research (Lobley et al., 2000;
Sunny et al., 2007).
Page 109
Table 5.5. Nitrogen (N) intake, N balance, and plasma-urea nitrogen in partially-defaunated (PDFAUN) or faunated (FAUN) growing
lambs fed dry-rolled or pelleted barley 1
Item
Dry-rolled barley Pelleted barley P value2
FAUN PDFAUN FAUN PDFAUN SEM Protozoa BP Protozoa x BP
N intake, g/d 33.7 31.9 29.9 29.1 1.9 0.52 0.12 0.80
Faecal N excretion
g/d 8.1 9.0 8.2 7.2 1.2 0.97 0.49 0.46
% of total N excretion 31.6 41.0 37.5 40.9 3.8 0.10 0.45 0.44
Urine N excretion
Total N, g/d 17.7 12.8 13.0 10.3 1.1 0.003 0.004 0.29
Total N, % of total N excretion 68.4 58.9 62.5 59.1 3.8 0.10 0.45 0.44
Urea-N, g/d 11.2a 7.8
b 8.4
b 6.7
c 0.33 0.001 0.001 0.03
Total N excretion
g/d 25.8 21.7 21.2 17.5 1.5 0.02 0.01 0.88
% of N intake 76.8 68.2 71.0 60.2 1.1 0.001 0.001 0.33
N retention
g/d 7.8 10.1 8.7 11.6 0.65 0.002 0.09 0.66
% of N intake 23.2 31.8 29.0 39.8 1.1 0.001 0.001 0.33
Plasma urea-N, mg/dL 9.5 6.7 8.7 6.7 0.53 0.001 0.51 0.47
1n = 4 for each treatment.
2 Protozoa = PDFAUN vs. FAUN; BP = barley grain processing (DRB vs. PB); Protozoa x BP = interaction. Partial defaunation was
achieved by the addition of 6% (DM basis) linoleic acid-rich sunflower to the diet.
a-cMeans within a row with different superscripts differ (P < 0.05).
89
Page 110
90
Figure 5.1 Enrichments (APE, atom percent excess) of [15
N15
N]-urea (A) and [14
N15
N]-urea (B)
in urine during 4-d intra-jugular infusions of [15
N15
N]-urea (infusions were initiated at sampling
interval 0 h). Treatments were: PDFAUN lambs fed dry-rolled barley (PDFAUN+DRB);
PDFAUN lambs fed pelleted barley (PDFAUN+PB); FAUN lambs fed dry-rolled barley
(FAUN+DRB); and FAUN lambs fed pelleted barley (FAUN+PB). For [15
N15
N]-urea
enrichments, no differences were detected between sampling intervals 0-24, 24-48, 48-72, and
72-96 h (P > 0.10). For [14
N15
N]-urea enrichments, no differences were detected between
sampling intervals 24-48, 48-72, and 72-96 h (P > 0.10). Each line represents means ± SEM for
4 lambs.
Page 111
91
Figure 5.2 Enrichments (APE, atom percent excess) of fecal 15
N during 4-d intra-jugular
infusions of [15
N15
N]-urea (infusions were initiated at sampling interval 0 h). Treatments were:
PDFAUN lambs fed dry-rolled barley (PDFAUN+DRB); PDFAUN lambs fed pelleted barley
(PDFAUN+PB); FAUN lambs fed dry-rolled barley (FAUN+DRB); and FAUN lambs fed
pelleted barley (FAUN+PB). Differences were detected in fecal 15
N enrichments between
sampling intervals 0-24, 24-48, 48-72, and 72-96 h (P = 0.001), indicating that fecal 15
N
enrichment did not reach a definite plateau. Each line represents means ± SEM for 4 lambs.
Page 112
92
Only minor interactions on urea-N kinetics were detected between feeding SFO and
method of barley grain processing (Table 5.6). Endogenous urea-N production (i.e., UER) was
similar in FAUN and PDFAUN lambs (P = 0.48). The GER, when expressed in absolute
amounts (P = 0.008) or as a proportion of UER (i.e., UER to GIT; P = 0.001), was greater in
PDFAUN compared to FAUN lambs. The UUA, when expressed in absolute amounts (P =
0.008) or as a proportion of GER (i.e., GER to UUA; P = 0.04), was higher in PDFAUN
compared to FAUN lambs. Conversely, the amount of UER that was lost in urine (i.e., UUE),
when expressed in absolute amounts (P = 0.001) or as a proportion of UER (i.e., UER to urine; P
= 0.001), was lower in PDFAUN compared to FAUN lambs. The urea-N that re-entered the
ornithine cycle (i.e., ROC) was unaffected by protozoal status; however, when expressed as a
proportion of GER (i.e., GER to ROC), there was a tendency (P = 0.08) for it to be lower in
PDFAUN compared to FAUN lambs. The UFE was unaffected by protozoal status. The UER,
GER, UUA, UFE, and ROC were similar in lambs fed DRB or PB. The UUE, when expressed in
absolute amounts (P = 0.001) or as a proportion of UER (P = 0.01), was lower, whereas GER
when expressed as a proportion of UER was higher (P = 0.01), in lambs fed PB compared to
those fed DRB. The expression of UT-B mRNA was unaffected by treatment.
Urinary excretion of allantoin and total PD was higher (P = 0.001) and, correspondingly,
microbial NAN supply estimated using urinary PD excretion and measured purine N:microbial N
ratios was higher (P = 0.001) in +SFO compared to –SFO lambs (Table 5.7). Compared to those
fed DRB, lambs fed PB excreted more allantoin (P = 0.02), and tended to excrete more xanthine
plus hypoxanthine (P = 0.06) and total PD (P = 0.09); however, microbial NAN supply was
unaffected (P = 0.22) by barley grain processing.
Page 113
Table 5.6. Urea-N recycling kinetics, as measured using 4-d continuous intra-jugular infusions of [15
N15
N]-urea, and urea transporter-B
(UT-B) mRNA abundance in partially-defaunated (PDFAUN) or faunated (FAUN) growing lambs fed dry-rolled or pelleted barley1
Dry-rolled barley Pelleted barley P value2
Item FAUN PDFAUN FAUN PDFAUN SEM Protozoa BP Protozoa x BP
Urea-N kinetics, g/d
Production, UER 23.2 24.6 22.5 22.6 1.04 0.48 0.24 0.53
Entry to GIT, GER 12.0 16.8 14.1 16.0 1.04 0.008 0.55 0.18
Return to ornithine cycle, ROC 5.8 6.8 6.8 6.3 0.60 0.67 0.69 0.22
Loss to feces, UFE 0.81 0.77 0.75 0.92 0.10 0.54 0.64 0.35
Loss to urine, UUE 11.2a 7.8
b 8.4
b 6.7
c 0.33 0.001 0.001 0.03
Re-use for anabolism, UUA 5.5 9.2 6.6 8.8 0.92 0.008 0.71 0.41
Fractional urea-N transfers
UER to urine 0.483 0.319 0.378 0.295 0.022 0.001 0.01 0.09
UER to GIT 0.517 0.680 0.622 0.705 0.022 0.001 0.01 0.09
GER to ROC 0.478 0.409 0.489 0.395 0.042 0.08 0.96 0.77
GER to feces 0.068 0.047 0.053 0.057 0.007 0.22 0.74 0.08
GER to UUA 0.453 0.544 0.458 0.548 0.040 0.04 0.91 0.99
UT-B mRNA abundance, per copy of
GAPDH
10.5 11.3 10.3 11.0 1.41 0.63 0.84 0.96
1n = 4 for each treatment.
2Protozoa = PDFAUN vs. FAUN; BP = barley grain processing (DRB vs. PB); Protozoa x BP = interaction. Partial defaunation was
achieved by the addition of 6% (DM basis) linoleic acid-rich sunflower to the diet.
a-cMeans within a row with different superscripts differ (P < 0.05).
93
Page 114
Table 5.7. Urinary output, urinary purine derivative (PD) excretion, and microbial non-ammonia nitrogen (NAN) supply in in partially-
defaunated (PDFAUN) or faunated (FAUN) growing lambs fed dry-rolled or pelleted barley 1
Dry-rolled barley Pelleted barley P value2
Item FAUN PDFAUN FAUN PDFAUN SEM Protozoa BP Protozoa x BP
Urinary excretion
Total output, kg/d 2.0 1.9 1.7 1.6 0.20 0.66 0.16 0.82
Allantoin excretion, mmol/d 5.9 8.6 7.1 9.9 0.49 0.001 0.02 0.89
Uric acid excretion, mmol/d 1.6 2.2 2.2 2.0 0.30 0.53 0.57 0.22
Xanthine plus Hypoxanthine, mmol/d 0.98ab
1.20a 0.99
ab 0.83
b 0.09 0.76 0.06 0.04
Total PD excretion, mmol/d 8.5 12.0 10.3 12.7 0.70 0.001 0.09 0.48
Purine bases3, g/kg dry matter 62.7 67.9 68.3 70.09 1.03 0.005 0.002 0.12
N in microbial pellet, g/kg dry matter 54.0 58.4 57.2 60.2 1.73 0.05 0.18 0.70
Puirne N/Microbial N 0.085 0.085 0.087 0.085 0.003 0.71 0.63 0.65
Microbial NAN supply4, g/d 10.0 14.1 11.8 15.0 1.05 0.005 0.22 0.64
1n = 4 for each treatment.
2Protozoa = PDFAUN vs. FAUN; BP = barley grain processing (DRB vs. PB); Protozoa x BP = interaction. Partial defaunation was
achieved by the addition of 6% (DM basis) linoleic acid-rich sunflower to the diet.
3Purine bases are expressed as g yeast RNA
4Microbial NAN supply was calculated according to Chen and Gomes
(24), using determined purine N:microbial N ratios.
a,bMeans within a row with different superscripts differ (P < 0.05).
94
Page 115
95
5.5 Discussion
Partial defaunation had no impact on DM intake, which is in contrast to our previous
study (Kiran and Mutsvangwa, 2010) in which we observed a decrease in DM intake in
PDFAUN lambs. Lambs that were used in the current study were heavier (+17 kg) and older than
those that were used in our initial study, and this could partly explain why responses in DM
intake were different. As expected based on previous studies in which SFO was used as a
defaunating agent (Kiran and Mutsvangwa, 2010; Ivan et al., 2001), ruminal protozoal counts
decreased substantially within 6 d after the initiation of feeding SFO. Feeding PB also resulted in
a decrease in ruminal protozoal counts when compared with DRB, supporting previous studies
that have reported decreases in ruminal protozoal populations in ruminants fed extensively-
processed barley (Koenig et al., 2003; Eadie et al., 1970). The major changes that were observed
in ruminal fermentation characteristics i.e., a decrease in ruminal NH3-N, total VFA, acetate and
butyrate concentrations, and an increase in ruminal propionate concentration, are typical of
changes that are associated with partial or complete defaunation (Ivan et al., 2001; Koenig et al.,
2000; Newbold et al., 1986). Ruminal pH was higher in PDFAUN lambs compared to FAUN
lambs, which also is in agreement with other research (Kiran and Mutsvangwa, 2010; Ivan et al.,
2001; Ivan et al., 2004).
Total tract digestibilities of DM, OM, starch, N, ADF, and NDF were unaffected by
protozoal status, supporting previous findings (Kiran and Mutsvangwa, 2010). It appears that,
because of the inhibition of protozoal activities in the rumen, most of the available data when
high oil diets are fed to achieve partial or complete defaunation indicate a decrease in ruminal
OM or fiber digestion (Oldick and Firkins, 2000; Faichney et al., 2000). If ruminal fiber
digestion was depressed by feeding SFO in the present study, this was compensated for post-
ruminally as total tract digestibilities were not affected. Both in situ ruminal and total tract starch
digestibility were greater with PB compared to DRB. In common with the present study, Yang et
al. (2000) reported increases in ruminal and total tract starch digestion as the extent of barley
grain processing was increased in dairy cows fed barley-based diets. Our results suggest that the
lower ruminal digestion of DRB (as reflected by the lower in situ degradation kinetics relative to
PB) was not compensated for by greater intestinal digestion, which supports previous findings
(Yang et al., 2000).
Page 116
96
In ruminants, protozoa impose inefficiencies in N utilization at a number of different
levels, and the eradication of ruminal protozoa typically improves N utilization (Jouany, 1996).
In the present study, FAUN and PDFAUN lambs had similar N intakes and fecal N losses;
however, total N excretion decreased by 3.7 to 4.1 g/d in PDFAUN lambs, with a large fraction
of this decrease in total N excretion being accounted for by a decrease in urinary urea-N
excretion. Consequently, PDFAUN lambs retained 2.3 to 2.9 g/d more N when compared to
FAUN lambs, thus suggesting a greater efficiency of N utilization with defaunation as has been
reported by others (Kiran and Mutsvangwa, 2010; Jouany, 1996). This improved N utilization in
defaunated ruminants is accounted for by various mechanisms, including a decrease in the
ruminal NH3-N pool, coupled with a greater sequestration of NH3-N into bacterial protein
(Firkins et al., 2007), a decrease in intra-ruminal N recycling (Jouany, 1996), and an increase in
microbial N flow to the duodenum by 20 to 60% (Jouany, 1996; Koenig et al., 2000). Besides the
change in protozoal status, associated changes in energy supply and ruminal VFA patterns could
also be partly responsible for improving the efficiency of post-absorptive N use in PDFAUN
lambs. Assuming that the energy content of SFO is 8.8 Mcal/kg, dietary supplementation with
6% SFO increased energy intake of PDFAUN lambs by 0.95 to 1.04 Mcal of GE/d, and this
additional energy intake could have influenced post-absorptive N use. In growing steers,
increasing energy intake by abomasally infusing 150 g/d of a mixture of fatty acids (equivalent
to an additional 1.3 Mcal of GE/d) decreased urinary N excretion and increased N retention
(Schroeder et al., 2006), similar to our current findings. Also, the shift in ruminal VFA
proportions that was observed with feeding SFO, with more propionate and less acetate,
provided additional glucogenic substrate that could have altered N use. In addition to improving
propionate supply, supplemental SFO also could have provided another potential glucose
precursor (glycerol) that could have improved N use. In ruminants wholly nourished by intra-
gastric infusion, supplementation with glucogenic precursors improved N retention (Chowdhury
et al., 1997; Ørskov et al., 1999). This suggests that providing glucogenic precursors can
potentially spare amino acids from being used for gluconeogenesis, thus making more amino
acids available for protein accretion.
A major objective of the present study was to determine the effects of defaunation on
urea-N transfer to the GIT and the anabolic utilization of the recycled urea-N in lambs. Our
current data on urea-N recycling kinetics offers interesting insights into additional potential
Page 117
97
mechanisms by which ruminal defaunation could improve N utilization. The UER was similar in
FAUN and PDFAUN lambs, reflecting the similar N intakes, as N intake and UER are positively
correlated (Marini et al., 2004; Wickersham et al., 2009). However, the GER, when expressed in
absolute amounts or as a proportion of UER, was higher in PDFAUN compared to FAUN lambs.
Concomitant with these changes in GER, UUE when expressed in absolute amounts or as a
proportion of UER was lower in PDFAUN when compared to FAUN lambs. Also, although
there were no differences between FAUN and PDFAUN lambs in the absolute amounts of ROC,
the GER/ROC ratio tended to be lower in PDFAUN compared to FAUN lambs. When taken
together, these data clearly indicate that increased urea-N recycling to the GIT is also a major
contributor to the improved N utilization that has been consistently observed in defaunated
ruminants. In our previous research, partial defaunation was associated with a higher proportion
of endogenous urea-N production being recycled to the GIT; however, N intake was lower in
partially-defaunated compared to faunated sheep in that study (Kiran and Mutsvangwa, 2010).
Because of the positive correlation between N intake and hepatic output of urea-N (Marini et al.,
2004; Wickersham et al., 2009), data on urea-N recycling kinetics were confounded due to these
differences in N intake. In the present study, N intake did not differ due protozoal status, thus
allowing more definitive conclusions to be made on the effects on urea-N kinetics of
defaunation.
Endogenous urea-N can diffuse through all compartments of the GIT (Lapierre and
Lobley, 2001) and, although the [15
N15
N]-urea infusion technique that was used in the present
study cannot distinguish between urea-N transfer to the fore-stomach and post-stomach
compartments, measurements of urea-N recycling to the GIT obtained using arterio-venous
preparations indicated that in concentrate-fed ruminants (as in the present study), 65 to 76% of
urea-N transfer to the GIT entered the fore-stomachs (Huntington, 1989; Reynolds and
Huntington, 1988). It is urea-N that is transferred to the fore-stomachs that can provide
additional degradable N than be incorporated into microbial protein, thus contributing amino
acids to the host animal after intestinal digestion. In the present study, however, direct
incorporation of recycled 15
N into microbial protein was not measured; rather, anabolic
utilization (UUA) as part of the isotopic technique was measured, in addition to estimating
microbial NAN supply based on urinary excretion of PD (Chen and Gomes, 1992). The anabolic
utilization of recycled urea-N within the GIT, particularly the rumen, is assumed to be
Page 118
98
predominantly as sequestration of liberated NH3-N into microbial protein as most of the recycled
urea-N first passes through the microbial N pool (Lobley et al., 2000), but other potential
anabolic uses within the body could include amination and transamination reactions (Lobley et
al., 2000). The ability to partition how much of the GER is directed towards anabolic and
catabolic fates is a major advantage of this isotopic technique; however, a limitation is that UUA
is calculated as the difference between GER and (ROC + UFE) and therefore contains all
cumulative errors. Because fecal 15
N enrichments failed to attain a definite plateau, UFE was
likely underestimated; as such UUA was likely overestimated, so our data on UUA should be
interpreted somewhat cautiously. However, when we used a curve fitting approach using the
daily fecal 15
N enrichments over the 4-d isotopic infusions (data not shown) to estimate plateau
(maximum) enrichments, the measured “plateau” enrichments were only 3.1 to 6.3% lower than
the mathematically-derived “plateau” enrichments. This suggests that UUA was only slightly
overestimated. Others (Lobley et al., 2000; Sunny et al., 2007) have also reported a failure of
fecal 15
N enrichments to attain a definite plateau with 4-d isotopic infusions, so future studies
should consider isotopic infusions longer than 4 d. For PDFAUN lambs, 0.546 of GER was
directed towards anabolic fates, compared to only 0.456 for FAUN lambs. Furthermore, the
ROC/GER ratio was 0.082 units lower for PDFAUN compared to FAUN lambs, suggesting that
more of the GER was used for productive purposes in PDFAUN compared to FAUN lambs. In
support of our findings of the improved productive use of recycled urea-N by partial defaunation,
microbial NAN supply was 27 to 41% greater in PDFAUN compared to FAUN lambs. It is
plausible that urea-N that was recycled to the rumen could have buffered the rumen from the
lower NH3-N concentrations prevailing in PDFAUN lambs, thus providing additional N that
could be used for microbial protein synthesis. Additionally, because fat provides little energy for
microbial growth (Wu and Palmquist, 1991), the positive response in intestinal microbial NAN
flow when ruminal protozoal populations are decreased has also been attributed to decreased
protozoal predation on bacteria and decreased competition from protozoa for growth substrates
(Jouany, 1996). In calculating microbial NAN supply, we used purine N:N ratios that were
determined in bacteria; however, microbial NAN supply in faunated and, to a much smaller
extent, partially-defaunated lambs was constituted of both bacterial and protozoal N. Because the
purine N:N ratio has been reported to be higher for bacteria than protozoa (Firkins et al., 1987)
and only the purine N:bacterial N ratio was used to calculate microbial NAN supply, it is
Page 119
99
possible that microbial NAN supply was underestimated particularly in faunated lambs (Koenig
et al., 2000). Nonetheless, despite these limitations our data support previous findings of a
greater microbial NAN flow to the intestine when ruminal protozoal populations are decreased
(Jouany, 1996; Koenig et al., 2000).
The major mechanism that could be responsible for the greater urea-N transfer to the GIT
that was observed in partially protozoa-free lambs is plausibly the lower ruminal NH3-N
concentration that was observed in these lambs compared to faunated lambs. Elevating ruminal
concentration of NH3-N has been demonstrated to reduce urea-N transfer from blood into the
rumen (Rémond et al., 1996). Also, other evidence indicates that the trans-epithelial movement
of urea-N by passive diffusion into the rumen is facilitated by bacterial urease activity, which
maintains a favorable concentration gradient (Rémond et al., 1996). Cheng and Wallace (1979)
demonstrated that urease activity in ruminal contents was negatively correlated with ruminal
NH3-N concentration. Because partial defaunation of the rumen resulted in a lower ruminal NH3-
N concentration, this could have facilitated the transfer of a greater proportion of UER to the
GIT in PDFAUN compared to FAUN lambs. In addition, the change in propionate supply could
also have altered urea-N transfer to the GIT. Feeding SFO to partially defaunate the rumen
increased ruminal concentrations of propionate and, presumably, the absorption of propionate
from the rumen as this is a concentration-dependent process (Van Soest, 1994). Propionate
supplementation via intra-ruminal (Savary-Auzeloux et al., 2003) or intra-abomasal (Kim et al.,
1999) infusion in sheep was associated with greater urea-N recycling to the GIT and N retention.
The mechanism by which propionate increases urea-N recycling to the GIT is unclear, but it may
be related to an alteration in ruminal bacterial activities and metabolism (Savary-Auzeloux et al.,
2003), or changes in ruminal epithelial surface area and/or permeability (Abdoun et al., 2007) as
propionate has been shown to stimulate epithelial cell proliferation (Sakata and Tamate, 1978).
Increasing ruminal energy availability by feeding PB compared to DRB decreased UUN
and increased N retention, supporting previous studies (Theurer et al., 2002; Taniguchi et al.,
1995). These positive effects on N utilization of increasing ruminal energy availability have been
partly mediated via increased urea-N recycling to the rumen (Kennedy and Milligan, 1980;
Huntington, 1989; Theurer et al., 2002) in addition to a greater sequestration of N into microbial
protein that is then available for intestinal digestion (Theurer et al., 1999). Surprisingly, in the
Page 120
100
present study, all the major dependent variables quantifying urea-N recycling kinetics (i.e., UER,
GER, UUA, and ROC) were unaffected by barley grain processing, contradicting previous
studies (Huntington, 1989; Theurer et al., 2002). The magnitude of urea-N transfer across the
ruminal wall appears to be regulated by many intra-ruminal factors, including ruminal pH
(Rémond et al., 1996). In the present study, lambs that were fed PB exhibited a lower ruminal pH
compared to those fed DRB. A more acidic ruminal environment in lambs fed PB could have
decreased bacterial urease activity in the rumen (Gozho et al., 2008) which, in turn, might have
impaired urea-N transfer due to an unfavorable concentration gradient. Also, new evidence
obtained using an in vitro isolated ruminal epithelium model indicates that urea-N transport is
inhibited at luminal pH < 6.0 (Abdoun et al., 2010), and mean pH in lambs fed PB was 5.8
compared to 6.0 for those fed DRB. Another surprising observation from the present study was
that feeding PB did not stimulate microbial NAN supply when compared to feeding DRB,
contradicting previous studies (Reynolds and Huntington, 1988; Sunny et al., 2007). It is well-
established that the amount of microbial protein that is synthesized in the rumen is largely driven
by the availability of energy from RFC. In the present study, in situ measurements of ruminal
starch digestion clearly indicate that starch digestion was greater for PB compared to DRB. Also,
total tract starch digestion was greater in lambs fed PB compared to those fed DRB. Together,
these observations would suggest that, quantitatively, ruminal energy supply was greater with PB
compared to DRB, so it is not clear why microbial NAN supply was not stimulated with PB.
Because the diets that were fed in this study contained only 16 g N/kg DM, it is likely that the
rumen was limited in both NH3-N and amino acids to support microbial growth. Feeding PB to
increase ruminal ATP availability when NH3-N and amino acids were potentially in short supply
could have limited the use of the additional ATP for microbial protein synthesis (Russell, 2007).
In that situation, the additional ATP could have been directed towards non-growth functions, a
phenomenon referred to as energy spilling (Russell, 2007). In addition, Russell and Wilson
(1996) observed inhibitory effects on microbial protein synthesis when ruminal pH was <6.2 and
this was partly attributed to increased energy spilling (Russell, 2007). In the present study, it is
plausible that the more acidic ruminal environment in lambs fed PB could have compromised
microbial growth by increasing energy spilling.
The presence of carrier-mediated, facilitative UT-B proteins has been demonstrated in the
rumen of bovine (Marini and Van Amburgh, 2003; Stewart et al., 2005) and ovine (Marini et al.,
Page 121
101
2004), and these UT-B proteins have been suggested to facilitate urea-N flux into the GIT lumen
(Lapierre and Lobley, 2001). Our data indicate that changes in urea-N transfer to the GIT as a
result of defaunation occurred without concomitant changes in UT-B expression, suggesting that
the effects of ruminal NH3-N and propionate on urea-N transfer are probably not mediated
through changes in UT-B expression. Recently, Simmons et al. (2009) reported differences in
UT-B expression between forage- and concentrate-fed steers, but ruminal NH3-N concentration
was unaltered and changes in ruminal VFA profiles were minimal. The limited research that is
available on dietary regulation of UT expression in ruminal epithelium is equivocal (Marini et
al., 2004; Marini and Van Amburgh, 2003; Stewart et al., 2005), and additional research is
needed to delineate the effects of diet and ruminal metabolites on UT expression.
5.5 Conclusions
Collectively, these results provide the first major evidence that, at similar N intakes, the
improved N utilization that is typically observed in defaunated ruminants is partly mediated by
an increase in urea-N transfer to the GIT and its anabolic use. This increase in urea-N recycling
to the GIT in partially-defaunated ruminants could be partly mediated by the decrease in ruminal
NH3-N level, which has been demonstrated to stimulate trans-epithelial urea-N transfer.
However, feeding SFO increased energy intake, in addition to altering the profile of energy
metabolites entering portal blood from the rumen, and these changes in energy intake and energy
metabolites could also be partly responsible for the observed changes in urea-N recycling and N
utilization. Although partial defaunation increased urea-N recycling to the GIT, the response was
not augmented by increasing the amount of energy that is derived from carbohydrate
fermentation in the rumen.
Page 122
102
6. FEEDING OSCILLATING DIETRAY PROTEIN CONCENTRATIONS
INCREASES NITROGEN UTILIZATION IN GROWING LAMBS AND THIS
RESPONSE IS PARTLY ATTRIBUTABLE TO INCREASED UREA TRANSFER
TO THE RUMEN1
6.1 Abstract
The objective of this study was to determine the effects of feeding oscillating dietary
crude protein (CP) compared to static dietary CP concentration on N retention and in vitro urea
flux across ruminal epithelia. Twenty-seven Suffolk wether lambs (25.6 ± 4.8 kg initial body
weight (BW)) were blocked by BW into 9 groups of 3 and lambs within each group were then
randomly assigned to one of three dietary treatments (n = 9). Dietary treatments consisted of a
medium CP diet (MEDIUM; 12.8% CP) or diets with oscillating CP content (OSC) fed in two
different sequences i.e., 2 d of low CP (9.7% CP) followed by 2 d of high CP (16.1% CP; OSC-
HIGH) or vice-versa (OSC-LOW). Diet adaptation was for 24 d, followed by 8 d of total urine
and feces collection. On d 33, lambs were slaughtered 4 h after the morning feeding, such that
those on the OSC-LOW and OSC-HIGH treatments were slaughtered on the third day of
receiving the low or high CP diets, respectively. Ruminal epithelial tissues were collected and
mounted in Ussing chambers under short-circuit conditions and the serosal-to-mucosal urea flux
(Jsm-urea) was measured using 14
C-urea. The serosal buffer (pH of 7.4) included 1 mmol/L urea,
whereas the mucosal buffer (pH of 6.2) had no urea added. Ruminal NH3-N concentration was
lower (P = 0.001), whereas ruminal pH was higher (P = 0.03) in lambs fed the OSC-LOW
compared to those fed the OSC-HIGH diet. Although N intake was similar (P = 0.52), retained
N (P = 0.001) and microbial N supply (P = 0.001) were greater in lambs fed the OSC diets
compared to those fed the MEDIUM diet. The total Jsm-urea was higher (P = 0.001) in lambs fed
the OSC-LOW compared to those fed the OSC-HIGH diet. Across diets, the addition of phloretin
(a known specific inhibitor of facilitative urea transporter-B; UT-B) reduced Jsm-urea; however,
phloretin-insensitive Jsm-urea was the predominant route for transepithelial urea transfer. Taken
together, these data indicate that feeding oscillating dietary CP concentrations improves N
1A version of this chapter has been accepted for publication: Kiran, D., G. B. Penner, and T. Mutsvangwa. 2010.
Feeding oscillating dietary protein increases nitrogen utilization in growing lambs and this response is partly
attributable to increased urea transfer to the rumen. Journal of Nutrition (in press).
Page 123
103
retention partly by increasing urea recycling to the rumen when animals are fed low CP diets, but
the greater rates of urea transfer cannot be attributable to upregulation of UT-B.
6.2 Introduction
In ruminants, the conversion of dietary N into edible protein products such as meat and
milk is very low (20 to 30%), with the majority of dietary N (70 to 80%) being excreted in feces
and urine (Tamminga, 1992; Wessels and Titgemeyer, 1997). In an effort to improve
environmental stewardship associated with intensive livestock operations, there is interest to
adopt feeding practices that enhance N efficiency in ruminants. Several studies have
demonstrated that feeding diets with oscillating CP concentrations on a 2-d basis (e.g., feeding a
low CP diet for 2 d followed by feeding a high CP diet for 2 d) can enhance N retention in
growing sheep (Cole, 1999; Kiran and Mutsvangwa, 2009) and finishing cattle (Cole et al., 2003;
Ludden et al., 2003). Cole (1999) proposed that the increase in N retention in ruminants fed
oscillating dietary CP could, inter alia, be attributed to increased urea recycling to the rumen. To
test that hypothesis, Archibeque et al. (2007) conducted a study using growing wethers fitted
with chronic indwelling catheters and fed high concentrate diets with oscillating or static CP
concentrations. They reported that, at similar N intakes, urea recycling to the PDV only tended to
be greater with the oscillating treatment. Thus, it was not possible to definitively attribute the
improved N retention with oscillating CP diets to greater rates of urea transfer to the gut.
Urea recycling provides a source of ruminally available N for microbial protein synthesis
under most dietary conditions; however, it becomes more important when the dietary N supply is
deficient (Lapierre and Lobley, 2001). Although passage of urea from blood into the rumen can
occur via simple diffusion, the presence of carrier-mediated, facilitative UT-B proteins in
ruminants has been demonstrated (Ritzhaupt et al., 1997; 1998), and various groups (Lapierre
and Lobley, 2001; Marini and Van Amburgh, 2003; Marini et al., 2004) have proposed that UT-
B may have a functional role in urea transfer into the rumen. Recently, Muscher et al. (2010)
quantified urea flux across isolated ruminal epithelia in Ussing chambers and observed that when
the dietary CP concentration ranged from 7 to 14%, phloretin (a known specific inhibitor of UT-
B; Stewart et al., 2005) decreased the serosal-to-mucosal urea flux, but inhibitory effects of
phloretin were absent at 19% CP. These observations suggest that changes in UT-B activity
might modulate urea transfer depending on N status. However, in that study goats were fed static
Page 124
104
dietary CP concentrations for 7 wk. While Muscher et al. (2010) demonstrated that the dietary
CP concentration has profound impacts on urea flux mediated by UT-B, the long-term feeding
strategy imposed by those authors does not explain whether short-term adaptations in urea
transport occur when diets with oscillating CP content are fed.
Therefore, the objective of this study was to determine the effects of feeding oscillating
dietary CP compared to static dietary CP concentrations on whole-body N retention, in vitro
phloretin-sensitive and phloretin-insensitive urea flux across the ruminal epithelia, and microbial
protein production in growing lambs. The hypothesis was that the improvement in N retention
for ruminants fed oscillating dietary CP concentrations can partly be attributed to enhanced urea
flux across ruminal epithelia when the low CP diet is fed during the oscillating cycle.
6.3 Materials and Methods
Twenty-seven Suffolk wether lambs were used in this study, and were cared for and
handled in accordance with the guidelines of the Canadian Council of Animal Care (1993). All
animal use was pre-approved by the University of Saskatchewan Animal Care Committee
(UCACS Protocol No. 20040048).
6.3.1 Animals, Experimental Treatments and Feeding Management
Lambs were housed in a temperature-controlled environment (18 to 22°C) at the
University of Saskatchewan. Lambs were weighed at the beginning of the experiment (26.2 ±
4.0 kg initial BW) and blocked by BW into 9 blocks of 3. Within each block, lambs were
randomly assigned to 1 of 3 dietary treatments. Because only three lambs could be slaughtered
per week to obtain tissue samples for in vitro studies at the end of the collection period,
stratifying the animals into blocks was necessary so that complete blocks could be started on
treatment staggered over time. The dietary treatments consisted of a static dietary CP level
(MEDIUM; 127 g CP/kg DM) or 1 of 2 regimens where dietary CP was oscillated between a low
CP (103 g CP/kg DM) and a high CP (161 g CP/kg of DM) diet on a 48-h basis (OSC-HIGH i.e.,
lambs on the OSC-HIGH received the high CP diet for 2 consecutive days followed by the low
CP diet for 2 consecutive days over 8 d, such that these lambs were receiving the high CP diet
when they were killed on d 33) or vice-versa (OSC-LOW). The separation of the OSC treatments
into OSC-LOW and OSC-HIGH allowed for equal representation of each OSC sequence across
Page 125
105
all days within the 8-d collection period (i.e. to cover 2 oscillating cycles of 4 d/cycle) for N
balance measurements, and allowed for the measurement of urea flux across isolated ruminal
epithelia obtained from lambs consuming the low CP (i.e. OSC-LOW) and the high CP (i.e.
OSC-HIGH) diets within the OSC cycle. The static (MEDIUM) CP concentration met the CP
requirement of 25-kg lambs for BW gains of 300 g/d (NRC, 1985), whereas the low and high CP
concentrations were below and above CP requirements (NRC, 1985), respectively. However, the
total CP intake in lambs fed the OSC dietary CP regimens over a 4-d oscillating cycle was
similar to that of lambs fed the MEDIUM diet. All experimental diets were offered in the form of
a pellet for ad libitum intake. Lambs were fed twice daily at 0900 and 1700 h, and had free
access to water. The ingredient and chemical compositions of the diets are presented in Table
6.1. The in vivo portion of the study consisted of 24 d for dietary adaptation and 8 d for data and
sample collection. Lambs were weighed at the start of the dietary adaptation and at the end of
the sample collection periods. During dietary adaptation, lambs were housed individually in
pens (1.5 m2) and were placed in metabolism crates for measurement of N balance.
6.3.2 Nitrogen Balance Measurements
Lambs were provided with 3 d of acclimation to the metabolism crates prior to
conducting measurements. During the 8-d data and sample collection period (d 25 to d 32),
individual lamb feed intake was recorded daily. Samples of the diets and orts were collected
daily, stored at -20°C, and composited by lamb prior to chemical analysis. To measure fecal N
excretion, lambs were fitted with a harness attached to a nylon bag positioned for total fecal
collection. Bags were emptied daily immediately prior to the 0900 feeding and the total daily
fecal output for each lamb was recorded. Subsequently, individual fecal samples were mixed
thoroughly and a sub-sample accounting for 50% of the total daily fecal weight (wet basis) was
collected daily and stored at -20°C. Urine was collected into sealed plastic containers placed
below metabolism crates and was acidified with 50 mL of 12 M HCl to maintain the urine pH
between 2 to 3. Acidification was used to prevent bacterial growth and the loss of NH3-N. Total
urine output was recorded daily.
Page 126
106
Table 6.1. Ingredient and chemical composition of experimental diets
Item LOW MED HIGH
Ingredients, % DM
Barley, dry rolled 58.9 52.2 43.5
Alfalfa meal 3.5 3.5 3.5
Canola meal 0.3 0.5 1.0
Oat hulls 24.5 24.5 24.5
Soybean meal 0.3 8.0 15.0
Corn gluten meal 0.3 0.5 1.0
Dry distiller‟s corn grain 1.7 1.0 1.0
Canola oil 1.0 1.0 1.0
Liquid molasses 2.0 2.0 2.0
Ground limestone 4.0 4.0 4.0
Salt, Co-I1 0.7 0.7 0.7
Salt white 1.3 1.3 1.3
Mineral-vitamin supplement2 1.0 1.0 1.0
Chemical composition
DM, % 92.4 92.7 91.5
OM, % of DM 89.8 90.0 89.8
CP, % of DM 10.3 12.7 16.1
RDP3, % of CP 64.8 64.9 64.5
NDF, % of DM 34.6 31.7 34.2
ADF, % of DM 15.3 14.5 15.4
1Salt, cobalt and iodine mix: Co, 100 mg/kg; and I, 150 mg/kg.
2Provided (per kg of concentrate DM): CuO, 3.3 mg; ZnO, 22 mg; MnO, 18.5 mg; vitamin A,
1,495 IU; vitamin D, 125.5 IU; vitamin E, 22 IU; and sodium selenite, 0.1 mg.
3Calculated according to NRC (1985) guidelines.
Page 127
107
Each day, a sample accounting for 20% of the total urine output was collected and
composited by lamb. Composited samples were stored at -20°C for determination of total N. In
addition, a 2-mL sub-sample of urine was diluted with 8 mL of distilled water and stored at -
20°C for determination of urea-N and PD.
6.3.3 Ussing Chamber Measurements
On d 33, lambs were killed by captive bolt stunning followed by exsanguination at 4 h
after the morning feeding. This time was chosen to coincide with the post-prandial peak in PUN
concentration (Kiran and Mutsvangwa, unpublished data from Chapter 4; Appendix Figure I).
Following an incision into the abdomen, the entire gastrointestinal tract was removed from the
abdominal cavity within 3 to 4 min after killing and approximately 150 cm2 of ruminal wall
tissue was collected from the ventral sac. The ruminal tissue was washed until clean using a
buffer solution containing (mmol/L) 1.0 CaCl2·2H2O, 1.0 MgCl2·6H2O, 2.0 Na2HPO4·2H2O, 1.0
NaH2PO4·H2O, 1.0 phenyl-phosphorodiamidate (urease inhibitor; ABCR GmbH and Co.,
Karlsruhe, Germany), 5.0 butyric acid, 60.0 NaCl, 5.0 KCl, 10.0 glucose, 25.0 Na-acetate·3H2O,
15.0 Na-gluconate, 10.0 Na-propionate, and 25.0 NaHCO3. The buffer solution was maintained
at 37ºC, pH 7.4, and saturated with carbogen (95% O2 and 5% CO2). The pH of the buffer
solution was adjusted using 1 mol/L NaOH. The mucosa was gently separated from the
underlying muscular layers before being transported (within 20 min of slaughter) to the
laboratory in the buffer solution described above.
Simultaneous to the processing of ruminal epithelial tissue for Ussing chamber
experiments, total ruminal contents were evacuated into a clean plastic container. Ruminal
contents were mixed and a homogeneous sample was collected and strained through two layers
of cheesecloth. The pH of the strained ruminal fluid was immediately determined using a
portable pH meter (Model 265A, Orion Research Inc., Beverley, MA). Subsequently, a 10-mL
aliquot of ruminal fluid was preserved with 2 mL of metaphosphoric acid (25% wt/vol) and a
second 10-mL aliquot was preserved with 2 mL of 1% sulfuric acid. Ruminal fluid samples
were stored at -20°C for subsequent analysis. A 200-ml sub-sample of ruminal fluid was stored
at -20°C for later isolation of ruminal bacteria.
Page 128
108
In the laboratory, pieces of stripped ruminal epithelia were mounted between two halves
of an Ussing chamber with an exposed surface area of 1.43 cm2. Silicon rubber rings were
positioned on both sides of the epithelia to prevent edge damage. Epithelia were then bathed in
isolated buffer solutions on the mucosal and serosal sides (10 mL/side). The composition of the
mucosal and serosal buffer solutions were the same as the transport buffer, except that they
contained antibiotics (60 mg/L of penicillin G sodium salt, 100 mg/L of kanamycin sulphate, and
50 mg/L of flurocytosine) that, when combined with phenyl-phosphorodiamidate, were designed
to prevent any potential microbial urease activity. The pH of the serosal and mucosal buffer
solutions were adjusted to 7.4 and 6.2, respectively, using 3 mol/L gluconic acid or 1 mol/L
NaOH to mimic physiological conditions in vivo. This approach has been implemented in
previous studies (Penner et al., 2009, 2010). Moreover, Abdoun et al. (2010) showed that
maximal transepithelial flux of urea across the isolated epithelia occurred at a pH near 6.2 (in the
presence of SCFA). Epithelia were incubated under short-circuit conditions using a computer-
controlled voltage-clamp device (VCC MC6; Physiologic Instruments, San Diego, CA).
Throughout the incubations, measurements of transepithelial conductance (Gt) were collected
every 20 seconds and mean Gt values were then calculated for every 5-min period. Bathing
solutions were maintained at 38ºC using water-jacket reservoirs and were circulated using gas lift
(95% O2/5%CO2).
For the measurement of the serosal-to-mucosal urea flux, a 20-min equilibration period
was provided for stabilization of electrophysiology, after which a urea solution spiked with 14
C-
urea (37 kBq/10 mL; Perkin-Elmer Corp., Waltham, MA) was added to the serosal side to
achieve a final urea concentration of 1 mmol/L. Thus, a urea concentration gradient from the
serosal to mucosal side was imposed to mimic physiological conditions in vivo. This was based
on the lack of urea in ruminal fluid (Muscher et al., 2010) and because the serosal-to-mucosal
transepithelial movement of urea is facilitated by a concentration gradient between the blood and
the rumen (Vercoe, 1969; Sunny et al., 2007). After the addition of 14
C-urea, an additional 45-
min isotope equilibration period was implemented. For each lamb, 4 mounted tissues were
ranked based on mean Gt values observed during the 20-min electrophysiology equilibration
period, and then assigned to one of 2 in vitro treatments (SHAM vs. PHLORETIN; n = 2) such
that the treatments were balanced for mean Gt values. The serosal-to-mucosal urea flux (Jsm-urea)
across the ruminal epithelia was measured in two 30-min consecutive flux periods, with the
Page 129
109
initial 30-min flux period being baseline (i.e., no in vitro treatments were applied). At the start of
the second flux period, phloretin dissolved in ethanol was added (to achieve a final concentration
of 1 mmol/L) to the serosal bathing solution for 2 epithelia (PHLORETIN tissues) to measure
phloretin-insensitive Jsm-urea flux. The same volume of ethanol was added to the serosal bathing
solution for the SHAM tissues. All chemicals (reagent grade), antibiotics, and phloretin were
obtained from Sigma-Aldrich (Oakville, ON, Canada), unless otherwise indicated.
6.3.4 Sample Analyses
Frozen samples of the experimental diets, orts, and feces were thawed overnight at room
temperature and analyzed for DM by drying in an oven at 60°C for 48 h (AOAC, 1995; method
930.15). The dried samples were then ground to pass through a 1-mm screen using a Christy-
Norris mill (Christy and Norris Ltd., Chelmsford, England). Ground samples were pooled by
lamb and analyzed for OM (AOAC, 1995; method 942.05), N using the macro-Kjeldahl
procedure (AOAC, 1995; method 2001.11), and ADF and NDF (Van Soest et al., 1991).
Amylase and sodium sulfite were used for neutral detergent fiber determination.
Preserved ruminal fluid samples were analyzed for VFA by GC as described by Erwin et
al. (1961), and for NH3-N using a phenol-hypochlorite assay (Broderick and Kang, 1980).
Frozen ruminal fluid samples for bacterial isolation were thawed at room temperature and
centrifuged at 20,000 x g at 4°C for 20 min, and the supernatant fraction was discarded. The
microbial pellet was washed with double-distilled water and again centrifuged at 20,000 x g at
4°C for 20 min and this process was repeated two more times (Makkar and Becker, 1999). The
microbial pellet was then freeze-dried, ground with a mortar and pestle, and analyzed for total N
and individual purines as described by Makkar and Becker (1999). Daily urine samples (2 mL)
that were diluted with distilled water (8 mL) were pooled by lamb proportionally to daily urine
output and analyzed for allantoin, xanthine and hypoxanthine (Chen and Gomes, 1992), and for
uric acid by a quantitative enzymatic colorimetric method using a commercial assay kit (Stanbio
Uric Acid Liquicolor Kit, Procedure No. 1045; Stanbio Laboratories, Boerne, TX). Total PD
excretion per day was calculated as allantoin + uric acid + xanthine plus hypoxanthine. The
microbial NAN supply was calculated based on total PD excretion in urine (Chen and Gomes,
1992), using the determined purine N:microbial N ratios and BW measurements obtained on d
Page 130
110
33. Urinary urea-N (UUN) was determined by the diacetyl monoxime method (Marsh et al.,
1957) using a commercial kit (Stanbio Urea-N Kit, Procedure No. 0580; Stanbio Laboratories).
6.3.6 Calculations and Statistical Analysis
Data on DM, OM, and N intakes, N balance, ruminal fermentation characteristics, and
microbial NAN supply were analyzed using the Proc Mixed procedure of SAS (2004) for a
randomized complete block design with block and dietary treatment as fixed effects and lambs
within treatment as a random effect. Single degree-of-freedom orthogonal contrasts were used to
determine dietary treatment effects as follows: OSC-HIGH vs. OSC-LOW and MEDIUM vs.
OSC (OSC-HIGH and OSC-LOW).
The phloretin-sensitive portion of Jsm-urea flux was calculated as the difference between
Jsm-urea flux during flux periods 1 (i.e. total Jsm-urea flux) and 2 (phloretin-insensitive Jsm-urea flux)
for tissues assigned to the PHLORETIN treatment in vitro. This method of calculation was used
because there were: 1) no statistical differences (P > 0.05) in Jsm-urea flux between the SHAM and
PHLORETIN treatments during flux period 1 (Appendix Figure IIA); and 2) the Jsm-urea flux did
not differ between flux periods 1 and 2 for the SHAM treatment (Appendix Figure IIB). Thus,
differences in the Jsm-urea flux between flux periods 1 and 2 for tissues assigned to the
PHLORETIN treatment were due to the phloretin-induced inhibition of urea transport. Thus,
based on these observations, within-tissue total Jsm-urea fluxes that are reported in Table 4 are
measurements from flux period 1. Phloretin-insensitive Jsm-urea fluxes are measurements from
flux period 2. The Jsm-urea flux data were analyzed as a split-plot design using Proc Mixed
procedures of SAS (2004). The model included in vivo dietary treatment as the whole-plot factor
and in vitro treatment (SHAM vs. PHLORETIN) as a sub-plot factor. Single degree-of-freedom
contrasts were used to determine dietary treatment effects as follows: OSC-HIGH vs. OSC-LOW
and MEDIUM vs. OSC (OSC-HIGH and OSC-LOW). Within in vivo treatment groups, the
effect of the addition of phloretin on Jsm-urea fluxes (i.e., total vs. phloretin-insensitive Jsm-urea flux)
was analyzed using the paired Student‟s t-test in SAS (2004). The relationships between Gt and
Jsm-urea flux, and between ruminal NH3-N concentration and Jsm-urea flux were tested using linear
regression using the Proc Reg option in SAS (2004). Significance was declared when P < 0.05,
and tendencies were considered when 0.05 ≤ P < 0.10.
Page 131
111
6.4 Results
6.4.1 Dry Matter and Organic Matter Intake, Organic Matter Digestibility and N Balance
Dry matter intake tended to be higher (P = 0.06) in lambs fed the MEDIUM compared to
those fed the OSC diets, but it was not different between lambs fed the OSC-LOW and OSC-
HIGH diets (Table 6.2). Organic matter intake was greater (P = 0.05) for lambs fed the
MEDIUM compared to those fed the OSC diet, reflecting the observed differences in DM intake.
Despite increased OM intake for lambs fed the MEDIUM diet, total-tract OM digestibility was
not affected by treatment. Nitrogen intake was similar between lambs fed the MEDIUM or OSC
diets. However, N excreted in feces (P = 0.009) and urine (P = 0.02) was 16% and 13% lower in
lambs fed the OSC compared to those fed the MEDIUM diet. Consequently, total N excretion,
when expressed as absolute amounts (P = 0.006) or as a proportion of N intake (P = 0.004), was
lower, and N retention, when expressed as absolute amounts (P = 0.02) or as a proportion of N
intake (P = 0.004), was higher in lambs fed the OSC compared to those fed the MEDIUM diet.
Lambs fed the OSC diet gained 64.2 g/d more (P = 0.02) BW compared to those fed the
MEDIUM diet. As expected, BW gain and N balance were not different between lambs fed the
OSC-LOW and OSC-HIGH diets.
6.4.2 Ruminal Characteristics
Ruminal pH did not differ (P = 0.26) between lambs fed the MEDIUM or OSC diets;
however, ruminal pH was higher (P = 0.03) in lambs fed the OSC-LOW compared to those fed
the OSC-HIGH diet (Table 6.3). As expected, ruminal NH3-N concentration was higher (P =
0.001) in lambs fed the OSC-HIGH compared to those fed the OSC-LOW diet. There was no
difference in ruminal NH3-N concentration between lambs fed the MEDIUM or OSC diets.
Ruminal concentration of total VFA tended to be higher (P = 0.09), and that of propionate,
butyrate, isobutyrate, and valerate were higher (P = 0.001), in lambs fed the OSC-HIGH
compared to those fed the OSC-LOW diet. In contrast, the molar proportion of acetate was
lower (P = 0.001) in lambs fed the OSC-HIGH compared to those fed the OSC-LOW diet.
Ruminal concentrations of total VFA, acetate, and propionate were higher (P = 0.001), whereas
that of valerate was lower (P = 0.02), in lambs fed the OSC compared to those fed the MEDIUM
diet.
Page 132
Table 6.2 Dry matter (DM), organic matter (OM) and nitrogen (N) intakes, total-tract OM digestibility, N balance, and mean daily
body weight gain (ADG) in growing lambs fed medium or oscillating (OSC) dietary crude protein content1
Item
Treatments2
SEM
Contrast, P value
MEDIUM OSC-HIGH OSC-LOW OSC-HIGH vs.
OSC-LOW
MEDIUM vs.
OSC
DM intake, g/d 1,512 1,434 1,366 68.5 0.29 0.06
OM intake, g/d 1,361 1,287 1,226 61.5 0.30 0.05
OM digestibility, % 67.1 69.4 68.4 1.1 0.45 0.12
N intake, g/d 30.7 30.5 28.9 1.4 0.26 0.39
Fecal N excretion
g/d 7.2 6.1 6.0 0.32 0.91 0.009
% of total N excretion 30.8 29.4 31.6 1.4 0.15 0.79
Urine N excretion
Total N, g/d 16.3 15.1 13.3 1.2 0.08 0.02
Total N, % of total N excretion 66.2 67.6 65.5 2.3 0.26 0.84
Urea-N, g/d 11.9 10.5 9.7 0.95 0.19 0.004
Total N excretion
g/d 23.5 21.6 19.4 1.3 0.15 0.006
% of N intake 76.4 69.3 66.4 2.5 0.37 0.004
N retention
g/d 7.2 9.3 9.6 0.82 0.79 0.02
% of N intake 23.6 30.7 33.4 2.5 0.37 0.004
112
Page 133
113
Initial body weight, kg/d 24.8 26.2 25.7 1.7 0.69 0.34
Final body weight, kg/d 33.6 36.6 37.1 1.8 0.72 0.03
Total body weight gain, kg 8.8 10.3 11.4 0.8 0.22 0.02
ADG, g/d 276.1 322.9 357.7 24.4 0.22 0.02
1n = 9 for each treatment.
2 Dietary treatments included medium CP (MEDIUM; 127 g CP /kg dry matter) or diets with OSC CP content fed in two different
sequences i.e., 2 d of low CP (103 g CP /kg dry matter) followed by 2 d of high CP (161 g CP /kg dry matter; OSC-HIGH) or vice-
versa (OSC-LOW).
113
Page 134
114
Table 6.3 Ruminal characteristics at the time of slaughter in growing lambs fed medium or oscillating (OSC) dietary crude protein
content1
Item
Treatments2
SEM
Contrast, P value
MEDIUM OSC-HIGH OSC-LOW OSC-HIGH vs.
OSC-LOW
MEDIUM vs.
OSC
pH 5.16 5.12 5.59 0.14 0.03 0.26
NH3-N, mg/dL 7.73 10.11 6.23 0.66 0.001 0.59
VFA concentration, mmol/L
Total 94.73 98.04 96.66 0.69 0.09 0.001
Acetate 56.21 57.68 59.60 0.35 0.001 0.001
Propionate 17.77 18.92 18.06 0.18 0.001 0.001
Butyrate 16.91 17.47 15.92 0.32 0.001 0.49
Isobutyrate 0.84 0.96 0.69 0.04 0.001 0.65
Valerate 1.44 1.54 0.94 0.09 0.001 0.02
Isovalerate 1.49 1.41 1.39 0.09 0.86 0.29
Acetate to propionate ratio 3.16 3.05 3.30 0.05 0.001 0.80
1n = 9 for each treatment.
2 Dietary treatments included medium CP (MEDIUM; 127 g CP /kg dry matter) or diets with OSC CP content fed in two different
sequences i.e., 2 d of low CP (103 g CP /kg dry matter) followed by 2 d of high CP (161 g CP /kg dry matter; OSC-HIGH) or vice-
versa (OSC-LOW).
114
Page 135
115
6.4.3 Microbial NAN Supply
Urinary excretions of allantoin (P = 0.002), uric acid (P = 0.006), and total PD (P =
0.001) were higher in lambs fed the OSC compared to those fed the MEDIUM diet (Table 6.4).
Consequently, microbial NAN supply (expressed as g N/d) estimated using urinary PD excretion
and measured purine N:microbial N ratios, and microbial efficiency (expressed as g/kg of
digestible organic matter in the rumen) were higher (P = 0.001) in lambs fed the OSC compared
to those fed the MEDIUM diet.
6.4.4 Urea Flux Across the Ruminal Epithelium
After the 20-min electrophysiology equilibration period, Gt values were stable (Appendix
Figure III), indicating that tissues were viable throughout the incubation as Gt is an indicator of
tissue integrity (Clarke, 2009). The Gt was largely unaffected (P ≥ 0.13) by diet; however, Gt
tended to be higher (P = 0.09) in ruminal epithelia that was obtained from lambs fed the
MEDIUM compared to those fed the OSC diet (Table 6.5). The total Jsm-urea flux across ruminal
epithelia was 72% greater (P ≤ 0.001) in lambs fed the OSC-LOW compared to those fed the
OSC-HIGH diet. Across dietary treatments, the addition of phloretin on the serosal side resulted
in a 19.5 to 22.3% decrease in Jsm-urea fluxes, and this level of inhibition was significant (P =
0.001). Both the phloretin-insensitive (P = 0.001) and phloretin-sensitive (P = 0.04) Jsm-urea
fluxes were greater in ruminal epithelia that was obtained from lambs fed the OSC-LOW
compared to those fed the OSC-HIGH diet. There were no differences in total, phloretin-
sensitive and phloretin-insensitive Jsm-urea fluxes between ruminal epithelia that were obtained
from lambs fed the MEDIUM or OSC diets. There was no significant correlation (r2 = 0.001; P =
0.99) between Gt and Jsm-urea flux (Figure 6.1), but there was a significant correlation (r2 = 0.29;
P = 0.04) between ruminal NH3-N concentration and Jsm-urea flux (Figure 6.2).
Page 136
Table 6.4 Urinary purine derivative (PD) excretion and microbial non-ammonia nitrogen (NAN) supply in growing lambs fed medium
or oscillating (OSC) dietary crude protein content1
Item
Treatments2
SEM
Contrast, P value
MEDIUM OSC-HIGH OSC-LOW
OSC-HIGH vs.
OSC-LOW
MEDIUM vs.
OSC
Urinary excretion
Total output, kg/d 2.13 1.96 1.61 0.19 0.19 0.15
Allantoin excretion, mmol/d 7.15 7.79 8.10 0.22 0.22 0.002
Uric acid excretion, mmol/d 0.58 0.88 0.79 0.07 0.35 0.006
Xanthine plus Hypoxanthine, mmol/d 1.23 1.01 1.11 0.09 0.45 0.12
Total PD excretion, mmol/d 8.96 9.59 10.09 0.19 0.02 0.001
Purine bases3, g/kg dry matter 77.7 77.2 81.3 2.1 0.26 0.42
N in microbial pellet, g/kg dry matter 65.1 65.9 66.6 1.2 0.63 0.50
Puirne N/Microbial N 0.089 0.088 0.092 0.006 0.19 0.11
Microbial NAN supply4
Microbial N, g/d 9.91 10.82 10.94 0.22 0.56 0.001
Microbial N, g/kg DOMR 16.80 19.09 20.61 1.01 0.12 0.001
1n = 9 for each treatment.
2 Dietary treatments included medium CP (MEDIUM; 127 g CP /kg dry matter) or diets with OSC CP content fed in two different
sequences i.e., 2 d of low CP (103 g CP /kg dry matter) followed by 2 d of high CP (161 g CP /kg dry matter; OSC-HIGH) or vice-
versa (OSC-LOW).
3Purine bases are expressed as g yeast RNA
116
Page 137
117
4Microbial NAN supply was calculated according to Chen and Gomes (1992) using measured purine N:microbial N ratios; DOMR =
digestible organic matter in rumen, which was calculated as 0.65 x DOMI (digestible OM intake) (Chen and Gomes, 1992). Digestible
OM intake was calculated as OM intake x total-tract OM digestibility (data presented in Table 6.2).
117
Page 138
118
Table 6.5 Serosal-to-mucosal urea flux (Jsm-urea) rates in ruminal epithelial tissues obtained from lambs slaughtered after feeding
fed a medium CP diet (MEDIUM) or oscillating (OSC) dietary CP levels1
Item
Treatments2
SEM
Contrast, P value
MEDIUM OSC-HIGH OSC-LOW
OSC-HIGH vs.
OSC-LOW
MEDIUM vs.
OSC
Total Jsm-urea 3
, nmol/cm2/h 148.9 120.9 208.1 14.1 0.001 0.35
Phloretin-insensitive3
Jsm-urea, nmol/cm2/h 120.8 95.2 160.0 12.2 0.001 0.57
% of total 80.5 78.5 77.7 3.6 0.87 0.61
Pholoretin-sensitive3
Jsm-urea, nmol/cm2/h 28.1 25.6 48.1 7.4 0.04 0.35
% of total 19.5 21.5 22.3 3.6 0.87 0.61
1n = 9 for each treatment.
2 Dietary treatments included medium CP (MEDIUM; 127 g CP /kg dry matter) or diets with OSC CP content fed in two different
sequences i.e., 2 d of low CP (103 g CP /kg dry matter) followed by 2 d of high CP (161 g CP /kg dry matter; OSC-HIGH) or vice-
versa (OSC-LOW).
3Within each in vivo dietary treatment, the addition of phloretin on the serosal side resulted in a significant (P = 0.001) inhibition of
Jsm-urea flux across the ruminal epithelia.
118
Page 139
119
Figure 6.1 The relationship between serosal-to-mucosal urea flux (Jsm-urea) across the ruminal
epithelia obtained from lambs (n = 27) with transepithelial conductance (Gt). There was no
significant correlation (r2 = 0.001, slope P = 0.99).
Page 140
120
Figure 6.2 Relationship between serosal-to-mucosal urea flux (Jsm-urea) across the ruminal
epithelia and ruminal ammonia-N concentration (r2 = 0.29, slope P < 0.001) in lambs (n = 27)
fed OSC-LOW, OSC-HIGH and MEDIUM dietary treatments.
Page 141
121
6.5 Discussion
With growing concerns regarding the potential environmental impact arising from
excessive N excretion from ruminants, there is a renewed interest to improve the efficiency of N
utilization in ruminants. Perusal of the literature indicates that the major factor determining total
N excretion in ruminants is total dietary N intake (Castillo et al., 2000; Yan et al., 2000).
Performance studies have demonstrated that limiting dietary N intake of productive ruminants
below requirements as a strategy to minimize N excretion can compromise BW gain and milk
yield (Reynolds and Kristensen, 2008), so this has not been a viable strategy in commercial
ruminant production systems in which edible product output needs to be optimized for
profitability. As an alternative strategy, previous studies have investigated the impact of
oscillating dietary CP concentrations (i.e., alternating between a low and high CP diet on a 2-d
basis) on N utilization. In ruminants fed high concentrate diets, feeding oscillating dietary CP
concentrations on a 2-d basis as compared to feeding static dietary CP at similar daily N intakes
increased N retention in feedlot steers (Cole et al., 2003; Ludden et al., 2003) and sheep (Cole,
1999; Kiran and Mutsvangwa, 2009).
In the present study, even though N intakes were similar, N losses in feces and urine were
lower and, consequently, N retention was higher when dietary CP concentration was oscillated
between 103 and 161 g CP/kg of DM on a 2-d basis, compared to feeding a static (127 g CP/kg
of DM) dietary CP regimen. In addition, when expressed as a percentage of N intake, lambs fed
the OSC diet had a higher N retention compared to those fed the MEDIUM diet, indicating a
more efficient utilization of dietary N. However, it should be noted that N retention was
calculated as N intake-(fecal N + urine N), rather than being determined from slaughter studies.
In such N balance studies, unaccounted N losses during sample collection and processing (e.g.,
volatilization of fecal or urinary N) often result in the overestimation of N retention (Spanghero
and Kowalski, 1997). Assuming that N retention in sheep is 29 g/kg of BW gain (Kohn et al.,
2005), the N retention values of 7.2, 9.3, and 9.6 g/d that were observed in the present study for
the MEDIUM, OSC-HIGH and OSC-LOW lambs, respectively, would correspond to BW gains
of 248, 320, and 331 g/d. These predicted BW gains compare well with the observed BW gains
(276.1, 322.9, and 357.7 g/d), suggesting that any errors in N balance determinations were
minor. Consistent with observed differences in N retention, BW gain was higher in lambs fed the
Page 142
122
OSC compared to those fed the MEDIUM diet, supporting previous research (Cole et al., 2003).
In addition to reduced N excretion, the form of N excreted was also affected. Specifically, UUN
excretion was higher in lambs fed the MEDIUM compared to those fed the OSC diet. From an
environmental standpoint, urinary urea is the most damaging as 50 to 90% of the excreted N is
rapidly volatilized into the atmosphere (Cole, 1999). The reduction in urinary urea excretion
could improve on-farm nutrient management and environmental stewardship by reducing NH3
emissions into the environment (Erickson and Klopfenstein, 2001; Cole et al., 2005). In
agreement with previous work (Cole et al., 2003), ADG was higher in lambs fed the OSC
compared to those fed the MEDIUM diet, indicating that feeding oscillating dietary CP
concentrations also improves animal growth in addition to the environmental benefits.
Although positive influences of feeding oscillating dietary CP concentrations on animal
performance and N utilization have been reported, the underlying mechanisms have received
little attention. Cole et al. (1999) was the first one to propose that, inter alia, the improved N
retention observed in ruminants when dietary CP is oscillated could be due to increased urea
recycling to the rumen. A greater transepithelial transfer of urea from blood into the rumen
during periods of the oscillating cycle when animals are receiving the low CP concentration that
is deficient in N relative to ruminal microbial requirements would provide additional N that can
be used for microbial growth. Although we did not measure the incorporation of recycled urea
into microbial protein, microbial NAN supply was greater in lambs fed the OSC compared to
those fed the MEDIUM diet. Archibeque et al. (2007) reported a numerically greater absorption
of α-amino acids into portal blood in sheep fed oscillating dietary CP concentrations compared to
those fed static dietary CP, thereby suggesting a higher α-amino acid flow to the small intestine
with oscillating dietary CP. To calculate bacterial NAN supply, we used purine N:bacterial N
ratios that were determined in fluid-associated bacteria (FAB); however, the purine N:bacterial N
ratio in FAB has been reported to be higher than that in particle-associated bacteria (PAB), and
the fractional contributions of FAB and PAB to total purine bases arriving at the duodenum can
also differ (Broderick and Merchen, 1992). Because we did not account for these differences, it
is possible that bacterial NAN supply was underestimated. However, it should be noted that
highly-fermentable fiber was fed in this study, so the contribution of PAB to total bacterial
biomass was likely small. Besides the availability of ruminally-fermentable energy, it is well-
established that ruminal NH3 concentration is also a key driver of microbial protein synthesis. In
Page 143
123
vitro studies conducted by Satter and Slyter (1974) indicated that the optimal ruminal NH3
concentration for maximum microbial protein synthesis was 5.0 mg/dL. In the present study,
ruminal NH3 concentrations were >5.0 mg/dL for all diets. However, it should be noted that
ruminal NH3 concentrations were measured at 4 h after feeding when post-prandial ruminal NH3-
N concentrations were likely to be at their peak (Kiran and Mutsvangwa, unpublished data from
Chapter 4; Appendix Figure IV) and it is possible that ruminal NH3 concentrations were below
optimal at other times of the day. It should also be noted that conflicting results have been
reported regarding the optimal ruminal NH3-N concentration for maximum microbial protein
synthesis (Firkins et al., 2006). More recent in vivo studies have provided evidence that the
optimal ruminal NH3 concentrations might be in the range of 11.0 to 11.8 mg/dL (Balcells et al.,
1993; Reynal and Broderick, 2005), suggesting that ruminal NH3 concentrations that were
observed in the present study might have limited microbial growth, particularly in lambs fed the
OSC-LOW diet. Also, Cole (1999) suggested that any potential benefits on N retention of
feeding oscillating dietary CP concentrations can only be realized if there is synchrony between
changes in dietary CP and retention time of digesta in the gut. In sheep fed chopped grass hay-
crushed barley, the mean retention time of digesta in the gut was 47 h (Lindberg, 1985),
suggesting that changes in dietary CP concentrations with the 48-h oscillating CP regimen in the
present study may have been synchronized with retention time of digesta in the gut.
To date, we are aware of only one study (Archibeque et al., 2007) that has investigated
the quantitative transfer of urea into the rumen in ruminants fed high concentrate diets with
oscillating dietary CP concentrations. In that study using growing wethers, measurements of
PDV fluxes of nitrogenous compounds using the venous-arterial technique indicated that, at
similar N intakes, PDV uptake of urea only tended to be greater with the oscillating treatment
(9.9 and 14.2 g CP/kg of DM on a 2-d basis) when compared to a static (12.5 g CP/kg of DM)
CP concentration. Thus, it was not possible to definitively attribute the improved N retention
with oscillating CP diets to greater rates of urea transfer to the gut. In the present study, the
unidirectional (i.e., serosal-to-mucosal; Jsm-urea) urea flux across isolated ruminal epithelia
mounted in Ussing chambers that were obtained from lambs fed static or oscillating dietary CP
concentrations was quantified. To mimic physiological conditions it was decided to measure Jsm-
urea as urea is usually not detectable in ruminal fluid (Muscher et al., 2010). These results show
that Jsm-urea was markedly greater in lambs that were killed after 2 d of receiving the OSC-LOW
Page 144
124
diet in a 4-d oscillating cycle compared to those lambs that were killed after receiving the OSC-
HIGH or MEDIUM diets. These findings provide definitive evidence that, when oscillating CP
concentrations are fed, a greater N utilization can partly be attributed to enhanced urea recycling
to the rumen when the low CP diet is fed within the OSC cycle. Besides the increase in urea
recycling, changes in whole-body protein metabolism when oscillating CP concentrations are fed
could also be partly responsible for improving the efficiency of N use. In sheep maintained by
intragastric nutrient infusions, marked decreases (-30 to -21%) in urinary N excretion, total body
protein flux, and both protein synthesis and degradation were observed within 1 to 2 d after
animals were switched from a maintenance to a low protein intake (Liu et al., 1995). With such
acute responses in body protein turnover due to changes in protein intake, it is feasible that
feeding oscillating dietary CP concentrations on a 2-d basis could have altered whole-body
protein metabolism.
It is well-established that urea can be transferred to both the fore-stomach (rumen) and
post-stomach compartments of the digestive tract (Lapierre and Lobley, 2001), but only urea
recycled into the rumen can potentially contribute amino acids to the host animal. Urea recycling
to the rumen can occur via saliva or direct transfer from the blood across ruminal wall (Lapierre
and Lobley, 2001). Salivary secretion increases with the physically-effective fibre content of the
diet, and it is a major factor that would dictate how much urea is transferred via the salivary
route. Although urea transfer via saliva was not measured in the present study, it is likely that the
relative contribution of this route to total urea transfer into the rumen was small as the diets used
were fed as a pellet with low physically-effective fibre. In all likelihood, most of the urea
recycling was by direct transfer from blood across the ruminal epithelia, especially when dietary
N intake was low (Harmeyer and Martens, 1980).
Until recently, passage of urea from blood across the ruminal wall was believed to occur
largely by simple passive diffusion, with the rumen-blood urea concentration gradient facilitating
urea transfer into the rumen. Ritzhaupt et al. (1997; 1998) demonstrated the presence of carrier-
mediated, facilitative urea transporter-B (UT-B) proteins in ovine ruminal epithelium. That UT-
B might have a role in trans-epithelial urea flux is suggested by observations in ruminal epithelia
that UT-B protein abundance was upregulated when lambs were fed high N diets (Marini and
Van Amburgh, 2003) and that UT-B mRNA abundance was upregulated in concentrate-
Page 145
125
compared to forage-fed steers (Simmons et al., 2009). However, other studies have failed to
detect changes in UT-B mRNA abundance when dietary CP level is manipulated (Marini et al.,
2004; Muscher et al., 2010; Ludden et al., 2009), so the functional role of UT-B in trans-
epithelial urea transfer remains rather obscure. In the present study, it was sought to delineate the
functional role of UT-B in the movement of urea across ruminal epithelia isolated from lambs
fed the OSC or MEDIUM CP diets by conducting measurements of total and phloretin-
insensitive urea flux. Phloretin is a known specific inhibitor of facilitative UT-B and it has been
reported to reduce the flux of urea in bovine (Stewart et al., 2005), ovine (Abdoun et al., 2010)
and caprine (Muscher et al., 2010) ruminal epithelia. The current study revealed that both
phloretin-insensitive and phloretin-sensitive portions of Jsm-urea were markedly greater in ruminal
epithelia isolated from lambs fed the OSC-LOW compared to those fed the OSC-HIGH diet.
When expressed as a proportion of total Jsm-urea, the phloretin-sensitive portion only accounted
for 18.8 to 23.1%. This suggests that although UT-B carrier-mediated urea transport was
functional in epithelia from all lambs, the greater Jsm-urea flux in lambs fed the OSC-LOW cannot
be directly attributed to the upregulation of a trans-cellular pathway for urea transport involving
UT-B transporters.
While numerous studies have suggested that urea transport occurs via passive diffusion in
addition to UT-B-mediated transport, recent studies (Muscher et al., 2010; Abdoun et al., 2010)
have reported no correlation between tissue Gt and urea flux. Past studies have examined this
relationship with equimolar concentrations of urea on the mucosal and serosal sides in Ussing
chambers (Abdoun et al., 2010). In the current study, a serosal-to-mucosal driven concentration
gradient was imposed to mimic physiological conditions observed in vivo. These results support
previous studies showing that changes in Gt could not account for a significant portion of the
variation observed for Jsm-urea fluxes. Thus, it appears that other potential phloretin-insensitive
transporters may be involved in Jsm-urea fluxes across the ruminal epithelium (Muscher et al.,
2010). Possible candidates include aquaporins (Borgnia et al., 1999).
It is well documented that ruminal NH3-N is negatively correlated with urea transfer to
the rumen (Kennedy and Milligan, 1980). In the present study, Jsm-urea flux was negatively
correlated with ruminal NH3-N concentration. These inhibitory effects of a high ruminal NH3-N
concentration on trans-epithelial urea flux could arise partly due to a decrease in ruminal urease
Page 146
126
activity (Cheng and Wallace, 1979). Because bacterial urease activity facilitates the trans-
epithelial movement of urea by maintaining a concentration gradient that is favorable to
diffusion (Rémond et al.,. 1996), depressed bacterial urease activity might impair urea transfer.
Bacterial urease activity was not measured in the present study, but Muscher et al. (2010)
reported a negative correlation between ruminal urease activity and in vitro urea flux across
ruminal epithelia. It is worth noting, though, that the incubation buffer solutions that were used
in the present study contained antibiotics and an urease inhibitor that would have inhibited any
bacterial urease activity. As such, it is not likely that changes in urease activity in vitro would
have influenced trans-epithelial urea flux. It is plausible that physiological adaptations for Jsm-urea
were partially mediated via changes in ruminal NH3-N concentration in vivo. In our study, the
lower ruminal NH3-N concentration that was observed in lambs fed the OSC-LOW could have
stimulated a greater Jsm-urea flux when compared to lambs fed the OSC-HIGH diet. Changes in
ruminal pH could also be partly responsible for the observed differences in Jsm-urea flux between
OSC-LOW and OSC-HIGH lambs. When mucosal pH was varied between 7.4 and 5.4 in the
presence of short-chain fatty acids (as in the present study), in vitro Jsm-urea flux was maximal at a
pH of 6.2 and there was a steep decrease in Jsm-urea flux as pH was reduced to 5.4 (Abdoun et al.,
2010). Ruminal pH in lambs fed the OSC-LOW diet was 5.59, whereas it was only 5.12 in lambs
fed the OSC-HIGH diet, so the more favorable ruminal pH in lambs fed the OSC-LOW diet
could have had stimulatory effects on trans-epithelial urea flux.
6.6 Conclusions
Compared to feeding a static dietary CP concentration on a daily basis, feeding
oscillating dietary CP concentrations on a 48-h basis improves N retention in ruminants even
when N intakes are similar. Of particular importance, our results provide new insights that the
improvement in N retention with oscillating dietary CP concentrations is partly mediated by
increased urea transport into the rumen during periods when animals are consuming the low CP
diet. However, the phloretin-sensitive Jsm-urea flux accounted for only a small proportion of total
Jsm-urea flux in lambs fed oscillating dietary CP concentrations, so it is not clear if UT-B plays a
role in mediating the greater trans-epithelial flux of urea into the rumen when dietary CP
concentration is oscillated in the short-term. Future studies should seek to discover other
transporters that might be involved in urea transport across the ruminal epithelium.
Page 147
127
7. GENERAL DISCUSSION
The physiological process of urea-N recycling to the GIT in ruminants plays a vital role
in maintaining an adequate N supply for rumen functions under most dietary conditions
(Lapierre and Lobley, 2001), therefore, understanding dietary and ruminal factors which regulate
urea-N recycling and capture of recycled urea-N within the GIT for anabolic is important. Four
experiments presented in this thesis were conducted with an overall objective of delineating how
dietary factors and associated ruminal factors regulate urea-N recycling in ruminants. Of
particular importance, interactions between dietary protein degraded in the rumen and ruminally-
fermentable carbohydrate in high N diets (Chapter 3), defaunation of the rumen (to decrease
ruminal NH3-N levels) and dietary N levels (Chapter 4) and, dietary ruminally-fermentable
carbohydrate (Chapter 5), as well as the effects of oscillating high and low dietary N levels
(Chapter 6) were studied.
Numerous studies in the literature have demonstrated that urea-N recycling to the GIT is
important in supplying N for sustaining microbial growth and thus keep ruminants in positive N
balance when low N diets are fed. However, to meet the higher production demands, dairy and
beef cattle by and large require high N in the diet. Therefore, my first question when I started this
project was “can we manipulate urea-N recycled to the GIT and the utilization of this recycled
urea-N for anabolic use by dietary alterations in ruminants fed high N diets”?. Barley grain
processing to shift starch digestion from small intestine to the rumen or changing dietary RDP
level did not alter urea-N kinetics in lambs fed high N diets (Chapter 3). However, across dietary
treatments, substantial amounts (66.9 to 74.2%) of hepatic urea-N output were transferred to the
GIT, but most of this N (63.6 to 75.6%) was returned to the ornithine cycle without being
utilized for microbial use. Across dietary treatments, even though dietary N intakes were higher,
however, small proportion of recycled urea-N was still being utilized for anabolic purposes thus
illustrating the importance of urea-N recycling even when ruminants are fed high N to maintain
them in positive N balance.
Previous studies (Theurer et al., 1999, 2002; Alio et al., 2000; Delgado-Elorduy et al.,
2002) have shown that feeding steam flaked sorghum and corn grain to increase starch
degradability in the rumen was associated with a greater transfer of urea-N across PDV and
higher microbial N supply to the duodenum. Across western Canada, barley grain is the major
Page 148
128
source of cereal grain fed to beef and dairy cattle. Barley starch is more rapidly fermented in the
rumen compared to corn and sorghum. Because of higher starch digestibility, question was does
barley grain processing (i.e., pelleting) further improves RFC compared to dry-rolling and can
we increase urea-N recycling to the rumen and improve utilization recycled urea-N for microbial
protein synthesis by feeding PB as compared to DRB.
Surprisingly, increasing the RFC by feeding PB as compared to DRB did not have any
positive impact on the major parameters of urea-N recycling (Chapters 3 and 5), contradicting
previous research with sorghum (Theurer et al., 2002) and corn (Delgado-Elorduy et al., 2002).
The lack of effect of grain processing could be attributable to high concentrate diet, where in
energy supply might not have limited the utilization of the extra N provided via enhanced urea-N
recycling to the GIT. Another possible reason could be the lower ruminal pH that was observed
in lambs fed PB as compared those fed DRB. A recent study (Abdoun et al., 2010) reported that
ruminal pH plays an important role in regulating urea-N transfer across the ruminal wall with
maximal urea flux observed at a mucosal pH of around 6.0 to 6.4 with a steep decrease in Jsm
urea flux when pH of the mucosal buffer dropped below 6.0. Therefore, a more acidic ruminal
environment in lambs fed PB compared to DRB could have impaired urea-N transfer across the
ruminal epithelium possibly due to decreased urease activity (Reynolds and Kristensen, 2008).
Ruminal pH in lambs fed PB and DRB were 5.8 and 6.0 (Chapter 5), respectively; thus, this
lower ruminal pH could be the reason why positive effects of barley grain processing on urea-N
kinetics were not observed (Chapters 3 and 5).
Two experiments presented in this thesis (Chapters 4 and 5) describe the impact of
defaunation on urea-N recycling. Before conducting these experiments, the mechanism put
forward as being responsible for the improved N metabolism in ruminants were: 1) decreased
intra-ruminal N recycling (Koenig et al., 2000), 2) greater sequestration of NH3-N into bacterial
protein, and 3) lower ruminal NH3-N concentrations (Firkins et al., 2007). This thesis provides
new evidence that improved N utilization in ruminants can be partly attributable to increased
urea-N recycling to the GIT and greater utilization of this recycled urea-N for anabolic purposes.
This might be related to lower ruminal NH3-N concentration that is consistently observed in
these studies, as ruminal NH3-N concentration is negatively correlated with urea-N transfer into
the rumen (Kennedy and Milligan, 1980). Sunflower oil was fed (6%; DM basis) as an
Page 149
129
antiprotozoal agent in both studies. Commonly used methods to eliminate ruminal protozoa
involve the use of chemicals (e.g., copper sulfate and calcium peroxide), but a major
disadvantage of using chemicals is that they are not only toxic to ruminal protozoa (Jouany,
1996), but also to animals and also alter other aspects of the ruminal ecosystem (Veira et al.,
1983). Hence, SFO was used as a defaunating agent because it is safer and can be applied under
practical feeding conditions (Ivan et al., 2001). Although complete defaunation was not
achieved, substantial reductions in ruminal protozoal populations were achieved, coupled with
positive responses in N utilization. However, the major issue with the design of both studies was
that no additional fat source was fed as part of control diets to balance energy intakes. Therefore,
differences in both energy source and total energy intake may have influenced some of the
responses. Because DM intake was higher in FAUN compared to PDFAUN lambs, additional
energy supplied through SFO to PDFAUN lambs was compensated by additional DM intake in
FAUN lambs and, hence, total energy intake was unaffected by protozoal status (Chapter 4).
However, the energy sources in the diets were different and may have influenced the post-
absorptive N use. Conversely, total energy intakes differed in the subsequent study (Chapter 5)
and additional energy intake in PDFAUN lambs due to feeding SFO could have influenced post-
absorptive N use. Therefore, the ideal experimental design would be to feed SFO to partially-
defaunate animals and concurrently feed a mixture of saturated fatty acids to control animals to
equalize energy intakes. Feeding oil (i.e., extracted from seeds) in ruminants will increase the
feed cost and, hence, alternative feeding strategies to eliminate ruminal protozoa have to be
investigated. Ivan et al. (2003, 2004) incorporated crushed sunflower seed in sheep diets such
that the SFO content of the diet was 6% of dietary DM and reported a 79% decrease in ruminal
protozoa counts as compared to the control diet. Another possible means of defaunating the
rumen is by separating newborn ruminants within few hours after birth, but the practical
application of this approach is doubtful. By quantifying urea-N kinetics with such approaches to
defaunate the rumen, definitive conclusions on the effects of defaunation on urea-N recycling
can be made.
Stewart et al. (2005) demonstrated presence of UT-B in the bovine ruminal epithelium
and may play role in carrier-mediated facilitated urea diffusion into the rumen. Further, Simmons
et al. (2009) demonstrated that steers fed high concentrate diet expressed higher UT-B mRNA,
and UT proteins in the ruminal epithelium compared to those fed high silage diets; however,
Page 150
130
other studies have shown conflicting results on whether these transporters are regulated by
dietary alterations (Marini and Van Amburgh, 2003; Marini et al., 2004; Ludden et al., 2008;
Muscher et al., 2010). In addition to quantifying urea-N, mRNA expression of UT-B was
quantified (Chapters 3 and 4). Surprisingly, even though, urea-N recycling increased by partial
defaunation, the mRNA UT-B expression was not altered. As urea diffuses into the rumen both
by simple and facilitated carrier-mediated diffusion, does UT-B play a functional role in urea
transfer into the rumen? Results from my last study (Chapter 6) shows that urea entry into the
rumen is largely through by simple diffusion rather than through facilitated carrier-mediated
diffusion. Therefore, future research has to be directed towards delineating the effect of diet and
ruminal metabolites on functional significance of UT expression. In addition, research efforts
have to be directed towards investigating other possible urea-transporting molecules other than
UT-B and UT-A.
This thesis also provides definitive evidence that increased urea-N recycling to the rumen
is the probable mechanism for the improved N retention in ruminants fed oscillating dietary N
levels (Chapter 6). Initially, Cole (1999) speculated that the increase in N retention in ruminants
fed oscillating dietary CP could be attributed to increased N recycling to the GIT. Archibeque et
al. (2007) observed only a tendency for a greater net flux of urea-N to the GIT in sheep fed
oscillating dietary CP concentrations; however, overall results from that study did not provide
definitive evidence that improved N utilization was associated with increased urea-N recycling to
the rumen. Results from my last study (Chapter 6) provides definitive evidence that, compared to
feeding the same amount of dietary protein on a daily basis, feeding oscillating dietary CP
concentrations on a 2-d basis improves N retention in lambs, and this response is mediated at
least in part by increased urea-N recycling to the rumen and improved microbial NAN supply to
the duodenum.
Page 151
131
8. OVERALL CONCLUSIONS
Results presented in this thesis provide some interesting findings on factors regulating
urea-N recycling in ruminants. This research provides new evidence that the improved efficiency
of N utilization in partially-defaunated ruminants could be partly mediated by an increase in
urea-N recycling. In addition, improvement in the N retention with oscillating dietary crude
protein concentrations is probably attributable to an increase in the urea-N transfer into the
rumen. As urea-N recycling plays a critical role in salvaging N for productive purposes,
additional research is required to elucidate factors regulating the mechanism of urea-N recycling
in ruminants.
Page 152
132
9. REFERENCES
Abdoun, K., K. Wolf, G. Arndt, and H. Martens. 2003. Effect of ammonia on Na transport across
isolated rumen epithelium of sheep is diet dependent. Br. J. Nutr. 90:751-758.
Abdoun, K., F. Stumpff, K. Wolf, and H. Martens. 2005. Modulation of electroneutral Na
transport in sheep rumen epithelium by luminal ammonia. Am. J. Physiol. Gastrointest.
Liver Physiol. 289:G508-520.
Abdoun, K., F. Stumpff, and H. Martens. 2007. Ammonia and urea transport across the rumen
epithelium: a review. Anim. Health. Res. Rev. 7:43-59.
Abdoun, K., F. Stumpff, I. Rabbani, and H. Martens. 2010. Modulation of urea transport across
sheep rumen epithelium in vitro by SCFA and CO2. Am. J. Physiol. Gastrointest. Liver.
Physiol. 298:G190-G202.
Alio, A., G.B. Theurer, O. Lozano, J.T. Huber, R.S. Swingle, A. Delgado-Elorduy, P. Cuneo, D.
DeYoung, and K.E. Webb Jr. 2000. Splanchnic nitrogen metabolism by growing beef
steers fed diets containing sorghum grain flaked at different densities. J. Anim. Sci.
78:1355-1363.
AOAC. 1990. Official Methods of Analysis. 18th ed. Assoc. Off. Anal. Chem., Arlington, VA.
Archibeque, S. L., J. C. Burns, and G. B. Huntington. 2001. Urea flux in beef steers: Effects of
forage species and nitrogen fertilization. J. Anim. Sci. 79:1937-1943.
Archibeque, S. L., H. C. Freetly, and C. L. Ferrell. 2007. Net portal and hepatic flux of nutrients
in growing wethers fed high concentrate diets with oscillating protein concentrations. J.
Anim. Sci. 85:997-1005.
Bach, A., S. Calsamiglia, and M. D. Stern. 2004. Nitrogen metabolism in the rumen. J. Dairy Sci.
88(E Suppl.):E9-E21.
Balcells, J., J. A. Guada, C. Castrillo, J. Gasa. 1993. Rumen digestion and urinary excretion of
purine derivatives in response to urea supplementation of sodium-treated straw fed to
sheep. Br. J. Nutr. 69:721-732.
Beauchemin, K. A., W. Z. Yang, and L. M. Rode. 2001. Effects of barley grain processing on the
site and extent of digestion of beef feedlot finishing diets. J. Anim. Sci. 79:1925–1936.
Page 153
133
Bierman, S., G. E. Erickson, T. J. Klopfenstein, R. A. Stock, and D. H. Shain. 1999. Evaluation
of nitrogen and organic matter balance in the feedlot as affected by level and source of
dietary fiber. J. Anim. Sci. 77:1645-1653.
Bird, S. H., B. Romulo, and R. A. Leng. 1994. Effects of Lucerne supplementation and
defaunation on feed intake, digestibility, N retention and productivity of sheep fed straw
based diets. Anim. Feed Sci. Technol. 45:119-129.
Bodeker, D., and J. Kemkowski. 1996. Participation of NH4+ in total ammonia absorption across
the rumen epithelium of sheep (Ovis aries). Comp. Biochemical. Physiol. A114:305-310.
Borgnia, M., S. Nielsen, E. Engel, and P. Agre. 1999. Cellular and molecular biology of the
aquaporin water channels. Annu. Rev.Biochem. 68:425-458.
Brock, F. M., C. W. Forsberg, and J. G. Buchanan Smith. 1982. Proteolytic activity of rumen
microorganisms and effects of proteinase inhibitors. Appl. Environ. Microbiol. 44:561-
569.
Broderick, G. A., and Kang J. H. 1980. Automated simultaneous determination of ammonia and
total amino acids in ruminal fluid and in vitro media. J. Dairy Sci. 63:64–75. Canadian
Council on Animal Care. 1993. Guide to the Care and Use of Experimental Animals.Vol.
1. CCAC, Ottawa, ON.
Broderick, G. A., R. J. Wallace, and E. R. Orskov. 1991. Control of rate and extent of protein
degradation. In: T. Tsuda, Y. Sasaki and R. Kawashima (Ed.).
Broderick, G. A., and N. R. Merchen. 1992. Markers for Quantifying Microbial Protein
Synthesis in the Rumen. J. Dairy Sci. 75:2618-2632.
Bryant, M. P. 1973. Nutritional requirements of the predominant rumen cellulolytic bacteria.
Fed. Proc. 32:1809-1813.
Bryant, M. P. and L. M. Robinson. 1963. Apparent incorporation of ammonia and amino acid
carbon during growth of selected species of ruminal bacteria. J. Dairy Sci. 46:150-154.
Bunting, L. D., J. A. Boling, C. T. MacKown, and R. B. Muntifering. 1987. Effect of dietary
protein level on nitrogen metabolism in lambs: studies using 15
N-nitrogen. J. Anim. Sci.
64:855-867.
Page 154
134
Canadian Council on Animal Care. 1993. Guide to the care and use of experimental animals. 2nd
ed. Vol. 1. CCAC, Ottawa, ON.
Castillo, A. R., E. Kebreab, D. E. Beever, and J. France. 2000. A review of the efficiency of
nitrogen utilisation in lactating dairy cows and its relationship with environmental
pollution. J. Anim. Feed Sci. 9:1–32.
CAST. 2002. Animal diet modification to decrease the potential for nitrogen and phosphorus
pollution. Council for Agricultural Science and Technology. Issue Paper 21:1-16. Ames,
Iowa.
Cecava, M. J., N. R. Merchen, L. C. Gay, and L. L. Berger. 1990. Composition of ruminal
bacteria harvested from steers as influenced by dietary energy level, feeding frequency,
and isolation techniques. J. Dairy Sci. 73:2480-2488.
Chalupa, W. 1976. Degradation of amino acids by the mixed rumen microbial population. J.
Anim. Sci. 43:828-834.
Chamberlain, D. G., S. Robertson, and J. J. Choung. 1993. Sugars versus starch as supplements
to grass silage: Effects on ruminal fermentation and the supply of microbial protein to the
small intestine, estimated from the urinary excretion of purine derivatives in sheep. J. Sci.
Food Agric. 63:189-194.
Chen, X. B., and M. J. Gomes. 1992. Estimation of microbial protein supply to sheep and cattle
based on urinary excretion of purine derivatives- and overview of the technical details.
Int. Feed Resources Unit, Rowett Research Institute. Aberdeen. UK. pp. 1-19.
Cheng, K. J., and R. J. Wallace. 1979. The mechanism of passage of endogenous urea through
the rumen wall and the role of ureolytic epithelial bacteria in the urea flow. Br. J.
Nutr.42:553-557.
Chowdhury, S. A., E. R. Ørskov, F. D. Hovell, J. R. Scaife, and G. Mollison. 1997. Protein
utilization during energy undernutrition in sheep sustained by intragastric infusion:
Effects of protein infusion level, with or without sub-maintenance amounts of energy
from volatile fatty acids, on energy and protein metabolism. Br. J. Nutr. 77:565-576.
Clarke L. 2009. A guide to Ussing chamber studies of mouse intestine. Am. J. Physiol.
Gastrointest. Liver Physiol. 296:G1151-1166.
Page 155
135
Cole NA. 1999. Nitrogen retention by lambs fed oscillating dietary protein concentrations. J.
Anim. Sci. 77:215-222.
Cole, N. A., L. W. Greene, F. T. McCollum, T. Montgomery, and K. McBride. 2003. Influence
of oscillating dietary protein concentration on performance, acid-base balance, and
nitrogen excretions of steers. J. Anim. Sci. 81:2660-2668.
Cole, N. A., R. N. Clark, R. W. Todd, C. R. Richardson, A. Gueye, L. W. Greene, and K.
McBride. 2005. Influence of dietary crude protein concentration and source on potential
ammonia emission from beef cattle manure. J. Anim. Sci. 83:722-731.
Dabiri, N., and M. L. Thonney. 2004. Source and level of supplemental protein for growing
lambs. J. Anim. Sci. 82:3237-3244.
Eadie, J. M., J. Hyldgaard-Jensen, S. O. Mann, R. S. Reid, and F. G. Whitelaw. 1970.
Observation on the microbiology and biochemistry of the rumen in cattle given different
quantities of a pelleted barley ration. Br. J. Nutr. 24:157-177.
Egan, A. R., K. Boda, and J. Varady. 1986. Regulation of nitrogen metabolism and recycling.
Pages 386-402 in Control of Digestion and Metabolism in Ruminants. L. P. Milligan, W.
L. Grovum and A. Dobson, eds. Prentice-Hall, Englewood Cliffs, NJ.
Engelhardt, W. V., S. Hinderer. and E. Wipper. 1978. Factors influencing the endogenous urea-N
secretion and utilization in the gastrointestinal tract. In: D. F. Osbourn, D. E. Beever, and
D. J. Thomson (Ed. Ruminant Digestion and Feed Evaluation. pp 4.1-4.12. Agriculture
Research Council, London.
Environment Canada. 2008. Air Pollutant Emissions for Canada.
http://www.ec.gc.ca/pdb/websol/emissions/ap/ap_result_e.cfm?year=2008&substance=n
h3&location=CA§or=&submit=Search. Accessed September 3, 2010.
Erickson, G. E., and T. J. Klopfenstein. 2001. Nutritional Methods to Decrease N Losses from
Open-Dirt Feedlots in Nebraska. The Scientific World Journal. 1(S2):830-835.
Erwin, E. S., G. J. Marco, and E. M. Emery. 1961. Volatile fatty acids analysis of blood and
rumen fluid by gas chromatography. J. Dairy Sci. 44:1768-1776.
Page 156
136
Eugène, M., H. Archimède, and D. Sauvant. 2004. Quantitative meta-analysis on the effects of
defaunation of the rumen on growth, intake and digestion in ruminants. Livestock Prod.
Sci. 85:81-97.
Faichney, G. J., G. L. R. Gordon, R. J. Welch, and A. J. Rintoul. 2002. Effect of dietary free lipid
on anaerobic fungi and digestion in the rumen of sheep. Aust. J. Agric. Res. 53:519-527.
Ferrell, C. L., H. C. Freetly, A. L. Goetsch, and K. K. Kreikemeier. 2001. The effect of dietary
nitrogen and protein on feed intake, nutrient digestibility, and nitrogen flux across the
portal-drained viscera and liver of sheep consuming high-concentrate diets ad libitum. J.
Anim. Sci. 79:1322-1328.
Firkins, J. L., L.L. Berger, N.R. Merchen, G.C. Fahey Jr, Mulvaney, R.L. 1987. Ruminal
nitrogen metabolism in steers as affected by feed intake and dietary urea concentration. J.
Dairy Sci. 70: 2302-2311.
Firkins, J. L., and C. K. Reynolds. 2005. Whole animal nitrogen balance in cattle. Pages 167–185
in Nitrogen and Phosphorus Nutrition of Cattle and Environment. E. Pfeffer and A.
Hristov, ed. CAB International, Cambridge, MA.
Firkins, J. L., Z. Yu, and M. Morrison. 2007. Ruminal nitrogen metabolism: Perspectives for
integration of microbiology and nutrition for dairy. J. Dairy Sci. 90(Suppl. E):E1-E16.
Fujihara, T., M. Todoroki, and K. Nakumara. 2003. The effect of rumen protozoa on the urinary
excretion of purine derivatives in goats. J. Agri. Sci. (Camb.). 140:101-105.
Gabler, M. T., and A. J. Heinrichs. 2003. Effects of increasing dietary protein on nutrient
utilization in heifers. J. Dairy Sci. 86:2170–2177.
Galyean, M.L. 1996. Protein levels in beef cattle finishing diets: industry application, university
research, and systems results. J. Anim. Sci. 74:2860-2870.
Gozho, G. N., M. R. Hobin, and T. Mutsvangwa. 2008. Interactions between barley grain
processing and source of supplemental dietary fat on nitrogen metabolism and urea-
nitrogen recycling in dairy cows. J. Dairy Sci. 91:247-259.
Page 157
137
Guerino, F., G. B. Huntington, and R. A. Erdman. 1991. The net hepatic flux of metabolites and
oxygen consumption in growing beef steers given postruminal casein. J. Anim. Sci.
69:387-395.
Harmeyer, J., and H. Martens. 1980. Aspects of urea metabolism in ruminants with reference to
the goat. J. Dairy Sci. 63:1707-1728.
Haussinger, D. 1983, Hepatocyte heterogeneity in glutamine and ammonia metabolism and the
role of an intercellular glutamine cycle during ureogenesis in perkised rat Iiver. Euro. J.
Biochem. 1 33: 269-275.
Haussinger, D., W. H. Lamers, and A. F. M. Mooman. 1992. Hepatocyte heterogeneity in the
metabolism of amino acids and ammonia. Enzyme. 46:72-93.
Houpt, T. R. 1970. Transfer of urea and ammonia to the rumen. Pages 119–131 in Physiology of
Digestion and Metabolism in the Ruminant. A. T. Phillipson, ed. Oriel Press, Newcastle
upon Tyne, UK.
Houpt, T. R., and K. A. Houpt. 1968. Transfer of urea nitrogen across the rumen wall. Am. J.
Physiol. 214:1296-1303.
Hristov, A. N., K. L. Grandeen, J. K. Ropp, and M. A. McGuire. 2004. Effect of sodium laurate
on ruminal fermentation and utilization of ruminal ammonia nitrogen for milk protein
synthesis in dairy cows. J. Dairy Sci. 87:1820–1831.
Hungate, R. E. 1966. The Rumen and its Microbes. Academic Press. London.
Huntington, G. B. 1986. Uptake and transport non-protein nitrogen by the ruminant gut. Fed.
Proc. 45:2272-2276.
Huntington, G. B. 1989. Hepatic urea synthesis and site and rate of urea removal from blood of
beef steers fed alfalfa hay or a high concentrate diet. Can. J. Anim. Sci. 69:215-223.
Huntington, G.B. 1997. Starch utilization by ruminants: From basics to the bunk. J. Anim. Sci.
75:852-867.
Huntington, G. B., and S. L. Archibeque. 2000. Practical aspects of urea and ammonia
metabolism in ruminants. J. Anim. Sci. 78:742-749.
Page 158
138
Huntington, G. B., K. Magee, A. Matthews, M. Poore, and J. Burns. 2009. Urea metabolism in
beef steers fed tall fescue, orchardgrass, or gamagrass hays. J. Anim. Sci. 87:1346-1353.
Kennedy, P. M., and L. P. Milligan. 1980. The degradation and utilization of endogenous urea in
the gastrointestinal tract of ruminants: a review. Can. J. Anim. Sci. 60:205-221.
Ikwuegbu, O. A., and J. D. Sutton. 1982. The effect of varying the amount of linseed oil
supplementation on rumen metabolism in sheep. Br. J. Nutr. 48:365-375.
Ipharraguerre, I. R., J. H. Clark, and D. E. Freeman. 2005. Varying protein and starch in the diet
of dairy cows. I. Effects on ruminal fermentation and intestinal supply of nutrients. J.
Dairy Sci. 88:2537–2555.
Ivan, M., P. S. Mir, K. M. Koenig, L. M. Rode, L. Neil, T. Entz, and Z. Mir. 2001. Effects of
dietary sunflower oil on rumen protozoa population and tissue concentration of
conjugated linoleic acid in sheep. Small Rum. Res.41:215–227.
Ivan, M., P. S., Mir, Z. Mir Z, T. Entz, M. L. He, and T. A. McAllister. 2004. Effects of dietary
sunflower seeds on rumen protozoa and growth of lambs. Br. J. Nutr. 92:303-310.
Jouany, J. P. 1996. Effect of rumen protozoa on nitrogen utilization by ruminants. J. Nutr.
126:1335S–1346S.
Jouany, J. P., D. I. Demeyer, and J. Grain. 1988. Effect of defaunating the rumen. Anim. Feed
Sci. Technol. 21:229-265.
Kennedy, P. M., and L. P. Milligan. 1978. Transfer of urea from the blood to the rumen of sheep.
Br. J. Nutr. 40:149-154.
Kennedy, P. M., and L. P. Milligan. 1980. The degradation and utilization of endogenous urea in
the gastrointestinal tract of ruminants: a review. Can. J. Anim. Sci. 60:205-221.
Kim, H. S., J. J. Choung, D. Chamberlain, and G. E. Lobley, G.E. 1999. Effect of propionate on
ovine urea kinetics. In: Protein Metabolism and Nutrition, Book of Abstracts of the 8th
International Symposium on Protein Metabolism and Nutrition, Aberdeen, UK.
Wageningen Press, Wageningen, The Netherlands, p. 57.
Page 159
139
Kiran, D., and T. Mutsvangwa. 2007. Effects of barley grain processing and dietary ruminally
degradable protein on urea-nitrogen recycling and nitrogen metabolism in growing
lambs. J. Anim. Sci. 85:3391-3399.
Kiran, D., and T. Mutsvangwa. 2009. Nitrogen utilization in growing lambs fed oscillating
dietary protein concentrations. Anim. Feed Sci. Technol. 152: 33-41.
Kiran, D., and T. Mutsvangwa. 2010. Effects of partial ruminal defaunation on urea-nitrogen
recycling, nitrogen metabolism, and microbial nitrogen supply in growing lambs fed low
or high dietary crude protein concentrations. J. Anim. Sci. 88:1034-1047.
Koenig, K. M., C. J. Newbold, F. M. McIntosh, and L. M. Rode. 2000. Effects of protozoa on
bacterial nitrogen recycling in the rumen. J. Anim. Sci. 78:2431–2445.
Koenig, K. M., K. A. Beauchemin, and L. M. Rode. 2003. Effect of grain processing and silage
on microbial protein synthesis and nutrient digestibility in beef cattle fed barley-based
diets. J. Anim. Sci. 81:1057-1067.
Kohn, R. A., M. M. Dinneen, and E. Russek-Cohen. 2005. Using blood urea nitrogen to predict
nitrogen excretion and efficiency of nitrogen utilization in cattle, sheep, goats, horses,
pigs, and rats. J Anim. Sci. 83:879-889.
Lang, I., and H. Martens. 1999. Na transport in sheep rumen is modulated by voltage-dependent
cation conductance in apical membrane. Am. J. Physiol. Gastrointest. Liver Physiol.
277:G609-618.
Lapierre, H., and G. E. Lobley. 2001. Nitrogen recycling in the ruminant: A review. J. Dairy Sci.
84 (E Suppl.):E223–E236.
Leng, R. A., and J. V. Nolan. 1984. Nitrogen metabolism in the rumen. J. Dairy Sci. 67:1072–
1089.
Leng, L., M. Szanyiova, and K. Boda. 1985. The renal response of sheep to a low dietary
nitrogen intake. Physiologia Bohemoslovaca 35:147–154.
Lindberg, J. E. 1985. Retention time of chromium-labelled feed particles and of water in the gut
of sheep given hay and concentrate at maintenance. Br. J. Nutr. 53:559-567.
Page 160
140
Liu S. M., G. E. Lobley, N. A. MacLeod, D. J. Kyle, X. B. Chen, and E. R. Ørskov ER. 1995.
Effects of long-term protein excess or deficiency on whole-body protein turnover in
sheep nourished by intragastric infusion of nutrients. Br. J. Nutr. 73:829-839.
Lobley, G. E., A. Connell, M. A. Lomax, D. S. Brown, E. Milne, A. G. Calder, and D. A.H.
Farningham. 1995. Hepatic detoxification of ammonia in the ovine liver: Possible
consequences for amino acid catabolism. Br. J. Nutr. 73:667-685.
Lobley, G. E., D. M. Bremner, and G. Zuur. 2000. Effects of diet quality on urea fates in sheep
as assessed by refined, non-invasive [15
N15
N] urea kinetics. Br. J. Nutr. 84:459-468.
Ludden, P. A., T. L. Wechter, and B. W. Hess. 2002. Effect of oscillating dietary protein on
nutrient digestibility, nitrogen metabolism, and gastrointestinal organ mass in sheep. J.
Anim. Sci. 80:3021-3026.
Ludden, P. A., and T. L. Wechter, E. J. Scholljegerdes, and B. W. Hess. 2003. Effect of
oscillating dietary protein on growth, efficiency, and serum metabolites in growing beef
steers. Prof. Anim. Sci. 19:30-34.
Ludden, P. A., R. M. Stohrer, K. J. Austin, R. L. Atkinson, E. L. Belden, and H. J. Harlow. 2009.
Effect of protein supplementation on expression and distribution of urea transporter-B in
lambs fed low-quality forage. J. Anim. Sci. 87:1354-1365.
Mailman, D. 1982. Blood flow and intestinal absorption. Fed. Proc. 41:2096-2100.
Makkar, H. P. S., and K. Becker. 1999. Purine quantification in the digesta from ruminant
animals by Spectrophotometric and HPLC methods. Br. J. Nutr. 81:107-111.
Marini, J. C., and M. E. Van Amburgh. 2003. Nitrogen metabolism and recycling in Holstein
heifers. J. Anim. Sci. 81: 545-552.
Marini, J. C., J. M. Klein, J. M. Sands, and M. E. Van Amburgh. 2004. Effect of nitrogen intake
on nitrogen recycling and urea transporter abundance in lambs. J. Anim. Sci. 82: 1157-
1164.
Marsh, W. H., B. Fingerhunt, and E. Kirsch. 1957. Determination of urea-N with the diacetyl
method and an automatic dialyzing apparatus. Am. J. Clin. Pathol. 28:681-688.
Page 161
141
McClelland, I. S., and A. A. Jackson. 1996. Urea kinetics in healthy young women: minimal
effect of stage of menstrual cycle contraceptive pill and protein intake. Br. J. Nutr.
76:199-209.
Meijer, A. J., W. H. Camers, and R. A. F. M. Chamuleau. 1990. Nitrogen metabolism and
ornithine cycle function. Physiol. Rev. 70: 701 -748.
Moate, P. J. 1989. Defaunation increases milk yield of dairy cows. Page 18A in Recent advances
in Animal Nutrition in Australia 1989. D. J. Farrell, ed. University of New England
Printery, Armidale, NSW.
Muscher, A. S., B. Schröder, G. Breves, and K. Huber. 2010. Dietary nitrogen reduction
enhances urea transport across goat rumen epithelium. J. Anim. Sci. 88:3390-3398.
Newbold, C. J., D. G. Chamberlain, and A. G. Williams. 1986. The effects of defaunation on the
metabolism of lactic acid in the rumen. J. Sci. Food Agric. 37:1083–1090.
NRC. 1985. Nutrient Requirements of Sheep. Natl. Acad. Press, Washington, DC.
NRC. 2001. Nutrient Requirements of Dairy Cattle. 7th
rev. ed. National Academy Press.
Washington, DC.
Oba, M., R. L. Baldwin, S. L. Owens, and B. J. Bequette. 2004. Urea synthesis by ruminal
epithelial and duodenal mucosal cells from growing sheep. J. Dairy Sci. 87:1803–1805.
Ogimoto, K., and S. Imai. 1981. Atlas of Rumen Microbiology. Japan Scientific Societies Press,
Tokyo, Japan.
Oldham, J. D. 1980. Amino acid requirements for lactation in high-yielding dairy cows. Page 33
in Recent advances in animal Nutrition. A. W. Haresign, ed. Butterworths, London.
Oldick, B. S., and J. L. Firkins. 2000. Effects of degree of fat saturation on fiber digestion and
microbial protein synthesis when diets are fed twelve times daily. J. Anim. Sci. 78:2412-
2420.
Oncuer, A., J. S. Milne, and F. G. Whitelaw. 1990. The effect of a hindgut fermentation on urea
metabolism in sheep nourished by intragastric infusion. Exp. Physiol. 75:689-700.
Orpin, C. G., K. N. Joblin. 1988. The rumen anaerobic fungi. In: P. N. Hobson (Ed.),The Rumen
Microbial Ecosystem. pp129. Elsevier Applied Science. London.
Page 162
142
Ørskov, E. R., C. Fraser, V. C. Mason, and S. O. Mann. 1970. Influence of starch digestion in the
large intestine of sheep on cecal fermentation, cecal microflora and fecal nitrogen
excretion. Br. J. Nutr. 24:671-682.
Ørskov, E.R., D. E. Meehan, N. A. MacLeod, and D. J. Kyle. 1999. Effects of glucose supply on
fasting nitrogen excretion and effect of level and type of volatile fatty acid on response to
protein infusion in cattle. Br. J. Nutr. 81:389-393.
Pantoja, J., J. L. Firkins, M. L. Eastridge, and B. L. Hull. 1994. Effects of fat saturation and
source of fiber on site of nutrient digestion and milk production by lactating dairy cows.
J. Dairy Sci. 77:2341-2356.
Parker, D. S., M. A. Lomax, C. J. Seal, and J. C. Wilton. 1995.Metabolic implications of
ammonia production in the ruminant. Proc. Nutr. Soc. 54:549-563.
Penner, G. B., J. R. Aschenbach, G. Gäbel, R. Rackwitz, and M. Oba. 2009. Epithelial capacity
for apical uptake of short chain fatty acids is a key determinant for intraruminal pH and
the susceptibility to subacute ruminal acidosis in sheep. J. Nutr. 139:1714-1720.
Penner, G. B., M. Oba, G. Gabel, and J. R. Aschenbach. 2010. A single mild episode of subacute
ruminal acidosis does not affect ruminal barrier function in the short term. J. Dairy Sci.
93:4838-4845.
Punia, B. S., J. Leibholz, and G. J. Faichney. 1987. The role of rumen protozoa in the utilization
of paspalum (Paspalum dilatatum) hay by cattle. Br. J. Nutr. 57:395-406.
Prins, R. A., D. L. vanRheenen, and A. T. van‟t Klooster. 1983. Characterization of microbial
proteolytic enzymes in the rumen. J. Microbiol. Serol. 49:585-595.
Raggio, G., G.E. Lobley, S. Lemosquet, and H. Lapierre. 2006. Effect of casein and propionate
supply on whole body protein metabolism in lactating cows. Can. J. Anim. Sci. 86:81-89.
Ranilla, M. J., and M. D. Carro. 2003. Diet and procedures used to detach particle-associated
microbes from ruminal digesta influence chemical composition of microbes and
estimation of microbial growth in Rusitec fermenters. J. Anim. Sci. 81:537–544.
Rémond, D., J.P. Chaise, E. Delval, and C. Poncet. 1993. Net transfer of urea and ammonia
across the ruminal wall of sheep. J. Anim. Sci. 71: 2785–2792.
Page 163
143
Rémond, D., F. Meschy, and R. Boivin. 1996. Metabolites, water and mineral exchanges cross
the rumen wall: Mechanisms and regulation. Ann. Zootech. 45:97-119.
Rémond, D., L. Bernard, I. Savary-Auzeloux, and P. Noziere. 2009. Partitioning of nutrient net
fluxes across the portal-drained viscera in sheep fed twice daily: effect of dietary protein
degradability. Br. J. Nutr. 102:370-381.
Reynolds, C. K., and G. B. Huntington. 1988. Partition of portal-drained visceral net flux in beef
steers. 1. Blood flow and net flux of oxygen, glucose and nitrogenous compounds across
stomach and post-stomach tissues. Br. J. Nutr. 60:539-551.
Reynolds, C. K., and N. B. Kristensen. 2008. Nitrogen recycling through the gut and the nitrogen
economy of ruminants: An asynchronous symbiosis. J. Anim. Sci. 86(E. Suppl.):E293-
E305.
Reynal, S. M., and G. A. Broderick. 2005. Effect of dietary level of rumen-degraded protein on
production and nitrogen metabolism in lactating dairy cows. J. Dairy Sci. 88:4045-4064.
Ritzhaupt, A., G. Breves, B. Schroder, C. G. Winckler, and S. P. Shirazi-Beechey. 1997. Urea
transport in gastrointestinal tract of ruminants: effect of dietary nitrogen. Biochem. Soc.
Trans. 25:S490 (Abstr.).
Ritzhaupt, A., I. S. Wood, A. A. Jackson, B. J. Moran, S. P. Shirazi-Beechey. 1998. Isolation of
RT-PCR fragment from human colon and sheep rumen RNA with nucleotide sequence
similarity to human and rat urea transporter isoforms. Biochem. Soc. Trans. 26:S122
(Abstr.).
Russell, J. B. 1998. Strategies that ruminal bacteria use to handle excess carbohydrate. J. Anim.
Sci. 76:1955-1963.
Russell, J. B., and D. B. Wilson. 1996. Why are ruminal cellulolytic bacteria unable to digest
cellulose at low pH? J. Dairy Sci. 79:1503-1509.
Russell, K., G. E. Lobley, J. Rawlings, D. J. Millward, and E. J. Harper. 2000. Urea kinetics of a
carnivore, Felix silvestris catus. Br. J. Nutr. 84:597-604.
Russell, J. B. 2007. The energy spilling reactions of bacteria and other organisms. J. Mol.
Microbiol. Biotechnol. 13: 1-11.
Page 164
144
Sakata, T., and H. Tamate. 1978. Rumen epithelial cell proliferation accelerated by rapid
increase in intraruminal butyrate. J. Dairy Sci. 61:1109-1113.
Sarraseca, A., Milne, E., Metcalf, M.J. and Lobley, G.E. 1998. Urea recycling in sheep: Effects
of intake. Br. J. Nutr. 79:79-88.
SAS Institute. 2004. SAS/STAT 9.1 User‟s Guide. SAS Institute Inc., Cary, NC.
Satter, L. D., and L. L. Slyter. 1974. Effect of ammonia concentration on rumen microbial
protein production in vitro. Br. J. Nutr. 32:199–208.
Satter, L. D., and R. E. Roffler. 1975. Nitrogen requirement and utilization in dairy cattle. J.
Dairy Sci. 58:1219-1213.
Savary-Auzeloux, I. C., L. Majdoub, N. LeFloc‟h, and I. Ortigues-Marty. 2003. Effects of
intraruminal propionate supplementation on nitrogen utilisation by the portal-drained
viscera, the liver and the hind limb in lambs fed frozen rye grass. Br. J. Nutr. 90:939-952.
Schroeder, G. F., E. C. Titgemeyer, M. S. Awawdeh, J . S. Smith, and D. P. Gnad. 2006. Effects
of energy source on methionine utilization by growing steers. J. Anim. Sci. 84:1505-
1511.
Siddons, R. C., J. V. Nolan, D. E. Beever, and J. C. MacRae. 1985. Nitrogen digestion and
metabolism in sheep consuming diets containing contrasting forms and levels of N. Br. J.
Nutr. 54:175-187.
Soita, H. W., M. Fehr, D. A. Christensen, and T. Mutsvangwa. 2005. Effects of corn silage
particle length and forage:concentrate ratio on milk fatty acid composition in dairy cows
fed supplemental flaxseed. J. Dairy Sci. 88:2813-2819.
Spanghero, M., and Z. M. Kowalski. 1997. Critical analysis of N balance experiments with
lactating cows. Livest. Prod. Sci. 52:113-122.
Stewart, G. S., C. Graham, S. S. Cattell, T. P. L. Smith, N. L. Simmons, and C. P. Smith. 2005.
UT-B is expressed in bovine rumen: Potential role in ruminal urea transport. Am. J.
Physiol. Regul. Integr. Comp. Physiol. 289:R605–R612.
Page 165
145
Storm, E., and E. R. Ørskov. 1983. The nutritive value of rumen micro-organisms in ruminants.
1. Large-scale isolation and chemical composition of rumen micro-organisms. Br. J. Nutr.
50:463-70.
Sunny, N. E., S. L. Owens, R. L. Baldwin, VI, S. W. El-Kadi, R. A. Kohn, and B. J. Bequette.
2007. Salvage of blood urea nitrogen in sheep is highly dependent upon plasma urea
concentration and the efficiency of capture within the digestive tract. J. Anim. Sci.
85:1006-1013.
Tamminga, S. 1979. Protein degradation in the forestomachs of ruminants. J. Anim. Sci.
49:1615–1630.
Tamminga S. 1992. Nutrition management of dairy cows as a contribution to pollution control. J
Dairy Sci. 75:345–357.
Taniguchi, K., G. B. Huntington, and B. P. Glenn. 1995. Net nutrient flux by visceral tissues of
beef steers given abomasal and ruminal infusions of casein and starch. J. Anim. Sci.
73:236-249.
Theurer, C. B., G. B. Huntington, J. T. Huber, R. S. Swingle, and J. A. Moore. 2002. Net
absorption and utilization of nitrogenous compounds across ruminal, intestinal, and
hepatic tissues of growing beef steers fed dry-rolled or steam-flaked sorghum grain. J.
Anim. Sci. 80:525-532.
Theurer, C. B., J. T. Huber, A. Delgado-Elorduy, and R. Wanderley. 1999. Invited Review:
Summary of steam-flaking corn or sorghum grain for lactating dairy cows. J. Dairy Sci.
82:1950-1959.
Thorlacius, S. O., A. Dobson, and A. F. Sellers. 1971. Effect of carbon dioxide on urea diffusion
through bovine ruminal epithelium. Am. J. Physiol. 220:162–170.
Thornton, R. F., P. R. Bird, M. Somers, and R. J. Moir. 1970. Urea excretion in ruminants III.
The role of the hind-gut (cecum and colon). Aust. J. Agric. Res. 21:345-354.
Ushida, K., J. P. Jouany, and D. I. Demeyer. 1991. Effects of presence or absence of rumen
protozoa on the efficiency of utilisation of concentrate and fibrous feeds. Pages 625-654
in Physiological Aspects of Digestion and Metabolism in Ruminants. T. Tsuda, Y.
Sasaki, and R. Kawashima, eds. Academic Press, New York, NY.
Page 166
146
Van Horn, H. H., G. L. Newton, and W. E. Kunkle. 1996. Ruminant nutrition from an
environmental perspective: factors affecting whole-farm nutrient balance. J. Anim. Sci.
74:3082-3102.
Van Soest, P. J., J. B. Robertson, and B. A. Lewis. (1991). Methods for dietary fiber, neutral
detergent fiber and non-starch polysaccharides (NSP) in relation to animal nutrition. J.
Dairy Sci. 74:3583-3597.
Varady, J., K. T. Tashenov, K. Boda, J. Fejes, and K. Kosta. 1979. Endogenous urea secretion
into the sheep gastrointestinal tract. Physiol. Bohemoslov. 28:551-559.
Veira, D. M., M. Ivan, and P. Y. Jui. 1983. Rumen ciliate protozoa: effects on digestion in the
stomach of sheep. J. Dairy Sci. 66:1015-1022.
Vercoe, J. E. 1969. The transfer of nitrogen from the blood to the rumen of cattle. Aust. J. Agric.
Res. 20:191–197.
Wallace, R. J., K. J. Cheng, D. Dinsdale, and E. R. Orskov. 1979. An independent microbial
flora of the epithelium and its role in the ecomicrobiology of the rumen. Nature. 279:424-
426.
Wallace, R. J., G. A. Broderick, and M. L. Brammall. 1987. Microbial protein and peptide
metabolism in rumen fluid from faunated and ciliate-free sheep. Br. J. Nutr. 58:87–93.
Wallace, R. J., R. Onodera, and M. A. Cotta. 1997. Metabolism of nitrogen-containing
compounds. Pages 283–328 in The Rumen Microbial Ecosystem. 2nd ed. P. N. Hobson
and C. S. Stewart, ed. Chapman & Hall, London, UK.
Wang, Z., and L.A. Goonewardene. 2004. The use of MIXED models in the analysis of animal
experiments with repeated measures data. Can. J. Anim. Sci. 84:1–11.
Wessels, R. H., and E. C. Titgemeyer. 1997. Protein requirements of growing steers limit-fed
corn-based diets. J. Anim. Sci. 75:3278-3286.
Wickersham, T. A., E. C. Titgemeyer, R. C. Cochran, E. E. Wickersham, and D. P. Gnad. 2008a.
Effect of rumen degradable intake protein supplementation on urea kinetics and microbial
use of recycled urea in steers consuming low-quality forage. J. Anim. Sci. 86:3079–3088.
Page 167
147
Wickersham, T. A., E. C. Titgemeyer, R. C. Cochran, E. E. Wickersham, and E.S. Moore.
2008b. Effect of frequency and amount of rumen-degradable intake protein
supplementation on urea kinetics and microbial use of recycled urea in steers consuming
low-quality forage. J. Anim. Sci. 86:3089–3099.
Wickersham, T. A., E. C. Titgemeyer, R. C. Cochran, and E. E. Wickersham. 2009. Effect of
undegradable intake protein supplementation on urea kinetics and microbial use of
recycled urea in steers consuming low-quality forage. Br. J. Nutr. 101:225-232.
Wright, D. E., and R. E. Hungate. 1967. Amino acid concentration in rumen fluid. Appl.
Microbiol. 15:148-151.
Wu, Z., and D.L. Palmquist. 1991. Synthesis and biohydrogenation of fatty acids by ruminal
microorganisms in vitro. J. Dairy Sci. 74:3035–3046.
Yang, W. Z., K. A. Beauchemin, and L. M. Rode LM. 2000. Effects of barley grain processing
on extent of digestion and milk production of lactating cows. J. Dairy Sci. 83:554–568.
Yan, T., J. P. Frost, R. E. Agnew, R. C. Binnie, and C. S. Mayne. 2006. Relationships among
manure nitrogen output and dietary and animal factors in lactating dairy cows. J. Dairy
Sci. 89:3981–3991.
Yu, P., D. A. Christensen, J. J. McKinnon. 2003. Effect of variety and maturity stage on
chemical composition, carbohydrate and protein subfractions, in vitro rumen
degradability and energy values of timothy and alfalfa. Can. J. Anim. Sci. 83: 279–290.
Page 168
10. APPENDICES
10.1 Appendix Tables
Appendix Table I. Ruminal protozoal concentration (x 105/ml) of Entodinium spp., Holotrics, Cellulolytics
(Polyplastron, Diplodinium and Enoplastron sp.) and total in FAUN and PDFAUN lambs fed diet LOW
Day
FAUN PDFAUN
Entodinium spp. Holotrics Cellulolytics Total Entodinium spp. Holotrics Cellulolytics Total
1 6.163 0.150 0.238 6.550 10.29 0.18 0.20 10.67
2 5.713 0.256 0.206 6.175 9.97 0.29 0.20 10.46
3 6.225 0.250 0.206 6.681 9.02 0.22 0.12 9.36
6 7.188 0.325 0.175 7.688 5.78 0.06 0.09 5.93
9 10.031 0.431 0.313 10.775 3.11 0.00 0.08 3.19
12 9.844 0.313 0.119 10.275 1.70 0.00 0.07 1.77
15 12.963 0.506 0.181 13.650 1.18 0.00 0.08 1.25
18 12.050 0.456 0.206 12.713 0.76 0.00 0.08 0.83
21 12.350 0.413 0.294 13.056 0.19 0.00 0.07 0.26
22 11.156 0.375 0.313 11.844 0.00 0.00 0.09 0.09
23 11.375 0.400 0.306 12.081 0.00 0.00 0.09 0.09
24 11.150 0.406 0.300 11.856 0.00 0.00 0.08 0.08
25 11.063 0.375 0.313 11.750 0.00 0.00 0.09 0.09
26 11.300 0.369 0.256 11.925 0.00 0.00 0.09 0.09
148
Page 169
149
Appendix Table II. Ruminal protozoal concentration (x 105/ml) of Entodinium spp., Holotrics, Cellulolytics
(Polyplastron, Diplodinium and Enoplastron sp.) and total in FAUN and PDFAUN lambs fed diet HIGH
Day
FAUN PDFAUN
Entodinium spp. Holotrics Cellulolytics Total Entodinium spp. Holotrics Cellulolytics Total
1 5.038 0.125 0.094 5.256 8.544 0.269 0.355 9.168
2 5.063 0.188 0.150 5.400 8.219 0.263 0.292 8.774
3 6.231 0.131 0.163 6.525 8.331 0.281 0.223 8.835
6 7.213 0.256 0.275 7.744 5.775 0.150 0.214 6.139
9 9.569 0.225 0.231 10.025 4.175 0.038 0.149 4.361
12 12.388 0.275 0.425 13.088 3.813 0.000 0.132 3.944
15 15.700 0.431 0.669 16.800 3.694 0.000 0.134 3.828
18 16.725 0.338 0.600 17.663 3.844 0.000 0.152 3.996
21 16.669 0.388 0.563 17.619 3.756 0.000 0.071 3.827
22 16.163 0.363 0.788 17.313 3.925 0.000 0.104 4.029
23 16.206 0.400 0.756 17.363 3.819 0.000 0.126 3.944
24 16.206 0.369 0.750 17.325 3.806 0.000 0.137 3.943
25 16.256 0.394 0.700 17.350 3.725 0.000 0.078 3.803
26 15.975 0.363 0.725 17.063 3.938 0.000 0.132 4.069
149
Page 170
150
Appendix Table III. Mean (n = 4) ruminal protozoal concentration (x 105/ml) of
Entodinium spp., Holotrics, Cellulolytics (Polyplastron, Diplodinium and Enoplastron sp.)
and total for re-faunated lambs starting from period 2 to period 4.
Day Entodinium spp. Holotrics Cellulolytics Total
1 0.298 0.000 0.013 0.310
2 1.738 0.050 0.025 1.813
3 4.381 0.156 0.050 4.588
6 6.844 0.294 0.073 7.210
9 9.513 0.350 0.163 10.025
12 11.800 0.325 0.269 12.394
15 15.313 0.438 0.419 16.169
18 15.944 0.481 0.469 16.894
21 16.288 0.463 0.475 17.225
22 14.650 0.406 0.544 15.600
23 14.506 0.413 0.544 15.463
24 14.281 0.394 0.544 15.219
25 14.731 0.388 0.531 15.650
26 14.531 0.394 0.525 15.450
Page 171
Appendix Table IV. Urea-N recycling kinetics corrected using N intake as a covariate in partially-defaunated (PDFAUN) or
faunated (FAUN) growing lambs fed LOW or HIGH dietary crude protein levels1
LOW HIGH P value2
Item FAUN PDFAUN FAUN PDFAUN
SEM
Protozoa
Protein
Protozoa x Protein
Urea-N kinetics, g/d
Production, UER 27.63 23.88 37.98 31.85 1.53 0.008 0.001 0.38
Entry to GIT2, GER 10.75 8.25 19.27 13.18 0.85 0.001 0.001 0.03
Return to ornithine cycle, ROC 7.61 6.79 11.40 10.40 0.99 0.38 0.02 0.92
Loss to feces, UFE 1.58 1.90 0.66 0.85 0.25 0.33 0.01 0.76
Loss to urine, UUE 10.75 8.25 19.27 13.18 0.85 0.001 0.001 0.03
Re-use for anabolism, UUA 7.69 6.90 6.65 7.72 0.59 0.98 0.74 0.15
Fractional urea-N transfers
UER to urine 0.387 0.329 0.503 0.418 0.020 0.005 0.003 0.45
UER to GIT2 0.613 0.671 0.497 0.582 0.020 0.005 0.003 0.45
GER to ROC 0.447 0.401 0.594 0.553 0.032 0.20 0.005 0.95
GER to feces 0.094 0.122 0.045 0.031 0.015 0.20 0.005 0.60
GER to UUA 0.459 0.476 0.375 0.403 0.036 0.54 0.12 0.87
1LOW = 10% CP, HIGH = 15% CP (DM basis).
2Protozoa = PDFAUN vs. FAUN lambs; Protein = level of dietary CP (LOW vs. HIGH); Protozoa x Protein = interaction. PDFAUN
was achieved by addition of 6% (DM basis) linoleic acid-rich sunflower oil to the diet.
151
Page 172
Appendix Table V. Ruminal protozoal concentration (x 105/ml) of Entodinium spp., Holotrics, Cellulolytics
(Polyplastron, Diplodinium and Enoplastron sp.) and total in FAUN and PDFAUN lambs fed pelleted barley.
Day
FAUN PDFAUN
Entodinium spp. Holotrics Cellulolytics Total Entodinium spp. Holotrics Cellulolytics Total
1 5.61 0.16 0.09 5.86 7.41 0.13 0.23 7.77
2 6.61 0.23 0.18 7.01 6.94 0.14 0.21 7.29
3 6.86 0.23 0.17 7.27 6.26 0.09 0.12 6.47
6 7.34 0.22 0.16 7.72 4.41 0.05 0.10 4.56
9 8.56 0.20 0.14 8.91 3.02 0.07 0.06 3.14
12 9.23 0.26 0.16 9.65 1.71 0.02 0.02 1.74
15 9.44 0.25 0.15 9.84 1.28 0.00 0.01 1.28
18 8.44 0.22 0.14 8.79 0.50 0.00 0.00 0.50
21 7.24 0.21 0.11 7.57 0.21 0.00 0.00 0.21
22 6.63 0.17 0.10 6.90 0.00 0.00 0.00 0.00
23 5.83 0.16 0.08 6.07 0.00 0.00 0.00 0.00
24 6.07 0.15 0.08 6.31 0.00 0.00 0.00 0.00
25 5.97 0.17 0.08 6.22 0.00 0.00 0.00 0.00
26 6.09 0.15 0.09 6.32 0.00 0.00 0.00 0.00
152
Page 173
153
Appendix Table VI. Ruminal protozoal concentration (x 105/ml) of Entodinium spp., Holotrics, Cellulolytics
(Polyplastron, Diplodinium and Enoplastron sp.) and total in FAUN and PDFAUN lambs fed dry-rolled barley
Day
FAUN PDFAUN
Entodinium spp. Holotrics Cellulolytics Total Entodinium spp. Holotrics Cellulolytics Total
1 3.31 0.11 0.05 3.47 6.82 0.20 0.19 7.20
2 5.49 0.15 0.13 5.77 6.53 0.18 0.18 6.89
3 5.94 0.18 0.18 6.30 6.01 0.12 0.14 6.27
6 7.14 0.19 0.18 7.51 5.16 0.10 0.14 5.41
9 8.84 0.22 0.19 9.25 4.32 0.05 0.09 4.46
12 10.11 0.27 0.18 10.57 3.08 0.02 0.04 3.14
15 11.36 0.27 0.21 11.84 2.44 0.02 0.04 2.50
18 11.21 0.25 0.19 11.65 2.06 0.01 0.01 2.08
21 10.19 0.27 0.22 10.68 1.31 0.01 0.00 1.32
22 10.05 0.27 0.21 10.53 1.26 0.01 0.00 1.27
23 10.29 0.28 0.19 10.76 1.34 0.00 0.00 1.34
24 9.73 0.28 0.19 10.20 1.26 0.00 0.00 1.26
25 10.27 0.28 0.20 10.75 1.33 0.00 0.00 1.33
26 10.50 0.29 0.20 10.99 1.28 0.00 0.00 1.28
153
Page 174
154
Appendix Table VII. Mean (n = 4) ruminal protozoal concentration (x 105/ml) of
Entodinium spp., Holotrics, Cellulolytics (Polyplastron, Diplodinium and
Enoplastron sp.) and total for re-faunated lambs starting from period 2 to period 4.
Day Entodinium spp. Holotrics Cellulolytics Total
1 2.08 0.00 0.00 2.08
2 3.95 0.05 0.08 4.08
3 4.18 0.15 0.11 4.44
6 4.93 0.12 0.12 5.17
9 6.93 0.15 0.16 7.24
12 8.68 0.28 0.17 9.12
15 10.15 0.24 0.20 10.59
18 10.35 0.22 0.19 10.75
21 9.18 0.24 0.18 9.59
22 8.58 0.18 0.14 8.90
23 7.66 0.18 0.12 7.96
24 7.87 0.17 0.12 8.17
25 8.32 0.18 0.12 8.61
26 8.02 0.17 0.12 8.32
Page 175
155
10.2 Appendix Figures.
Appendix Figure I. Plasma urea-N over time post-feeding for samples collected on d 26.
Treatments were: faunated + dry-rolled barley (FAUN-DRB); faunated + pelleted barley
(FAUN-PB); defaunated + dry-rolled barley (DFAUN-DRB); and defaunated + pelleted barley
(DFAUN-PB). DFAUN was achieved by the addition of 6% (DM basis) linoleic acid-rich
sunflower to the diet. Differences were detected in PUN between time of sampling (time) 0, 2, 4,
6 and 8h (P = 0.001). There was no difference for time × barley grain processing (BP), time ×
protozoa and interaction (time × BP × protozoa). Each line represents means ± SEM for 4 lambs
and each sample was analyzed in triplicates.
Page 176
156
Appendix Figure II. Total serosal to mucosal urea flux (Jsm-urea, nmol/cm2/h) across dietary
treatments. A: compared to lambs fed MEDIUM and OSC-HIGH, Jsm-urea was higher in lambs
fed OSC-LOW treatment irrespective tissue assignment for in vitro treatments (P = 0.56; no
difference between control and phloretin-assigned tissues) during first 30-min flux period
(baseline) before addition of phloretin. B. Second 30-min consecutive flux period (inhibition)
was done to determine the effect of addition of phloretin and Jsm-urea did not change over time
within tissues (P = 0.94) control tissues in baseline vs. inhibition period) between 30-min
baseline and inhibition period. Each line represents mean ± SEM for 9 lambs.
Page 177
Appendix Figure III. Time-course changes in transepithelial conductance (Gt) of ruminal epithelia of lambs fed the medium or
oscillating dietary crude protein concentrations (n = 9).
157
Page 178
158
Appendix Figure IV. Ruminal ammonia-N over time post-feeding for samples collected on d
26. Treatments were: faunated + dry-rolled barley (FAUN-DRB); faunated + pelleted barley
(FAUN-PB); defaunated + dry-rolled barley (DFAUN-DRB); and defaunated + pelleted barley
(DFAUN-PB). DFAUN was achieved by the addition of 6% (DM basis) linoleic acid-rich
sunflower to the diet. Differences were detected in ruminal ammonia-N between time of
sampling (time) 0, 2, 4, 6 and 8 h (P = 0.001). There was no difference for time × barley grain
processing (BP), time × protozoa and interaction (time × BP × protozoa). Each line represents
means ± SEM for 4 lambs and each sample was analyzed in triplicates.