Page 1
Research in Higher Education Journal Volume 29, September, 2015
Factors that influence, Page1
Factors that influence students choosing a marketing course
Nasim Z. Hosein
Northwood University
ABSTRACT
This research incorporates two attitude-measuring models, observable and abstract, to
compare the attributes of the marketing education program in terms of their relative importance
in determining what factors influence students' and the impact of these attributes on students’
choosing a marketing course. To analyze the data SEM techniques were used and the findings
indicate that students' are influenced by factors associated closely to the program's observable
and abstract attributes. These discoveries should assist in the development of a promotional
campaign emphasizing the qualities of the marketing program which will incorporate the most
significant attributes from this study. The effectiveness of the model in this study can also be
demonstrated in measuring student attitudes in other vocational area.
Keywords: student factors choosing a marketing course, TRA, SEM, PLS
Page 2
Research in Higher Education Journal Volume 29, September, 2015
Factors that influence, Page2
INTRODUCTION
The goal of this research paper was to study the attitudes and evaluations of students and
also to measure how these factors influence them to choose a marketing course. This student-
based research about the attitudes, evaluations and outlook of students with regards to the
marketing program can provide information to educators to inform and to attract students with
the appropriate promotional packages. Through these findings; using models effectively to
measure factors that influence a students' choice, educators can be better prepared for the future
by modifying or fine-tuning their marketing programs. Specific details are made available to
researchers that scholastic decision makers and educators can apply easily to continuously
increase the perception of the marketing program. “Student based research can recognize and
support in explaining issues in education programs that have led to declining enrollments that
may be due to students’ insight about courses and their career path.” (Hosein, 2014).
“It is clear that there is more competition within the higher education sector and therefore
meeting the requirements of students is placing a greater burden on academic organizations to
address these needs” (Binney, Kennedy & Hall, 2004; Cheng &Tam, 1997). “A marketing
concept in which the consumers’ expectations are expected to be met, the student is regarded as
the consumer and ongoing studies of student satisfaction” (Elliot and Shin 2002; Gremeler &
McCollough 2002) “are some of the quality assurance guidelines methods used to oversee this
concern in higher education” (Centre for Education and Development and Support 2004; King et
al. 1999). “There are many complex issues that are presented when studying large classes,
(Cuseo 2007) as large classes are usually a combination of students across various disciplines.”
“Thus, the view may be a bit distorted as students may have a different reason or point of view
about the marketing class they are taking since marketing is not their major field of study. This
paper focuses solely on students who are in an upper level marketing class whose major field of
study is business.” (Hosein, 2014).
The impact of consumers' attitudes towards the attributes of a product or brand and the influence
on their purchasing or choosing behavior is supported through marketing research and theory.
Based on the consumers impression of the product from two perspectives: observable and
abstract attributes; these attitudes are shaped.
“Attitude toward the behavior is defined as a person's general feeling of favorableness or
unfavorableness for that behavior" (Ajzen and Fishbein, 1980), Lutz (1981, p. 234) “definition of
attitude is one expressing hidden feelings of liking or not liking towards an object, person, issue,
or behavior. Attitude toward behavior is a function of the product of one's belief that performing
the behavior will lead to certain outcomes and an evaluation of the outcomes i.e., positive feeling
towards a career in marketing will shape a students’ attitude towards the marketing program.”
Individuals by understanding the specifics about the product or brand (marketing course) or by
direct interaction with the product or brand (marketing course) over time learn or develop
attitudes. With respect to the attitude of the object, these learned attitudes are used by consumers
as a guide to their behavior, thereby constantly developing negative or positive behavioral forms.
“Measuring attitude can offer some dimension of a consumers’ inclination towards a particular
brand or product. The presumption is that attitudes are a sign of behavior” (Hatzious, 1996). The
perception is that if someone is motivated favorably towards an object (product or brand) it
would lead to a positive outlook with respect to that object, or within this context encourage
positive behavior with regards to the marketing program. Although the TRA/TPB model is used
noting that attitudes towards the marketing program; either negative or positive, is formed by the
Page 3
Research in Higher Education Journal Volume 29, September, 2015
Factors that influence, Page3
students’ opinions, evaluations and attitude of the benefit to them of the marketing program. And
this advantage is simply the perception of their career after graduating.
This research identifies how students view certain attributes of the marketing education program,
then assesses each of these attributes associated with students' choosing a marketing course. The
findings will also demonstrate how effective the programs are from a student’s perspective.
Which will assist educators in developing promotional campaigns that are effective in order to
attract and retain students to the program.
LITERATURE REVIEW
Attracting students to the marketing major has been a topic of discussion for a number of
years (Hugstad 1997; LaBarbera and Simonoff 1999). Unfortunately, discussion vs. research has
been almost the sole focus on this issue. Little has been done to improve the situation in
marketing departments across the country (Carney and Williams 2004). In fact, little has been
required because of the growth cycle of colleges and education. And what was measured tended
to be towards a particular course and the course material, but not towards the students’
perception of the fit of the course towards their career.
Camey and Williams (2004) suggested that by examining student beliefs about marketing in
general and the expected impact of the material learned in a Principles of Marketing class that it
would have an impact on their education and personal life. Most of the business students choose
a major that has an image of a demanding and professional career path. And thus career
opportunities are significant factors in the selection of a business major for these students.
Other articles (Kimberly, 2003) focus on skills needed in the workplace such as: job search
skills-resume writing, interview skills, professional business image/dress, salary negotiations,
networking, communication and listening skills, written communication, and oral presentation
skills.
While some assess the effects of technology on learning (Sprague and Dahl, 2010) through
measuring student attitudes and preferences and identifying student performance outcomes
relating to the use of technology.
Another article (Ackerman, Gross and Perner, 2003), focus on how to better improve the quality
of teaching by not only focusing on the past strategies of firms, but giving more thought to
anticipating and adjusting to marketplace changes. Although both educators and employers are
concerned about this disconnect, little is known about how instructors should address it.
Aggarwal, Vaidyanathan and Rochford (2007) analyzes of the state of the marketing discipline
as characterized by the quality of incoming students choosing to major in marketing. Compared
to other business majors, marketing is apparently attracting among the lowest quality students.
One question raised by their study is whether the lower quality of marketing students is a new
phenomenon or whether marketing students have consistently performed at low levels on
standardized tests.
McCorkle, Payan, Reardon and Kling (2007) provide an analysis of both student perceptions
about creativity and their levels of creativity. The results indicate that creativity is important to
their career. However, marketing students placed greater importance on creativity than other
business students and found that the marketing and other business students believed that
creativity is a skill that can be learned.
Based on these findings, the marketing programs can be modified or adjusted by educators for
better results. “This, research-based data can provide educators with information about students’
Page 4
Research in Higher Education Journal Volume 29, September, 2015
Factors that influence, Page4
attitudes and expectations of the marketing program so that they can develop the appropriate
promotional packages to inform and attract students.” (Hosein, 2104). Most empirical analyses
of the quality of marketing students seem to lump them together with all other students. In
addition, many conclude that the quality of marketing students is based on an analysis of the
perceptions of faculty or their evaluation of a course.
Theory of reasoned action is based on the proposition that an individual's behavior is determined
by their behavioral intention (BI) when performed; it provides the most accurate prediction of
behavior (Fishbein and Ajzen, 1975). Behavioral intention is a function of two factors: one's
Attitude toward the behavior (A) and Subjective Norm (SN).
“Attitude toward a behavior is defined as a person's general feeling of favorableness or
unfavorableness for that behavior" (Ajzen and Fishbein, 1980). “Subjective Norm is defined as a
person's perception that most people who are important to him think he should or should not
perform the behavior in question" (Ajzen and Fishbein, 1980). “Therefore, attitude toward
behavior is a function of the product of one's salient belief (B) that performing the behavior will
generate certain outcomes and will lead to an evaluation of those outcomes (E), i.e., rating of the
desirability of the outcome.” (Ajzen and Fishbein, 1980).
External variables to the model are thought to influence intentions but only to the extent of their
effects on either attitudes or subjective norms (Fishbein and Ajzen, 1975). The theory of
reasoned action has been successfully applied on a larger scale in predicting the performance of
behavior and intentions, such as predicting turnover (Prestholdt et al., 1987), education
(Fredricks and Dossett, 1983) and breast cancer examination (Timko, 1987).
Figure 1: Theory of Reasoned Action
Definitions of the model's factors are as follow:
* Attitude is how we feel about the behavior and is generally measured as a favorable or
unfavorable mind-set.
* Subjective norm is defined as how the behavior is viewed by our social circle or those who
influence our decisions.
* Intention is defined as the propensity or intention to engage in the behavior.
* Behavior is the actual behavior itself.
Figure 2, from a theoretical framework perspective, shows that a curriculum must first achieve in
getting a students’ attention to the program before they will think about choosing (behavior) the
courses. However, unless the students have a high level of interest (intention), confidence in their
learning, a measurable method to evaluate the course objectives (attitude) or measured value
towards their career and a method to compare other courses (subjective norms), they are unlikely
to consider taking these courses. According to the model, any given behavior is most likely to
occur if one has a strong intention to perform the behavior, if they have the necessary skills
Page 5
Research in Higher Education Journal Volume 29, September, 2015
Factors that influence, Page5
required and if there are no constraints preventing from performing the behavior then there is a
high probability that the behavior will be performed.
Figure 2: Key factors in measuring perception relationship to TRA, a generic theoretical
framework
The first implication in using the theoretical framework is to identify that behavior is the
target for choosing a course. The definition of behavior involves several elements; the action
(taking/attending), the target (marketing course) and the context (required course of action).
Individual behavior is suggested to be the result of thoughtful reflection - a cognitive process of
evaluating what action is appropriate in a specific situation. This idea establishes the basis for
incorporating an individual’s intentions and beliefs as factors that influence his or her resulting
behavior. This led to the development of TRA as a model for predicting individual behavior.
TRA, as originally conceived, applies to behaviors under a person’s volitional control (Ajzen,
1988). Though all behavior may not always be voluntary (ie. behavior may be mandated or
obstacles may exist that prevent the adoption of the behavior (Ajzen, 1991)).
TRA was developed by Ajzen and Fishbein (1980) to guide research concerning consciously
intended behaviors. According to TRA, the performance of a specified behavior is determined by
the individual’s intention to perform that behavior, which, in turn, is determined by the
individual’s attitude towards the behavior and his or her perceptions of social pressures (Le.
subjective norm) for performing (or not performing) the behavior in question (Ajzen, 1988).
TRA has received considerable empirical support (Sheppard et al, 1988) and provides a suitable
model for this research because trusting behaviors involve an individual’s intention to trust in a
given situation.
Comparison
Career
Interest Choosing
Demographics
Attitudes toward
the program
Social Influence
Motivation to
Comply
Behavioral beliefs
Confidence
Evaluation
Page 6
Research in Higher Education Journal Volume 29, September, 2015
Factors that influence, Page6
PURPOSE OF THE STUDY
This study’s purpose was to determine how university students feel about certain
particulars of the program and to identify their outlook with regards to the marketing course.
Specifically, the study focuses on the following research objectives:
1. Students’ confidence in their marketing ability
2. What is their evaluation of the marketing course offered in the program?
3. How do the marketing course compare to other business courses?
4. What is their view of marketing as a career?
5. What is their interest in the marketing course offered in the program?
6. Why did they choose a marketing course?
METHODOLOGY
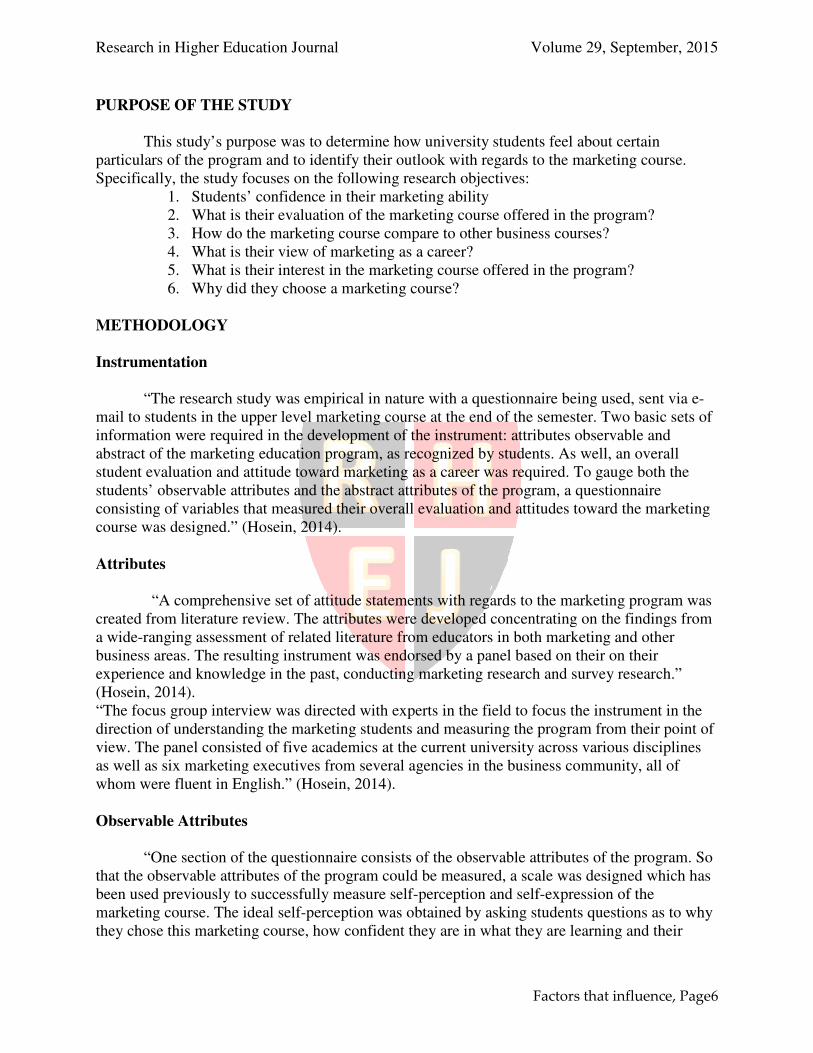
Instrumentation
“The research study was empirical in nature with a questionnaire being used, sent via e-
mail to students in the upper level marketing course at the end of the semester. Two basic sets of
information were required in the development of the instrument: attributes observable and
abstract of the marketing education program, as recognized by students. As well, an overall
student evaluation and attitude toward marketing as a career was required. To gauge both the
students’ observable attributes and the abstract attributes of the program, a questionnaire
consisting of variables that measured their overall evaluation and attitudes toward the marketing
course was designed.” (Hosein, 2014).
Attributes
“A comprehensive set of attitude statements with regards to the marketing program was
created from literature review. The attributes were developed concentrating on the findings from
a wide-ranging assessment of related literature from educators in both marketing and other
business areas. The resulting instrument was endorsed by a panel based on their on their
experience and knowledge in the past, conducting marketing research and survey research.”
(Hosein, 2014).
“The focus group interview was directed with experts in the field to focus the instrument in the
direction of understanding the marketing students and measuring the program from their point of
view. The panel consisted of five academics at the current university across various disciplines
as well as six marketing executives from several agencies in the business community, all of
whom were fluent in English.” (Hosein, 2014).
Observable Attributes
“One section of the questionnaire consists of the observable attributes of the program. So
that the observable attributes of the program could be measured, a scale was designed which has
been used previously to successfully measure self-perception and self-expression of the
marketing course. The ideal self-perception was obtained by asking students questions as to why
they chose this marketing course, how confident they are in what they are learning and their
Page 7
Research in Higher Education Journal Volume 29, September, 2015
Factors that influence, Page7
evaluation of the course taken. The idea of self-expression is obtained when students rate how
they compare the marketing course to other business courses and their interest in the course and
the relevance to their career. For this attribute, several measurement scales were used, from
strongly disagree to strongly agree, scale of 1-5, as well as a very unlikely to very likely, scale of
1-5. Then they were questioned as to the degree to which they thought that the marketing
education program influenced each construct under this attribute.” (Hosein, 2014).
Abstract Attributes
“This part of the questionnaire measures the students’ perceptions of the abstract
attributes with respect to the marketing course. The students were asked to indicate on the
questionnaire their significance assessment of their perception of the program with regards to
their career. For this attribute, the measurement was from strongly disagree to strongly agree,
scale of 1-5. Then they were questioned as to the degree they thought that the marketing program
influenced this construct under this attribute.” (Hosein, 2014).
Student Research Analysis
The research for this study was conducted on six constructs, namely:
1. Students confidence in their marketing ability
2. Students evaluation of marketing courses
3. Students comparison of other business courses to this marketing course
4. Students perspective towards a career in marketing
5. Students interest in marketing
6. Students reason for choosing a marketing course
The number average signifies the students who responded positively for the questions, for all of
the following data analysis. That is: either agree/strongly agree or likely/very likely.
Students’ confidence in their marketing ability
Investigations Mean
Understanding of marketing concepts 3.97
Ability to write about marketing concepts 3.65
Ability to explain about marketing through discussion 3.79
Analyzing case studies 3.70
Understanding concepts through the business examples 4.44
Table 1: Confidence in Marketing Ability …
The questions were about the student’s ability and understanding in discussing marketing
concepts.
To explain and evaluate marketing concepts, some students have the knowledge and
ability, while many were confident in their grasp of marketing concepts. The variety of responses
Page 8
Research in Higher Education Journal Volume 29, September, 2015
Factors that influence, Page8
given suggests that students pursue knowledge through business examples and as well that
students understand the concepts and have some confidence in the subject.
Students’ evaluation of marketing course
Investigations Mean
Reading the text 4.14
Doing assigned homework 3.16
Research on Internet 3.75
Participating in class discussion 3.97
Writing reports 3.91
Working on final project 4.12
Table 2: Evaluation of Marketing Course …
The questions were regarding the impact the marketing course had on the students learning.
Evaluating the course centered on students learning, some suggested that assigned homework
wasn’t very helpful to them while reading the text was of some help for most students in their
learning. With the variety of responses given (some preferred reading while others preferred to
surf the Internet) indicates that for the method of learning students have a preference.
Students’ comparison of other business courses to the marketing course
Investigations Mean
Marketing course was more challenging 4.36
Marketing course was more interesting 4.16
I learned more in this marketing course 3.71
I had more control over the pace of learning in this course 3.02
I had to prepare more for this marketing course 3.33
I would take more marketing courses 4.01
I would recommend this course to other students 3.95
Table 3: Comparison of Other Business Courses to Marketing Course …
The questions were regarding the student’s comparison between other business courses
previously taken to the recent marketing course.
Comparing to other business courses, students assessed the course centered on how stimulating,
motivating and challenging it was. The course as most other courses was challenging as students
indicated, while fewer specified that they had control over the pace of the course. The variety of
responses given indicates that most will recommend the course to others and there wasn’t much
variance between the courses (marketing and other business).
Page 9
Research in Higher Education Journal Volume 29, September, 2015
Factors that influence, Page9
Students’ perception towards a career in marketing
Investigations Mean
Course helps in understanding marketing concepts 4.23
Helps in choosing a career path 4.02
Find a job after graduating 3.75
Advances chosen career field 3.95
Useful in the future 4.26
Some marketing knowledge is required 4.45
I will pursue a career in marketing 3.96
Table 4: Viewpoint towards a Career in Marketing …
The questions were regarding the student’s perception of a career in the field of marketing.
Even if students may not pursue a career in marketing when evaluating the course most
indicated, focusing on their career objectives, that the marketing course will be helpful to them in
the future and that the course is helpful to them in understanding marketing concepts. The variety
of responses by students indicates that taking this marketing course would be helpful with their
careers or in the future.
Students’ interest in marketing
Investigations Mean
Understanding principles of marketing 3.41
Understanding advances in marketing 3.21
Pursuing a career in marketing 4.14
Using marketing knowledge in the future 4.70
Working on assignments/projects 3.05
Table 5: Interest in Marketing …
The questions were regarding the student’s definite interest in this marketing course.
Many of the students were involved in the marketing course because of their career selections or
their use in the future of the knowledge and some were interested in knowing the fundamentals
of marketing. As students have varying interests (some due to the subject ‘marketing’ and some
for career choices), the variety of responses given suggested that students place some importance
in understanding marketing concepts.
Page 10
Research in Higher Education Journal Volume 29, September, 2015
Factors that influence, Page10
Students’ reasons for choosing a marketing course
Investigations Mean
Course was more interesting 3.76
It provides a wider career base 3.94
Allows flexibility to specialize in my career 3.95
Fits in with other courses 4.27
Prior knowledge of marketing 3.15
It is a popular subject 3.13
It was compulsory 2.95
It was recommended to me 2.98
Table 6: Reasons for Choosing this Marketing Course…
The questions were regarding the students reasoning for choosing this marketing course.
Most students responded that the course would offer a better career platform and would be more
supportive to them in their careers. When evaluating based on reasons that they chose (how
interesting and appropriate) to them this marketing course was. The responses given indicates
that most students chose to take them because of career initiatives rather than recommendations
or curriculum choice as they had a wide range of reasons in choosing the marketing course.
Measuring Intent
Is the choice selection process affected, when an intent question is asked? “Most students
follow a simple three-stage model of choice proposed by” (Nedungadi, Mitchell and Berger,
1993). “First, students will generate alternatives, in a stimulus-based manner, a memory-based
manner, or most likely, some combination of the two. Second, students will determine which
alternatives to consider selecting. Lastly, they will then select/choose.” (Nedungadi, Mitchell and
Berger, 1993). “Thoughts, such as attitudes and intentions may not as yet be fully developed at
each of these stages. However, as students’ progress through each stage, it becomes increasingly
likely that they will form these cognitions.” (Nedungadi, Mitchell and Berger, 1993).
The factors that are a result from taking a marketing class are measured by the steps that
the students are progressing through. Students’ learning is enhanced as they move through the
different cognitive stages and as well as their attitudes and ultimately their intentions, which in
this circumstance is choosing a marketing course. These measurements of Confidence,
Evaluation, Comparison, Career, Interest, and Choosing are all observable and abstract attributes
that direct a student to a specific behavior.
Noted, when measuring intentions that there will some concerns within a large group of
students who seemingly will not all be at the same stage in their decision-making process. Two
reasons for this suggestion were first, asking intent questions will in some circumstances lead to
an existing attitude being made more defined, and second, measuring intentions will propel
students’ thoughts that will influence changes in attitude, behavior or choosing.
This research focuses on students that are currently taking a marketing course and involved in
some cognitive development during the class. Measuring this intent to choose is central on two
criteria: first, choosing essential course related attributes, such as attitudes, or behavior; second,
assessing how choosing a course can prompt the students to develop thoughts that may influence
Page 11
Research in Higher Education Journal Volume 29, September, 2015
Factors that influence, Page11
in changing or developing these judgments. In order to gauge their intentions; their intentions are
assessed when these cognitive processes are measured.
PERSONAL FACTORS
Confidence
Confidence involves measuring students’ self-belief that there is a cognitive process
associated with the content of marketing courses, regardless of whether by oneself or being
included in a group. It indicates the resolve for being in the class.
Evaluation
Evaluation pertains to the method used in the learning process while attending marketing
classes this may be already known to or available to the students.
Comparison
The ability to compare marketing courses to other business courses will give the student
an overall guideline in assessing the courses from a thought-provoking and stimulating
perspective.
Career
This involves the abstract attributes about a students’ perception of the marketing course
with regards to career opportunities and career development. This increases knowledge to our
thought development about choosing the courses.
Figure 3: Conceptual measurement model. The model for the study based on TRA
Comparison
Confidence
Evaluation
H1a
H1b
H1c
Interest Choosing
Courses
Career H1d
H2
H3
H4
Page 12
Research in Higher Education Journal Volume 29, September, 2015
Factors that influence, Page12
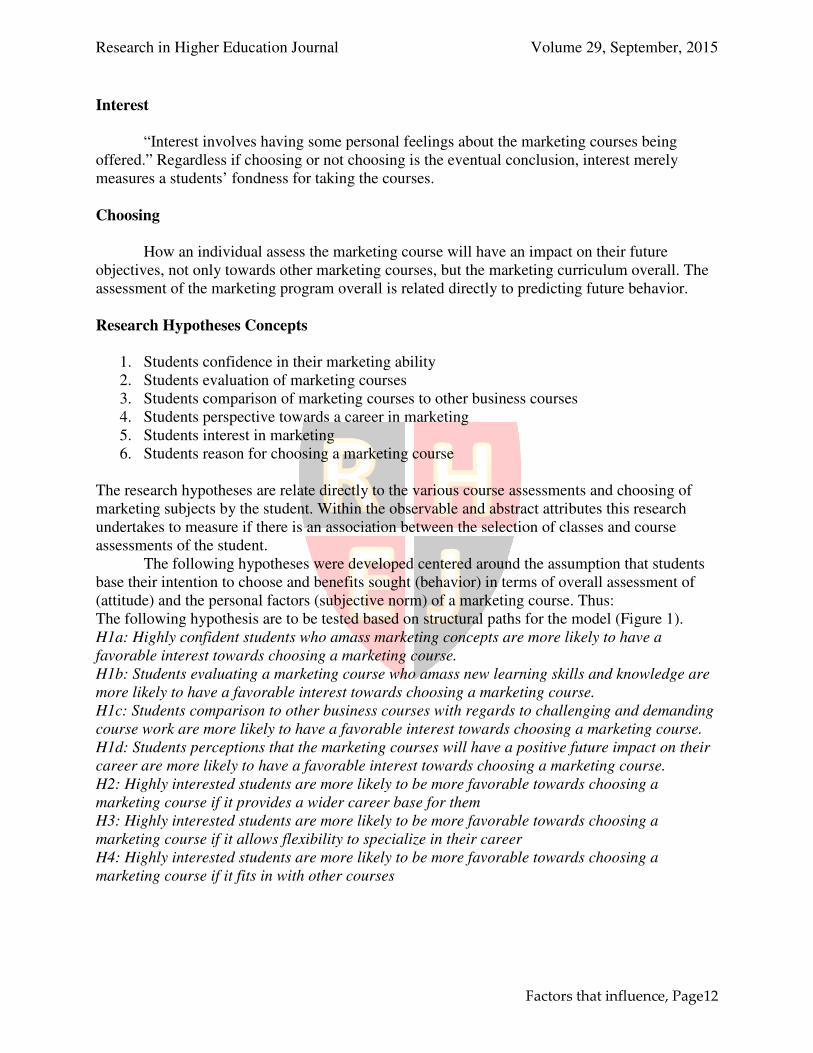
Interest
“Interest involves having some personal feelings about the marketing courses being
offered.” Regardless if choosing or not choosing is the eventual conclusion, interest merely
measures a students’ fondness for taking the courses.
Choosing
How an individual assess the marketing course will have an impact on their future
objectives, not only towards other marketing courses, but the marketing curriculum overall. The
assessment of the marketing program overall is related directly to predicting future behavior.
Research Hypotheses Concepts
1. Students confidence in their marketing ability
2. Students evaluation of marketing courses
3. Students comparison of marketing courses to other business courses
4. Students perspective towards a career in marketing
5. Students interest in marketing
6. Students reason for choosing a marketing course
The research hypotheses are relate directly to the various course assessments and choosing of
marketing subjects by the student. Within the observable and abstract attributes this research
undertakes to measure if there is an association between the selection of classes and course
assessments of the student.
The following hypotheses were developed centered around the assumption that students
base their intention to choose and benefits sought (behavior) in terms of overall assessment of
(attitude) and the personal factors (subjective norm) of a marketing course. Thus:
The following hypothesis are to be tested based on structural paths for the model (Figure 1).
H1a: Highly confident students who amass marketing concepts are more likely to have a
favorable interest towards choosing a marketing course.
H1b: Students evaluating a marketing course who amass new learning skills and knowledge are
more likely to have a favorable interest towards choosing a marketing course.
H1c: Students comparison to other business courses with regards to challenging and demanding
course work are more likely to have a favorable interest towards choosing a marketing course.
H1d: Students perceptions that the marketing courses will have a positive future impact on their
career are more likely to have a favorable interest towards choosing a marketing course.
H2: Highly interested students are more likely to be more favorable towards choosing a
marketing course if it provides a wider career base for them
H3: Highly interested students are more likely to be more favorable towards choosing a
marketing course if it allows flexibility to specialize in their career
H4: Highly interested students are more likely to be more favorable towards choosing a
marketing course if it fits in with other courses
Page 13
Research in Higher Education Journal Volume 29, September, 2015
Factors that influence, Page13
METHODOLOGY
Sample and data collection
An undisguised questionnaire was used to gather data for the study. The questionnaire
was pre-tested several times among business associates (focus group members), students as well
as various faculty members in the marketing department, in order that face validity of the items
on the questionnaire were verified. The reason for pretesting was to pinpoint any
misinterpretation in the phrasing of the questions on the questionnaire.
“This method for the questionnaire was selected for its low-cost outlay and ease of issue.
Personal interviews, although considered the most reliable method for qualitative data research,
were not considered feasible due to their high cost in terms of time needed. The survey
instrument was made up of 2 parts: the introductory and general questions and the demographics.
For part 1 all questions were measured on an interval scale (5 point). The student questionnaire
was given to all students in the upper level marketing class, 989 students, in their final week in
the course. It consisted of a combination of both open and closed questions, including a few of a
qualitative nature, making a total of 45. This was answered by the students, and then sent to me
via e-mail, with a response rate of 87 per cent.” (Hosein, 2014).
The questionnaire was analyzed using SPSS software to calculate means, frequencies and
reliability. By reviewing existing literature content validity was established. A test for ‘goodness
of fit’ was performed using structural equation modeling (SEM), it was chosen as it is a
multivariate technique and is able to:
• assess the validity of the causal structure
• investigate the associations among the unobservable and observable variables;
The two sections of this technique are: first, as a structural model, it highlights the
relationships among the constructs. Second, as a measurement model, it indicates in relation to
the observed variables how well the constructs are measured.
Our research model has several mediators and tests multiple complex relationships
thereby making (SEM) a suitable technique. Partial Least Squares (PLS) was chosen as it
handles both formative and reflective indicators, whereas other SEM techniques do not. In
addition, PLS is prediction oriented and does not assume multivariate normality unlike SEM
techniques such as LISREL. PLS Graph Version 3, Build 1130 (Courtesy of Dr. Chin, University
of Houston) was the software tool used to conduct the analysis.
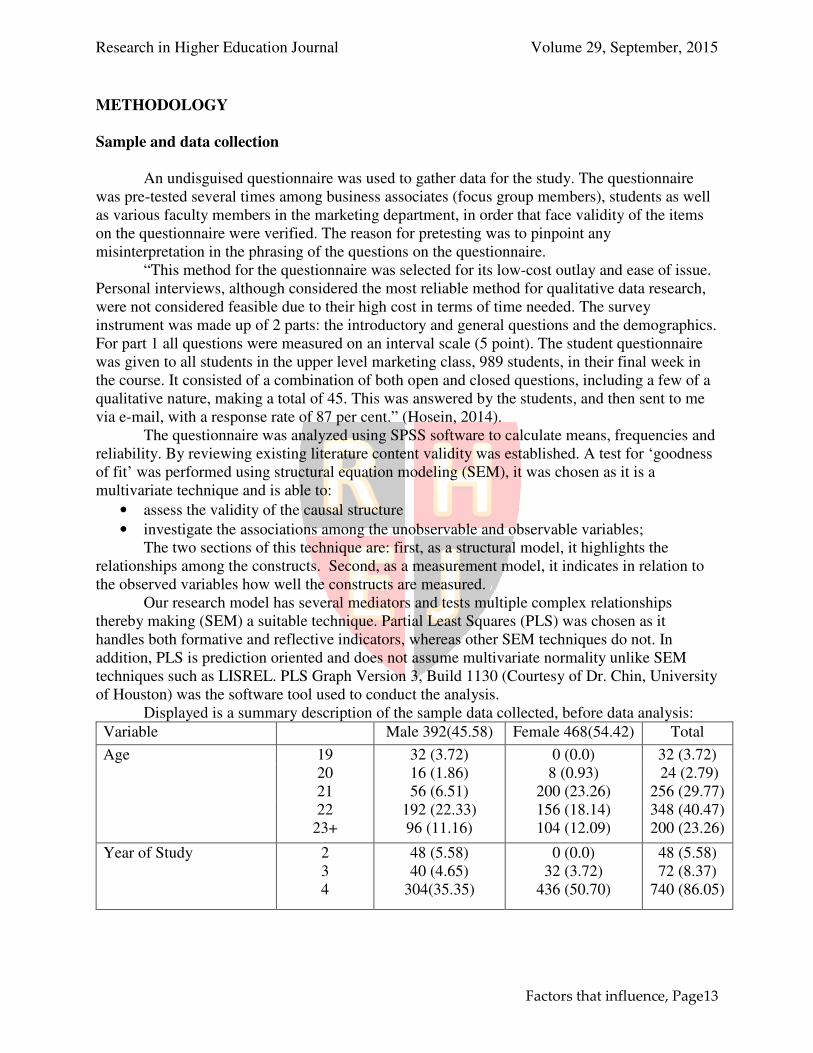
Displayed is a summary description of the sample data collected, before data analysis:
Variable Male 392(45.58) Female 468(54.42) Total
Age 19 32 (3.72) 0 (0.0) 32 (3.72)
20 16 (1.86) 8 (0.93) 24 (2.79)
21 56 (6.51) 200 (23.26) 256 (29.77)
22
23+
192 (22.33)
96 (11.16)
156 (18.14)
104 (12.09)
348 (40.47)
200 (23.26)
Year of Study 2
3
4
48 (5.58)
40 (4.65)
304(35.35)
0 (0.0)
32 (3.72)
436 (50.70)
48 (5.58)
72 (8.37)
740 (86.05)
Page 14
Research in Higher Education Journal Volume 29, September, 2015
Factors that influence, Page14
Major of Study Marketing
Management
Other
260 (30.23)
64 (7.44)
68 (7.91)
312 (36.28)
8 (0.93)
148 (17.21)
572 (66.51)
72 (8.32)
216 (25.12)
Hours preparing for
Marketing course
<5
> 5
304 (35.35)
88 (10.23)
284 (33.02)
184 (21.40)
588 (68.37)
272 (31.63)
Hours preparing for all
courses
<5
5-10
11-15
>15
88 (10.23)
180 (20.93)
68 (7.91)
56 (6.51)
96 (11.16)
244 (28.37)
64 (7.44)
64 (7.44)
184 (21.40)
424 (49.30)
132 (15.35)
120 (13.95)
Table 7: Demographics of Study Sample-860 Subjects
TESTING FOR INTERNAL CONSISTENCY: THE MEASUREMENT MODEL
Reliability Analysis
In order to assess reliability of the measures, PLS (Partial Least Squares) as well as
Cronbach's alpha - SPSS were used (See Table 8). Cronbach's alpha assesses the amount of
variance in accordance to the actual variable score that the research proposes to measure. It
reveals the similarity of the items in the scale and the consistency of the measure.
Construct/Latent Variables Mean Reliability
Cronbach’s
alpha
Confidence cn1, cn2, cn3, cn5 .8953
Understanding marketing concepts
Ability to write about marketing concepts
Ability to explain [marketing concepts] through discussions
Succeeding in a university [marketing/business] course
Evaluation ev1, ev2, ev4, ev6 .7934
Reading the textbook
Doing assigned homework
Participating in classroom discussion
Writing reports/final project
Comparison cm1, cm2, cm3, cm7 .7446
Marketing course was more challenging
Marketing course was more interesting
I learned more in this marketing course
I would recommend this course to other students
Career ca2, ca3, ca4, ca5 .8598
Helps in choosing a career path
Find a job after graduating
Advances chosen career field
Page 15
Research in Higher Education Journal Volume 29, September, 2015
Factors that influence, Page15
Useful in the future
Interest in1, in3, in4, in5 .7299
Understanding principles of marketing
Pursuing a career in marketing
Using marketing knowledge in the future
Working on marketing assignments/projects
Choosing ch2, ch3, ch4 .8052
Course provides a wider career base
Allows flexibility to specialize in my career
Fits in with other courses
Table 8: Construct and associated latent variables and reliability scores
“PLS evaluates the reliability of an item (individual) and assumes no distribution form
(like multi-normality) of the data” (Gopal, Bosrom and Chin, 1992). “To measure the loadings of
each item with its construct PLS is recommended. An indication to when significant variance is
mutual between each item and its construct, the value of the loadings should be higher than 0.5
(ideally higher than 0.70). For this research, items were not included when removing them further
increases the levels of reliability” (Chin, 1998).
“The acceptable level of Average Variance Extracted (AVE) is 0.50, this shows that more
than 50% of the variance of the indicators has to be accounted for by the latent variables” (Chin,
1998). Measuring the reliability of the construct, AVE was calculated and included in the scale
(See Table 9). Sufficient reliability is realized throughout all of the constructs as they exceed the
minimum AVE level.
Table 9:
Reliability of Study
Scale Cronbach’s
Alpha
Composite
Factor
Reliability
Average
Variance
Extracted
(AVE)
Number
Of
Items
Confidence
Evaluation
0.8593
0.906
0.706
4
0.7934
0.755
0.562
4
Comparison
0.7446
0.761
0.565
4
Career
Interest
Choosing
0.8598
0.7299
0.8052
0.908
0.832
0.874
0.711
0.558
0.699
4
4
3
Page 16
Research in Higher Education Journal Volume 29, September, 2015
Factors that influence, Page16
Validity
Validity refers to how a study correctly measures the specific concept that the researcher
has set out to test. Whereas, validity is aligned with the research realization at reflecting the
reality it claims to represent, reliability is aligned with the exactitude of the procedure or actual
instrument used in measuring. Construct and content validity are the two types of validity
implemented to evaluate scale evaluation.
There are three steps that are used to measure if a research has construct validity. “First,
the theoretical associations must be stated. Second, the empirical associations between the
measures of the concepts must be studied. Third, the empirical evidence must be construed in
terms of how it explains the construct validity of the specific measure being tested.” (Chin, 1998)
“Construct validity examines the magnitude on a scale, to which a theoretical variable of interest
is measured. It seeks a correlation between a theoretical concept and a specific measuring device
or procedure such as a questionnaire. Construct validity can be divided into two sub-categories:
convergent validity and discriminant validity. Convergent validity denotes the degree to which
several measures of a construct agree with one another or should theoretically be related.”
(Cronbach & Meehl 1955). Partial Least Squares Method was used in this study to assess
convergent validity, the item loadings (for item reliability) of the indicators for each of the
constructs, were evaluated (See Table 9). “These item loadings should be greater than 0.71 for
each individual loading” (Chin, 1998)
“Discriminant validity is the customary procedural counterpart to convergent validity. It
signifies the extent to which, in the same model, measures of a specified construct are different
from measures of another. In a model when a construct has a higher variance with its own
measures than it shares with other constructs, discriminant validity exists.”(Fornell & Larcker,
1981). ”To measure discriminant validity, Average Variance Extracted is used (i.e., the average
variance shared between a construct and its measures).” (Chin, 1998)
Content validity denotes the representation and completeness of the objects used in
creation of a scale. It assesses if the items in the scale reflects the true purpose of the construct as
real world representation and is qualitative in nature. To institute content validity, a set of items
initially were collected from previous articles and were examined to create an appropriate subset
of items that apply to student behavior. This subset was then selected for this study.
Partial Least Squares method was employed to evaluate discriminant validity by exploring the
following: “(1) within its’ own construct and other constructs item loadings and cross loadings of
the indicators, and (2) comparing the correlation among the square root of the average variance
extracted (AVE) against the construct scores.” (Chin, 1998). “The item loadings on its own
construct should be greater than on other constructs and the scores (correlation) should be lower
than the square root of the AVE for its own construct” (Chin, 1998) (See Table 10).
Page 17
Research in Higher Education Journal Volume 29, September, 2015
Factors that influence, Page17
Indicator Confidence Evaluation Comparison Career Interest Choosing
Confidence 0.840
Evaluation 0.245 0.750
Comparison 0.549 0.240 0.752
Career 0.582 0.004 0.438 0.843
Interest 0.655 0.150 0.429 0.652 0.747
Choosing 0.535 0.289 0.612 0.561 0.416 0.836
Table 10: Correlation among Variable Scores (Square Root of AVE in Diagonals)
TESTING FOR SIGNIFICANCE: THE STRUCTURAL MODEL
The Path Analysis Method was used in data analysis to verify the theoretical model in
order to make interpretations with regards to the hypotheses. The fit of the model was evaluated
in order to determine validity and the statistical significance of the path coefficients evaluated
with regards to conclusions on the hypotheses. Table 11 displays the standardized regression
coefficients “path coefficients” (β) generated from SEM as well as the R² values and T-statistics.
Endogenous
Variable
R² Exogenous
Variable
Standardized
Coefficient
T-
Statistic
P-Value
less than
Interest
0.551
Confidence 0.409 12.115 0.021*
Evaluation 0.045 1.164 0.165
Comparison
Career
0.035
0.406
0.440
15.290
0.127
0.023*
Provides a wider
career base
Allows flexibility
to specialize in my
career
Fits in with other
courses
0.315
0.311
0.335
Interest
Interest
Interest
0.340
0.333
0.367
4.985
5.212
5.675
0.001***
0.001***
0.001***
Table 11: Statistical Significance of Coefficients (Endogenous is equivalent to dependent
variables
Exogenous is equivalent to independent
variables)
With regards to PLS, R² values of dependent (endogenous) variables defines how best
these variables fit the model. “Understanding of the R² values is comparable to the ordinary least
*p < .05 **p < .01 ***p < .001
Page 18
Research in Higher Education Journal Volume 29, September, 2015
Factors that influence, Page18
Figure 4: The structural model for the study based on TAM – for H2
squares method regression.” (Chin, 1998). The results for the data analysis, together with the
values for R² are displayed in Figure 4, 5 and 6.
Illustrated by the model, R² values indicates the amount of variance for the construct. The R² for
“choosing,” the dependent (endogenous) variable described is 0.315 for H2, 0.311 for H3 and
0.335 for H4.
The degree of events of the hypotheses is examined by the standardized path coefficient.
Chin (1998) to be considered significant suggests that they should be greater than 0.3.
0.340
0.315
0.013 0.212
0.412 Evaluation
Comparison
Interest
Confidence
Choosing
Career
0.046
0.405
0.550
Page 19
Research in Higher Education Journal Volume 29, September, 2015
Factors that influence, Page19
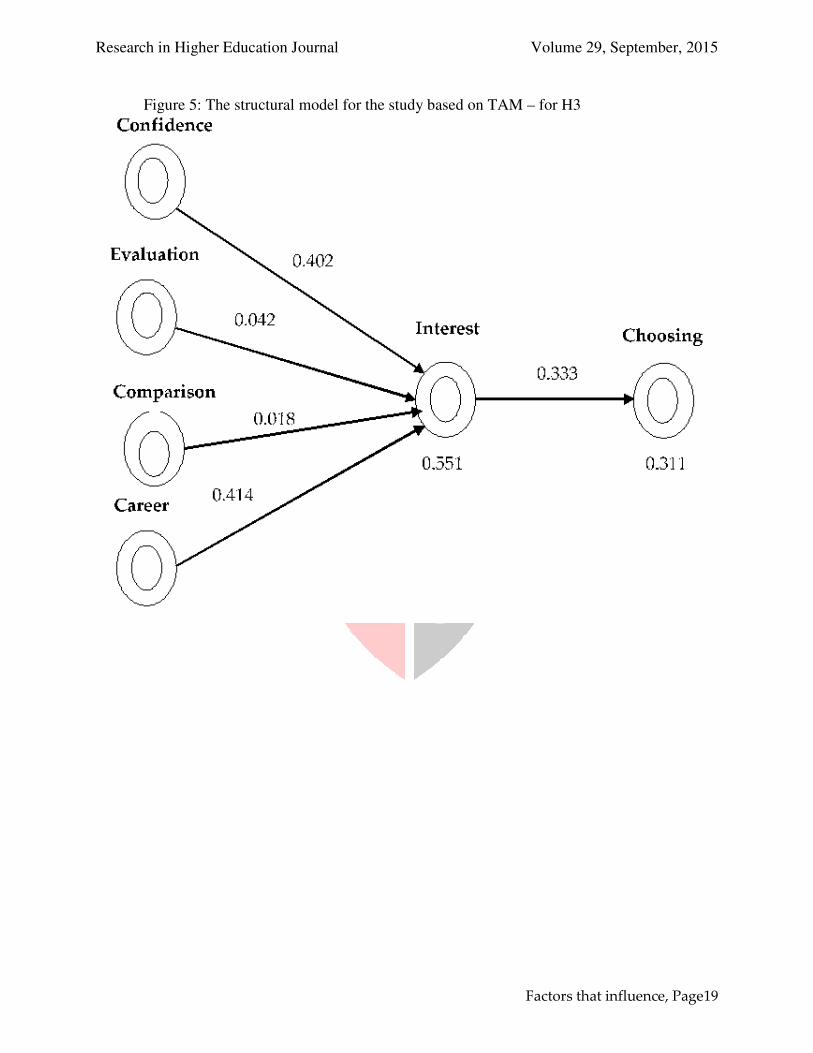
Figure 5: The structural model for the study based on TAM – for H3
Page 20
Research in Higher Education Journal Volume 29, September, 2015
Factors that influence, Page20
Figure 6: The structural model for the study based on TAM – for H4
DATA ANALYSIS
For this research the data analysis concentrated on the validity and reliability of the data,
as well as the goodness of fit and the structural model path coefficients. On three measures the
constructs displayed strong internal reliability: Average Variance Extracted (AVE), Composite
Reliability and Cronbach’s Alpha. The constructs also showed strong divergent and convergent
validity. The cross loadings results shows strong divergence, whereas the high indicator
construct loadings displayed strong convergent validity. Also displayed is the √AVE whose
construct value was greater than other constructs variables.
The research model has several mediators and multiple complex relationships and
required a suitable testing technique, structural equation modeling (SEM) was chosen. Partial
Least Squares (PLS) was chosen to fill the gaps left by the some SEM techniques, as it handles
both formative and reflective indicators. In addition, PLS is prediction oriented and does not
assume multivariate normality unlike LISREL, a SEM. PLS Graph Version 3, Build 1130
(Courtesy of Dr. Chin, University of Houston) was the software tool used to conduct the
analysis.
H1a: Highly confident students are more likely to have a favorable interest towards choosing
marketing course
0.367
0.335
0.083
0.212
0.414 Evaluation
Comparison
Interest
Confidence
Choosing
Career
0.052
0.399
0.549
Page 21
Research in Higher Education Journal Volume 29, September, 2015
Factors that influence, Page21
Displayed in Table 11, which is statistically significant at the 0.05 level, the path
coefficient from Confidence to Interest is 0.409 (p-value < 0.021). This suggests that confidence
in the marketing course does have an effect on interest in the course and that the hypothesis is
supported. As a result, hypothesis H1a is supported.
H1b. Student’s evaluation of a marketing course is more likely to have a favorable interest
towards choosing a marketing course
Displayed in Table 11, which is not statistically significant at the 0.05 level the path
coefficient from Evaluation to Interest is 0.045 (p-value < 0.165). This suggests that evaluating
the marketing course does not have an effect on interest in the course and that the hypothesis is
not supported. As a result, hypothesis H1b is not supported.
H1c: Student’s comparison of a marketing course is more likely to have a favorable interest
towards choosing a marketing course
Displayed in Table 11, which is not statistically significant at the 0.05 level, the path
coefficient from Comparison to Interest is 0.035 (p-value < 0.127). This suggests that comparing
the marketing course to other business courses does not have an effect on interest in the course
and that the hypothesis is not supported. As a result, hypothesis H1c is not supported.
H1d: Students perception that the marketing course will have a future impact on their career is
more likely to have a favorable interest towards choosing marketing course
Displayed in Table 11, which is statistically significant at the 0.05 level, the path
coefficient from Career to Interest is 0.406 (p-value < 0.023). This suggests that future career
impact does have any effect on interest in the marketing course and that the hypothesis is
supported. As a result, hypothesis H1d is supported.
H2. Highly interested students are more likely to favor a marketing course if it provides a wider
career base
Displayed in Table 11, which is statistically significant at the 0.001 level, the path
coefficient from Interest to Choosing (based on career base) is 0.340 (p-value < 0.001). This
suggests that highly interested students will be affected when choosing the marketing course if it
provides a wider career base for them, which does impact their choosing the marketing course
and that the hypothesis is supported. As a result, hypothesis H2 is supported.
H3. Highly interested students are more likely to favor a marketing course if it allows flexibility
to specialize in their career
Displayed in Table 11, which is statistically significant at the 0.001 level, the path
coefficient from Interest to Choosing (based on career flexibility) is 0.333 (p-value < 0.001).
This suggests that highly interested students will be affected when choosing the marketing
course if it provides the opportunity for flexibility in their career, which does impact their
choosing the marketing course and that the hypothesis is supported. As a result, hypothesis H3 is
supported.
Page 22
Research in Higher Education Journal Volume 29, September, 2015
Factors that influence, Page22
H4. Highly interested students are more likely to favor a marketing course if it fits in with other
courses
Displayed in Table 11, which is statistically significant at the 0.001 level, the path
coefficient from Interest to Choosing (fits in with other courses) is 0.367 (p-value < 0.001). This
suggests that highly interested students will be affected when choosing the marketing course if it
fits in with other courses, which does impact their choosing the marketing course and that the
hypothesis is supported. As a result, hypothesis H3 is supported.
Hypotheses Supported
H1a Highly confident students are more likely to have a favorable
interest towards choosing a marketing course
Yes
H1b Students evaluating a marketing course are more likely to have a
favorable interest towards choosing a marketing course
No
H1c Students comparison to other business courses are more likely to
have a favorable interest towards choosing a marketing course
No
H1d Students perception of a marketing course impact on their future
career are more likely to have a favorable interest towards
choosing a marketing course
Yes
H2
Highly interested students are more likely to be more favorable
towards choosing a marketing course if it provides a wider career
base for them
Yes
H3 Highly interested students are more likely to be more favorable
towards choosing a marketing course if it allows flexibility to
specialize in their career
Yes
H4
Highly interested students are more likely to be more favorable
towards choosing a marketing course if it fits in with other
courses
Yes
Table 12: Summaries of Hypotheses Results
RESULTS: STRUCTURAL MODEL
“The PLS construct level statistics (AVE and CFR, previously explained) indicate a fit
for the manifest variables to the latent variables; however, they do not give an indication of
overall model fit or how the latent variables co-vary with one another. Since PLS is designed to
maximize prediction, the emphasis is put on explanatory power to maximize variance in the
dependent variables based on the independent variables in the model. Consequently, the degree
to which PLS models accomplish this objective is evaluated based on prediction oriented
measures (R 2 ; instead of covariance fit as is attempted in SEM)” (Chin, 1998)
“The structural path coefficients show the results for the hypothesized model: variance explained
for each dependent construct is shown, along with an indication of the significance of the
hypotheses.” (Chin, 1998)
Consistent with H1a, interest in the course (intent) was significantly related to the confidence
(attitude) that students had in taking the course (ß1=0.409, p >0.05). Also, interest in the course
Page 23
Research in Higher Education Journal Volume 29, September, 2015
Factors that influence, Page23
was significantly related as students perceived that it impacted their career (attitude) (ß4=0.406,
p <0.005), supporting H1d. However, when interest (intent) was measured with the student’s
attitude of evaluating and comparing the marketing course it was not significant, (ß2=0.045;
ß3=0.035; respectively), not supporting H1b and H1c.
Consistent with H1, choosing the marketing course because it provides a wider career
base (behavior) was significantly related to the interest in the course (intent), confidence and
career impact (attitude) that students had in taking the course (ß5=0.340, p >0.001), supporting
H2. Also, students choosing the course that allows flexibility to specialize in their career
(behavior) was significantly related to interest (intent) in the course and confidence and career
impact (attitude), (ß6=0.333, p <0.001), supporting H3. And, students choosing the course that
fits in with other courses (behavior) was significantly related to interest (intent) in the course,
confidence and career impact (attitude), (ß7=0.367, p <0.001), supporting H4. Students’
perception positively impacted their choosing the marketing course, which affected each of the
hypotheses measuring behavior. The ‘intended’ hypotheses each of them was important in
highlighting that the latent variables did influence choosing the marketing course.
CONCLUSION DISCUSSION AND IMPLICATIONS
This study investigated from a students’ perspective the concept or theory of two
attributes: the observable and the abstract. The objective of this study was to measure the
university students perception of the marketing program. The measurement model consisted of
six constructs: Interest, Confidence, Evaluation, Comparison, Choice (Observable) and Career
(Abstract). As indicated by the results there is a relationship amongst the constructs in how the
marketing course is chosen and some factors are more influential than others among the terms in
choosing the course.
For a successful marketing strategy, in assessing the factors it is crucial to test and to
ascertain the limits for any variable; theoretically and managerially. A primary objective of this
research was given certain variables, to outline a conceptual framework and to distinguish how
students observe and process their information about the marketing course and how this impacts
them in choosing a specific course. This research attempts to analyze students' choices leaning
towards a specific objective and behavior for a specific product - marketing course. This then can
be extended to the bigger picture - Marketing Program. Understanding the relationship between
the observable and abstract attributes and students’ choices is crucial in order to capitalize on the
effectiveness of that specific environment – Marketing Program.
“We draw on the theory of planned behavior as a theoretical foundation in building our
model of choosing of a specific product. Fishbein and Ajzen's (1975) framework is adopted by
arguing that, in the context of purchase, intention is not a significant mediator. In other words,
purchases are unplanned, unexpected, and spontaneous; hence, the determinants of behavior
influence buying directly rather than indirectly through intentions.” (Fishbein & Ajzen's, 1975)
This model empirically analyzes students’ from the perspective or with the aim of choosing. The
determinants of students' choices include characteristics (such as: interest, confidence,
evaluation, comparison and career usefulness) in the overall assessment of the Marketing
program.
The overall picture that emerges can be described as such: first, student individualities
with regards to the attributes do employ a significant influence on choices. This result reveals
that the drivers of these characteristics do impact directly such behavior.
Page 24
Research in Higher Education Journal Volume 29, September, 2015
Factors that influence, Page24
Students' interest in the areas evaluated inspires overall their general assessment and
intention to choose the marketing course. Clearly, their interest and impact on their careers are
the driving forces for their intentions. Their interest in the course is beneficial in framing their
intention in the future and their inclination to choose the course influences their evaluation. As
students need to choose the course to collect, compare and evaluate details about the course.
For universities that have a marketing program this research provides several suggestions.
To choose the course, students must be in attendance; hence, in order to inform them of the
objectives of the course awareness is critical. Interest in the course must also be generated based
on attributes that are measurable, that are important to their learning and to their future career
development. As well, they must be able to evaluate and compare the course and to formulate
future behaviors or intentions. These circumstances leads to an evaluation of the course that is
favorable, which then leads to students choosing the course.
An effective promotional campaign should be designed for students emphasizing the
strongest observable and abstract attributes found in this study. Regardless of their major field of
study the majority of students indicated that it is helpful to their study and knowledge to take a
marketing course as evident by the attributes. Whereas marketing students believe the course to
be beneficial in their career. The findings of studies, such as this, can facilitate educators and
program planners of vocational education in promoting and perhaps modifying programs
successfully in attracting and retaining interested students.
Although university students’ career routes are not completely outlined, they may still be
inclined to change their focus and future career direction. All students, those enrolled and those
not enrolled in marketing, make up the target group for the marketing education program. They
need to be informed of and influenced by the program or course benefits. It would be beneficial
to the university, if the benefits of the course are outlined, either course-related or career-related,
even only if it related to one student group: the marketing students. These students can also have
an effect on members of their peer groups to enroll in the program. Marketing students have
already been influenced positively and are participating in the program; however, universities
must continue to develop effective promotional strategies and program designs to keep their
interest. A positive influence on students to enroll in the marketing program will effect a positive
influence with regards to their peer group, parents, counselors, teachers, and others.
Furthermore, research can be carried out to measure students' attitudes and perceptions of
other university programs (e.g., Management program, Accounting program, Finance program),
and determine how those relate to students' perceptions of educational programs. As well, future
research can measure non-business students and their influencers in choosing a marketing
course.
Page 25
Research in Higher Education Journal Volume 29, September, 2015
Factors that influence, Page25
REFERENCES
Ackerman, D. S., Gross, B. L., & Perner, L. (2003). Instructor, student, and employer
perceptions on preparing marketing students for changing business landscapes, Journal of
Marketing Education25: 46-56.
Ajzen, I. & Fishbein, M. (1980). Understanding Attitudes and Predicting Social Behavior
(PrenticeHall, Englewood Cliffs, New Jersey)
Aggarwal, P., Vaidyanathan, R., & Rochford, L. (2007). The Wretched Refuse of a Teeming
Shore? A Critical Examination of the Quality of Undergraduate Marketing Students, Journal
of Marketing Education 29.3: 223-233.
Binney, W., Kennedy, W., & Hall, J. (2004). Self-determination theory and needs satisfaction in
marketing education : are we meeting the needs of students in large marketing classes?,
conference paper: ANZMAC 2004 : marketing accountabilities and responsibilities : proceedings
: 29 November - 1 December 2004, Wellington, 2004
Camey, John P., &Williams, J. K., (2002). Selling Principles: Influencing Principles of
Marketing Students' Perceptions of and Attitudes toward Marketing as a Discipline, Journal
of Marketing Education, 26.2 (Aug 2004): 154-160
Centre for Educational Development and Support (2004). Using the Student Evaluation
of Teaching (SET) and Student Evaluation of Subjects (SES) Questionnaires, Centre for
Educational Development and Support, Victoria University, Melbourne.
Cheng, Y. C., & Tam, M. M. (1997). Multi-models of quality in education, Quality Assurance in
Education, 5. 22-31
Claiborne, C. B., & Sirgy, M. J. (1990). Self-image congruence as a model of consumer
attitude formation and behavior: A conceptual review and guide for future research. In Dunlap,
B. J., & Cullowhee, A. (Eds.), Developments in Marketing Science: v. 1(pp. 3-7). North
Carolina: Academy of Science.
Cronbach Lee J., & Meehl Paul E. (1955). Construct Validity in Psychological Tests,
Psychological Bulletin, 52, 281-302
Cuseo, J. (2007). The empirical case against large class size: Adverse effects on the teaching,
learning and retention of first year students, Journal of Faculty Development, v21 n1
p5-21 Jan 2007
Elliot, K. M., & Shin, D. (2002). Student satisfaction, Journal of Higher Education Policy
and Management, 24 (2), 197-247.
Fishbein, M., & Ajzen, I. (1975). Belief, attitude, intention and behavior. Reading,
Massachusetts: Addison-Wesley Publishing Company.
Fornell, C., & Larcker, D.F., 1981. Evaluating structural equation models with unobservable
variables and measurement error. Journal of Marketing Research 18 (1), 39-50.
Gremeler, D., & McCollough, M. (2002). Student Satisfaction Guarantees: An Empirical
Examination of Attitudes, Antecedents, and Consequences, Journal of Marketing Education,
24 (2), 150-60.
Hatzios, M. K. (1996). Effective Models for Measuring Students’ Attitude toward the Marketing
Education Program, Journal of Vocational Education Research, 13, No 1.
Hosein, N. Z. (2014). Measuring Chinese students’ attitudes toward the marketing program,
Journal of Management and Marketing Research, August 2014, Vol. 16, ISSN Online: 1941-
3408, Print: 2327-5340
Page 26
Research in Higher Education Journal Volume 29, September, 2015
Factors that influence, Page26
Hugstad, P. (1997). Marketing the marketing major. Journal of Marketing Education 19(1): 4-13
Keil, J., & Partell, P. (1997). The effect of class size on student performance and retention at
Binghampton University, Office of Budget & Institutional Research, Binghampton
University, Binghampton, New York.
Kimberly, T. (2003), Marketing yourself in the competitive job market: An innovative course
preparing undergraduates for marketing careers, Journal of Marketing Education25.2:
97-107
King, M., Morison, I., Reed, G., & Stachow, G. (1999). "Student feedback systems in
the Business School: a departmental model", Quality Assurance in Education, Vol. 7 Iss:
2, pp.90 - 100
LaBarbera, P. A., & Simonoff, J. S. (1999). Toward enhancing the quality and quantity of
marketing majors. Journal of Marketing Education 21 (1):4-14.
Lutz, R. J. (1981). A functional theory framework for designing and pretesting advertising
themes. In R. J. Lutz (ed.), Contemporary Perspectives in Consumer Research.
Boston: Kent Publishing Company.
McCorkle, D., Payan, J., Reardon, J., & Kling, N. (2007). Perceptions and Reality: Creativity in
the Marketing Classroom, Journal of Marketing Education 29.3: 254-261.
Reed, W. E., & Smith, C. L. (1985). The image of marketing education in Missouri. Marketing
Educator's Journal, 11(1), 14-23
Sprague, Elaine W, & Dahl, Darren W (2010). Learning to Click: An Evaluation of the Personal
Response System Clicker Technology in Introductory Marketing Courses, Journal of Marketing
Education 32.1: 93.