47
© Rachele Rossi Facts and figures on organic agriculture in the European Union
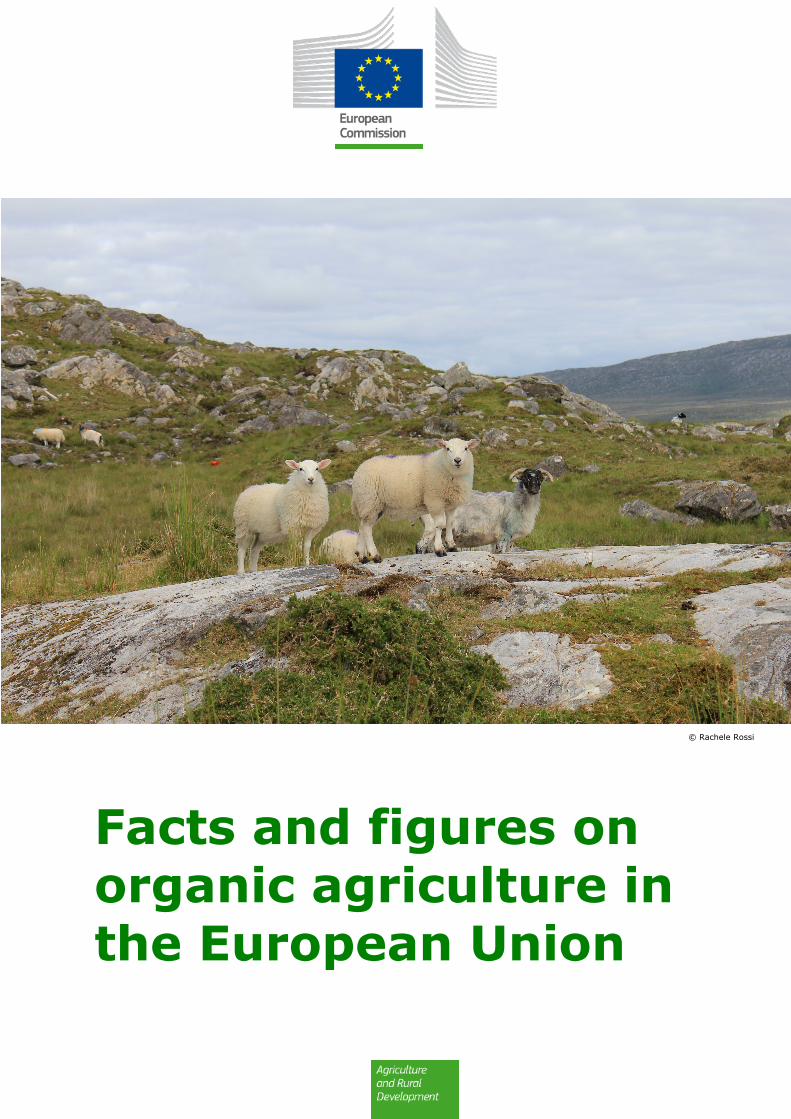
© Rachele Rossi
Facts and figures on organic agriculture in the European Union
Facts and figures on organic agriculture in the European Union
December 2016 1
Contents
1. MAIN TRENDS IN EU ORGANIC AGRICULTURE ............................................. 8
1.1. Major evolution of organic area in the EU ............................................ 8
1.2. Holdings involved in the organic sector ............................................. 15
1.2.1. Evolution of the number of organic holdings ........................... 15
1.2.2. Elements on organic farm structures: holding area, labour, age and vocational training of farmers, gender issues ................... 21
2. ANALYSIS OF ORGANIC PRODUCTION – MAIN CROP AND ANIMAL SECTORS .. 25
2.1. The arable crop and orchard production ............................................ 25
2.1.1. Analysis by main categories ................................................. 25
2.1.2. Permanent pastures ........................................................... 28
2.1.3. Major arable crops: cereals, oilseeds and protein crops ............ 29
2.1.4. Vegetables ........................................................................ 31
2.1.5. Permanent crops ................................................................ 31
2.2. The animal sector .......................................................................... 35
2.2.1. Cattle ............................................................................... 36
2.2.2. Dairy cows ........................................................................ 36
2.2.3. Pigs ................................................................................. 37
2.2.4. Sheep .............................................................................. 38
2.2.5. Goats ............................................................................... 38
2.2.6. Poultry ............................................................................. 39
3. CONCLUSIONS ...................................................................................... 40
4. STATISTICAL SOURCES AND REFERENCES ................................................ 41
APPENDIX – Rural development and organic farming
Methodological note
In the different graphs and tables of this report, you will find that organic statistics in the Eurostat database (http://ec.europa.eu/eurostat/data/database) can be found in different tables according to the period taken into consideration. Eurostat data on organic statistics are available in the following tables:
· Organic operators by status of the registration process: Table org_coptyp_h ( former food_act2) for data until 2011 and table org_coptyp for data from 2012 onwards.
· Organic crop area by agricultural production methods and crops: Table org_cropar_h1 (former food_in_porg1) for data until 2011 and table org_cropar for data from 2012 onwards.
· Organic livestock of animals: Table org_lstspec_h (former food_in_porg3) for data until 2011 and table org_lstspec for data from 2012 onwards
· Data on organic area: Table ef_mporganic still remain the same.

Facts and figures on organic agriculture in the European Union
December 2016 2
List of graphs, tables and maps
Graphs
Graph 1. Area under organic cultivation in the EU ........................................ 8
Graph 2. Organic area (certified organic + in conversion) in the Member States in 2013, 2014 and 2015 .............................................................. 9
Graph 3. Evolution of the share of the organic area in the UAA in the EU ....... 10
Graph 4. Share (%) of the fully converted organic area in the UAA in the EU Member States, 2015 ............................................................... 10
Graph 5. Fully converted organic crop area in hectares in the EU Member States, 2015 ........................................................................... 11
Graph 6. Organic farming in-conversion area in the EU ............................... 12
Graph 7. Fully converted and in-conversion organic area in the EU ............... 12
Graph 8. Share of the in-conversion area in total organic area ..................... 13
Graph 9. Evolution of the area and number of holdings involved in the organic sector in the EU-28 according to FSS .......................................... 15
Graph 10. Evolution of the number of organic holdings in the EU ................... 15
Graph 11. Number of organic holdings in 2005, 2007, 2010 and 2013 in the EU Member States ........................................................................ 16
Graph 12. Comparison between total number of holdings and organic holdings in the EU-28 ............................................................................... 17
Graph 13. Evolution of the certified area, operators and producers involved in the organic sector in the EU according to the annual collection of organic farming statistics ..................................................................... 18
Graph 14. New, withdrawn and total number of registered organic producers in the EU 18
Graph 15. Average surface of organic and conventional holdings (ha/holding), 2013 ...................................................................................... 21
Graph 16. Share of holdings in different size classes (organic and all), 2013 ... 22
Graph 17. Comparison of age distribution of farm managers in the organic and non-organic sector in the EU-28 in 2013 ...................................... 23
Graph 18. Crop production by crop in organic farming in the EU Member States, 2013 ...................................................................................... 27
Graph 19. Share of the organic area in total EU area by crop sectors, 2013 ..... 28
Facts and figures on organic agriculture in the European Union
December 2016 3
Graph 20. Area under permanent pastures ................................................. 28
Graph 21. Organic cereal area in the EU Member States ............................... 29
Graph 22. Organic oilseed area in the EU Member States, 2015 ..................... 30
Graph 23. Organic dried pulse area in the EU Member States ........................ 30
Graph 24. Organic vegetable area in the EU Member States .......................... 31
Graph 25. Major organic permanent crops (ha and % of EU total) in 2015 ...... 32
Graph 26. Citrus organic area in Greece, Italy and Spain .............................. 32
Graph 27. Organic grapes area in selected EU Member States ....................... 33
Graph 28. Organic olive area in Greece, Italy, Spain and Portugal .................. 34
Graph 29. Number of certified cattle in 2013 and 2015 in the EU Member States 36
Graph 30. Number of certified dairy cows in the EU in 2013 and 2015 in the EU Member States ........................................................................ 37
Graph 31. Number of certified organic pigs in 2013 and 2015 in the EU Member States .................................................................................... 37
Graph 32. Number of certified organic sheep in 2013 and 2015 in the EU Member States .................................................................................... 38
Graph 33. Number of certified organic goats in 2013 and 2015 in the EU Member States .................................................................................... 39
Graph 34. Number of certified organic poultry and laying hens in 2015 ........... 39
Graph 35. Rural development measures 2007-2013 ..................................... 42
Graph 36. EAFRD measures with the 10 highest financial allocations in the EU for the 2007-13 period in EUR billion and in % .................................. 43
Graph 37. EAFRD payments within measure 214 (from 2007 to 2013) per Member State .......................................................................... 44
Tables
Table 1. Number of all registered, new and withdrawn organic producers in all EU Member States (annual average 2007-2015) ........................................... 19
Table 2. Labour force intensity, 2013 .................................................................. 23
Table 3. Main categories of certified organic land use in the EU-28, 2015 ................. 25
Table 4. Main categories of agrigultural land use in the EU-28, 2013 ....................... 25

Facts and figures on organic agriculture in the European Union
December 2016 4
Table 5. Breakdown and share of certified organic area per type of crop type in the EU Member States, 2015 ........................................................................... 26
Table 6. Animals under organic production in the different EU country groups, 2015 . 35
Table 7. Evolution of animals (heads) under organic production in the EU-28, 2015 .. 35
Maps
Map 1. Share of the organic area in the total UAA in 2013 at regional level ............ 14
List of acronyms and abbreviations
AWU annual working unit
CAP Common Agricultural Policy
EAFRD European Agricultural Fund for Rural Development
EU European Union
EU-15 country group which includes EU Member States in 2003: Belgium (BE), Denmark (DK), Germany (DE), Ireland (IE), Greece (EL), Spain (ES), France (FR), Italy (IT), Luxembourg (LU), the Netherlands (NL), Austria (AT), Portugal (PT), Finland (FI), Sweden (SE) and the United Kingdom (UK)
EU-N13 country group which includes the Members States that joined the EU in 2004: the Czech Republic (CZ), Estonia (EE), Cyprus (CY), Latvia (LV), Lithuania (LT), Hungary (HU), Malta (MT), Poland (PL), Slovenia (SI) and Slovakia (SK), and in 2007: Bulgaria (BG) and Romania (RO), and in 2013: Croatia (HR)
EU-28 country group which includes EU-15 plus EU-N13 countries, i.e. the European Union between 2007 and 2013
FADN Farm Accountancy Data Network
FIBL Research Institute of Organic Agriculture
FSS Farm Structure Survey
Ha hectare
LSU livestock unit
UAA utilised agricultural area
Acknowledgements
This report has been prepared by DG Agriculture and Rural Development with the support of Eurostat, as well as FIBL Research Institute of Organic Agriculture, Agrarmarkt Informations-Gesellschaft mbH for data on Germany and the Ministerium für ein Lebenswertes Österreich for data on Austria.
This document does not necessarily represent the official views of the European Commission
Contact: DG Agriculture and Rural Development, Unit Economic Analysis of EU Agriculture Tel: +32-2-29 91111 / E-mail: [email protected]
http://ec.europa.eu/agriculture/rica/publications_en.cfm
© European Union, 2016 — Reproduction authorised provided the source is acknowledged

Facts and figures on organic agriculture in the European Union
December 2016 5
Executive summary
Organic has become a way of living. Some people see these products as being tastier or healthier than those coming from conventional agriculture while others appreciate them because of the good practices towards the environment or the labour force employed on organic farms. We have also seen new organic shops open or old ones remaining in business even through the economic crisis, which would hint at an increasing demand for these products. Moving away from just assuming what the situation is, what do figures say? What is the organic production in the European Union (EU) and who are the people producing it?
The organic sector in the EU has been rapidly developing during the past years. According to Eurostat data, the EU-28 had in 2015 a total area of 11.1 million hectares cultivated as organic, up from 5.0 million in 2002. During the last decade, organic area in the EU increased by about 500 000 hectares per year. This is a big increase, but the whole organic area represents only 6.2% of total utilised agricultural area in Europe. The organic area is cultivated by almost 185 000 farms across Europe. Most of the organic land (78%) and of organic farms (81%) are situated in the EU Member States having joined the EU before 2004 (the so called EU-15), in which national and European legislation, among others, helped stimulate the development of this sector. The European countries having joined the EU since 2004 (called in the report the EU-N13) are not lagging behind and are quickly expanding the organic sector as well. They registered a 12% yearly growth rate in their organic area for from 2002 to 2015 and saw their number of holdings increase almost tenfold between 2003 and 2015.
But are organic holdings showing particular trends in comparison with conventional ones or are their managers different? Organic holdings tend to be bigger than conventional farms in the European Union. Organic farm managers tend to be generally younger than the average conventional farmers in Europe.
Around 306 500 organic operators (producers, processors and importers) were registered in the EU-28 in 2015. A good part of these operators (271 550) were represented by agricultural producers, who may also process and/or import organic products, and which were mostly active in the EU-15. Though about 11 600 producers were counted in the EU-N13 in 2002 their number grew to more than 65 650 in 2015, also as a result of additional financing provided by the European Union for this type of production following their accession.
Organic farms are active both in the arable crop and orchard as well as animal sectors. Figures show that at EU level both types of production are registering a positive trend for the studied years. But what sort of crop or animal products come out of organic production?
Data shows that permanent pasture represents the biggest share of the organic area (58%), followed by cereals (20%) and permanent crops (15%). Sheep (42%) and cattle (34%) are the most important types of organic animal production at European level, after poultry. However, other types of animal production should be mentioned in the EU-28, such as pigs, which registered 9%, and goats, which were at 7% of organic livestock in European Union in 2015.
The report gives an overview of the situation of organic agriculture in Europe, for given years, according to data availability. Since detailed data is not available for all countries and varies within the Eurostat databases, other sources and own estimations were also used in this report.
Facts and figures on organic agriculture in the European Union
December 2016 6
Introduction
This report aims at gathering key facts and figures about organic agriculture in the European Union and at identifying the main trends over the last years.
The report relies on different types of statistical and market data as well as data derived from the implementation of agricultural policy measures. Statistical data originate mainly from Eurostat (annual data collection on the organic sector and data from the Farm Structure Survey1), but other sources are utilised as well2.
Eurostat data on the organic sector are only available from 1998 following the inclusion of the organic sector in EU policies which dates back to 1991 with Council Regulation (EEC) No 2092/913. Council Regulation (EC) No 834/20074, which replaced the latter, foresees the provision by Member States of statistical information necessary for its implementation and monitoring. Nowadays, a Proposal for a Regulation of the European Parliament and of the Council on organic production and labelling of organic products, repealing Council Regulation (EC) No 834/2007 is being discussed in the Council and the Parliament for its adoption in the future5.
The European Action Plan for Organic Food and Farming6 acknowledged the necessity to improve the collection of data on the sector (Action 8). As the weight of the sector keeps increasing, the existence of appropriate data at all levels of the organic food supply chain becomes even more important. The current review and impact assessment of the organic farming policy reiterates the same need for reliable data on organic farming at all levels of the food chain.
The information consolidated at EU level from data provided by Member States on this topic remains still incomplete and of heterogeneous quality. Areas under organic production, livestock numbers, operator numbers (producers, processors and importers) are of reasonably good quality even if they are not exempt from gaps, errors and inconsistencies. Other data, such as crop and livestock production volumes, are mostly missing. Data on international trade, industrial production and prices at various stages of the supply chain are missing at EU level.
Therefore, several sources have been used to complement Eurostat data in order to give a more complete picture of the EU organic sector in recent years. These sources are indicated in the text and in the references section of the report. Some of the data are estimates (missing data being replaced with data available for the most recent year) and should be treated as such. Estimates have been used to create EU aggregates, when data for some Member States was not available, and this may lead to some differences with other sources which could use other methodologies or estimates.
1 The Farm Structure Survey (FSS) is a Eurostat harmonized data collection which contains information (statistical tables) on the structure of agricultural holdings collected through agricultural structure surveys and censuses. Censuses are carried out every 10 years, last being in 2010. Every 2 or 3 years, between the censuses, sample surveys are carried out, with the latest one in 2013. FSS surveys do not cover all holdings (very small farms are not covered) and are not specific for organic farming information. 2 See section on statistical sources and references. 3 Council Regulation (EEC) No 2092/91 of 24 June 1991 on organic production of agricultural products and indications referring thereto on agricultural products and foodstuffs (OJ L198 of 22 July 1991, p. 1). 4 Council Regulation (EC) No 834/2007 of 28 June 2007 on organic production and labelling of organic products (OJ L189 of 20 July 2007, p. 1). 5 Latest Agriculture and Fisheries Council on 12-13 December 2016. 6 COM(2014)179 final
Facts and figures on organic agriculture in the European Union
December 2016 7
This report contains data up to year 2015, whenever possible, and therefore refers to the EU-28.

Facts and figures on organic agriculture in the European Union
December 2016 8
1. MAIN TRENDS IN EU ORGANIC AGRICULTURE
1.1. Major evolution of organic area in the EU
The area under organic agriculture has increased significantly in the last years. Graph 1 shows the evolution of the area under organic cultivation in the period 2002-2015. In fourteen years, the total (fully converted and in-conversion organic area) have increased from 5.0 million ha to an estimated 11.1 million ha (+6% per year) for the EU-28. The speed of growth has been most spectacular for the EU-N13, in which organic area has jumped from 0.55 to 2.4 million ha (+12% per year), whereas in the same period the surface increased from 4.4 to almost 8.6 million ha in the EU-15, at an average yearly growth rate of 5% per year. Despite the strong growth of the sector in the EU-N13, the majority of organic area in Europe currently exists in the EU-15. The EU-15 represented 78% of all EU-28 organic area in 2015.
Graph 1. Area under organic cultivation in the EU
Source: Data on the basis of Council Regulation (EC) No 834/2007 on organic production (FAOSTAT data until 2011, and Eurostat data org_cropar from 2012 onwards) *Data from DE from Agrarmarkt Informations-Gesellschaft mbH and data from AT from Ministerium für ein Lebenswertes Österreich.
Graph 2 shows the evolution of the organic area by Member State in 2013, 2014 and 2015. In absolute terms, the Member States with the largest areas in 2015 are Spain (almost 2 million ha), Italy (about 1.5 million ha) and Germany (1 million ha), which together account for around 40% of the EU-28 total organic area. In the EU-N13, the biggest organically farmed surfaces are in Poland (0.6 million ha) and the Czech Republic (0.4 million ha).
Over the 2007-2015 period, the area developed positively in a number of EU-15 Member States (for instance in Germany, Spain, France, Austria, Sweden) but also in the EU-N13 (among which Poland and the Czech Republic). The generally positive trend in organic area development in the EU-N13 could be at least partly explained through the support provided to the sector already prior to accession to the EU and its subsequent increase since accession.

Facts and figures on organic agriculture in the European Union
December 2016 9
Graph 2. Organic area (certified organic + in conversion) in the Member States in 2013, 2014 and 2015
Source: Eurostat data on the basis of Council Regulation (EC) No 834/2007 on organic production (online data code: org_cropar_h1 until 2011, and org_cropar from 2012 onwards) *Data from DE from Agrarmarkt Informations-Gesellschaft mbH and data from AT from Ministerium für ein Lebenswertes Österreich.
The above absolute figures tell only part of the story with the larger Member States having larger areas in the organic sector. Once we look at the share of the organic area within the total utilised agricultural area (UAA), the relative importance of the sector in each Member State appears more clearly and the ranking is quite different.
Facts and figures on organic agriculture in the European Union
December 2016 10
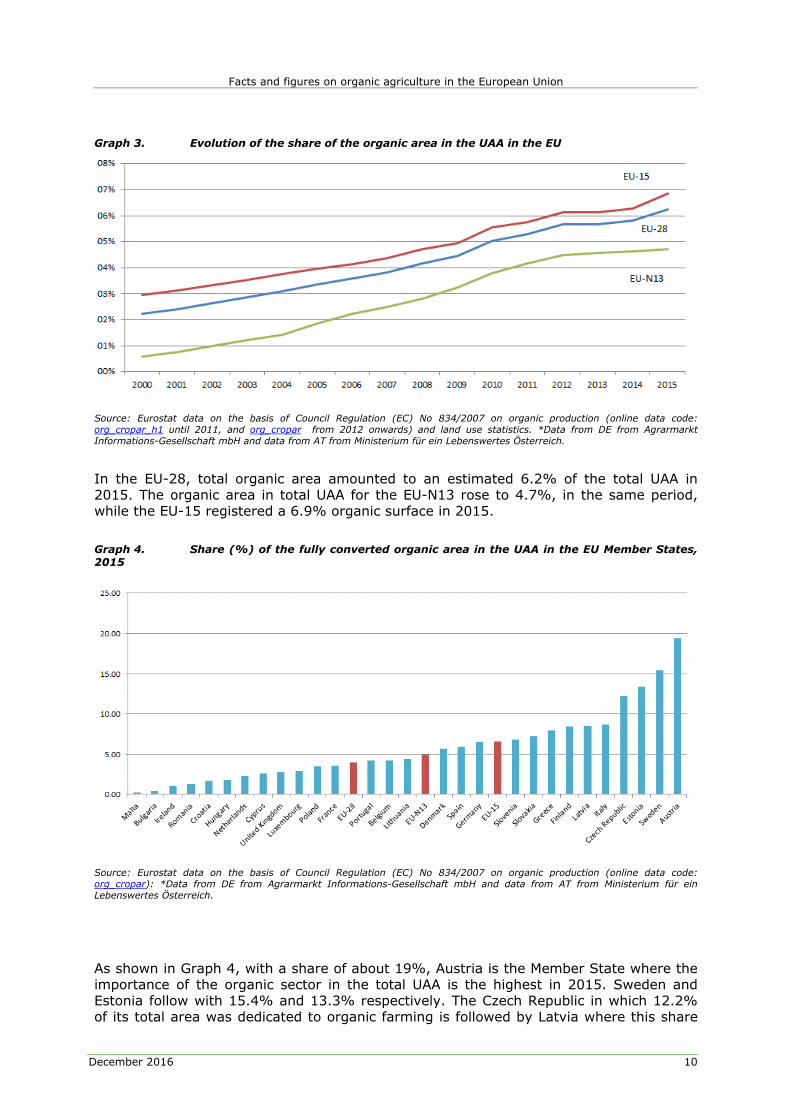
Graph 3. Evolution of the share of the organic area in the UAA in the EU
Source: Eurostat data on the basis of Council Regulation (EC) No 834/2007 on organic production (online data code: org_cropar_h1 until 2011, and org_cropar from 2012 onwards) and land use statistics. *Data from DE from Agrarmarkt Informations-Gesellschaft mbH and data from AT from Ministerium für ein Lebenswertes Österreich.
In the EU-28, total organic area amounted to an estimated 6.2% of the total UAA in 2015. The organic area in total UAA for the EU-N13 rose to 4.7%, in the same period, while the EU-15 registered a 6.9% organic surface in 2015.
Graph 4. Share (%) of the fully converted organic area in the UAA in the EU Member States, 2015
Source: Eurostat data on the basis of Council Regulation (EC) No 834/2007 on organic production (online data code: org_cropar): *Data from DE from Agrarmarkt Informations-Gesellschaft mbH and data from AT from Ministerium für ein Lebenswertes Österreich.
As shown in Graph 4, with a share of about 19%, Austria is the Member State where the importance of the organic sector in the total UAA is the highest in 2015. Sweden and Estonia follow with 15.4% and 13.3% respectively. The Czech Republic in which 12.2% of its total area was dedicated to organic farming is followed by Latvia where this share
Facts and figures on organic agriculture in the European Union
December 2016 11
amounts to 8.5%. It is interesting to note that among the EU-N13, five Member States (the Czech Republic, Estonia, Latvia, Slovenia and Slovakia) already exceed the EU-28 average of 6.2%. These Member States have experienced an extremely fast development of the organic sector in terms of area. On the other hand, six EU-15 Member States hold in 2015 shares of organic farming area in total UAA lower than the EU-28 average.
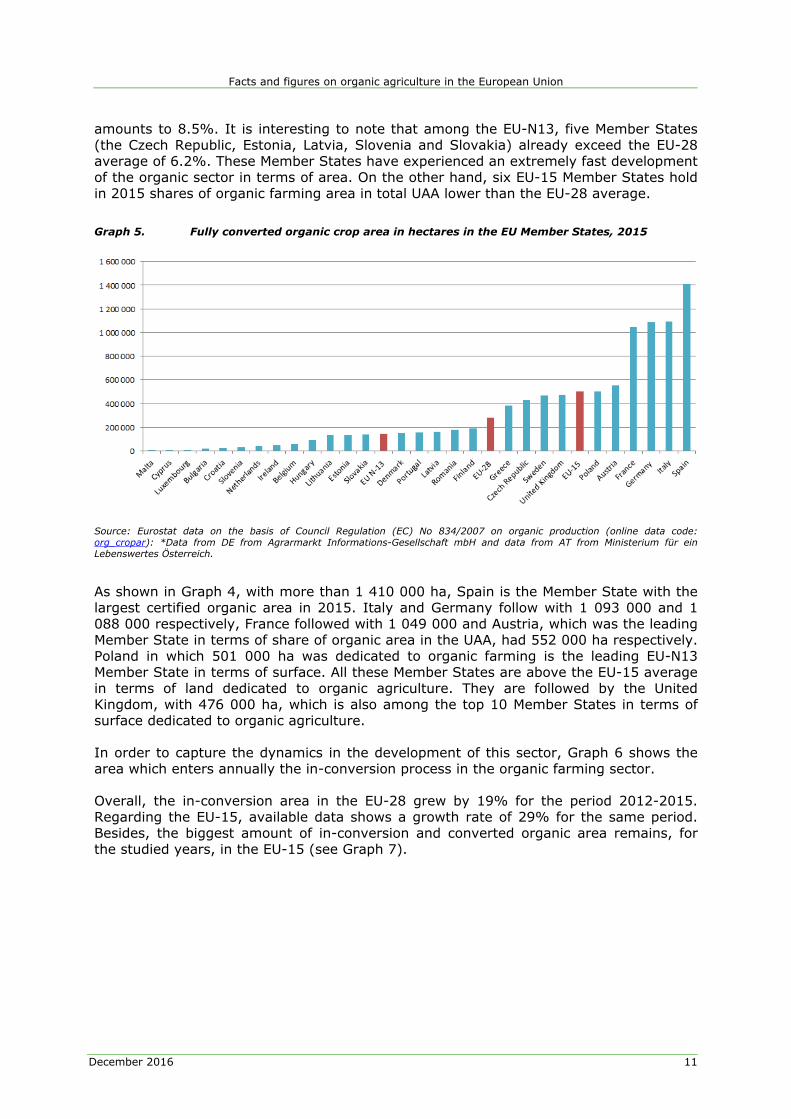
Graph 5. Fully converted organic crop area in hectares in the EU Member States, 2015
Source: Eurostat data on the basis of Council Regulation (EC) No 834/2007 on organic production (online data code: org_cropar): *Data from DE from Agrarmarkt Informations-Gesellschaft mbH and data from AT from Ministerium für ein Lebenswertes Österreich.
As shown in Graph 4, with more than 1 410 000 ha, Spain is the Member State with the largest certified organic area in 2015. Italy and Germany follow with 1 093 000 and 1 088 000 respectively, France followed with 1 049 000 and Austria, which was the leading Member State in terms of share of organic area in the UAA, had 552 000 ha respectively. Poland in which 501 000 ha was dedicated to organic farming is the leading EU-N13 Member State in terms of surface. All these Member States are above the EU-15 average in terms of land dedicated to organic agriculture. They are followed by the United Kingdom, with 476 000 ha, which is also among the top 10 Member States in terms of surface dedicated to organic agriculture.
In order to capture the dynamics in the development of this sector, Graph 6 shows the area which enters annually the in-conversion process in the organic farming sector.
Overall, the in-conversion area in the EU-28 grew by 19% for the period 2012-2015. Regarding the EU-15, available data shows a growth rate of 29% for the same period. Besides, the biggest amount of in-conversion and converted organic area remains, for the studied years, in the EU-15 (see Graph 7).

Facts and figures on organic agriculture in the European Union
December 2016 12
Graph 6. Organic farming in-conversion area in the EU
Source: Eurostat data on the basis of Council Regulation (EC) No 834/2007 on organic production (online data code: org_cropar)
Graph 7. Fully converted and in-conversion organic area in the EU
Source: Eurostat data on the basis of Council Regulation (EC) No 834/2007 on organic production (online data code: org_cropar)
The observation of the share of in-conversion area within the total area of the organic sector (in-conversion and certified organic areas) provides an indication of the growth potential of the sector for the next few years (Graph 8).

Facts and figures on organic agriculture in the European Union
December 2016 13
Graph 8. Share of the in-conversion area in total organic area
Source: Eurostat data on the basis of Council Regulation (EC) No 834/2007 on organic production (online data code: org_cropar) For AT and DE no in-conversion area available.
Map 1, based on the results of the Farm Structure Survey of 2013, provides the share of the organic area in the UAA at the regional level in the EU. It shows that there is a rather strong heterogeneity among and within most Member States regarding the weight of the organic sector. The organic area with highest values in terms of share is located in the following areas: Belgium (Luxembourg belge), the Czech Republic (except the Prague Region, Strední Cechy and Jilhovýchod), Germany (Bremen and Saarland), Estonia, Spain (Murcia), Italy (Puglia, Marche, Calabria and Sicilia), Austria, Poland (Zachodniopomorskie), Slovenia (Východné Slovensko), Finland (Åland) and Sweden (except Sydsverige and Övre Norrland).
The map also reflects the fact that organic farming is particularly present in regions with extensive livestock production systems based on permanent grassland. The importance of the organic sector is generally lower in the regions of plains where more intensive production systems prevail.

Facts and figures on organic agriculture in the European Union
December 2016 14
Map 1. Share of the organic area in the total UAA in 2013 at regional level
Source: Eurostat FSS data. Prepared by AGRI GIS team.
The development of organic area in the EU should also be seen in light of the support provided for this farming practice through rural development. Since there was no specific measure for organic farming in the current rural development programming period (2007-2013), organic farming was supported via the measure 'Agri-environment payments'. For the 2014-2020 period, the Regulation on support for rural development through the EAFRD, introduced a specific measure for organic farming.

Facts and figures on organic agriculture in the European Union
December 2016 15
1.2. Holdings involved in the organic sector
1.2.1. Evolution of the number of organic holdings
The evolution of the total certified organic farming area should be considered together with the evolution of the number of holdings active in this sector, which gives an idea about the interest of agricultural producers and other operators in this sector. Graph 10 shows the trend in the number of organic holdings for the studied years.
Graph 9. Evolution of the area and number of holdings involved in the organic sector in the EU-28 according to FSS
Source: Data on the basis of Council Regulation (EC) No 834/2007 on organic production (FEOSTAT data until 2011, and Eurostat data org_cropar from 2012 onwards) *Data from DE from Agrarmarkt Informations-Gesellschaft mbH and data from AT from Ministerium für ein Lebenswertes Österreich.And FSS data (online data code: ef_mporganic)
Graph 10. Evolution of the number of organic holdings in the EU
Source: Eurostat FSS data (online data code: ef_mporganic).
In 2013 there were almost 185 000 farms active in organic agriculture across Europe, with a majority of them (81%) being active in the EU-15. However, for the EU-15 this number represented only 3.3% of the total number of holdings in 2013. For the EU-28 only 1.7% of the holdings were active in organic farming during the same year.

Facts and figures on organic agriculture in the European Union
December 2016 16
The increase in the number of organic holdings can be observed for both the EU-15 and the EU-N13. For the EU-N13 the number of organic farms increased very rapidly from 2003 to 2005 and reached over 34 790 holdings in 2013. The organic holdings represent 0.5% of all the EU-N13 holdings. In the EU-15, the increasing trend in the number of holdings has been less dramatic than in the EU-N13, but is still overall higher than in the newest Member States of the EU.
Graph 11 gives an indication of the countries with the highest number of holdings involved in organic farming. From among the EU-15, Italy, Austria, Spain, Germany, Greece and France show the highest number of organic holdings. In the EU-N13 Poland seems to take the lead with levels similar to the old EU Member States.
Graph 11. Number of organic holdings in 2005, 2007, 2010 and 2013 in the EU Member States
Source: Eurostat FSS data (online data code: ef_mporganic).
When analysing the number of organic holdings in comparison to the total number of holdings in EU agriculture, a diverging trend can be observed. Available Eurostat data shows that the number of organic farms is increasing while there is a consolidation of conventional agricultural holdings in the EU-28. The same trend can be observed for working units in organic agriculture in comparison to non-organic labour force.
Facts and figures on organic agriculture in the European Union
December 2016 17
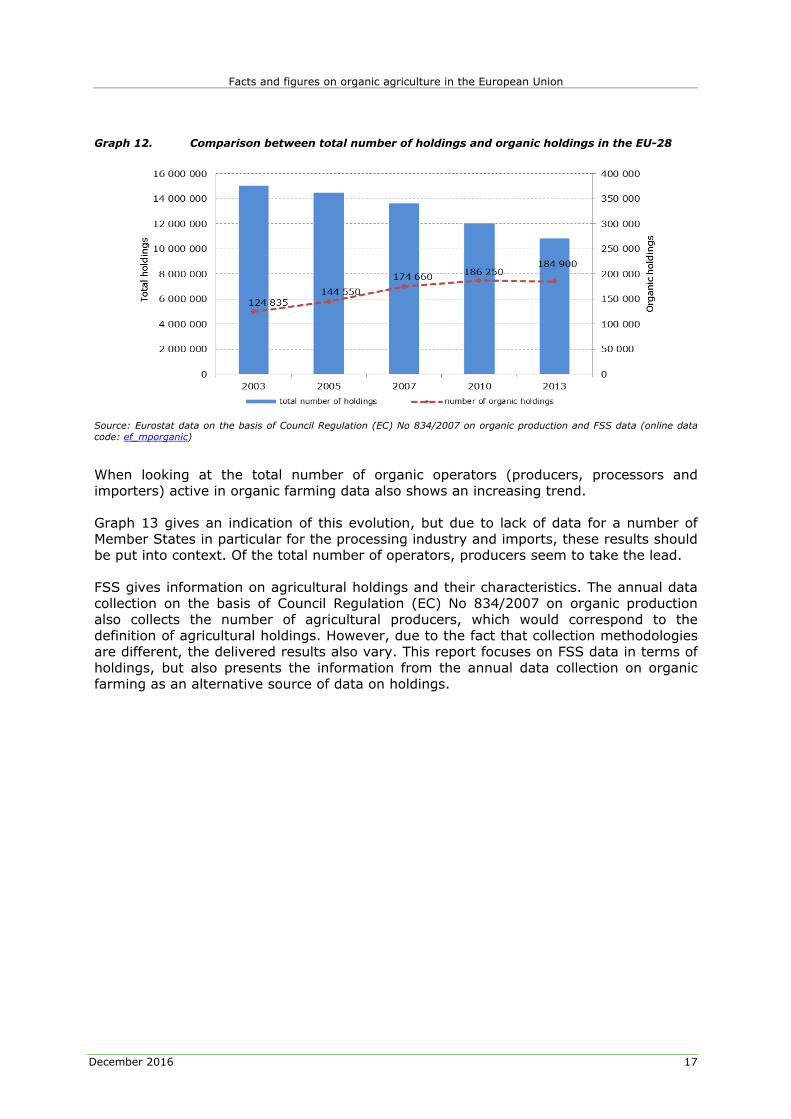
Graph 12. Comparison between total number of holdings and organic holdings in the EU-28
Source: Eurostat data on the basis of Council Regulation (EC) No 834/2007 on organic production and FSS data (online data code: ef_mporganic)
When looking at the total number of organic operators (producers, processors and importers) active in organic farming data also shows an increasing trend.
Graph 13 gives an indication of this evolution, but due to lack of data for a number of Member States in particular for the processing industry and imports, these results should be put into context. Of the total number of operators, producers seem to take the lead.
FSS gives information on agricultural holdings and their characteristics. The annual data collection on the basis of Council Regulation (EC) No 834/2007 on organic production also collects the number of agricultural producers, which would correspond to the definition of agricultural holdings. However, due to the fact that collection methodologies are different, the delivered results also vary. This report focuses on FSS data in terms of holdings, but also presents the information from the annual data collection on organic farming as an alternative source of data on holdings.

Facts and figures on organic agriculture in the European Union
December 2016 18
Graph 13. Evolution of the certified area, operators and producers involved in the organic sector in the EU according to the annual collection of organic farming statistics
Data on the basis of Council Regulation (EC) No 834/2007 on organic production (FEOSTAT data until 2011, and Eurostat data org_cropar from 2012 onwards) *Data from DE from Agrarmarkt Informations-Gesellschaft mbH and data from AT from Ministerium für ein Lebenswertes Österreich and (Operators: org_coptyp_h until 2011 and org_coptyp from 2012)
Graph 14 gives an idea of the evolution in the number of agricultural producers in EU Member States but, in view of the low data availability, its results should also be interpreted with caution. On the basis of available data, one interpretation would be that the number of producers in the organic sector has been overall on an increasing trend. Some exiting and entering the sector can be observed but overall, it would seem that producers have a tendency to remain in organic farming rather than heavily leaving this type of production. This would be explained by the fact that farmers make a substantial investment during the two years of conversion period foreseen by the Organic farming Regulation, during which, in spite of higher costs associated with organic farming, the production is sold as conventional and returns can be expected only once certified as organic.
Graph 14. New, withdrawn and total number of registered organic producers in the EU
Source: Eurostat data on the basis of Council Regulation (EC) No 834/2007 on organic production (online data code: org_coptyp_h until 2011 and org_coptyp from 2012)

Facts and figures on organic agriculture in the European Union
December 2016 19
Table 1. Number of all registered, new and withdrawn organic producers in all EU Member States (annual average 2007-2015)
Source: Eurostat data on the basis of Council Regulation (EC) No 834/2007 on organic production (online data code: org_coptyp_h until 2011 and org_coptyp from 2012)
Table 1 provides more detail for most EU Member States on the average number of producers leaving and entering organic farming. For most of these countries the trend of increasing number of producers entering the sector versus a more limited exit from organic agriculture is confirmed.
The evolution of the sector can be linked to major drivers such as the support provided to the sector, market developments as well as a 'facilitating' environment (extension services, vocational training, agronomic research, etc.) The weight of these factors varies according to region, for instance in the Northern European Member States, Germany and Austria the comprehensive facilitating environment plays a more important role. In the EU-N13, the development of the sector could be attributed among others to a favourable context of deep restructuring and reform of the agricultural sector (and the whole economy) since the beginning of the 1990s with the renewal of farming structures,

Facts and figures on organic agriculture in the European Union
December 2016 20
institutions and agricultural policy. These structural changes provided more space for organic farming to develop.

Facts and figures on organic agriculture in the European Union
December 2016 21
1.2.2. Elements on organic farm structures: holding area, labour, age and vocational training of farmers, gender issues
The Farm Structure Survey (FSS) looks at the main characteristics of the holding (namely type, size and region) and provides information on several features of organic farms. However, as organic farms represent less than 5% of all holdings, the FSS surveys are not stratified according to organic / non organic criteria. In spite of these limitations, both the FSS surveys and censuses provide certain information which is absent from the annual organic statistical data collection and which allow for a better understanding of who are the organic farmers in the EU.
According to the latest FSS, there were 184 900 organic farms (i.e. holdings with organic area and/or organic animals) in 2013. These represented 2% of total farms (conventional and organic) in the EU-28.
The average area of organic holdings in the EU-28 amounted to 47 ha in 2013. This area varies significantly across Member States (see Graph 15). In 2013, the largest organic holdings were located in Slovakia (average total area of 474 ha/holding), United Kingdom (204 ha/holding) and the Czech Republic (178 ha/holding). The smallest organic farms are located in Malta (less than 1 ha/holding), Slovenia (11 ha/holding) and Cyprus (13 ha/holding). From among the new Member States, besides Slovakia and the Czech Republic already mentioned, figures for Romania, Estonia and Lithuania show the biggest areas for organic holdings (92, 91 and 60 ha/holding respectively).
Graph 15 also provides a comparison of the average total surface of organic holdings with conventional holdings. The average size of organic holdings appears larger than the average size of conventional holdings across the EU-28, even if this difference is not large in some Member States.
Graph 15. Average surface of organic and conventional holdings (ha/holding), 2013
Source: Eurostat FSS data (online data code: ef_mporganic).

Facts and figures on organic agriculture in the European Union
December 2016 22
If for the EU-28 about 45% of total holdings have a size lower than 2 ha, only 2% of organic farms are situated in this category. However, conventional agriculture in the 2 ha size class or below usually includes a lot of managers which farm as a side activity and are not likely to focus on organic production. Nevertheless, looking at the other size classes, organic farms tend overall to be bigger than conventional farms.
Graph 16. Share of holdings in different size classes (organic and all), 2013
Source: Eurostat FSS data (online data code: ef_mporganic).
It is often argued that organic farming employs more labour than conventional farming because it is more labour intensive (for example additional labour being made necessary to compensate for the absence of use of chemical inputs and nitrogen fertilizers) than conventional farming. FSS data shows that this is not the case at the aggregate level for most Member States, but these results have to be put into context, as labour intensity also depends on product orientation.
Detailed comparisons of organic and conventional farms operating in the same sector and with similar size present in the European Farm Accountancy Data Network (FADN) 7 seem to confirm that organic farming is more labour intensive for certain types of production. This would be due to the fact that organic farms have limitations in using inputs and agricultural practices which make it more labour intensive8.
7 The FADN is a European system of sample surveys that collect accountancy data relating to farms. The possibilities of using FADN data for analyses of organic farming, in particular for what concerns structural aspects, are very limited since applying organic farming practices is not a sampling criteria in FADN and small size farms are not covered by the surveys.
8 Source: European Commission, Organic versus conventional farming, which performs better financially?, Farm Economic Briefs n°4 " November 2013, based on EU-FADN, http://ec.europa.eu/agriculture/rica/pdf/FEB4_Organic_farming_final_web.pdf It offers a comparison of organic versus conventional farming for fieldcrops in DE, AT, FR, PL and ES and for milk production in DE, AT and FR.

Facts and figures on organic agriculture in the European Union
December 2016 23
When we compare the financial performance of organic versus conventional farming for field crops and milk production in some Member States (Germany, Austria, France, Poland and Spain), we see that organic farms tend to make a more extensive use of resources and they tend to achieve higher margins per unit of production due to their higher prices. Anyway, subsidies play an important role in sustaining the income of organic farmers, as shown in the appendix dedicated to rural development measures to support organic farming.
Table 2. Labour force intensity, 2013
Source: FADN 'Farm Accounting Data Network'.
If organic farms are on average larger than non-organic farms, their holders are also younger. Age distributions of the managers of farms with organic area and farms without organic area are strikingly different: farmers younger than 55 represent 61% of the organic sector whereas they represent only 45% of the conventional sector (see Graph 17).
Graph 17. Comparison of age distribution of farm managers in the organic and non-organic sector in the EU-28 in 2013
Source: Eurostat data FSS.
Generally, the participation of women in the EU labour market still lags behind that of men. In rural areas of the EU, a similar gap between men and women exists in their degree of participation in economic activities. In 2011, agriculture provided 4% of all jobs held by women in the EU. The overwhelming majority of women work in the services
Facts and figures on organic agriculture in the European Union
December 2016 24
sector. For men, agriculture is slightly more important in terms of providing employment9.
9 More information in 'Women in EU agriculture and rural areas: Hard work, low profile', EU Agricultural Economic Brief No 7 - June 2012, http://ec.europa.eu/agriculture/rural-area-economics/briefs/pdf/07_en.pdf

Facts and figures on organic agriculture in the European Union
December 2016 25
2. ANALYSIS OF ORGANIC PRODUCTION – MAIN CROP AND ANIMAL SECTORS
In the previous chapter we have looked at the area under organic farming, the number of holdings and some characteristics of organic farmers. Another important aspect is the type of production (arable crop and orchard as well as animal) on the organic farms. The choice of the type of production differs among regions and Member States and depends on various factors (among which the technical aspects related to organic production and the structure of consumer demand).
2.1. The arable crop and orchard production
2.1.1. Analysis by main categories
In the European Union, organic arable crop and orchard production is important. Though data is scarce on all categories of this type of production, Table 3 gives an idea of the main types of land use for organic arable crop and orchard production. A good share of the organic land is used for permanent grasslands, but also for permanent crops (such as fruit) as well as cereals. When looking at the area under organic farming in comparison to the total area for the different agricultural uses in Europe, available data shows that organic organic crops (total) represent 5% of the total area cultivated in the EU-28.
Table 3. Main categories of certified organic land use in the EU-28, 2015
Source: Eurostat data land use statistics and Eurostat data on the basis of Council Regulation (EC) No 834/2007 on organic production (online data code: org_cropar)
Table 4. Main categories of agrigultural land use in the EU-28, 2013
Source: Eurostat data land use statistics and FSS Eurostat data on the basis of Council Regulation (EC) No 834/2007 on organic production (online data code: org_cropar)

Facts and figures on organic agriculture in the European Union
December 2016 26
Looking at the main categories of agricultural land use (Table 4),, permanent grassland represents more than 30% of the agricultural area. Cereals follow the above mentioned categories in terms of surface, followed by oilseeds, vegetables and dried pulses.
Table 5. Breakdown and share of certified organic area per type of crop type in the EU Member States, 2015
Source: Eurostat data land use statistics and Eurostat data on the basis of Council Regulation (EC) No 834/2007 on organic production (online data code: org_cropar)
Graph 18 shows differences of the land use in the organic sector between the EU Member States.

Facts and figures on organic agriculture in the European Union
December 2016 27
Graph 18. Crop production by crop in organic farming in the EU Member States, 2013
Source: Eurostat data on the basis of Council Regulation (EC) No 834/2007 on organic production (online data code: org_cropar)
The comparison of the main use categories for the organic sector shows interesting features. The share of permanent crops is high in the organic sector (15%) because the demand for fruit and vegetable products is among the highest on the organic market. What is significant is the share of permanent grassland which represents more than 50% of the whole organic area.
Conversely, cereals cover more than 30% of the total UAA of the EU but a lower percentage of the organic UAA. One element of explanation lies in the fact that organic production systems are more extensive than in conventional agriculture (higher reliance on grazing on permanent pastures). Permanent pastures are often eligible for agri-environmental organic payments and easier and less risky to convert to the organic sector than the other types of crops (e.g. arable crops). Depending on national features of rural development agri-environmental and/or organic payments and land use characteristics at regional level, this could lead to a bias towards the development of organic permanent pastures10.
Graph 19 below provides the share of the organic area in the total EU area for major crop types. Unsurprisingly, this share is highest for dried pulses which play a major role for animal feed and for permanent crops, but remains low compared to the overall area. The organic in total area share is the lowest for industrial crops.
10 More information on rural development measures in the appendix.

Facts and figures on organic agriculture in the European Union
December 2016 28
Graph 19. Share of the organic area in total EU area by crop sectors, 2013
Source: Eurostat data land use statistics and Eurostat data on the basis of Council Regulation (EC) No 834/2007 on organic production (online data code: org_cropar)
2.1.2. Permanent pastures
At Member State level, the area under permanent pastures is the highest in absolute terms in Spain, Germany, the United Kingdom, the Czech Republic, France and Italy where it is around 0.4 million ha or more.
Graph 20. Area under permanent pastures
Source: Eurostat data on the basis of Council Regulation (EC) No 834/2007 on organic production (online data code: org_cropar).
Facts and figures on organic agriculture in the European Union
December 2016 29
2.1.3. Major arable crops: cereals, oilseeds and protein crops
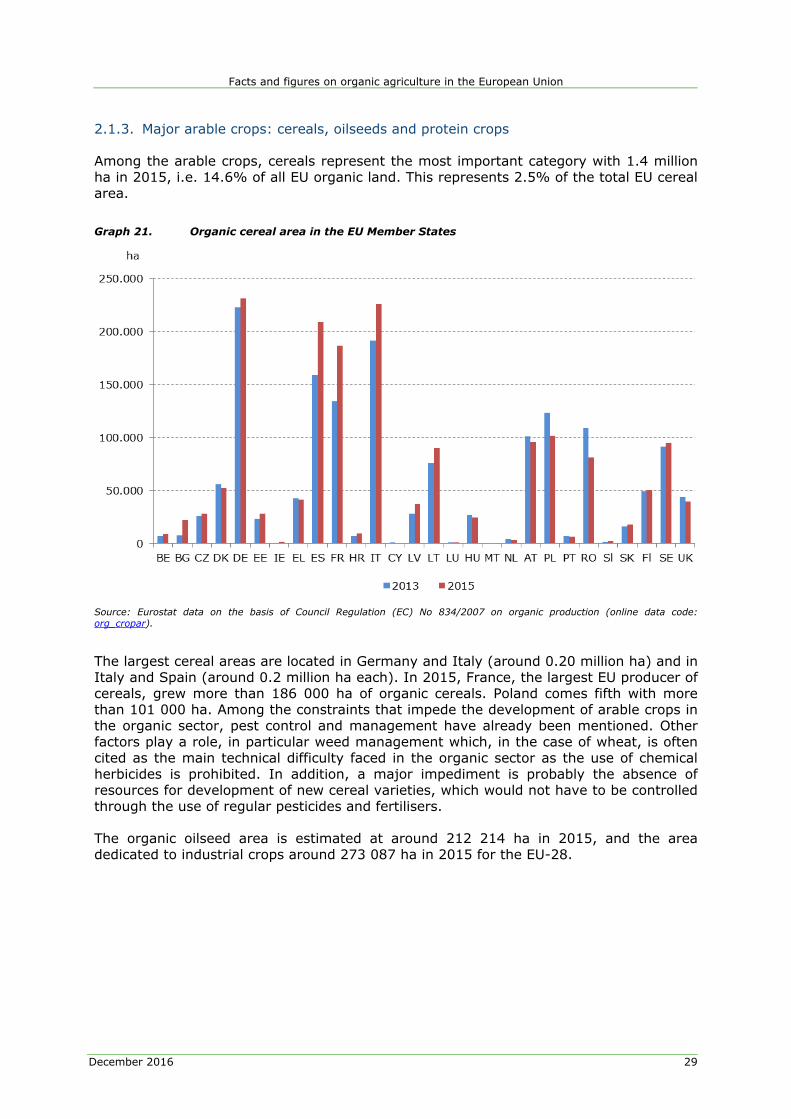
Among the arable crops, cereals represent the most important category with 1.4 million ha in 2015, i.e. 14.6% of all EU organic land. This represents 2.5% of the total EU cereal area.
Graph 21. Organic cereal area in the EU Member States
Source: Eurostat data on the basis of Council Regulation (EC) No 834/2007 on organic production (online data code: org_cropar).
The largest cereal areas are located in Germany and Italy (around 0.20 million ha) and in Italy and Spain (around 0.2 million ha each). In 2015, France, the largest EU producer of cereals, grew more than 186 000 ha of organic cereals. Poland comes fifth with more than 101 000 ha. Among the constraints that impede the development of arable crops in the organic sector, pest control and management have already been mentioned. Other factors play a role, in particular weed management which, in the case of wheat, is often cited as the main technical difficulty faced in the organic sector as the use of chemical herbicides is prohibited. In addition, a major impediment is probably the absence of resources for development of new cereal varieties, which would not have to be controlled through the use of regular pesticides and fertilisers.
The organic oilseed area is estimated at around 212 214 ha in 2015, and the area dedicated to industrial crops around 273 087 ha in 2015 for the EU-28.

Facts and figures on organic agriculture in the European Union
December 2016 30
Graph 22. Organic oilseed area in the EU Member States, 2015
Source: Eurostat data on the basis of Council Regulation (EC) No 834/2007 on organic production (online data code: org_cropar).
Another important category of arable crops is dried pulses, which play a specific role in the organic sector. Firstly, because dried pulses are leguminous plants which fix nitrogen they have a high rotational value in the organic production systems, contributing to the maintaining of soil fertility. Crop rotation is also a legal obligation under Council Regulation (EC) No 834/2007. Secondly, dried pulses play an important role in organic animal feed as they can substitute other protein feed ingredients (e.g. organic soybeans) which may be difficult to procure. In addition, the use of on-farm cultivated protein crops for organic animal feed in mixed crop-livestock production systems ensures the traceability of protein feed ingredients. It is estimated that 301 461 ha of organic dried pulses were cultivated in 2015 in the EU-28, of which 80% in the EU-15. France is the largest organic dried pulse producer with more than 68 000 ha in 2015, followed by Spain, Italy and Germany, with around 39 000 ha, 37 000 ha and 33 000ha respectively.
Graph 23. Organic dried pulse area in the EU Member States
Source: Eurostat data on the basis of Council Regulation (EC) No 834/2007 on organic production (online data code: org_cropar).
Facts and figures on organic agriculture in the European Union
December 2016 31
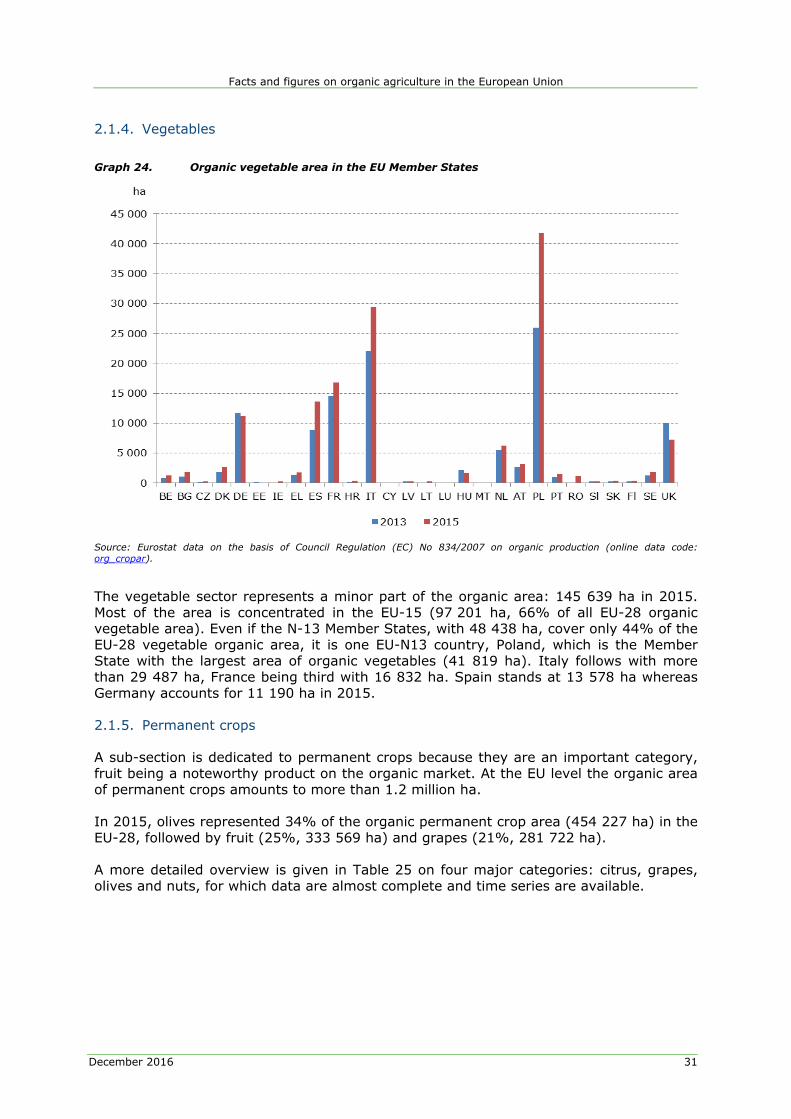
2.1.4. Vegetables
Graph 24. Organic vegetable area in the EU Member States
Source: Eurostat data on the basis of Council Regulation (EC) No 834/2007 on organic production (online data code: org_cropar).
The vegetable sector represents a minor part of the organic area: 145 639 ha in 2015. Most of the area is concentrated in the EU-15 (97 201 ha, 66% of all EU-28 organic vegetable area). Even if the N-13 Member States, with 48 438 ha, cover only 44% of the EU-28 vegetable organic area, it is one EU-N13 country, Poland, which is the Member State with the largest area of organic vegetables (41 819 ha). Italy follows with more than 29 487 ha, France being third with 16 832 ha. Spain stands at 13 578 ha whereas Germany accounts for 11 190 ha in 2015.
2.1.5. Permanent crops
A sub-section is dedicated to permanent crops because they are an important category, fruit being a noteworthy product on the organic market. At the EU level the organic area of permanent crops amounts to more than 1.2 million ha.
In 2015, olives represented 34% of the organic permanent crop area (454 227 ha) in the EU-28, followed by fruit (25%, 333 569 ha) and grapes (21%, 281 722 ha).
A more detailed overview is given in Table 25 on four major categories: citrus, grapes, olives and nuts, for which data are almost complete and time series are available.

Facts and figures on organic agriculture in the European Union
December 2016 32
Graph 25. Major organic permanent crops (ha and % of EU total) in 2015
Source: Eurostat data on the basis of Council Regulation (EC) No 834/2007 on organic production (online data code: org_cropar).
2.1.5.1. Citrus
Graph 26. Citrus organic area in Greece, Italy and Spain
Source: Eurostat data on the basis of Council Regulation (EC) No 834/2007 on organic production (online data code: org_cropar_h1 until 2011 and org_cropar for 2012 onwards).
The organic citrus sector has seen a dynamic development in the last 15 years in the EU. The sector is concentrated around few Member States only: Italy, Greece, Spain and Cyprus. The biggest citrus areas are situated in Italy (almost 31 900 ha) followed by Spain, where the sector amounted to around 8 200 ha in 2015 and is under development. Greece follows them with almost 1 300 ha in 2015.
Facts and figures on organic agriculture in the European Union
December 2016 33
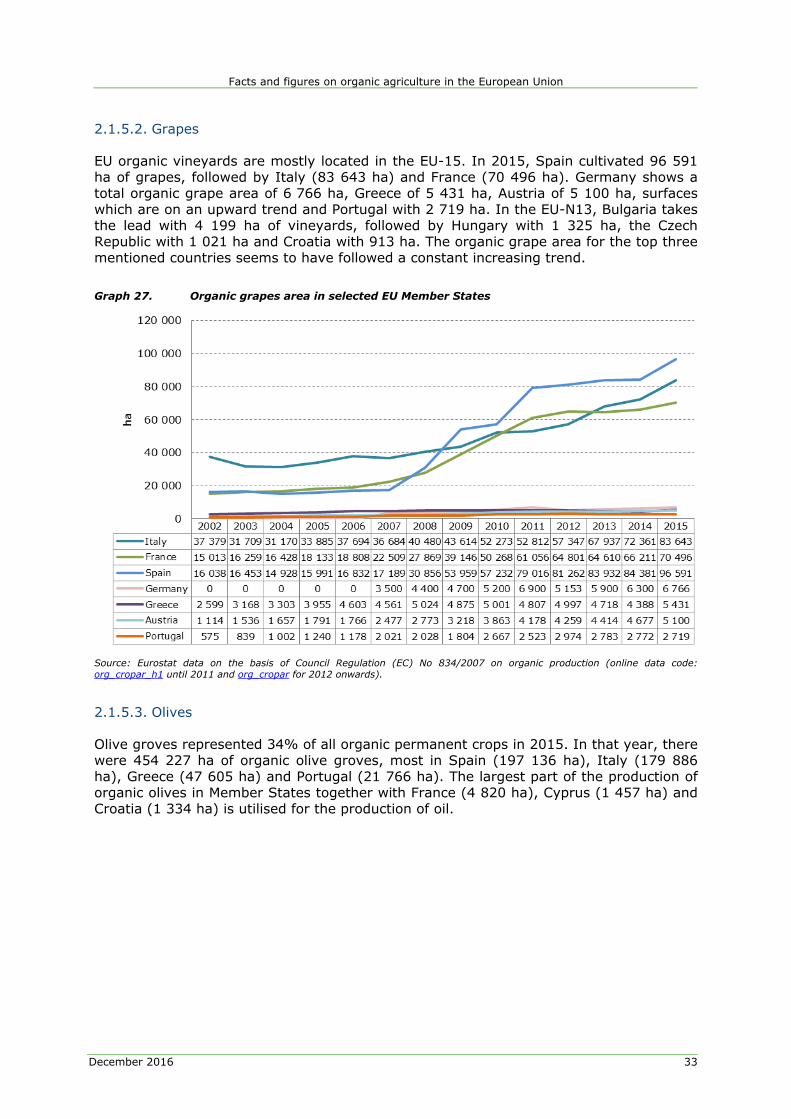
2.1.5.2. Grapes
EU organic vineyards are mostly located in the EU-15. In 2015, Spain cultivated 96 591 ha of grapes, followed by Italy (83 643 ha) and France (70 496 ha). Germany shows a total organic grape area of 6 766 ha, Greece of 5 431 ha, Austria of 5 100 ha, surfaces which are on an upward trend and Portugal with 2 719 ha. In the EU-N13, Bulgaria takes the lead with 4 199 ha of vineyards, followed by Hungary with 1 325 ha, the Czech Republic with 1 021 ha and Croatia with 913 ha. The organic grape area for the top three mentioned countries seems to have followed a constant increasing trend.
Graph 27. Organic grapes area in selected EU Member States
Source: Eurostat data on the basis of Council Regulation (EC) No 834/2007 on organic production (online data code: org_cropar_h1 until 2011 and org_cropar for 2012 onwards).
2.1.5.3. Olives
Olive groves represented 34% of all organic permanent crops in 2015. In that year, there were 454 227 ha of organic olive groves, most in Spain (197 136 ha), Italy (179 886 ha), Greece (47 605 ha) and Portugal (21 766 ha). The largest part of the production of organic olives in Member States together with France (4 820 ha), Cyprus (1 457 ha) and Croatia (1 334 ha) is utilised for the production of oil.

Facts and figures on organic agriculture in the European Union
December 2016 34
Graph 28. Organic olive area in Greece, Italy, Spain and Portugal
Source: Eurostat data on the basis of Council Regulation (EC) No 834/2007 on organic production (online data code: org_cropar_h1 until 2011 and org_cropar for 2012 onwards).
2.1.5.4. Nuts
In 2015, there were 190 580 ha of organic nuts in the EU, of which only 23 494 ha in the EU-13 (with most important areas in Bulgaria, Poland and in Hungary. In the EU-15, the 167 086 ha of organic nuts are primarily located in Spain and Italy.
At the EU level the nuts and olive sectors are two important sectors in the permanent crop organic areas in 2015 (14% for nuts and 34% for olives) since these two types of production are faced with a high demand on the market (especially organic olive oil) together with lower difficulties in carrying out production from an agronomic point of view. This cannot be said for instance of grape production as vines are very sensitive to diseases11.
11 The cultivation of organic vines for wine or table grape is more delicate in particular in humid climates.

Facts and figures on organic agriculture in the European Union
December 2016 35
2.2. The animal sector
Statistics on the number of organic animals are incomplete and do not allow, for the moment, for a complete depiction of the sector.
However, taking into account available information, the organic animal sector is developing at a fast pace in the EU. As shown in Table 6, for both the EU-15 and the EU-N13 sheep and cattle production are the most important, after poultry, out of the total organic animal production.
Table 6. Animals under organic production in the different EU country groups, 2015
Source: Eurostat data on the basis of Council Regulation (EC) No 834/2007 on organic production (online data code: org_lstspec)
Converting the number of animal heads into livestock units (LSU)12 allows for a comparison between the different types of animals.
Table 7. Evolution of animals (heads) under organic production in the EU-28, 2015
Source: Eurostat data on the basis of Council Regulation (EC) No 834/2007 on organic production (online data codes: org_lstspec_h and org_lstspec)
12 The LSU (livestock unit) is a reference unit which facilitates the aggregation of livestock from various species and age as per convention, via the use of specific coefficients established initially on the basis of the nutritional or feed requirement of each type of animal.
Facts and figures on organic agriculture in the European Union
December 2016 36
The share of organic production within total production varies according to the different animal sectors. The goats and pork sectors have the lowest weight. This stems partly from the difficulties posed by the provision of organic animal feed (compound feed). Conversely the highest shares are found in the sheep and goat sectors.
Apart from sheep and goats, the ruminant sector would tend to develop faster than other livestock sectors.
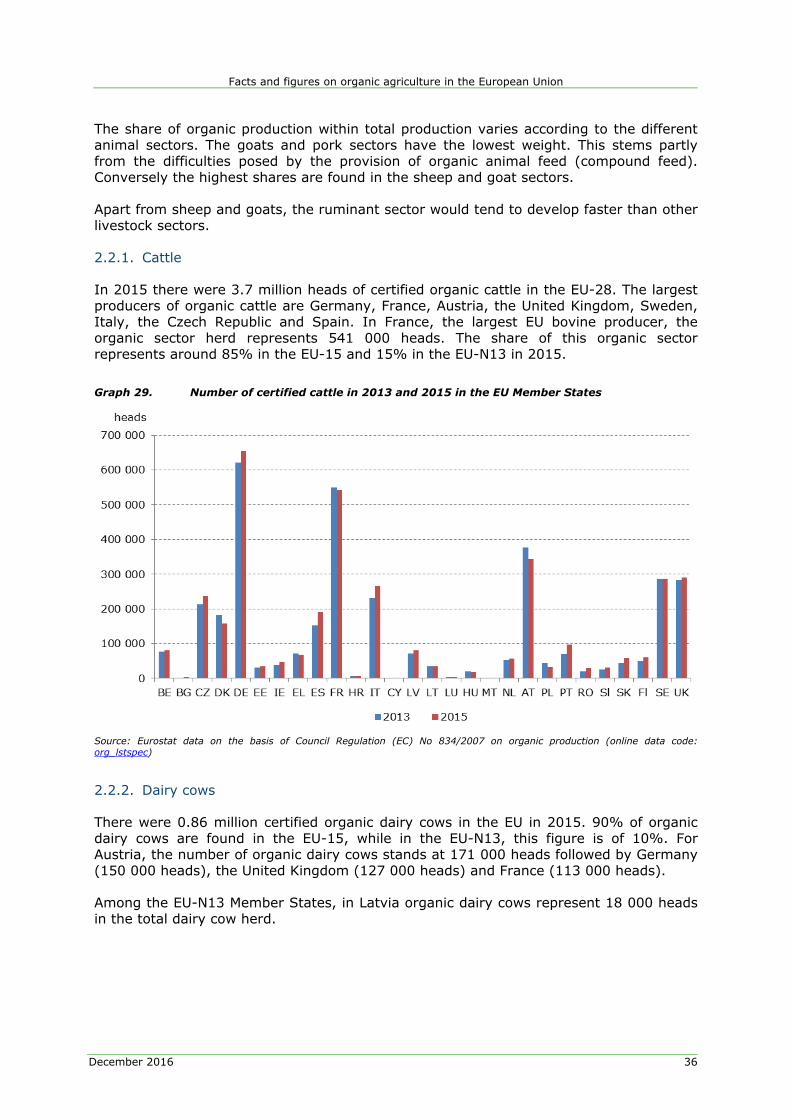
2.2.1. Cattle
In 2015 there were 3.7 million heads of certified organic cattle in the EU-28. The largest producers of organic cattle are Germany, France, Austria, the United Kingdom, Sweden, Italy, the Czech Republic and Spain. In France, the largest EU bovine producer, the organic sector herd represents 541 000 heads. The share of this organic sector represents around 85% in the EU-15 and 15% in the EU-N13 in 2015.
Graph 29. Number of certified cattle in 2013 and 2015 in the EU Member States
Source: Eurostat data on the basis of Council Regulation (EC) No 834/2007 on organic production (online data code: org_lstspec)
2.2.2. Dairy cows
There were 0.86 million certified organic dairy cows in the EU in 2015. 90% of organic dairy cows are found in the EU-15, while in the EU-N13, this figure is of 10%. For Austria, the number of organic dairy cows stands at 171 000 heads followed by Germany (150 000 heads), the United Kingdom (127 000 heads) and France (113 000 heads).
Among the EU-N13 Member States, in Latvia organic dairy cows represent 18 000 heads in the total dairy cow herd.

Facts and figures on organic agriculture in the European Union
December 2016 37
Graph 30. Number of certified dairy cows in the EU in 2013 and 2015 in the EU Member States
Source: Eurostat data on the basis of Council Regulation (EC) No 834/2007 on organic production (online data code: org_lstspec)
2.2.3. Pigs
The organic pig herd amounted to 0.978 million heads in 2015. The largest producers were Denmark (260 510 heads), France (219 812 heads) and Germany (190 471 heads). The organic pig sector still holds a very minor share in the EU pig market. It is much more important in the EU-15 with 947 219 heads and 97% of the organic pig production than in the EU-N13, with 31 340 heads, which is only 3% of the organic pig sector.
Graph 31. Number of certified organic pigs in 2013 and 2015 in the EU Member States
Source: Eurostat data on the basis of Council Regulation (EC) No 834/2007 on organic production (online data code: org_lstspec)

Facts and figures on organic agriculture in the European Union
December 2016 38
2.2.4. Sheep
The organic ovine sector is dominated by three Member States (figures 2015): the United Kingdom (868 554 heads), Italy (785 170 heads) and and Greece (with 609 616 heads), representing together 50% of the entire EU organic herd of 4.48 million heads. Next is Spain with 0.6 million heads, followed by France with just over 0.45 million heads. In the case of Greece and Italy the sector is oriented towards the production of milk and processing into cheese (organic Feta in the case of Greece) whereas in the United Kingdom and Spain the sector is focused towards meat production. In several EU-N13 Member States the organic sector represents a sizeable part of the organic sheep (11%, 487 638 heads), even if absolute figures remain modest: 102 523 heads in the Czech Republic, 97 239 heads in Slovakia and 85 419 heads in Romania. The European Union registered a 7% yearly increase in the organic sheep head numbers between 2005 and 2015.
Graph 32. Number of certified organic sheep in 2013 and 2015 in the EU Member States
Source: Eurostat data on the basis of Council Regulation (EC) No 834/2007 on organic production (online data code: org_lstspec)
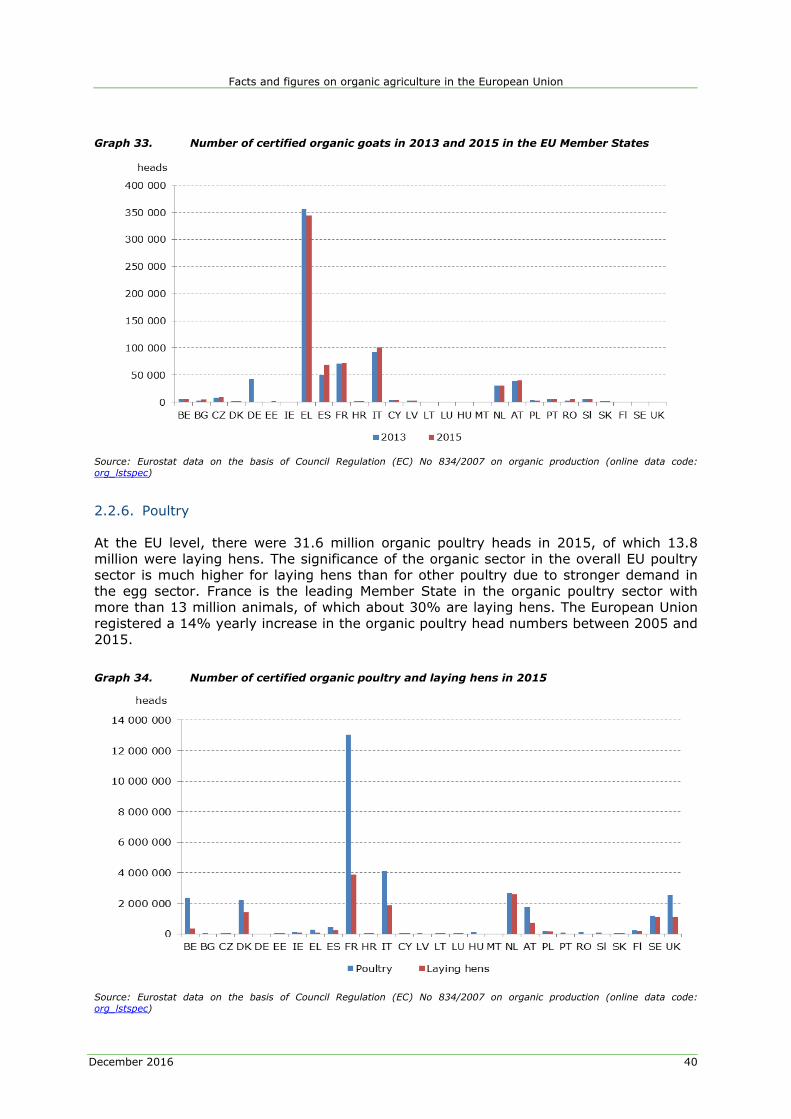
2.2.5. Goats
The organic goat sector counts more than 0.7 million heads. It appears rather concentrated geographically as it is represented essentially in Greece with (2015 data) 344 479 heads. Italy follows with 100 852 heads and France with 72 542 heads and Spain with 69 448 heads. Again, in the case of Greece the sector is essentially focused on the production of milk for organic cheeses like Feta. In most Member States the sector is also specialised on the production of organic cheese. The organic herd represents a sizeable part of the total herd in several Member States of the EU-N13 (6% of the EU-28 organic goats, and a herd of 43 615 heads, with 9 656 heads in Czech Republic and 6 461 heads in Slovenia) and of the EU-15 (94% of EU-28 organic goats
Facts and figures on organic agriculture in the European Union
December 2016 39
and 674 479 heads herd size, with 42 200 heads in Germany13, 40 686 heads in Austria and 31 037 heads in the Netherlands).
13 In 2013.
Facts and figures on organic agriculture in the European Union
December 2016 40
Graph 33. Number of certified organic goats in 2013 and 2015 in the EU Member States
Source: Eurostat data on the basis of Council Regulation (EC) No 834/2007 on organic production (online data code: org_lstspec)
2.2.6. Poultry
At the EU level, there were 31.6 million organic poultry heads in 2015, of which 13.8 million were laying hens. The significance of the organic sector in the overall EU poultry sector is much higher for laying hens than for other poultry due to stronger demand in the egg sector. France is the leading Member State in the organic poultry sector with more than 13 million animals, of which about 30% are laying hens. The European Union registered a 14% yearly increase in the organic poultry head numbers between 2005 and 2015.
Graph 34. Number of certified organic poultry and laying hens in 2015
Source: Eurostat data on the basis of Council Regulation (EC) No 834/2007 on organic production (online data code: org_lstspec)

Facts and figures on organic agriculture in the European Union
December 2016 41
3. CONCLUSIONS
The organic farming sector in Europe has rapidly developed in the past years. This increase characterises not only the area under organic farming, but also the number of holdings and of overall organic operators registered in the EU-28. Though a good part of the number of holdings and area is still situated in the EU-15, the EU's newest Member States have shown encouraging developments in this respect, in particular in the context of additional financing provided by the EU for this type of production since their accession. Both animal as well as arable crop and orchard organic production are on an upward trend in the EU Member States. Organic farms are on the average larger than non-organic farms and their holders younger.
Nevertheless, due to insufficient data on certain aspects of organic production and of the organic food chain (in particular sales and trade) a complete picture of the sector is at this point in time unavailable. A number of initiatives are currently ongoing with a view to improve data collection on organic farming, but comprehensive official statistics remain necessary for any future analysis of this sector in the EU.

Facts and figures on organic agriculture in the European Union
December 2016 42
4. STATISTICAL SOURCES AND REFERENCES
Statistical sources
Eurostat database: http://ec.europa.eu/eurostat/data/database Agrarmarkt Informations-Gesellschaft mbH Ministerium für ein Lebenswertes Österreich. FAOSTAT: http://www.fao.org/faostat/en/#home Farm Accountancy Data Network (FADN): http://ec.europa.eu/agriculture/rica/database/database_en.cfm
References
European Commission, 'Women in EU agriculture and rural areas: Hard work, low profile', EU Agricultural Economic Brief No 7 - June 2012, http://ec.europa.eu/agriculture/rural-area-economics/briefs/pdf/07_en.pdf
European Commission, 'Let´s talk about rural development money! Financial planning and implementation of rural development programmes in the 2007-2013 programming period', EU Agricultural Economic Brief No 10 – October 2013, http://ec.europa.eu/agriculture/sites/agriculture/files/rural-area-economics/briefs/pdf/10_en.pdf
European Commission, Organic versus conventional farming, which performs better financially?, Farm Economic Briefs n°4 " November 2013, based on EU-FADN, http://ec.europa.eu/agriculture/rica/pdf/FEB4_Organic_farming_final_web.pdf
Sanders, J.(ed), Evaluation of the EU legislation on organic farming. Study report, Thünen Institute of Farm Economics, 2013, https://ec.europa.eu/agriculture/sites/agriculture/files/evaluation/market-and-income-reports/2013/organic-farming/fulltext_en.pdf

Facts and figures on organic agriculture in the European Union
December 2016 43
APPENDIX
RURAL DEVELOPMENT AND ORGANIC AGRICULTURE
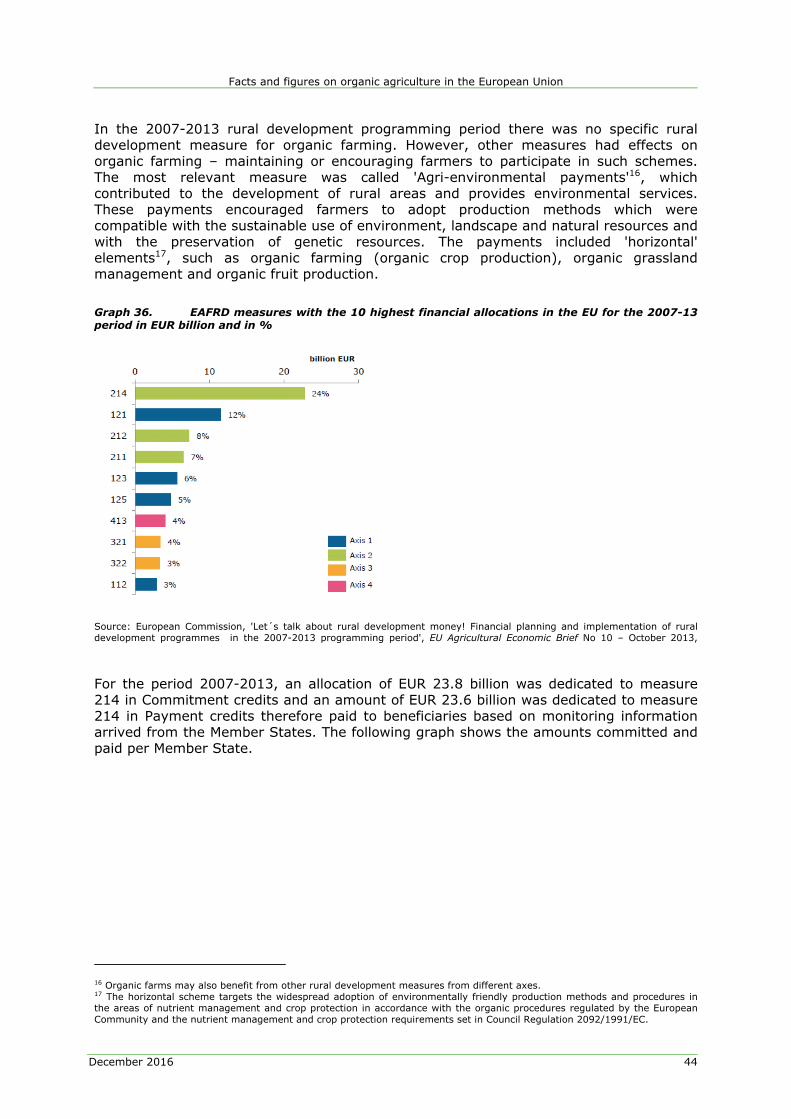
Organic farming is supported through the Pillar II of the Common Agricultural Policy (CAP) which covers rural development. Under rural development Member States draw up and co-finance multiannual programmes under a common framework14. For the period 2007-2013, the total EU support for rural development in all Member States amounted to EUR 96.3 billion. This financial support was provided through the European Agricultural Fund for Rural Development (EAFRD) and corresponded to roughly 20% of the total CAP budget. It was split between three axes and 46 measures.
Graph 35 shows the 2007-2013 rural development15 measures, including measure 214 in Axis 1 for 'Agri-environmental payments'. Across the EU, measure 214 accounted for 24% of the total EAFRD endowment (see Graph 36).
Graph 35. Rural development measures 2007-2013
Source: European Commission, 'Let´s talk about rural development money! Financial planning and implementation of rural development programmes in the 2007-2013 programming period', EU Agricultural Economic Brief No 10 – October 2013,
14 Council Regulation (EC) No 1698/2005 and Regulation 1305/2013. 15 Source: European Commission, 'Let´s talk about rural development money! Financial planning and implementation of rural development programmes in the 2007-2013 programming period', EU Agricultural Economic Brief No 10 – October 2013, http://ec.europa.eu/agriculture/sites/agriculture/files/rural-area-economics/briefs/pdf/10_en.pdf
Facts and figures on organic agriculture in the European Union
December 2016 44
In the 2007-2013 rural development programming period there was no specific rural development measure for organic farming. However, other measures had effects on organic farming – maintaining or encouraging farmers to participate in such schemes. The most relevant measure was called 'Agri-environmental payments'16, which contributed to the development of rural areas and provides environmental services. These payments encouraged farmers to adopt production methods which were compatible with the sustainable use of environment, landscape and natural resources and with the preservation of genetic resources. The payments included 'horizontal' elements17, such as organic farming (organic crop production), organic grassland management and organic fruit production.
Graph 36. EAFRD measures with the 10 highest financial allocations in the EU for the 2007-13 period in EUR billion and in %
Source: European Commission, 'Let´s talk about rural development money! Financial planning and implementation of rural development programmes in the 2007-2013 programming period', EU Agricultural Economic Brief No 10 – October 2013,
For the period 2007-2013, an allocation of EUR 23.8 billion was dedicated to measure 214 in Commitment credits and an amount of EUR 23.6 billion was dedicated to measure 214 in Payment credits therefore paid to beneficiaries based on monitoring information arrived from the Member States. The following graph shows the amounts committed and paid per Member State.
16 Organic farms may also benefit from other rural development measures from different axes. 17 The horizontal scheme targets the widespread adoption of environmentally friendly production methods and procedures in the areas of nutrient management and crop protection in accordance with the organic procedures regulated by the European Community and the nutrient management and crop protection requirements set in Council Regulation 2092/1991/EC.

Facts and figures on organic agriculture in the European Union
December 2016 45
Graph 37. EAFRD payments within measure 214 (from 2007 to 2013) per Member State
Source: Data from DG Agriculture and Rural Development, unit H2.
For the 2014-2020 period18, the Regulation on support for rural development through the EAFRD introduces a specific measure for organic farming. Therefore, payments for the conversion to or maintenance of organic farming should encourage farmers to participate in such schemes in order to answer society's increasing demand for the use of environmentally friendly farm practices.
18 Main Regulations for the 2014-2020 programming period:
Regulation (EU) nº 1303/2013 of the European Parliament and of the Council laying down common provisions on the European Regional Development Fund, the European Social Fund, The Cohesion Fund, The European Agricultural Fund for Rural Development and the European Maritime and Fisheries Fund covered by the Common Strategic Framework and laying down general provisions on the European Regional Funds, the European Social Fund and the Cohesion Fund repealing Regulation (EC) nº 1083/2006
The "Common Provisions" Regulation provides for a shared set of basic rules applying to all European Structural and Investments Funds (ESIFs) including the EAFRD.
Regulation (EU) nº 1305/2013 of the European Parliament and of the Council on support for rural development by the European Agricultural Fund for Rural Development (EAFRD)
This is the basic act that sets out the specific rules relating to the EAFRD for rural development programming.

Facts and figures on organic agriculture in the European Union


