16
HAR ZIMMEDARI KE PEECHHE PLANNING HOTI HAI Open your today. zimmedari ka khaata FACTSHEET FEBRUARY 2014

HAR ZIMMEDARI KE PEECHHE
PLANNING HOTI HAI
Open your today.zimmedari ka khaata
FACTSHEETF E B R UA RY 2 0 1 4
PORTFOLIO
SECTOR ALLOCATION (%)
Past performance may or may not be sustained in future. Calculations are based on Growth Option NAV. Since inception returns are calculated on ̀ 10 invested at inception.Pankaj Murarka manages 3 schemes. Please refer to annexure on Page 14 for performance of all schemes managed by the fund manager.
1
SCHEME PERFORMANCE st(as on 31 December 2013)
FACTSHEETth 28 February 2014
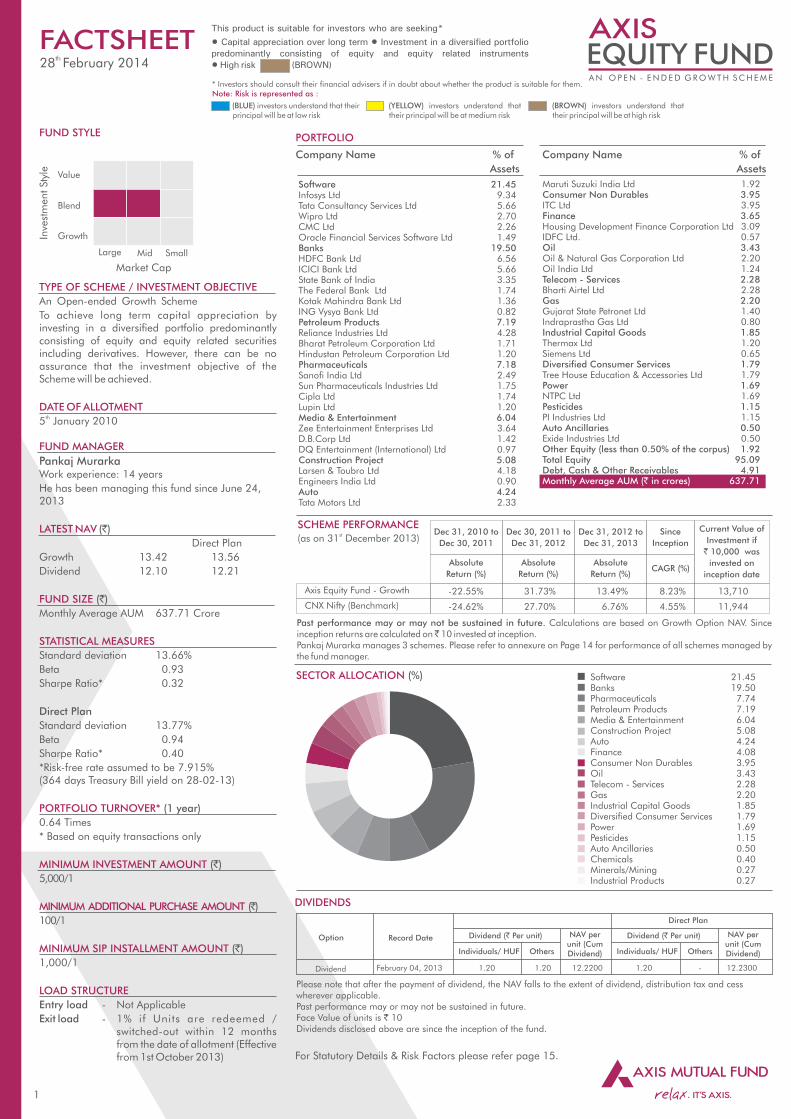
Software 21.45Infosys Ltd 9.34Tata Consultancy Services Ltd 5.66Wipro Ltd 2.70CMC Ltd 2.26Oracle Financial Services Software Ltd 1.49 Banks 19.50HDFC Bank Ltd 6.56ICICI Bank Ltd 5.66State Bank of India 3.35The Federal Bank Ltd 1.74Kotak Mahindra Bank Ltd 1.36ING Vysya Bank Ltd 0.82 Petroleum Products 7.19Reliance Industries Ltd 4.28Bharat Petroleum Corporation Ltd 1.71Hindustan Petroleum Corporation Ltd 1.20 Pharmaceuticals 7.18Sanofi India Ltd 2.49Sun Pharmaceuticals Industries Ltd 1.75Cipla Ltd 1.74Lupin Ltd 1.20 Media & Entertainment 6.04Zee Entertainment Enterprises Ltd 3.64D.B.Corp Ltd 1.42DQ Entertainment (International) Ltd 0.97 Construction Project 5.08Larsen & Toubro Ltd 4.18Engineers India Ltd 0.90Auto 4.24Tata Motors Ltd 2.33
Maruti Suzuki India Ltd 1.92Consumer Non Durables 3.95ITC Ltd 3.95 Finance 3.65Housing Development Finance Corporation Ltd 3.09IDFC Ltd. 0.57Oil 3.43Oil & Natural Gas Corporation Ltd 2.20Oil India Ltd 1.24 Telecom - Services 2.28Bharti Airtel Ltd 2.28 Gas 2.20Gujarat State Petronet Ltd 1.40Indraprastha Gas Ltd 0.80Industrial Capital Goods 1.85Thermax Ltd 1.20Siemens Ltd 0.65 Diversified Consumer Services 1.79Tree House Education & Accessories Ltd 1.79 Power 1.69NTPC Ltd 1.69 Pesticides 1.15PI Industries Ltd 1.15 Auto Ancillaries 0.50Exide Industries Ltd 0.50 Other Equity (less than 0.50% of the corpus) 1.92 Total Equity 95.09 Debt, Cash & Other Receivables 4.91Monthly Average AUM (` in crores) 637.71
Company Name % of
Assets
Company Name % of
Assets
Absolute
Return (%)
Absolute
Return (%)
Absolute
Return (%)
Dec 31, 2010 to
Dec 30, 2011
Dec 30, 2011 to
Dec 31, 2012
Dec 31, 2012 to
Dec 31, 2013
CAGR (%)
Since
Inception
Axis Equity Fund - Growth
CNX Nifty (Benchmark)
-22.55% 31.73% 13.49%
-24.62% 27.70% 6.76%
Current Value of
Investment if
` 10,000 was
invested on
inception date
Software 21.45Banks 19.50Pharmaceuticals 7.74Petroleum Products 7.19Media & Entertainment 6.04Construction Project 5.08Auto 4.24Finance 4.08Consumer Non Durables 3.95Oil 3.43Telecom - Services 2.28Gas 2.20Industrial Capital Goods 1.85Diversified Consumer Services 1.79Power 1.69Pesticides 1.15Auto Ancillaries 0.50Chemicals 0.40Minerals/Mining 0.27Industrial Products 0.27
FUND STYLE
TYPE OF SCHEME / INVESTMENT OBJECTIVE
An Open-ended Growth Scheme
To achieve long term capital appreciation by investing in a diversified portfolio predominantly consisting of equity and equity related securities including derivatives. However, there can be no assurance that the investment objective of the Scheme will be achieved.
DATE OF ALLOTMENTth5 January 2010
FUND MANAGER
Pankaj MurarkaWork experience: 14 years
He has been managing this fund since June 24, 2013
LATEST NAV (`)
Direct Plan
Growth 13.42 13.56
Dividend 12.10 12.21
FUND SIZE (`)
Monthly Average AUM 637.71 Crore
STATISTICAL MEASURES
Standard deviation 13.66%
Beta 0.93
Sharpe Ratio* 0.32
Direct Plan
Standard deviation 13.77%
Beta 0.94
Sharpe Ratio* 0.40
*Risk-free rate assumed to be 7.915% (364 days Treasury Bill yield on 28-02-13)
PORTFOLIO TURNOVER* (1 year)
0.64 Times
* Based on equity transactions only
MINIMUM INVESTMENT AMOUNT (`)
5,000/1
MINIMUM ADDITIONAL PURCHASE AMOUNT (̀ )
100/1
MINIMUM SIP INSTALLMENT AMOUNT (`)
1,000/1
LOAD STRUCTURE
Entry load - Not Applicable
Exit load - 1% if Units are redeemed / switched-out within 12 months from the date of allotment (Effective from 1st October 2013)
Value
Blend
GrowthInve
stm
ent Sty
le
Market Cap
Large Mid Small
For Statutory Details & Risk Factors please refer page 15.
DIVIDENDS
Record Date NAV per unit (Cum Dividend) Individuals/ HUF
Dividend (` Per unit)
Others
Option
Dividend February 04, 2013 1.20 1.20 12.2200 1.20 - 12.2300
NAV per unit (Cum Dividend) Individuals/ HUF
Dividend (` Per unit)
Others
Direct Plan
Please note that after the payment of dividend, the NAV falls to the extent of dividend, distribution tax and cess wherever applicable.Past performance may or may not be sustained in future. Face Value of units is ` 10Dividends disclosed above are since the inception of the fund.
8.23%
4.55%
13,710
11,944
This product is suitable for investors who are seeking*
Capital appreciation over to long term
Investment in a diversified portfolio predominantly consisting of equity and equity related instruments
High risk (BROWN)
* Investors should consult their financial advisers if in doubt about whether the product is suitable for them.Note: Risk is represented as :
(BLUE) investors understand that their principal will be at low risk
(YELLOW) investors understand that their principal will be at medium risk
(BROWN) investors understand that their principal will be at high risk
2
PORTFOLIO
Software 18.61
Tata Consultancy Services Ltd 7.27
Infosys Ltd 7.16
Wipro Ltd 4.17
Banks 18.31
HDFC Bank Ltd 6.90
ICICI Bank Ltd 6.26
Kotak Mahindra Bank Ltd 5.14
Auto 13.10
Mahindra & Mahindra Ltd 5.10
Tata Motors Ltd 4.73
Hero MotoCorp Ltd 3.28
Pharmaceuticals 12.13
Dr. Reddy's Laboratories Ltd 4.17
Sun Pharmaceuticals Industries Ltd 4.11
Lupin Ltd 3.85
Consumer Non Durables 9.02
ITC Ltd 5.00
Colgate Palmolive (India) Ltd 2.21
United Spirits Ltd 1.80
Finance 5.63
Housing Development Finance Corporation Ltd 5.63
Industrial Products 3.68
Cummins India Ltd 3.68
Industrial Capital Goods 3.65
Thermax Ltd 3.65
Petroleum Products 3.02
Reliance Industries Ltd 3.02
Media & Entertainment 2.57
Zee Entertainment Enterprises Ltd 2.57
Non - Ferrous Metals 2.38
Hindustan Zinc Ltd 2.38
Chemicals 2.29
Pidilite Industries Ltd 2.29
Cement 2.04
Ultratech Cement Ltd 2.04
Telecom - Services 1.87
Bharti Airtel Ltd 1.87
Total Equity 98.30
Cash & Other Receivables 1.70
Monthly Average AUM (` in crores) 107.43
Company Name % of
Assets
Company Name % of
Assets
SECTOR ALLOCATION (%)
FUND STYLE
TYPE OF SCHEME / INVESTMENT OBJECTIVE
An Open-Ended Equity Scheme
To generate long term capital appreciation by investing in a concentrated portfolio of equity & equity related instruments of up to 25 companies.
DATE OF ALLOTMENTth29 June 2012
FUND MANAGER
Sudhanshu AsthanaWork experience: 13 years
He has been managing this fund since 2nd September 2013
LATEST NAV (`)
Direct Plan
Growth 12.13 12.28
Dividend 12.13 12.23
FUND SIZE (`)
Monthly Average AUM 107.43 Crore
STATISTICAL MEASURES
Standard deviation 14.71%
Beta 0.99
Sharpe Ratio* -0.07
Direct Plan
Standard deviation 14.84%
Beta 1.00
Sharpe Ratio* 0.01
*Risk-free rate assumed to be 7.915% (364 days Treasury Bill yield on 28-02-13)
PORTFOLIO TURNOVER* (1 year)
1.03 Times
* Based on equity transactions only
MINIMUM INVESTMENT AMOUNT (`)
5,000/1
MINIMUM ADDITIONAL PURCHASE AMOUNT (̀ )
100/1
MINIMUM SIP INSTALLMENT AMOUNT (̀ )
1,000/1
LOAD STRUCTURE
Entry load - Not Applicable
Exit load - 3% if redeemed / switched - out up to 6 months from the date of allotment
2% if redeemed / switched - out after 6 months & up to 12 months from the date of allotment
1% if redeemed / switched - out after 12 months & up to 24 months from the date of allotment
Value
Blend
GrowthInve
stm
ent Sty
le
Market Cap
Large Mid Small
FACTSHEETth 28 February 2014
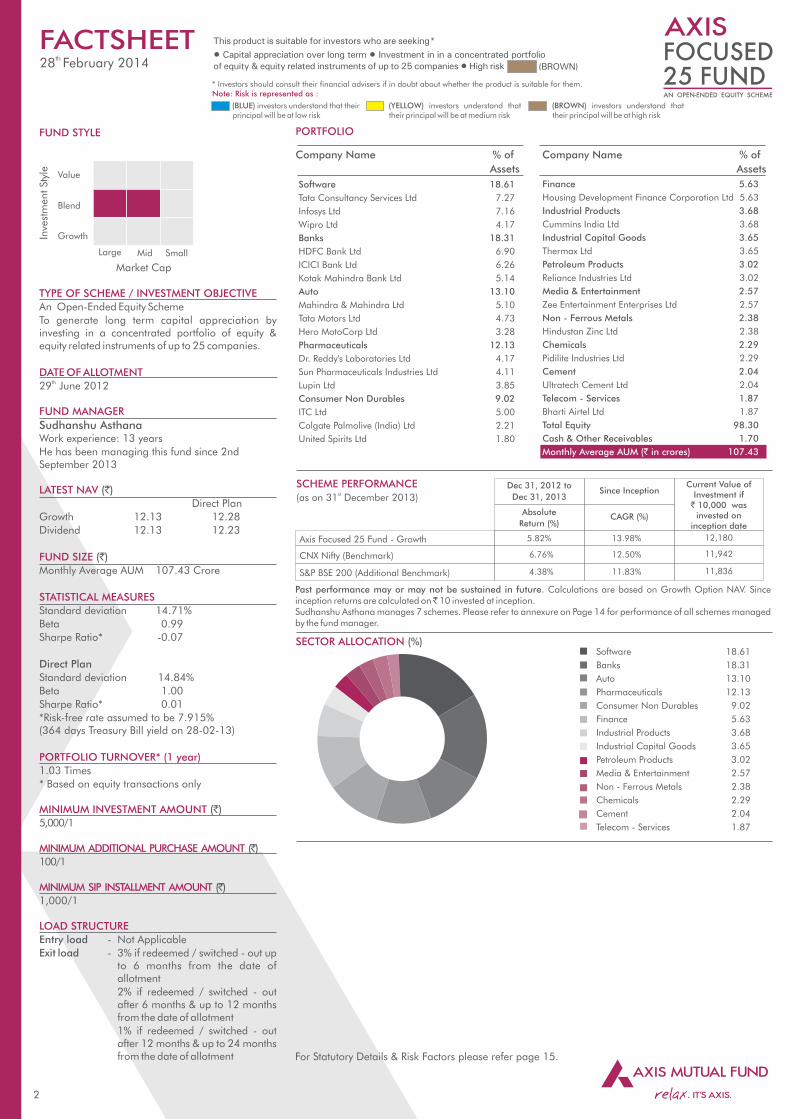
Software 18.61
Banks 18.31
Auto 13.10
Pharmaceuticals 12.13
Consumer Non Durables 9.02
Finance 5.63
Industrial Products 3.68
Industrial Capital Goods 3.65
Petroleum Products 3.02
Media & Entertainment 2.57
Non - Ferrous Metals 2.38
Chemicals 2.29
Cement 2.04
Telecom - Services 1.87
For Statutory Details & Risk Factors please refer page 15.
Past performance may or may not be sustained in future. Calculations are based on Growth Option NAV. Since inception returns are calculated on ̀ 10 invested at inception.Sudhanshu Asthana manages 7 schemes. Please refer to annexure on Page 14 for performance of all schemes managed by the fund manager.
SCHEME PERFORMANCE st(as on 31 December 2013)
Axis Focused 25 Fund - Growth
CNX Nifty (Benchmark)
5.82%
Absolute
Return (%)CAGR (%)
Since Inception
13.98%
Dec 31, 2012 to
Dec 31, 2013
Current Value of Investment if
` 10,000 wasinvested on
inception date
12,180
6.76% 11,94212.50%
S&P BSE 200 (Additional Benchmark) 4.38% 11,83611.83%
This product is suitable for investors who are seeking*
Capital appreciation over to long term
Investment in a concentrated portfolio of equity & equity related instruments of up to 25 companies
High risk (BROWN)
* Investors should consult their financial advisers if in doubt about whether the product is suitable for them.Note: Risk is represented as :
(BLUE) investors understand that their principal will be at low risk
(YELLOW) investors understand that their principal will be at medium risk
(BROWN) investors understand that their principal will be at high risk
PORTFOLIO
SECTOR ALLOCATION (%)
Past performance may or may not be sustained in future. Calculations are based on Growth Option NAV. Since inception returns are calculated on ̀ 10 invested at inception.Jinesh Gopani manages 8 schemes. Please refer to annexure on Page 14 for performance of all schemes managed by the fund manager.
SCHEME PERFORMANCE st(as on 31 December 2013)
Banks 14.28
HDFC Bank Ltd 6.59
Kotak Mahindra Bank Ltd 5.56
ICICI Bank Ltd 2.13
Pharmaceuticals 12.16
Sun Pharmaceuticals Industries Ltd 4.23
Divi's Laboratories Ltd 3.86
Cadila Healthcare Ltd 2.45
Sanofi India Ltd 0.83
TTK HEALTHCARE LIMITED 0.80
Software 12.11
Tata Consultancy Services Ltd 6.02
Tech Mahindra Ltd 3.14
Persistent Systems Ltd 2.95
Finance 11.88
Housing Development Finance Corporation Ltd 5.46
Gruh Finance Ltd 2.32
Bajaj Finance Ltd 1.44
Mahindra & Mahindra Financial Services Ltd 1.34
Sundaram Finance Ltd 1.32
Consumer Durables 7.27
Symphony Ltd 2.69
Bata India Ltd 2.50
TTK Prestige Ltd 2.07
Consumer Non Durables 6.89
ITC Ltd 5.29
Asian Paints Ltd 1.60
Construction Project 6.80
Larsen & Toubro Ltd 6.80
Auto 6.77
Eicher Motors Ltd 3.23
Mahindra & Mahindra Ltd 1.33
Maruti Suzuki India Ltd 1.25
Tata Motors Ltd 0.96
Industrial Products 4.04
Cummins India Ltd 3.46
Astral Poly Technik Ltd 0.57
Auto Ancillaries 3.73
Motherson Sumi Systems Ltd 2.57
Wabco India Ltd 1.16
Pesticides 3.23
PI Industries Ltd 3.23
Transportation 2.63
Gujarat Pipavav Port Ltd 2.63
Textile Products 1.36
Page Industries Ltd 1.36
Industrial Capital Goods 1.27
AIA Engineering Ltd 1.27
Power 0.73
Torrent Power Ltd 0.73
Hotels 0.53
Speciality Restaurants Ltd 0.53
Other Equity (less than 0.50% of the corpus) 0.24
Total Equity 95.91
Debt, Cash & Other Receivables 4.09
Monthly Average AUM (` in crores) 892.27
Company Name % of
Assets
Company Name % of
Assets
Please note that after the payment of dividend, the NAV falls to the extent of dividend, distribution tax and cess wherever applicable.Past performance may or may not be sustained in future. Face Value of units is 10`Dividends disclosed above are since the inception of the fund.
DIVIDENDS
January 6, 2014 1.00 1.00 14.6918
August 7, 2012 0.80 0.80 12.1041
August 31, 2010 1.00 1.00 11.9703
Record Date NAV per unit (Cum Dividend) Individuals/ HUF
Dividend ( Per unit)`
OthersOption
RegularDividend
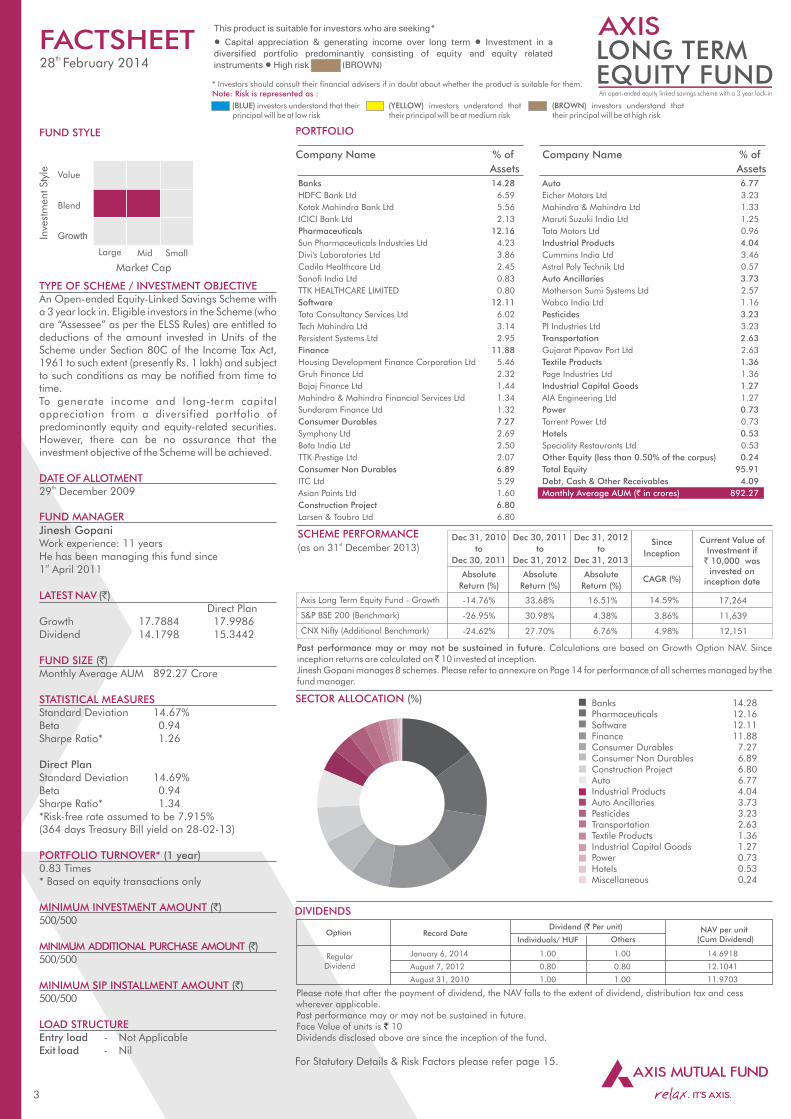
Banks 14.28Pharmaceuticals 12.16Software 12.11Finance 11.88Consumer Durables 7.27Consumer Non Durables 6.89Construction Project 6.80Auto 6.77Industrial Products 4.04Auto Ancillaries 3.73Pesticides 3.23Transportation 2.63Textile Products 1.36Industrial Capital Goods 1.27Power 0.73Hotels 0.53Miscellaneous 0.24
FUND STYLE
TYPE OF SCHEME / INVESTMENT OBJECTIVE An Open-ended Equity-Linked Savings Scheme with a 3 year lock in. Eligible investors in the Scheme (who are “Assessee” as per the ELSS Rules) are entitled to deductions of the amount invested in Units of the Scheme under Section 80C of the Income Tax Act, 1961 to such extent (presently Rs. 1 lakh) and subject to such conditions as may be notified from time to time.To generate income and long-term capital appreciation from a diversified portfolio of predominantly equity and equity-related securities. However, there can be no assurance that the investment objective of the Scheme will be achieved.
DATE OF ALLOTMENTth29 December 2009
FUND MANAGER
Jinesh Gopani Work experience: 11 yearsHe has been managing this fund since
st1 April 2011
LATEST NAV (`) Direct PlanGrowth 17.7884 17.9986Dividend 14.1798 15.3442
FUND SIZE (`)Monthly Average AUM 892.27 Crore
STATISTICAL MEASURESStandard Deviation 14.67%Beta 0.94Sharpe Ratio* 1.26
Direct PlanStandard Deviation 14.69%Beta 0.94Sharpe Ratio* 1.34*Risk-free rate assumed to be 7.915% (364 days Treasury Bill yield on 28-02-13)
PORTFOLIO TURNOVER* (1 year) 0.83 Times* Based on equity transactions only
MINIMUM INVESTMENT AMOUNT (`)500/500
MINIMUM ADDITIONAL PURCHASE AMOUNT (̀ )500/500
MINIMUM SIP INSTALLMENT AMOUNT (`)500/500
LOAD STRUCTUREEntry load - Not ApplicableExit load - Nil
Value
Blend
GrowthInve
stm
ent Sty
le
Market Cap
Large Mid Small
FACTSHEET
Axis Long Term Equity Fund - Growth
S&P BSE 200 (Benchmark)
CNX Nifty (Additional Benchmark)
Absolute
Return (%)CAGR (%)
Since
Inception
-14.76%
-26.95%
-24.62%
Absolute
Return (%)
33.68%
30.98%
27.70%
Absolute
Return (%)
16.51%
4.38%
6.76%
14.59%
3.86%
4.98%
Dec 31, 2010
to
Dec 30, 2011
Current Value of Investment if
` 10,000 wasinvested on
inception date
17,264
11,639
12,151
Dec 30, 2011
to
Dec 31, 2012
Dec 31, 2012
to
Dec 31, 2013
For Statutory Details & Risk Factors please refer page 15.
th 28 February 2014
This product is suitable for investors who are seeking*
Capital appreciation & generating income over to long term
Investment in a diversified portfolio predominantly consisting of equity and equity related instruments
High risk (BROWN)
3
* Investors should consult their financial advisers if in doubt about whether the product is suitable for them.Note: Risk is represented as :
(BLUE) investors understand that their principal will be at low risk
(YELLOW) investors understand that their principal will be at medium risk
(BROWN) investors understand that their principal will be at high risk
4
PORTFOLIO
Banks 12.03ING Vysya Bank Ltd 3.96The Federal Bank Ltd 3.70Allahabad Bank 2.06Oriental Bank of Commerce 1.73Union Bank of India 0.56 Software 8.63CMC Ltd 5.29Persistent Systems Ltd 3.34 Finance 8.33ICRA Ltd 3.31Sundaram Finance Ltd 1.92CRISIL Ltd 1.36Dewan Housing Finance Corporation Ltd 1.10Motilal Oswal Financial Services Ltd 0.63 Pharmaceuticals 7.55Wyeth Ltd 2.62Torrent Pharmaceuticals Ltd 2.61Sanofi India Ltd 1.28IPCA Laboratories Ltd 1.04 Auto 6.69Eicher Motors Ltd 2.94VST Tillers Tractors Ltd 2.81SML Isuzu Ltd 0.94 Auto Ancillaries 5.12Amara Raja Batteries Ltd 2.32MRF Ltd 1.50Exide Industries Ltd 1.30 Gas 4.63Indraprastha Gas Ltd 2.47Gujarat State Petronet Ltd 2.16 Consumer Non Durables 4.35Agro Tech Foods Ltd 2.44Zydus Wellness Ltd 1.91 Transportation 4.29Gujarat Pipavav Port Ltd 2.65Gateway Distriparks Ltd 1.63 Media & Entertainment 4.01D.B.Corp Ltd 2.52Entertainment Network (India) Ltd 1.48
Pesticides 4.00UPL Limited 1.79Rallis India Ltd 1.46PI Industries Ltd 0.75 Construction Project 3.81Voltas Ltd 1.57Engineers India Ltd 1.17Sadbhav Engineering Ltd 1.07 Industrial Capital Goods 3.53Thermax Ltd 2.11ABB India Ltd 0.79Alstom T&D India Ltd 0.63 Consumer Durables 2.79Blue Star Ltd 1.22Bata India Ltd 1.00Whirlpool of India Ltd 0.57 Cement 2.74Century Textiles & Industries Ltd 1.51Jk Lakshmi Cement Ltd 1.23 Petroleum Products 2.49Hindustan Petroleum Corporation Ltd 2.49 Power 1.90Torrent Power Ltd 1.90 Chemicals 1.88Pidilite Industries Ltd 1.88 Construction 1.73Sobha Developers Ltd 1.73 Oil 1.07Oil India Ltd 1.07 Services 0.98Aditya Birla Nuvo Ltd 0.98 Textile Products 0.80Kewal Kiran Clothing Limited 0.80 Diversified Consumer Services 0.80MT Educare Ltd 0.80 Other Equity (less than 0.50% of the corpus) 0.42 Total Equity 94.56 Cash & Other Receivables 5.44Monthly Average AUM (` in crores) 248.80
Company Name % of
Assets
Company Name % of
Assets
SECTOR ALLOCATION (%)
Past performance may or may not be sustained in future. Calculations are based on Growth Option NAV. Since inception returns are calculated on ̀ 10 invested at inception. Pankaj Murarka manages 3 schemes. Please refer to annexure on Page 14 for performance of all schemes managed by the fund manager.
SCHEME PERFORMANCE st(as on 31 December 2013)
S&P BSE Midcap (Benchmark)
CNX Nifty (Additional Benchmark)
Axis Midcap Fund - Growth
CAGR (%)
38.52%
27.70%
52.60% 12.64%
0.23%
5.15% 11,548
10,066
14,070
Since
Inception
Absolute
Return (%)
Dec 30, 2011 to
Dec 31, 2012
Current Value of Investment if
` 10,000 wasinvested on
inception date
FUND STYLE
TYPE OF SCHEME / INVESTMENT OBJECTIVE An Open-Ended Equity SchemeTo achieve long term capital appreciation by investing predominantly in equity & equity related instruments of mid size companies. The focus of the fund would be to invest in relatively larger companies within this category.
DATE OF ALLOTMENTth18 February 2011
FUND MANAGER Pankaj Murarka Work experience: 14 yearsHe has been managing this fund since inception.
LATEST NAV (`) Direct PlanGrowth 13.68 13.82Dividend 13.66 13.81
FUND SIZE (`)Monthly Average AUM 248.80 Crore
STATISTICAL MEASURESStandard Deviation 18.84%Beta 0.97Sharpe Ratio* 0.08
Direct PlanStandard Deviation 18.81%Beta 0.97Sharpe Ratio* 0.13*Risk-free rate assumed to be 7.915%(364 days Treasury Bill yield on 28-02-13)
PORTFOLIO TURNOVER* (1 year) 0.49 Times* Based on equity transactions only
MINIMUM INVESTMENT AMOUNT (`)5,000/1
MINIMUM ADDITIONAL PURCHASE AMOUNT (̀ )100/1
MINIMUM SIP INSTALLMENT AMOUNT (`)1,000/1
LOAD STRUCTUREEntry load - Not ApplicableExit load - 3% if redeemed / switched - out up to 6 months from the date of allotment 2% if redeemed / switched - out after 6 months & up to 12 months from the date of allotment 1% if redeemed / switched - out after 12 months & up to 24 months from the date of allotment
Value
Blend
GrowthInve
stm
ent Sty
le
Market Cap
Large Mid Small
FACTSHEET
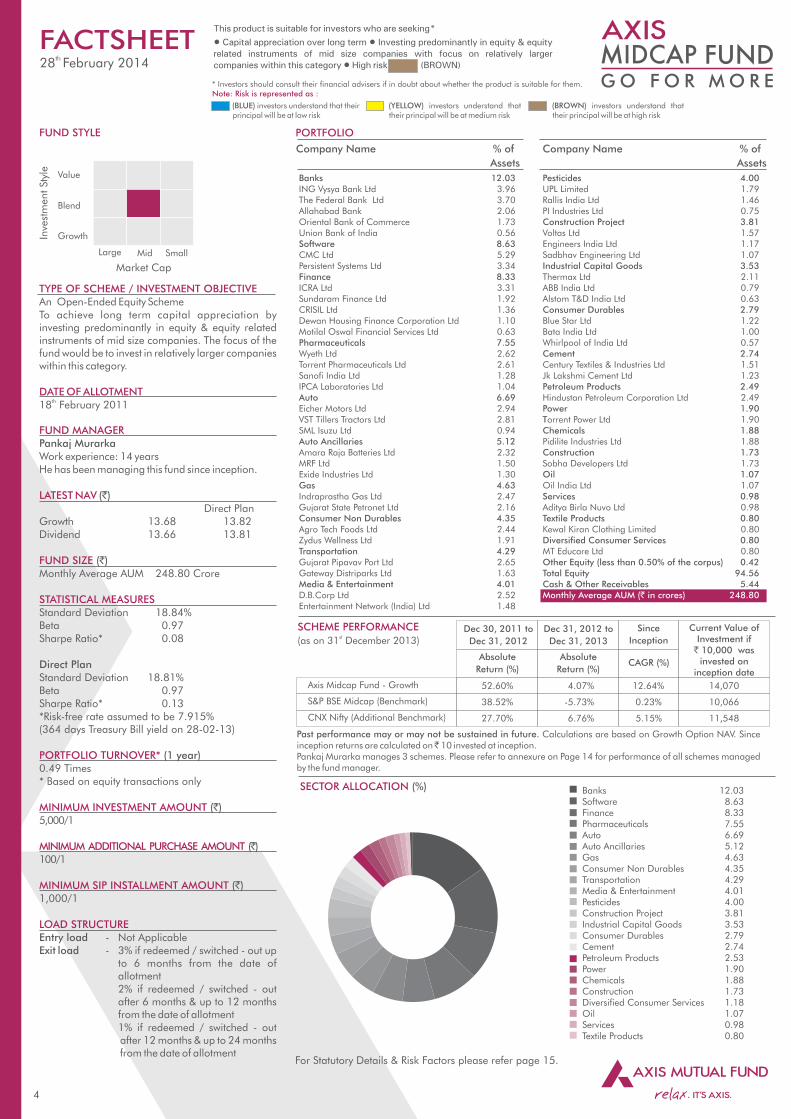
Banks 12.03Software 8.63Finance 8.33Pharmaceuticals 7.55Auto 6.69Auto Ancillaries 5.12Gas 4.63Consumer Non Durables 4.35Transportation 4.29Media & Entertainment 4.01Pesticides 4.00Construction Project 3.81Industrial Capital Goods 3.53Consumer Durables 2.79Cement 2.74Petroleum Products 2.53Power 1.90Chemicals 1.88Construction 1.73Diversified Consumer Services 1.18Oil 1.07Services 0.98Textile Products 0.80
For Statutory Details & Risk Factors please refer page 15.
Dec 31, 2012 to
Dec 31, 2013
Absolute
Return (%)
-5.73%
6.76%
4.07%
th 28 February 2014
This product is suitable for investors who are seeking*
Capital appreciation over to long term
Investment predominantly in equity and equity related instruments of mid size companies with focus in relatively larger companies within this category
High risk (BROWN)
* Investors should consult their financial advisers if in doubt about whether the product is suitable for them.Note: Risk is represented as :
(BLUE) investors understand that their principal will be at low risk
(YELLOW) investors understand that their principal will be at medium risk
(BROWN) investors understand that their principal will be at high risk
5
Please note that after the payment of dividend, the NAV falls to the extent of dividend, distribution tax and cess wherever applicable. Past performance may or may not be sustained in future. Face Value of units is 10. Dividends disclosed above `are since the inception of the fund. @ Based on debt portfolio only.
* For instruments with put/call option, the put/call date has been taken as the maturity date.& The yield to maturity given above is based on the portfolio of funds as on date given above. This should not be taken as an
indication of the returns that maybe generated by the fund and the securities bought by the fund may or may not be held till their respective maturities. The calculation is based on the invested corpus of the debt portfolio.
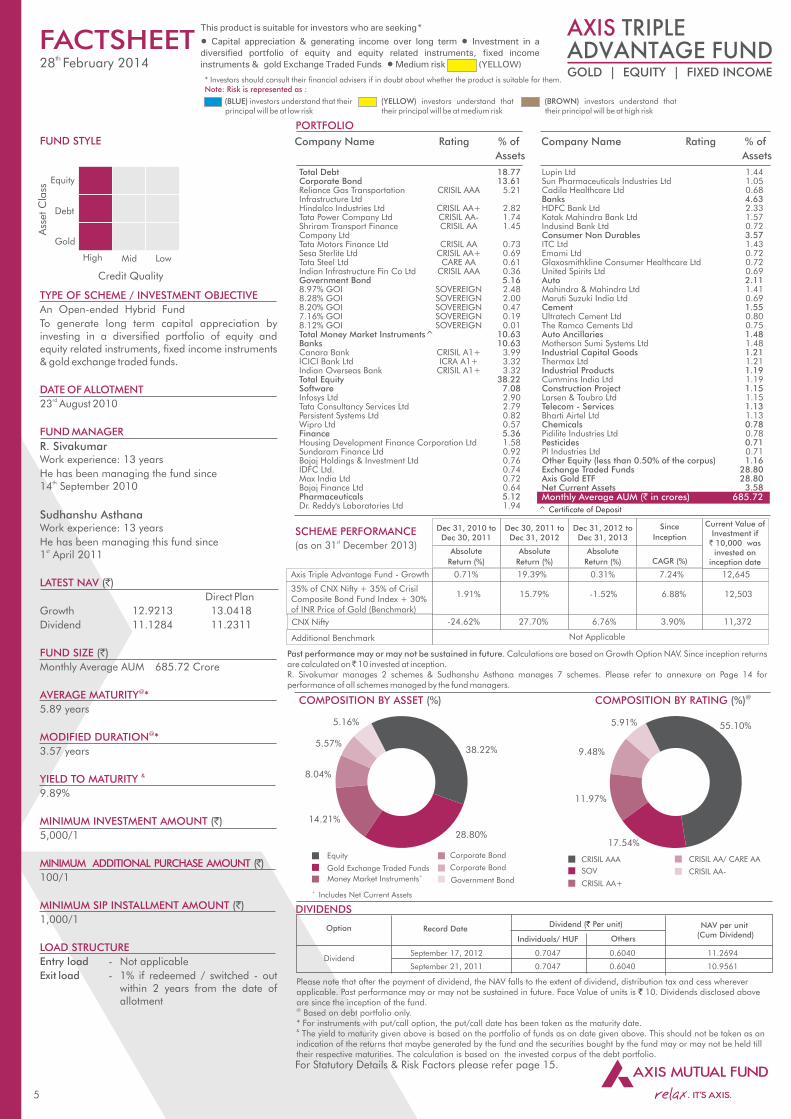
Total Debt 18.77 Corporate Bond 13.61Reliance Gas Transportation CRISIL AAA 5.21Infrastructure LtdHindalco Industries Ltd CRISIL AA+ 2.82Tata Power Company Ltd CRISIL AA- 1.74Shriram Transport Finance CRISIL AA 1.45Company Ltd Tata Motors Finance Ltd CRISIL AA 0.73Sesa Sterlite Ltd CRISIL AA+ 0.69Tata Steel Ltd CARE AA 0.61Indian Infrastructure Fin Co Ltd CRISIL AAA 0.36 Government Bond 5.168.97% GOI SOVEREIGN 2.488.28% GOI SOVEREIGN 2.008.20% GOI SOVEREIGN 0.477.16% GOI SOVEREIGN 0.198.12% GOI SOVEREIGN 0.01 Total Money Market Instruments^ 10.63 Banks 10.63Canara Bank CRISIL A1+ 3.99ICICI Bank Ltd ICRA A1+ 3.32Indian Overseas Bank CRISIL A1+ 3.32 Total Equity 38.22 Software 7.08Infosys Ltd 2.90Tata Consultancy Services Ltd 2.79Persistent Systems Ltd 0.82Wipro Ltd 0.57 Finance 5.36Housing Development Finance Corporation Ltd 1.58Sundaram Finance Ltd 0.92Bajaj Holdings & Investment Ltd 0.76IDFC Ltd. 0.74Max India Ltd 0.72Bajaj Finance Ltd 0.64 Pharmaceuticals 5.12Dr. Reddy's Laboratories Ltd 1.94
PORTFOLIO
Company Name Rating % of
Assets
Company Name Rating % of
Assets
Past performance may or may not be sustained in future. Calculations are based on Growth Option NAV. Since inception returns are calculated on ̀ 10 invested at inception.R. Sivakumar manages 2 schemes & Sudhanshu Asthana manages 7 schemes. Please refer to annexure on Page 14 for performance of all schemes managed by the fund managers.
Lupin Ltd 1.44Sun Pharmaceuticals Industries Ltd 1.05Cadila Healthcare Ltd 0.68 Banks 4.63HDFC Bank Ltd 2.33Kotak Mahindra Bank Ltd 1.57Indusind Bank Ltd 0.72 Consumer Non Durables 3.57ITC Ltd 1.43Emami Ltd 0.72Glaxosmithkline Consumer Healthcare Ltd 0.72United Spirits Ltd 0.69 Auto 2.11Mahindra & Mahindra Ltd 1.41Maruti Suzuki India Ltd 0.69 Cement 1.55Ultratech Cement Ltd 0.80The Ramco Cements Ltd 0.75 Auto Ancillaries 1.48Motherson Sumi Systems Ltd 1.48 Industrial Capital Goods 1.21Thermax Ltd 1.21 Industrial Products 1.19Cummins India Ltd 1.19 Construction Project 1.15Larsen & Toubro Ltd 1.15 Telecom - Services 1.13Bharti Airtel Ltd 1.13 Chemicals 0.78Pidilite Industries Ltd 0.78 Pesticides 0.71PI Industries Ltd 0.71 Other Equity (less than 0.50% of the corpus) 1.16 Exchange Traded Funds 28.80Axis Gold ETF 28.80 Net Current Assets 3.58Monthly Average AUM (` in crores) 685.72
SCHEME PERFORMANCE st
(as on 31 December 2013)
Axis Triple Advantage Fund - Growth
CNX Nifty
Additional Benchmark
35% of CNX Nifty + 35% of Crisil Composite Bond Fund Index + 30% of INR Price of Gold (Benchmark)
DIVIDENDS
September 17, 2012 0.7047 0.6040 11.2694
September 21, 2011 0.7047 0.6040 10.9561
Record Date NAV per unit (Cum Dividend)
Individuals/ HUF
Dividend ( Per unit)`
Others
Option
Dividend
0.71%
-24.62%
Not Applicable
Absolute
Return (%)
Dec 31, 2010 to Dec 30, 2011
1.91%
Equity
Debt
Gold
Ass
et C
lass
Credit Quality
High Mid Low
FUND STYLE
TYPE OF SCHEME / INVESTMENT OBJECTIVE
An Open-ended Hybrid Fund
To generate long term capital appreciation by investing in a diversified portfolio of equity and equity related instruments, fixed income instruments & gold exchange traded funds.
DATE OF ALLOTMENTrd23 August 2010
FUND MANAGER
R. SivakumarWork experience: 13 years
He has been managing the fund since th14 September 2010
Sudhanshu AsthanaWork experience: 13 years
He has been managing this fund since st1 April 2011
LATEST NAV (`)
Direct Plan
Growth 12.9213 13.0418
Dividend 11.1284 11.2311
FUND SIZE (`)
Monthly Average AUM 685.72 Crore
@AVERAGE MATURITY *
5.89 years
@MODIFIED DURATION *
3.57 years
&YIELD TO MATURITY
9.89%
MINIMUM INVESTMENT AMOUNT (`)
5,000/1
MINIMUM ADDITIONAL PURCHASE AMOUNT (̀ )
100/1
MINIMUM SIP INSTALLMENT AMOUNT (`)
1,000/1
LOAD STRUCTURE
Entry load - Not applicable
Exit load - 1% if redeemed / switched - out within 2 years from the date of allotment
FACTSHEET
For Statutory Details & Risk Factors please refer page 15.
COMPOSITION BY ASSET (%)
28.80%
COMPOSITION BY RATING @(%)
38.22%
Equity
Gold Exchange Traded FundsCRISIL AAA
SOV+Money Market Instruments Government Bond
55.10%
9.48%
CRISIL AA/ CARE AA
5.91%
CRISIL AA+
14.21%
5.16%
11.97%
Corporate Bond
CRISIL AA-
+ Includes Net Current Assets
5.57%
19.39%
27.70%
Absolute
Return (%)
Dec 30, 2011 to Dec 31, 2012
15.79%
0.31%
6.76%
Absolute
Return (%)
Dec 31, 2012 to Dec 31, 2013
-1.52%
CAGR (%)
Since
Inception
Current Value of Investment if
` 10,000 wasinvested on
inception date
7.24%
3.90%
6.88%
12,645
11,372
12,503
th 28 February 2014
17.54%
^ Certificate of Deposit
8.04%
Corporate Bond
* Investors should consult their financial advisers if in doubt about whether the product is suitable for them.Note: Risk is represented as :
(BLUE) investors understand that their principal will be at low risk
(YELLOW) investors understand that their principal will be at medium risk
(BROWN) investors understand that their principal will be at high risk
6
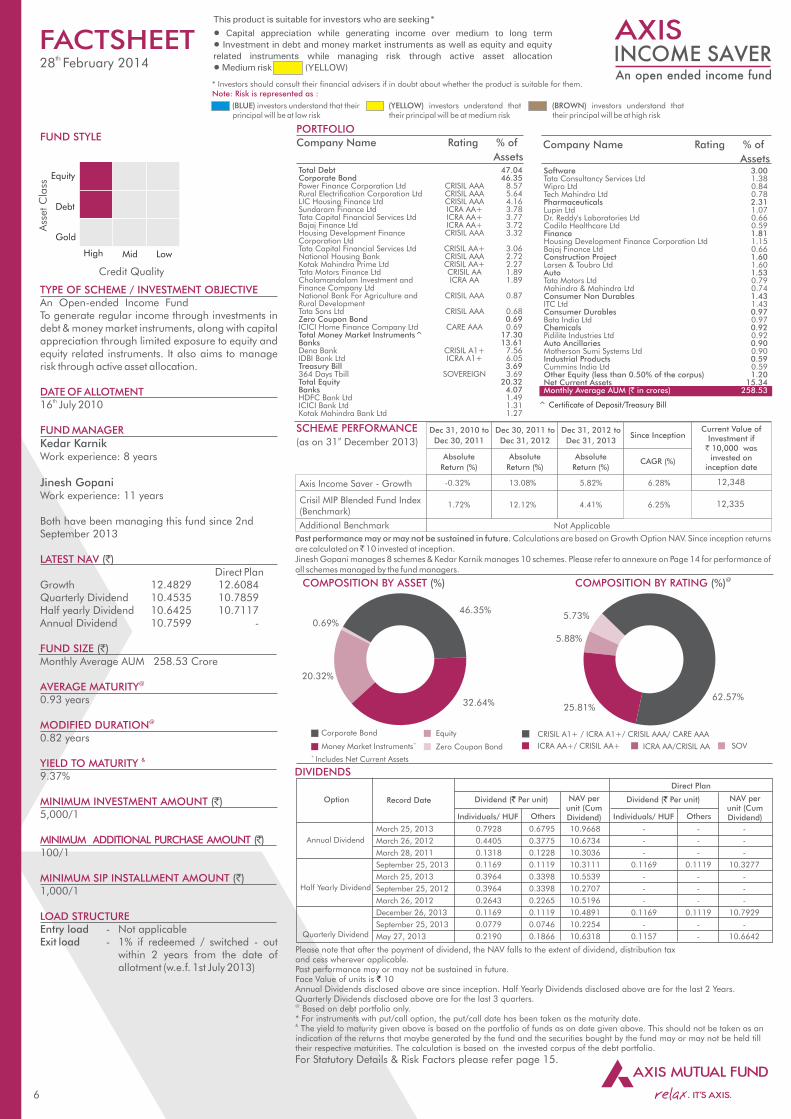
Total Debt 47.04 Corporate Bond 46.35Power Finance Corporation Ltd CRISIL AAA 8.57Rural Electrification Corporation Ltd CRISIL AAA 5.64LIC Housing Finance Ltd CRISIL AAA 4.16Sundaram Finance Ltd ICRA AA+ 3.78Tata Capital Financial Services Ltd ICRA AA+ 3.77Bajaj Finance Ltd ICRA AA+ 3.72Housing Development Finance CRISIL AAA 3.32Corporation Ltd Tata Capital Financial Services Ltd CRISIL AA+ 3.06National Housing Bank CRISIL AAA 2.72Kotak Mahindra Prime Ltd CRISIL AA+ 2.27Tata Motors Finance Ltd CRISIL AA 1.89Cholamandalam Investment and ICRA AA 1.89Finance Company LtdNational Bank For Agriculture and CRISIL AAA 0.87Rural Development Tata Sons Ltd CRISIL AAA 0.68 Zero Coupon Bond 0.69ICICI Home Finance Company Ltd CARE AAA 0.69 Total Money Market Instruments^ 17.30 Banks 13.61Dena Bank CRISIL A1+ 7.56IDBI Bank Ltd ICRA A1+ 6.05 Treasury Bill 3.69364 Days Tbill SOVEREIGN 3.69 Total Equity 20.32 Banks 4.07HDFC Bank Ltd 1.49ICICI Bank Ltd 1.31Kotak Mahindra Bank Ltd 1.27
COMPOSITION BY ASSET (%)
EquityCorporate Bond
PORTFOLIO
Company Name Rating % of
Assets
Company Name Rating % of
Assets
Past performance may or may not be sustained in future. Calculations are based on Growth Option NAV. Since inception returns are calculated on ̀ 10 invested at inception.Jinesh Gopani manages 8 schemes & Kedar Karnik manages 10 schemes. Please refer to annexure on Page 14 for performance of all schemes managed by the fund managers.
Software 3.00Tata Consultancy Services Ltd 1.38Wipro Ltd 0.84Tech Mahindra Ltd 0.78 Pharmaceuticals 2.31Lupin Ltd 1.07Dr. Reddy's Laboratories Ltd 0.66Cadila Healthcare Ltd 0.59 Finance 1.81Housing Development Finance Corporation Ltd 1.15Bajaj Finance Ltd 0.66 Construction Project 1.60Larsen & Toubro Ltd 1.60 Auto 1.53Tata Motors Ltd 0.79Mahindra & Mahindra Ltd 0.74 Consumer Non Durables 1.43ITC Ltd 1.43 Consumer Durables 0.97Bata India Ltd 0.97 Chemicals 0.92Pidilite Industries Ltd 0.92 Auto Ancillaries 0.90Motherson Sumi Systems Ltd 0.90 Industrial Products 0.59Cummins India Ltd 0.59 Other Equity (less than 0.50% of the corpus) 1.20 Net Current Assets 15.34Monthly Average AUM (` in crores) 258.53
Please note that after the payment of dividend, the NAV falls to the extent of dividend, distribution taxand cess wherever applicable.Past performance may or may not be sustained in future.Face Value of units is 10`Annual Dividends disclosed above are since inception. Half Yearly Dividends disclosed above are for the last 2 Years. Quarterly Dividends disclosed above are for the last 3 quarters.@ Based on debt portfolio only.* For instruments with put/call option, the put/call date has been taken as the maturity date.& The yield to maturity given above is based on the portfolio of funds as on date given above. This should not be taken as an indication of the returns that maybe generated by the fund and the securities bought by the fund may or may not be held till their respective maturities. The calculation is based on the invested corpus of the debt portfolio.
DIVIDENDS
+Money Market Instruments
32.64%
46.35%
0.69%
COMPOSITION BY RATING @(%)
62.57%
March 25, 2013 0.7928 0.6795 10.9668 - - -
March 26, 2012 0.4405 0.3775 10.6734 - - -
March 28, 2011 0.1318 0.1228 10.3036 - - -
September 25, 2013 0.1169 0.1119 10.3111 0.1169 0.1119 10.3277
March 25, 2013 0.3964 0.3398 10.5539 - - -
September 25, 2012 0.3964 0.3398 10.2707 - - -
March 26, 2012 0.2643 0.2265 10.5196 - - -
December 26, 2013 0.1169 0.1119 10.4891 0.1169 0.1119 10.7929
September 25, 2013 0.0779 0.0746 10.2254 - - -
May 27, 2013 0.2190 0.1866 10.6318 0.1157 - 10.6642
Record Date NAV per unit (Cum Dividend) Individuals/ HUF
Dividend ( Per unit)`
Others
Annual Dividend
Option
Half Yearly Dividend
Quarterly Dividend
ICRA AA+/ CRISIL AA+
CRISIL A1+ / ICRA A1+/ CRISIL AAA/ CARE AAA
SCHEME PERFORMANCE st(as on 31 December 2013)
25.81%
5.73%
ICRA AA/CRISIL AA
20.32%
Zero Coupon Bond
Axis Income Saver - Growth
Crisil MIP Blended Fund Index(Benchmark)
Additional Benchmark
-0.32%
Not Applicable
Absolute
Return (%)CAGR (%)
Since InceptionDec 31, 2010 to
Dec 30, 2011
Current Value of Investment if
` 10,000 wasinvested on
inception date
12,348
1.72% 12,335
Equity
Debt
Gold
Ass
et C
lass
Credit Quality
High Mid Low
FUND STYLE
TYPE OF SCHEME / INVESTMENT OBJECTIVE An Open-ended Income FundTo generate regular income through investments in debt & money market instruments, along with capital appreciation through limited exposure to equity and equity related instruments. It also aims to manage risk through active asset allocation.
DATE OF ALLOTMENTth16 July 2010
FUND MANAGER
Kedar KarnikWork experience: 8 years
Jinesh GopaniWork experience: 11 years
Both have been managing this fund since 2nd September 2013
LATEST NAV (`) Direct PlanGrowth 12.4829 12.6084Quarterly Dividend 10.4535 10.7859Half yearly Dividend 10.6425 10.7117Annual Dividend 10.7599 -
FUND SIZE (`)Monthly Average AUM 258.53 Crore
@AVERAGE MATURITY0.93 years
@MODIFIED DURATION0.82 years
&YIELD TO MATURITY 9.37%
MINIMUM INVESTMENT AMOUNT (`)5,000/1
MINIMUM ADDITIONAL PURCHASE AMOUNT (̀ )100/1
MINIMUM SIP INSTALLMENT AMOUNT (`)1,000/1
LOAD STRUCTUREEntry load - Not applicableExit load - 1% if redeemed / switched - out within 2 years from the date of allotment (w.e.f. 1st July 2013)
FACTSHEET
For Statutory Details & Risk Factors please refer page 15.
^ Certificate of Deposit/Treasury Bill
+ Includes Net Current Assets
NAV per unit (Cum Dividend) Individuals/ HUF Others
Dividend ( Per unit)`
Direct Plan
5.88%
13.08%
Absolute
Return (%)
Dec 30, 2011 to
Dec 31, 2012
12.12%
5.82%
Absolute
Return (%)
Dec 31, 2012 to
Dec 31, 2013
4.41%
6.28%
6.25%
th 28 February 2014
SOV
* Investors should consult their financial advisers if in doubt about whether the product is suitable for them.Note: Risk is represented as :
(BLUE) investors understand that their principal will be at low risk
(YELLOW) investors understand that their principal will be at medium risk
(BROWN) investors understand that their principal will be at high risk
7
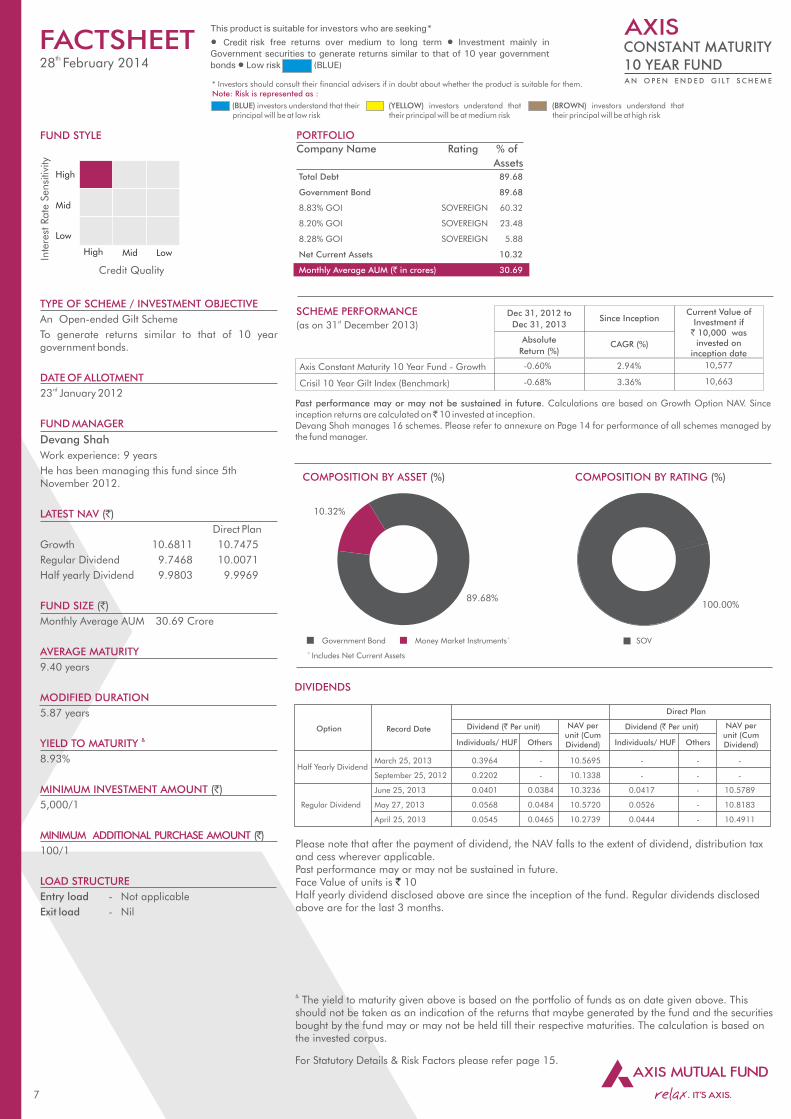
COMPOSITION BY ASSET (%) COMPOSITION BY RATING (%)
PORTFOLIO
Company Name Rating % of
Assets
SOV
100.00%89.68%
10.32%
Government Bond+Money Market Instruments
DIVIDENDS
Please note that after the payment of dividend, the NAV falls to the extent of dividend, distribution taxand cess wherever applicable.Past performance may or may not be sustained in future.Face Value of units is 10`Half yearly dividend disclosed above are since the inception of the fund. Regular dividends disclosed above are for the last 3 months.
Record Date NAV per unit (Cum Dividend) Individuals/ HUF
Dividend (` Per unit)
Others
Regular Dividend
Option
Half Yearly DividendMarch 25, 2013 0.3964 - 10.5695 - - -
September 25, 2012 0.2202 - 10.1338 - - -
June 25, 2013 0.0401 0.0384 10.3236 0.0417 - 10.5789
May 27, 2013 0.0568 0.0484 10.5720 0.0526 - 10.8183
April 25, 2013 0.0545 0.0465 10.2739 0.0444 - 10.4911
FUND STYLE
TYPE OF SCHEME / INVESTMENT OBJECTIVE
An Open-ended Gilt Scheme
To generate returns similar to that of 10 year government bonds.
DATE OF ALLOTMENTrd23 January 2012
FUND MANAGER
Devang Shah
Work experience: 9 years
He has been managing this fund since 5th November 2012.
LATEST NAV (`)
Direct Plan
Growth 10.6811 10.7475
Regular Dividend 9.7468 10.0071
Half yearly Dividend 9.9803 9.9969
FUND SIZE (`)
Monthly Average AUM 30.69 Crore
AVERAGE MATURITY
9.40 years
MODIFIED DURATION
5.87 years
&YIELD TO MATURITY
8.93%
MINIMUM INVESTMENT AMOUNT (`)
5,000/1
MINIMUM ADDITIONAL PURCHASE AMOUNT (̀ )
100/1
LOAD STRUCTURE
Entry load - Not applicable
Exit load - Nil
High
Mid
Low
Inte
rest
Rate
Sensi
tivi
ty
Credit Quality
High Mid Low
FACTSHEET
Total Debt 89.68
Government Bond 89.68
8.83% GOI SOVEREIGN 60.32
8.20% GOI SOVEREIGN 23.48
8.28% GOI SOVEREIGN 5.88
Net Current Assets 10.32
Monthly Average AUM (` in crores) 30.69
For Statutory Details & Risk Factors please refer page 15.
& The yield to maturity given above is based on the portfolio of funds as on date given above. This should not be taken as an indication of the returns that maybe generated by the fund and the securities bought by the fund may or may not be held till their respective maturities. The calculation is based on the invested corpus.
+ Includes Net Current Assets
NAV per unit (Cum Dividend) Individuals/ HUF
Dividend (` Per unit)
Others
Direct Plan
Past performance may or may not be sustained in future. Calculations are based on Growth Option NAV. Since inception returns are calculated on ̀ 10 invested at inception.Devang Shah manages 16 schemes. Please refer to annexure on Page 14 for performance of all schemes managed by the fund manager.
SCHEME PERFORMANCE st(as on 31 December 2013)
Axis Constant Maturity 10 Year Fund - Growth
Crisil 10 Year Gilt Index (Benchmark)
-0.60%
Absolute
Return (%)CAGR (%)
Since Inception
2.94%
Dec 31, 2012 to
Dec 31, 2013
Current Value of Investment if
` 10,000 wasinvested on
inception date
10,577
-0.68% 10,6633.36%
th 28 February 2014
* Investors should consult their financial advisers if in doubt about whether the product is suitable for them.Note: Risk is represented as :
(BLUE) investors understand that their principal will be at low risk
(YELLOW) investors understand that their principal will be at medium risk
(BROWN) investors understand that their principal will be at high risk
8
PORTFOLIO
Company Name Rating % of
Assets
Company Name Rating % of
Assets
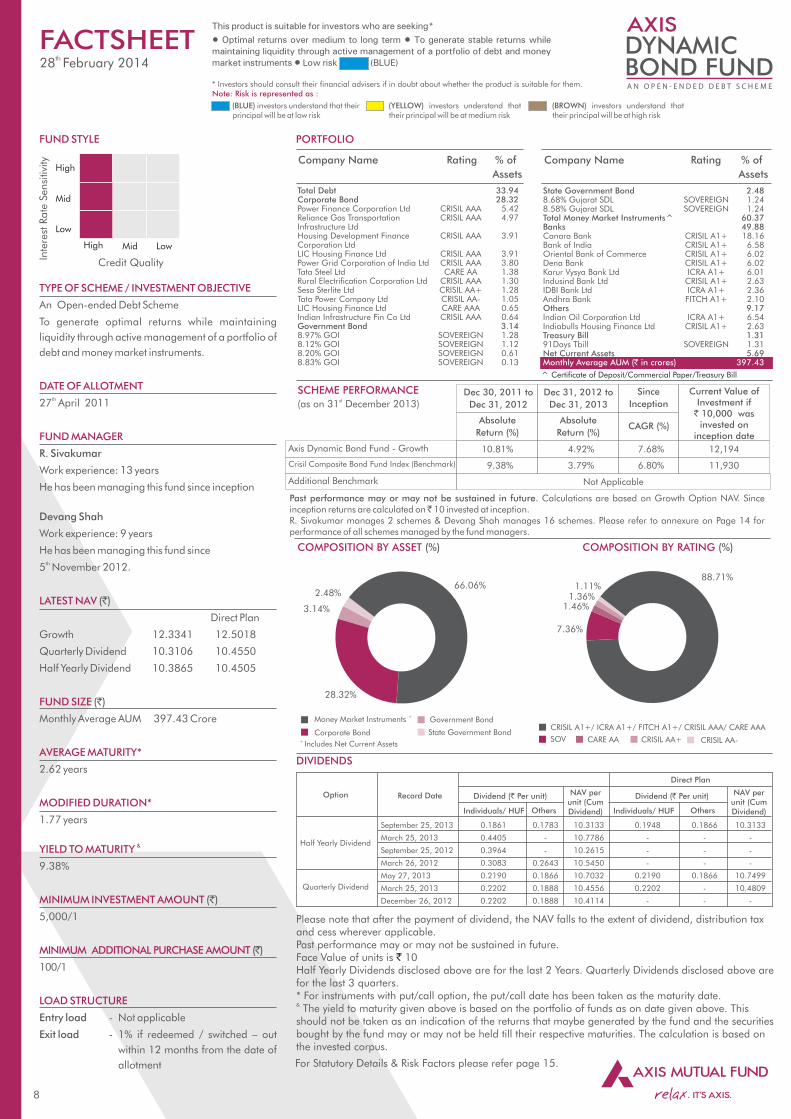
State Government Bond 2.488.68% Gujarat SDL SOVEREIGN 1.248.58% Gujarat SDL SOVEREIGN 1.24 Total Money Market Instruments^ 60.37 Banks 49.88Canara Bank CRISIL A1+ 18.16Bank of India CRISIL A1+ 6.58Oriental Bank of Commerce CRISIL A1+ 6.02Dena Bank CRISIL A1+ 6.02Karur Vysya Bank Ltd ICRA A1+ 6.01Indusind Bank Ltd CRISIL A1+ 2.63IDBI Bank Ltd ICRA A1+ 2.36Andhra Bank FITCH A1+ 2.10 Others 9.17Indian Oil Corporation Ltd ICRA A1+ 6.54Indiabulls Housing Finance Ltd CRISIL A1+ 2.63 Treasury Bill 1.3191Days Tbill SOVEREIGN 1.31 Net Current Assets 5.69Monthly Average AUM (` in crores) 397.43
Total Debt 33.94 Corporate Bond 28.32Power Finance Corporation Ltd CRISIL AAA 5.42Reliance Gas Transportation CRISIL AAA 4.97Infrastructure Ltd Housing Development Finance CRISIL AAA 3.91Corporation Ltd LIC Housing Finance Ltd CRISIL AAA 3.91Power Grid Corporation of India Ltd CRISIL AAA 3.80Tata Steel Ltd CARE AA 1.38Rural Electrification Corporation Ltd CRISIL AAA 1.30Sesa Sterlite Ltd CRISIL AA+ 1.28Tata Power Company Ltd CRISIL AA- 1.05LIC Housing Finance Ltd CARE AAA 0.65Indian Infrastructure Fin Co Ltd CRISIL AAA 0.64 Government Bond 3.148.97% GOI SOVEREIGN 1.288.12% GOI SOVEREIGN 1.128.20% GOI SOVEREIGN 0.618.83% GOI SOVEREIGN 0.13
COMPOSITION BY ASSET (%) COMPOSITION BY RATING (%)
State Government Bond
2.48%
Please note that after the payment of dividend, the NAV falls to the extent of dividend, distribution taxand cess wherever applicable.Past performance may or may not be sustained in future.Face Value of units is 10`Half Yearly Dividends disclosed above are for the last 2 Years. Quarterly Dividends disclosed above are for the last 3 quarters.* For instruments with put/call option, the put/call date has been taken as the maturity date.& The yield to maturity given above is based on the portfolio of funds as on date given above. This should not be taken as an indication of the returns that maybe generated by the fund and the securities bought by the fund may or may not be held till their respective maturities. The calculation is based on the invested corpus.
DIVIDENDS
September 25, 2013 0.1861 0.1783 10.3133 0.1948 0.1866 10.3133
March 25, 2013 0.4405 - 10.7786 - - -
September 25, 2012 0.3964 - 10.2615 - - -
March 26, 2012 0.3083 0.2643 10.5450 - - -
May 27, 2013 0.2190 0.1866 10.7032 0.2190 0.1866 10.7499
March 25, 2013 0.2202 0.1888 10.4556 0.2202 - 10.4809
December 26, 2012 0.2202 0.1888 10.4114 - - -
Record Date NAV per unit (Cum Dividend) Individuals/ HUF
Dividend (` Per unit)
Others
Half Yearly Dividend
Option
66.06%
Quarterly Dividend
1.46%
Corporate Bond
88.71%
CARE AA
Past performance may or may not be sustained in future. Calculations are based on Growth Option NAV. Since inception returns are calculated on ̀ 10 invested at inception.R. Sivakumar manages 2 schemes & Devang Shah manages 16 schemes. Please refer to annexure on Page 14 for performance of all schemes managed by the fund managers.
Inte
rest
Rate
Sensi
tivi
ty
Credit Quality
High Mid Low
FUND STYLE
TYPE OF SCHEME / INVESTMENT OBJECTIVE
An Open-ended Debt Scheme
To generate optimal returns while maintaining
liquidity through active management of a portfolio of
debt and money market instruments.
DATE OF ALLOTMENTth27 April 2011
FUND MANAGER
R. Sivakumar
Work experience: 13 years
He has been managing this fund since inception
Devang Shah
Work experience: 9 years
He has been managing this fund sinceth5 November 2012.
LATEST NAV (`)
Direct Plan
Growth 12.3341 12.5018
Quarterly Dividend 10.3106 10.4550
Half Yearly Dividend 10.3865 10.4505
FUND SIZE (`)
Monthly Average AUM 397.43 Crore
AVERAGE MATURITY*
2.62 years
MODIFIED DURATION*
1.77 years
&YIELD TO MATURITY
9.38%
MINIMUM INVESTMENT AMOUNT (`)
5,000/1
MINIMUM ADDITIONAL PURCHASE AMOUNT ( )̀
100/1
LOAD STRUCTURE
Entry load - Not applicable
Exit load - 1% if redeemed / switched – out
within 12 months from the date of
allotment
High
Mid
Low
28.32%
+Money Market Instruments
FACTSHEET
For Statutory Details & Risk Factors please refer page 15.
+ Includes Net Current Assets
^ Certificate of Deposit/Commercial Paper/Treasury Bill
3.14%
CRISIL A1+/ ICRA A1+/ FITCH A1+/ CRISIL AAA/ CARE AAA
NAV per unit (Cum Dividend) Individuals/ HUF Others
Dividend (` Per unit)
Direct Plan
CRISIL AA+
SCHEME PERFORMANCE st(as on 31 December 2013)
Crisil Composite Bond Fund Index (Benchmark)
Additional Benchmark
Axis Dynamic Bond Fund - Growth
CAGR (%)
9.38%
10.81% 7.68%
6.80%
Not Applicable
11,930
12,194
Since
Inception
Absolute
Return (%)
Dec 30, 2011 to
Dec 31, 2012
Current Value of Investment if
` 10,000 wasinvested on
inception date
Dec 31, 2012 to
Dec 31, 2013
Absolute
Return (%)
3.79%
4.92%
7.36%
SOV
Government Bond
1.36%
CRISIL AA-
th 28 February 2014
1.11%
* Investors should consult their financial advisers if in doubt about whether the product is suitable for them.Note: Risk is represented as :
(BLUE) investors understand that their principal will be at low risk
(YELLOW) investors understand that their principal will be at medium risk
(BROWN) investors understand that their principal will be at high risk
9
COMPOSITION BY ASSET (%) COMPOSITION BY RATING (%)
PORTFOLIO
Company Name Rating % of
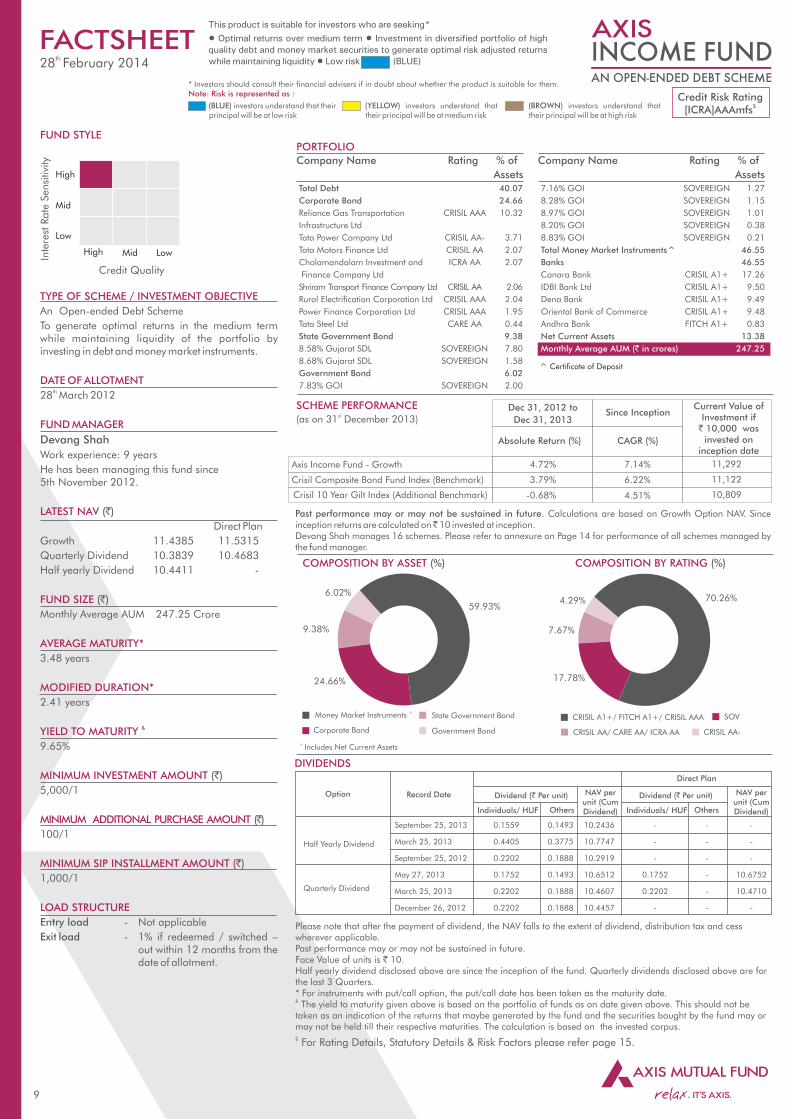
Assets Total Debt 40.07
Corporate Bond 24.66
Reliance Gas Transportation CRISIL AAA 10.32
Infrastructure Ltd
Tata Power Company Ltd CRISIL AA- 3.71
Tata Motors Finance Ltd CRISIL AA 2.07
Cholamandalam Investment and ICRA AA 2.07
Finance Company Ltd
Shriram Transport Finance Company Ltd CRISIL AA 2.06
Rural Electrification Corporation Ltd CRISIL AAA 2.04
Power Finance Corporation Ltd CRISIL AAA 1.95
Tata Steel Ltd CARE AA 0.44
State Government Bond 9.38
8.58% Gujarat SDL SOVEREIGN 7.80
8.68% Gujarat SDL SOVEREIGN 1.58
Government Bond 6.02
7.83% GOI SOVEREIGN 2.00
CRISIL A1+/ FITCH A1+/ CRISIL AAA
17.78%
Government Bond
+Money Market Instruments
59.93%
SOV
70.26%
DIVIDENDS
Company Name Rating % of
Assets 7.16% GOI SOVEREIGN 1.27
8.28% GOI SOVEREIGN 1.15
8.97% GOI SOVEREIGN 1.01
8.20% GOI SOVEREIGN 0.38
8.83% GOI SOVEREIGN 0.21
Total Money Market Instruments^ 46.55
Banks 46.55
Canara Bank CRISIL A1+ 17.26
IDBI Bank Ltd CRISIL A1+ 9.50
Dena Bank CRISIL A1+ 9.49
Oriental Bank of Commerce CRISIL A1+ 9.48
Andhra Bank FITCH A1+ 0.83
Net Current Assets 13.38
Monthly Average AUM (` in crores) 247.25
7.67%
4.29%
CRISIL AA-CRISIL AA/ CARE AA/ ICRA AA
Please note that after the payment of dividend, the NAV falls to the extent of dividend, distribution tax and cess wherever applicable.Past performance may or may not be sustained in future.Face Value of units is ` 10.Half yearly dividend disclosed above are since the inception of the fund. Quarterly dividends disclosed above are for the last 3 Quarters.* For instruments with put/call option, the put/call date has been taken as the maturity date.& The yield to maturity given above is based on the portfolio of funds as on date given above. This should not be taken as an indication of the returns that maybe generated by the fund and the securities bought by the fund may or may not be held till their respective maturities. The calculation is based on the invested corpus.
September 25, 2013 0.1559 0.1493 10.2436 - - -
March 25, 2013 0.4405 0.3775 10.7747 - - -
September 25, 2012 0.2202 0.1888 10.2919 - - -
May 27, 2013 0.1752 0.1493 10.6512 0.1752 - 10.6752
March 25, 2013 0.2202 0.1888 10.4607 0.2202 - 10.4710
December 26, 2012 0.2202 0.1888 10.4457 - - -
Record Date NAV per unit (Cum Dividend) Individuals/ HUF
Dividend (` Per unit)
Others
Quarterly Dividend
Option
Half Yearly Dividend
Credit Quality
High Mid Low
FUND STYLE
TYPE OF SCHEME / INVESTMENT OBJECTIVE
An Open-ended Debt Scheme
To generate optimal returns in the medium term while maintaining liquidity of the portfolio by investing in debt and money market instruments.
DATE OF ALLOTMENTth28 March 2012
FUND MANAGER
Devang Shah
Work experience: 9 years
He has been managing this fund since 5th November 2012.
LATEST NAV (`)
Direct Plan
Growth 11.4385 11.5315
Quarterly Dividend 10.3839 10.4683
Half yearly Dividend 10.4411 -
FUND SIZE (`)
Monthly Average AUM 247.25 Crore
AVERAGE MATURITY*
3.48 years
MODIFIED DURATION*
2.41 years
&YIELD TO MATURITY
9.65%
MINIMUM INVESTMENT AMOUNT (`)
5,000/1
MINIMUM ADDITIONAL PURCHASE AMOUNT (̀ )
100/1
MINIMUM SIP INSTALLMENT AMOUNT (`)
1,000/1
LOAD STRUCTURE
Entry load - Not applicable
Exit load - 1% if redeemed / switched – out within 12 months from the date of allotment.
High
Mid
Low
Inte
rest
Rate
Sensi
tivi
tyFACTSHEET
$ For Rating Details, Statutory Details & Risk Factors please refer page 15.
^ Certificate of Deposit
+ Includes Net Current Assets
State Government Bond
Credit Risk Rating$[ICRA]AAAmfs
Individuals/ HUF
Dividend (` Per unit)
Others
NAV per unit (Cum Dividend)
Direct Plan
9.38%
Corporate Bond
Past performance may or may not be sustained in future. Calculations are based on Growth Option NAV. Since inception returns are calculated on ̀ 10 invested at inception.Devang Shah manages 16 schemes. Please refer to annexure on Page 14 for performance of all schemes managed by the fund manager.
SCHEME PERFORMANCE st(as on 31 December 2013)
Absolute Return (%)
Dec 31, 2012 to
Dec 31, 2013
CAGR (%)
Since Inception
6.22%
Axis Income Fund - Growth
Crisil Composite Bond Fund Index (Benchmark)
4.72%
3.79%
7.14%
Current Value of Investment if
` 10,000 wasinvested on
inception date
11,292
11,122
Crisil 10 Year Gilt Index (Additional Benchmark) 4.51%-0.68% 10,809
24.66%
th 28 February 2014
6.02%
* Investors should consult their financial advisers if in doubt about whether the product is suitable for them.Note: Risk is represented as :
(BLUE) investors understand that their principal will be at low risk
(YELLOW) investors understand that their principal will be at medium risk
(BROWN) investors understand that their principal will be at high risk
10
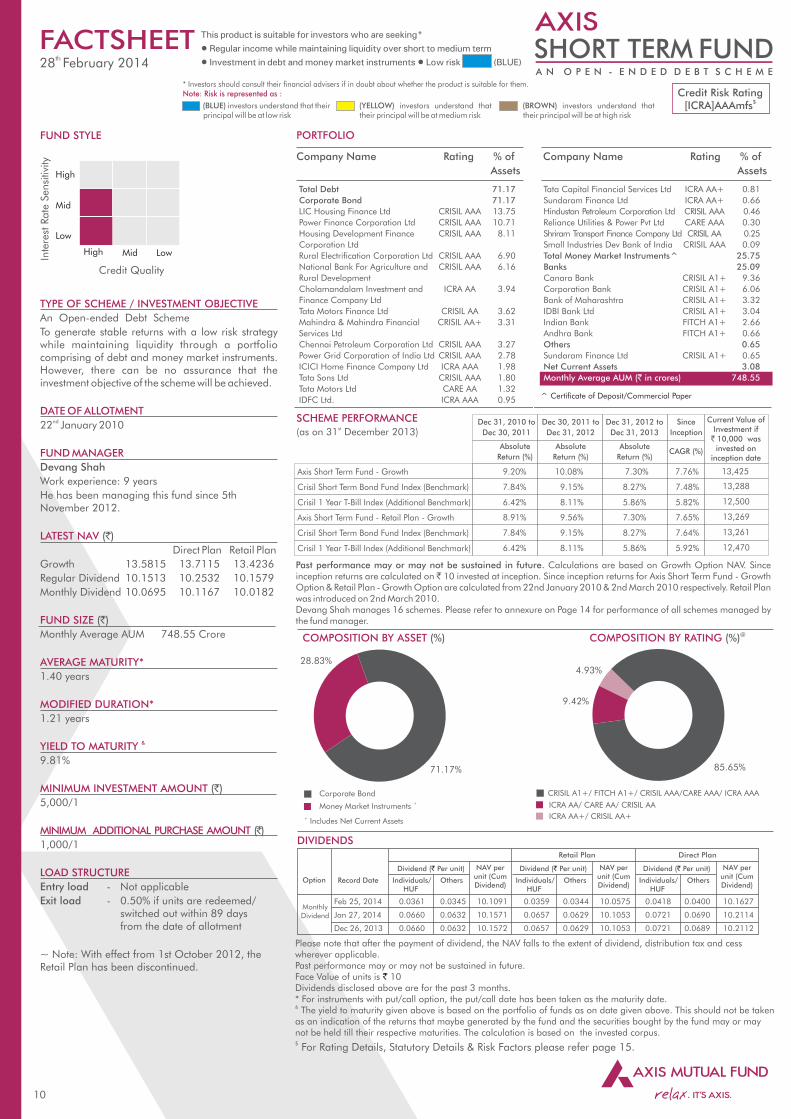
Total Debt 71.17
Corporate Bond 71.17
LIC Housing Finance Ltd CRISIL AAA 13.75
Power Finance Corporation Ltd CRISIL AAA 10.71
Housing Development Finance CRISIL AAA 8.11
Corporation Ltd
Rural Electrification Corporation Ltd CRISIL AAA 6.90
National Bank For Agriculture and CRISIL AAA 6.16
Rural Development
Cholamandalam Investment and ICRA AA 3.94
Finance Company Ltd
Tata Motors Finance Ltd CRISIL AA 3.62
Mahindra & Mahindra Financial CRISIL AA+ 3.31
Services Ltd
Chennai Petroleum Corporation Ltd CRISIL AAA 3.27
Power Grid Corporation of India Ltd CRISIL AAA 2.78
ICICI Home Finance Company Ltd ICRA AAA 1.98
Tata Sons Ltd CRISIL AAA 1.80
Tata Motors Ltd CARE AA 1.32
IDFC Ltd. ICRA AAA 0.95
COMPOSITION BY ASSET (%)
PORTFOLIO
Company Name Rating % of
Assets
Company Name Rating % of
Assets
Past performance may or may not be sustained in future. Calculations are based on Growth Option NAV. Since inception returns are calculated on ̀ 10 invested at inception. Since inception returns for Axis Short Term Fund - Growth Option & Retail Plan - Growth Option are calculated from 22nd January 2010 & 2nd March 2010 respectively. Retail Plan was introduced on 2nd March 2010. Devang Shah manages 16 schemes. Please refer to annexure on Page 14 for performance of all schemes managed by the fund manager.
Credit Risk Rating$[ICRA]AAAmfs
Please note that after the payment of dividend, the NAV falls to the extent of dividend, distribution tax and cess wherever applicable.Past performance may or may not be sustained in future. Face Value of units is 10`Dividends disclosed above are for the past 3 months. * For instruments with put/call option, the put/call date has been taken as the maturity date.& The yield to maturity given above is based on the portfolio of funds as on date given above. This should not be taken as an indication of the returns that maybe generated by the fund and the securities bought by the fund may or may not be held till their respective maturities. The calculation is based on the invested corpus.
SCHEME PERFORMANCE st(as on 31 December 2013)
DIVIDENDS
Tata Capital Financial Services Ltd ICRA AA+ 0.81
Sundaram Finance Ltd ICRA AA+ 0.66
Hindustan Petroleum Corporation Ltd CRISIL AAA 0.46
Reliance Utilities & Power Pvt Ltd CARE AAA 0.30
Shriram Transport Finance Company Ltd CRISIL AA 0.25
Small Industries Dev Bank of India CRISIL AAA 0.09
Total Money Market Instruments^ 25.75
Banks 25.09
Canara Bank CRISIL A1+ 9.36
Corporation Bank CRISIL A1+ 6.06
Bank of Maharashtra CRISIL A1+ 3.32
IDBI Bank Ltd CRISIL A1+ 3.04
Indian Bank FITCH A1+ 2.66
Andhra Bank FITCH A1+ 0.66
Others 0.65
Sundaram Finance Ltd CRISIL A1+ 0.65
Net Current Assets 3.08
Monthly Average AUM (` in crores) 748.55
71.17%
+Money Market Instruments
Corporate Bond
COMPOSITION BY RATING @(%)
85.65%
Absolute
Return (%)
Absolute
Return (%)
Dec 31, 2010 to
Dec 30, 2011
CAGR (%)
Since
Inception
CRISIL A1+/ FITCH A1+/ CRISIL AAA/CARE AAA/ ICRA AAA
Dec 30, 2011 to
Dec 31, 2012
Individuals/HUF
Record Date
Dividend ( Per unit)`
Others
NAV per unit (Cum Dividend)
Monthly Dividend
Option
Feb 25, 2014 0.0361 0.0345 10.1091 0.0359 0.0344 10.0575 0.0418 0.0400 10.1627
Jan 27, 2014 0.0660 0.0632 10.1571 0.0657 0.0629 10.1053 0.0721 0.0690 10.2114
Dec 26, 2013 0.0660 0.0632 10.1572 0.0657 0.0629 10.1053 0.0721 0.0689 10.2112
Current Value of Investment if
` 10,000 wasinvested on
inception date
Crisil 1 Year T-Bill Index (Additional Benchmark)
Axis Short Term Fund - Growth
Crisil Short Term Bond Fund Index (Benchmark)
Axis Short Term Fund - Retail Plan - Growth
Crisil Short Term Bond Fund Index (Benchmark)
Crisil 1 Year T-Bill Index (Additional Benchmark)
9.20%
7.84%
6.42%
8.91%
7.84%
6.42%
7.76%
7.48%
5.82%
7.65%
7.64%
5.92%
10.08%
9.15%
8.11%
9.56%
9.15%
8.11%
13,425
13,288
12,500
13,269
13,261
12,470
High
Mid
Low
Inte
rest
Rate
Sensi
tivi
ty
Credit Quality
High Mid Low
FUND STYLE
TYPE OF SCHEME / INVESTMENT OBJECTIVE
An Open-ended Debt Scheme
To generate stable returns with a low risk strategy while maintaining liquidity through a portfolio comprising of debt and money market instruments. However, there can be no assurance that the investment objective of the scheme will be achieved.
DATE OF ALLOTMENTnd22 January 2010
FUND MANAGER
Devang Shah
Work experience: 9 years
He has been managing this fund since 5th November 2012.
LATEST NAV (`)
Direct Plan Retail Plan
Growth 13.5815 13.7115 13.4236
Regular Dividend 10.1513 10.2532 10.1579
Monthly Dividend 10.0695 10.1167 10.0182
FUND SIZE (`)
Monthly Average AUM 748.55 Crore
AVERAGE MATURITY*
1.40 years
MODIFIED DURATION*
1.21 years
&YIELD TO MATURITY
9.81%
MINIMUM INVESTMENT AMOUNT (`)
5,000/1
MINIMUM ADDITIONAL PURCHASE AMOUNT (̀ )
1,000/1
LOAD STRUCTURE
Entry load - Not applicable
Exit load - 0.50% if units are redeemed/ switched out within 89 days from the date of allotment
~ Note: With effect from 1st October 2012, the Retail Plan has been discontinued.
9.42%
4.93%
ICRA AA/ CARE AA/ CRISIL AA
ICRA AA+/ CRISIL AA+
FACTSHEET
^ Certificate of Deposit/Commercial Paper
+ Includes Net Current Assets
$ For Rating Details, Statutory Details & Risk Factors please refer page 15.
Individuals/HUF
Others
Retail Plan
NAV per unit (Cum Dividend)
Individuals/HUF
Others
Direct Plan
NAV per unit (Cum Dividend)
Dividend ( Per unit)` Dividend ( Per unit)`
Absolute
Return (%)
Dec 31, 2012 to
Dec 31, 2013
7.30%
8.27%
5.86%
7.30%
8.27%
5.86%
th 28 February 2014
28.83%
* Investors should consult their financial advisers if in doubt about whether the product is suitable for them.Note: Risk is represented as :
(BLUE) investors understand that their principal will be at low risk
(YELLOW) investors understand that their principal will be at medium risk
(BROWN) investors understand that their principal will be at high risk
12
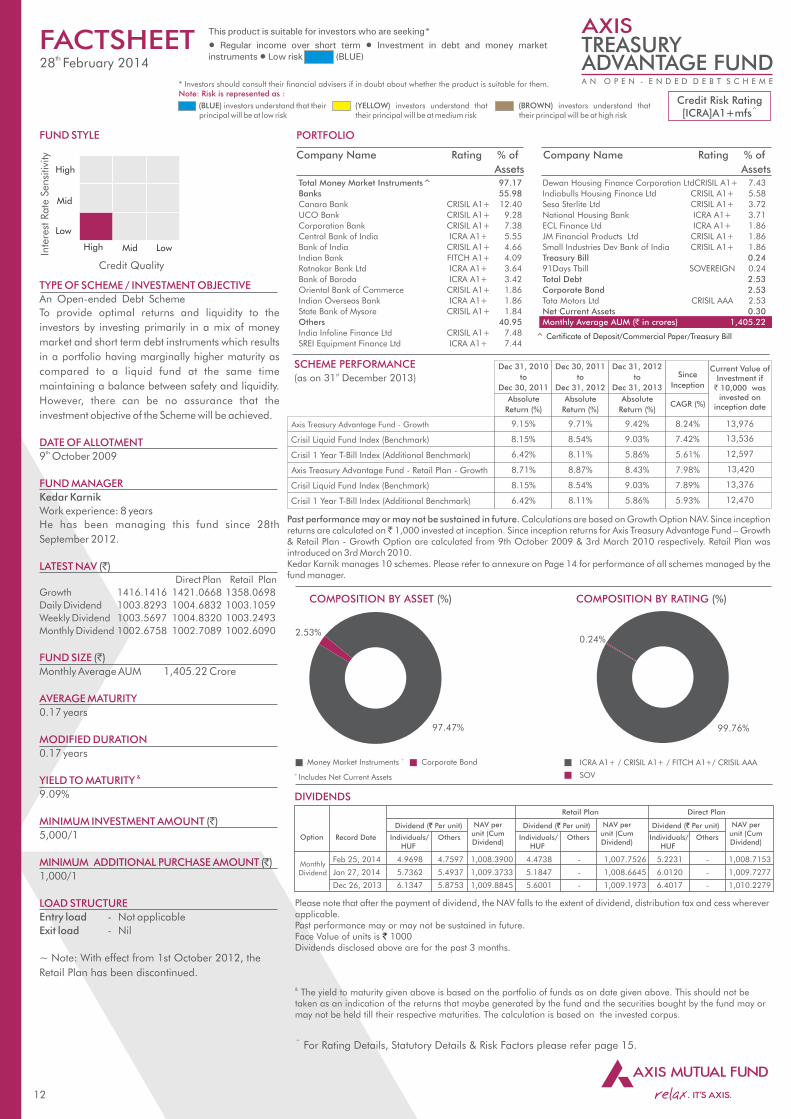
Total Money Market Instruments^ 97.17
Banks 55.98
Canara Bank CRISIL A1+ 12.40
UCO Bank CRISIL A1+ 9.28
Corporation Bank CRISIL A1+ 7.38
Central Bank of India ICRA A1+ 5.55
Bank of India CRISIL A1+ 4.66
Indian Bank FITCH A1+ 4.09
Ratnakar Bank Ltd ICRA A1+ 3.64
Bank of Baroda ICRA A1+ 3.42
Oriental Bank of Commerce CRISIL A1+ 1.86
Indian Overseas Bank ICRA A1+ 1.86
State Bank of Mysore CRISIL A1+ 1.84
Others 40.95
India Infoline Finance Ltd CRISIL A1+ 7.48
SREI Equipment Finance Ltd ICRA A1+ 7.44
SCHEME PERFORMANCE st(as on 31 December 2013)
Credit Risk Rating^[ICRA]A1+mfs
COMPOSITION BY ASSET (%) COMPOSITION BY RATING (%)
PORTFOLIO
Company Name Rating % of
Assets
Company Name Rating % of
Assets
Past performance may or may not be sustained in future. Calculations are based on Growth Option NAV. Since inception returns are calculated on ̀ 1,000 invested at inception. Since inception returns for Axis Treasury Advantage Fund – Growth & Retail Plan - Growth Option are calculated from 9th October 2009 & 3rd March 2010 respectively. Retail Plan was introduced on 3rd March 2010.Kedar Karnik manages 10 schemes. Please refer to annexure on Page 14 for performance of all schemes managed by the fund manager.
Please note that after the payment of dividend, the NAV falls to the extent of dividend, distribution tax and cess wherever applicable.Past performance may or may not be sustained in future. Face Value of units is 1000`Dividends disclosed above are for the past 3 months.
& The yield to maturity given above is based on the portfolio of funds as on date given above. This should not be taken as an indication of the returns that maybe generated by the fund and the securities bought by the fund may or may not be held till their respective maturities. The calculation is based on the invested corpus.
DIVIDENDS
ICRA A1+ / CRISIL A1+ / FITCH A1+/ CRISIL AAA
Dewan Housing Finance Corporation Ltd CRISIL A1+ 7.43
Indiabulls Housing Finance Ltd CRISIL A1+ 5.58
Sesa Sterlite Ltd CRISIL A1+ 3.72
National Housing Bank ICRA A1+ 3.71
ECL Finance Ltd ICRA A1+ 1.86
JM Financial Products Ltd CRISIL A1+ 1.86
Small Industries Dev Bank of India CRISIL A1+ 1.86
Treasury Bill 0.24
91Days Tbill SOVEREIGN 0.24
Total Debt 2.53
Corporate Bond 2.53
Tata Motors Ltd CRISIL AAA 2.53
Net Current Assets 0.30
Monthly Average AUM (` in crores) 1,405.22
97.47%
+Money Market Instruments
CAGR (%)
Since
Inception
Current Value of Investment if
` 10,000 wasinvested on
inception date
Crisil 1 Year T-Bill Index (Additional Benchmark)
Axis Treasury Advantage Fund - Growth
Crisil Liquid Fund Index (Benchmark)
Axis Treasury Advantage Fund - Retail Plan - Growth
Crisil Liquid Fund Index (Benchmark)
Crisil 1 Year T-Bill Index (Additional Benchmark)
Absolute
Return (%)
Dec 31, 2010
to
Dec 30, 2011
9.15%
8.15%
6.42%
13,976
13,536
12,597
13,420
13,376
12,470
High
Low
Inte
rest
Rate
Sensi
tivi
ty
Credit Quality
High Mid Low
FUND STYLE
TYPE OF SCHEME / INVESTMENT OBJECTIVE
An Open-ended Debt Scheme
To provide optimal returns and liquidity to the
investors by investing primarily in a mix of money
market and short term debt instruments which results
in a portfolio having marginally higher maturity as
compared to a liquid fund at the same time
maintaining a balance between safety and liquidity.
However, there can be no assurance that the
investment objective of the Scheme will be achieved.
DATE OF ALLOTMENTth9 October 2009
FUND MANAGER
Kedar Karnik
Work experience: 8 years
He has been managing this fund since 28th
September 2012.
LATEST NAV (`) Direct Plan Retail Plan
Growth 1416.1416 1421.0668 1358.0698
Daily Dividend 1003.8293 1004.6832 1003.1059
Weekly Dividend 1003.5697 1004.8320 1003.2493
Monthly Dividend 1002.6758 1002.7089 1002.6090
FUND SIZE (`)
Monthly Average AUM 1,405.22 Crore
AVERAGE MATURITY
0.17 years
MODIFIED DURATION
0.17 years
&YIELD TO MATURITY
9.09%
MINIMUM INVESTMENT AMOUNT (`)
5,000/1
MINIMUM ADDITIONAL PURCHASE AMOUNT (`)
1,000/1
LOAD STRUCTURE
Entry load - Not applicable
Exit load - Nil
~ Note: With effect from 1st October 2012, the
Retail Plan has been discontinued.
Mid
FACTSHEET
Absolute
Return (%)
Dec 30, 2011
to
Dec 31, 2012
9.71%
8.54%
8.11%
8.87%
8.54%
8.11%
Absolute
Return (%)
Dec 31, 2012
to
Dec 31, 2013
9.42%
9.03%
5.86%
8.43%
9.03%
5.86%
8.24%
7.42%
5.61%
7.98%
7.89%
5.93%
^ Certificate of Deposit/Commercial Paper/Treasury Bill
+ Includes Net Current Assets
^ For Rating Details, Statutory Details & Risk Factors please refer page 15.
Individuals/HUF
Record Date
Dividend ( Per unit)`
Others
NAV per unit (Cum Dividend)
Monthly Dividend
Option Individuals/HUF
Others
Retail Plan
NAV per unit (Cum Dividend)
Individuals/HUF
Others
Direct Plan
NAV per unit (Cum Dividend)
Dividend ( Per unit)` Dividend ( Per unit)`
Feb 25, 2014 4.9698 4.7597 1,008.3900 4.4738 - 1,007.7526 5.2231 - 1,008.7153
Jan 27, 2014 5.7362 5.4937 1,009.3733 5.1847 - 1,008.6645 6.0120 - 1,009.7277
Dec 26, 2013 6.1347 5.8753 1,009.8845 5.6001 - 1,009.1973 6.4017 - 1,010.2279
8.71%
8.15%
6.42%
99.76%
th 28 February 2014
2.53%0.24%
Corporate Bond
SOV
* Investors should consult their financial advisers if in doubt about whether the product is suitable for them.Note: Risk is represented as :
(BLUE) investors understand that their principal will be at low risk
(YELLOW) investors understand that their principal will be at medium risk
(BROWN) investors understand that their principal will be at high risk
11
COMPOSITION BY ASSET (%) COMPOSITION BY RATING (%)
PORTFOLIO
Company Name Rating % of
Assets
DIVIDENDS
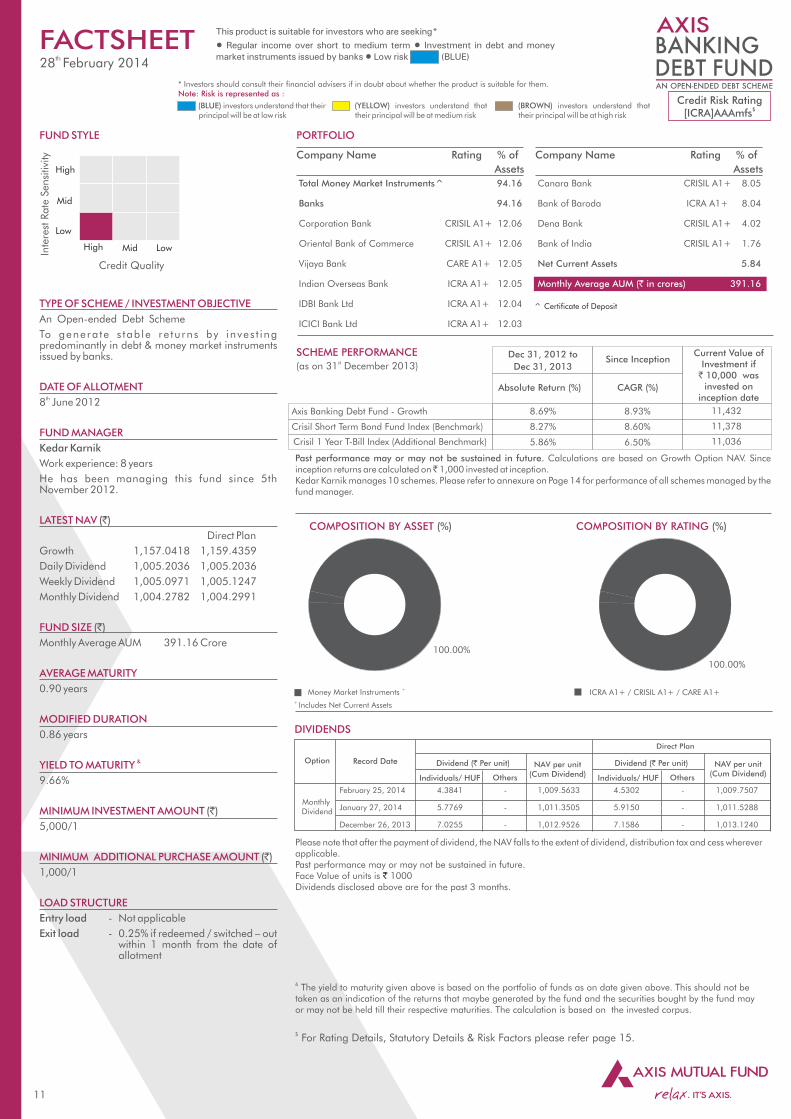
ICRA A1+ / CRISIL A1+ / CARE A1+
100.00%
+Money Market Instruments
Total Money Market Instruments^ 94.16
Banks 94.16
Corporation Bank CRISIL A1+ 12.06
Oriental Bank of Commerce CRISIL A1+ 12.06
Vijaya Bank CARE A1+ 12.05
Indian Overseas Bank ICRA A1+ 12.05
IDBI Bank Ltd ICRA A1+ 12.04
ICICI Bank Ltd ICRA A1+ 12.03
Company Name Rating % of
Assets
Canara Bank CRISIL A1+ 8.05
Bank of Baroda ICRA A1+ 8.04
Dena Bank CRISIL A1+ 4.02
Bank of India CRISIL A1+ 1.76
Net Current Assets 5.84
Monthly Average AUM (` in crores) 391.16
Please note that after the payment of dividend, the NAV falls to the extent of dividend, distribution tax and cess wherever applicable.Past performance may or may not be sustained in future. Face Value of units is 1000`Dividends disclosed above are for the past 3 months.
& The yield to maturity given above is based on the portfolio of funds as on date given above. This should not be taken as an indication of the returns that maybe generated by the fund and the securities bought by the fund may or may not be held till their respective maturities. The calculation is based on the invested corpus.
High
Low
Inte
rest
Rate
Sensi
tivi
ty
Credit Quality
High Mid Low
FUND STYLE
TYPE OF SCHEME / INVESTMENT OBJECTIVE
An Open-ended Debt Scheme
To genera te s tab le re tu rns by inves t ing predominantly in debt & money market instruments issued by banks.
DATE OF ALLOTMENTth8 June 2012
FUND MANAGER
Kedar Karnik
Work experience: 8 years
He has been managing this fund since 5th November 2012.
LATEST NAV (`)
Direct Plan
Growth 1,157.0418 1,159.4359
Daily Dividend 1,005.2036 1,005.2036
Weekly Dividend 1,005.0971 1,005.1247
Monthly Dividend 1,004.2782 1,004.2991
FUND SIZE (`)
Monthly Average AUM 391.16 Crore
AVERAGE MATURITY
0.90 years
MODIFIED DURATION
0.86 years
&YIELD TO MATURITY
9.66%
MINIMUM INVESTMENT AMOUNT (`)
5,000/1
MINIMUM ADDITIONAL PURCHASE AMOUNT (`)
1,000/1
LOAD STRUCTURE
Entry load - Not applicable
Exit load - 0.25% if redeemed / switched – out within 1 month from the date of allotment
Mid
FACTSHEET
100.00%
Credit Risk Rating$[ICRA]AAAmfs
$ For Rating Details, Statutory Details & Risk Factors please refer page 15.
+ Includes Net Current Assets
February 25, 2014 4.3841 - 1,009.5633 4.5302 - 1,009.7507
January 27, 2014 5.7769 - 1,011.3505 5.9150 - 1,011.5288
December 26, 2013 7.0255 - 1,012.9526 7.1586 - 1,013.1240
Direct Plan
Record Date NAV per unit (Cum Dividend) Individuals/ HUF
Dividend (` Per unit)
Others
Monthly Dividend
Option
Individuals/ HUF Others
NAV per unit (Cum Dividend)
Dividend (` Per unit)
^ Certificate of Deposit
Past performance may or may not be sustained in future. Calculations are based on Growth Option NAV. Since inception returns are calculated on ̀ 1,000 invested at inception.Kedar Karnik manages 10 schemes. Please refer to annexure on Page 14 for performance of all schemes managed by the fund manager.
SCHEME PERFORMANCE st(as on 31 December 2013)
Absolute Return (%)
Dec 31, 2012 to
Dec 31, 2013
CAGR (%)
Since Inception
8.60%
Axis Banking Debt Fund - Growth
Crisil Short Term Bond Fund Index (Benchmark)
8.69%
8.27%
8.93%
Current Value of Investment if
` 10,000 wasinvested on
inception date
11,432
11,378
Crisil 1 Year T-Bill Index (Additional Benchmark) 6.50%5.86% 11,036
th 28 February 2014
* Investors should consult their financial advisers if in doubt about whether the product is suitable for them.Note: Risk is represented as :
(BLUE) investors understand that their principal will be at low risk
(YELLOW) investors understand that their principal will be at medium risk
(BROWN) investors understand that their principal will be at high risk
13
PORTFOLIO
Credit Risk Rating^[ICRA]A1+mfs
Company Name Rating % of
Assets
Company Name Rating % of
Assets
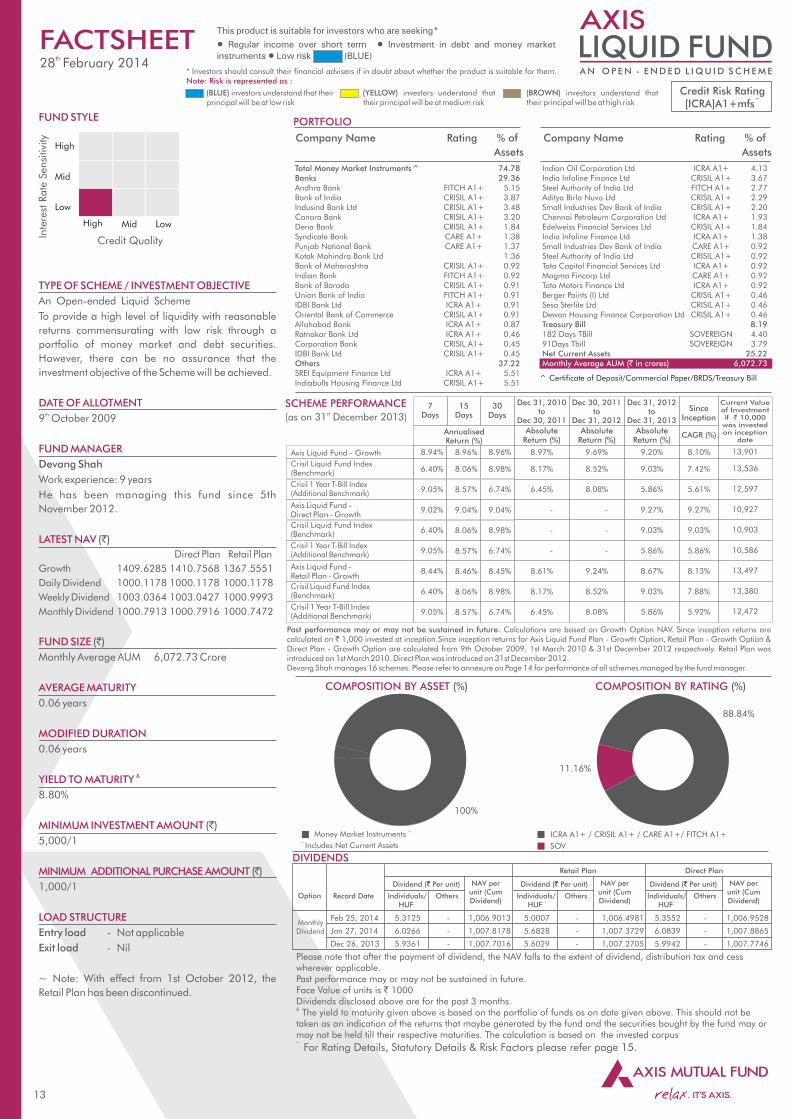
Indian Oil Corporation Ltd ICRA A1+ 4.13India Infoline Finance Ltd CRISIL A1+ 3.67Steel Authority of India Ltd FITCH A1+ 2.77Aditya Birla Nuvo Ltd CRISIL A1+ 2.29Small Industries Dev Bank of India CRISIL A1+ 2.20Chennai Petroleum Corporation Ltd ICRA A1+ 1.93Edelweiss Financial Services Ltd CRISIL A1+ 1.84India Infoline Finance Ltd ICRA A1+ 1.38Small Industries Dev Bank of India CARE A1+ 0.92Steel Authority of India Ltd CRISIL A1+ 0.92Tata Capital Financial Services Ltd ICRA A1+ 0.92Magma Fincorp Ltd CARE A1+ 0.92Tata Motors Finance Ltd ICRA A1+ 0.92Berger Paints (I) Ltd CRISIL A1+ 0.46Sesa Sterlite Ltd CRISIL A1+ 0.46Dewan Housing Finance Corporation Ltd CRISIL A1+ 0.46 Treasury Bill 8.19182 Days TBill SOVEREIGN 4.4091Days Tbill SOVEREIGN 3.79 Net Current Assets 25.22Monthly Average AUM (` in crores) 6,072.73
Total Money Market Instruments^ 74.78 Banks 29.36Andhra Bank FITCH A1+ 5.15Bank of India CRISIL A1+ 3.87Indusind Bank Ltd CRISIL A1+ 3.48Canara Bank CRISIL A1+ 3.20Dena Bank CRISIL A1+ 1.84Syndicate Bank CARE A1+ 1.38Punjab National Bank CARE A1+ 1.37Kotak Mahindra Bank Ltd 1.36Bank of Maharashtra CRISIL A1+ 0.92Indian Bank FITCH A1+ 0.92Bank of Baroda CRISIL A1+ 0.91Union Bank of India FITCH A1+ 0.91IDBI Bank Ltd ICRA A1+ 0.91Oriental Bank of Commerce CRISIL A1+ 0.91Allahabad Bank ICRA A1+ 0.87Ratnakar Bank Ltd ICRA A1+ 0.46Corporation Bank CRISIL A1+ 0.45IDBI Bank Ltd CRISIL A1+ 0.45 Others 37.22SREI Equipment Finance Ltd ICRA A1+ 5.51Indiabulls Housing Finance Ltd CRISIL A1+ 5.51
COMPOSITION BY ASSET (%)
Past performance may or may not be sustained in future. Calculations are based on Growth Option NAV. Since inception returns are calculated on ` 1,000 invested at inception.Since inception returns for Axis Liquid Fund Plan - Growth Option, Retail Plan - Growth Option & Direct Plan - Growth Option are calculated from 9th October 2009, 1st March 2010 & 31st December 2012 respectively. Retail Plan was introduced on 1st March 2010. Direct Plan was introduced on 31st December 2012.Devang Shah manages 16 schemes. Please refer to annexure on Page 14 for performance of all schemes managed by the fund manager.
ICRA A1+ / CRISIL A1+ / CARE A1+/ FITCH A1++Money Market Instruments
100%
COMPOSITION BY RATING (%)
11.16%
High
Mid
Low
Inte
rest
Rate
Sensi
tivi
ty
Credit Quality
High Mid Low
FUND STYLE
TYPE OF SCHEME / INVESTMENT OBJECTIVE
An Open-ended Liquid Scheme
To provide a high level of liquidity with reasonable
returns commensurating with low risk through a
portfolio of money market and debt securities.
However, there can be no assurance that the
investment objective of the Scheme will be achieved.
DATE OF ALLOTMENTth9 October 2009
FUND MANAGER
Devang Shah
Work experience: 9 years
He has been managing this fund since 5th
November 2012.
LATEST NAV (`)
Direct Plan Retail Plan
Growth 1409.6285 1410.7568 1367.5551
Daily Dividend 1000.1178 1000.1178 1000.1178
Weekly Dividend 1003.0364 1003.0427 1000.9993
Monthly Dividend 1000.7913 1000.7916 1000.7472
FUND SIZE (`)
Monthly Average AUM 6,072.73 Crore
AVERAGE MATURITY
0.06 years
MODIFIED DURATION
0.06 years
&YIELD TO MATURITY
8.80%
MINIMUM INVESTMENT AMOUNT (`)
5,000/1
MINIMUM ADDITIONAL PURCHASE AMOUNT ( )̀
1,000/1
LOAD STRUCTURE
Entry load - Not applicable
Exit load - Nil
~ Note: With effect from 1st October 2012, the
Retail Plan has been discontinued.
FACTSHEET
+ Includes Net Current Assets
^ Certificate of Deposit/Commercial Paper/BRDS/Treasury Bill
^ For Rating Details, Statutory Details & Risk Factors please refer page 15.
Individuals/HUF
Record Date
Dividend ( Per unit)`
Others
NAV per unit (Cum Dividend)
Monthly Dividend
Option Individuals/HUF
Others
Retail Plan
NAV per unit (Cum Dividend)
Individuals/HUF
Others
Direct Plan
NAV per unit (Cum Dividend)
Dividend ( Per unit)` Dividend ( Per unit)`
Feb 25, 2014 5.3125 - 1,006.9013 5.0007 - 1,006.4981 5.3552 - 1,006.9528
Jan 27, 2014 6.0266 - 1,007.8178 5.6828 - 1,007.3729 6.0839 - 1,007.8865
Dec 26, 2013 5.9361 - 1,007.7016 5.6029 - 1,007.2705 5.9942 - 1,007.7746
DIVIDENDS
88.84%
SOV
Please note that after the payment of dividend, the NAV falls to the extent of dividend, distribution tax and cess wherever applicable.Past performance may or may not be sustained in future. Face Value of units is ` 1000Dividends disclosed above are for the past 3 months.& The yield to maturity given above is based on the portfolio of funds as on date given above. This should not be taken as an indication of the returns that maybe generated by the fund and the securities bought by the fund may or may not be held till their respective maturities. The calculation is based on the invested corpus
th 28 February 2014
SCHEME PERFORMANCE st(as on 31 December 2013)
8.97%
CAGR (%)
SinceInception
Dec 31, 2010to
Dec 30, 2011
Absolute Return (%)
Axis Liquid Fund - Growth
Crisil Liquid Fund Index (Benchmark)
Crisil 1 Year T-Bill Index(Additional Benchmark)
8.94%
6.40%
9.05%
8.96%
7 Days
15Days
30 Days
Annualised Return (%)
Crisil 1 Year T-Bill Index (Additional Benchmark)
Crisil Liquid Fund Index (Benchmark)
Axis Liquid Fund - Direct Plan - Growth
Current Valueof Investment if ` 10,000was investedon inception
date
Dec 30, 2011to
Dec 31, 2012
Dec 31, 2012to
Dec 31, 2013
Absolute Return (%)
Absolute Return (%)
9.69% 9.20% 8.10% 13,9018.96%
8.06%
Axis Liquid Fund - Retail Plan - Growth
Crisil Liquid Fund Index (Benchmark)
Crisil 1 Year T-Bill Index(Additional Benchmark)
6.45% 9.05% 6.74% 8.08% 5.86% 12,4728.57%
8.17% 6.40% 8.98% 8.52% 9.03% 13,3808.06%
8.61% 8.44% 8.45% 9.24% 8.67% 13,4978.46%
-9.05% 6.74% - 5.86% 10,5868.57%
-6.40% 8.98% - 9.03% 10,9038.06%
-9.02% 9.04% - 9.27% 10,9279.04%
6.45% 6.74% 8.08% 5.86% 12,5978.57%
8.17% 8.98% 8.52% 9.03% 13,536
5.92%
7.88%
8.13%
5.86%
9.03%
9.27%
5.61%
7.42%
14
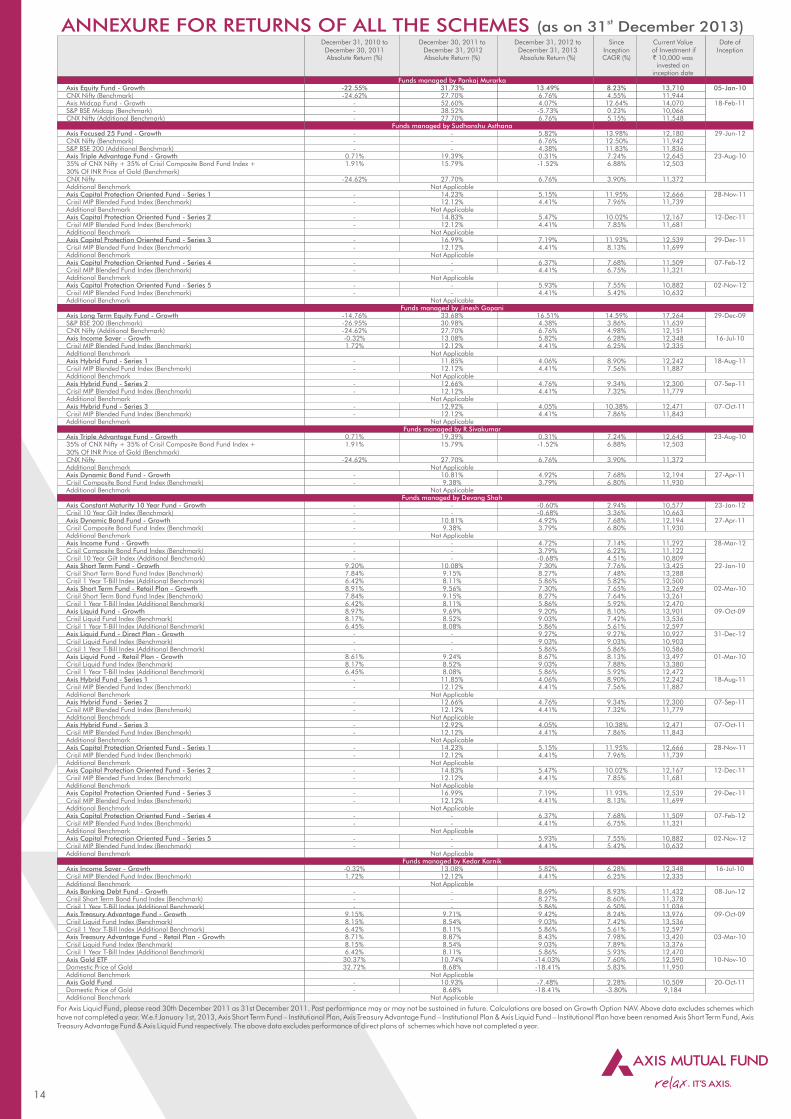
ANNEXURE FOR RETURNS OF ALL THE SCHEMES st(as on 31 December 2013)
For Axis Liquid Fund, please read 30th December 2011 as 31st December 2011. Past performance may or may not be sustained in future. Calculations are based on Growth Option NAV. Above data excludes schemes which have not completed a year. W.e.f January 1st, 2013, Axis Short Term Fund – Institutional Plan, Axis Treasury Advantage Fund – Institutional Plan & Axis Liquid Fund – Institutional Plan have been renamed Axis Short Term Fund, Axis Treasury Advantage Fund & Axis Liquid Fund respectively. The above data excludes performance of direct plans of schemes which have not completed a year.
December 31, 2010 to December 30, 2011 to December 31, 2012 to Since Current Value Date of December 30, 2011 December 31, 2012 December 31, 2013 Inception of Investment if Inception Absolute Return (%) Absolute Return (%) Absolute Return (%) CAGR (%) ` 10,000 was invested on inception date Funds managed by Pankaj Murarka Axis Equity Fund - Growth -22.55% 31.73% 13.49% 8.23% 13,710 05-Jan-10CNX Nifty (Benchmark) -24.62% 27.70% 6.76% 4.55% 11,944 Axis Midcap Fund - Growth - 52.60% 4.07% 12.64% 14,070 18-Feb-11S&P BSE Midcap (Benchmark) - 38.52% -5.73% 0.23% 10,066 CNX Nifty (Additional Benchmark) - 27.70% 6.76% 5.15% 11,548 Funds managed by Sudhanshu Asthana Axis Focused 25 Fund - Growth - - 5.82% 13.98% 12,180 29-Jun-12CNX Nifty (Benchmark) - - 6.76% 12.50% 11,942 S&P BSE 200 (Additional Benchmark) - - 4.38% 11.83% 11,836 Axis Triple Advantage Fund - Growth 0.71% 19.39% 0.31% 7.24% 12,645 23-Aug-1035% of CNX Nifty + 35% of Crisil Composite Bond Fund Index + 1.91% 15.79% -1.52% 6.88% 12,503 30% Of INR Price of Gold (Benchmark)CNX Nifty -24.62% 27.70% 6.76% 3.90% 11,372 Additional Benchmark Not Applicable Axis Capital Protection Oriented Fund - Series 1 - 14.23% 5.15% 11.95% 12,666 28-Nov-11Crisil MIP Blended Fund Index (Benchmark) - 12.12% 4.41% 7.96% 11,739 Additional Benchmark Not Applicable Axis Capital Protection Oriented Fund - Series 2 - 14.83% 5.47% 10.02% 12,167 12-Dec-11Crisil MIP Blended Fund Index (Benchmark) - 12.12% 4.41% 7.85% 11,681 Additional Benchmark Not Applicable Axis Capital Protection Oriented Fund - Series 3 - 16.99% 7.19% 11.93% 12,539 29-Dec-11Crisil MIP Blended Fund Index (Benchmark) - 12.12% 4.41% 8.13% 11,699 Additional Benchmark Not Applicable Axis Capital Protection Oriented Fund - Series 4 - - 6.37% 7.68% 11,509 07-Feb-12Crisil MIP Blended Fund Index (Benchmark) - - 4.41% 6.75% 11,321 Additional Benchmark Not Applicable Axis Capital Protection Oriented Fund - Series 5 - - 5.93% 7.55% 10,882 02-Nov-12Crisil MIP Blended Fund Index (Benchmark) - - 4.41% 5.42% 10,632 Additional Benchmark Not Applicable Funds managed by Jinesh Gopani Axis Long Term Equity Fund - Growth -14.76% 33.68% 16.51% 14.59% 17,264 29-Dec-09S&P BSE 200 (Benchmark) -26.95% 30.98% 4.38% 3.86% 11,639 CNX Nifty (Additional Benchmark) -24.62% 27.70% 6.76% 4.98% 12,151 Axis Income Saver - Growth -0.32% 13.08% 5.82% 6.28% 12,348 16-Jul-10Crisil MIP Blended Fund Index (Benchmark) 1.72% 12.12% 4.41% 6.25% 12,335 Additional Benchmark Not Applicable Axis Hybrid Fund - Series 1 - 11.85% 4.06% 8.90% 12,242 18-Aug-11Crisil MIP Blended Fund Index (Benchmark) - 12.12% 4.41% 7.56% 11,887 Additional Benchmark Not Applicable Axis Hybrid Fund - Series 2 - 12.66% 4.76% 9.34% 12,300 07-Sep-11Crisil MIP Blended Fund Index (Benchmark) - 12.12% 4.41% 7.32% 11,779 Additional Benchmark Not Applicable Axis Hybrid Fund - Series 3 - 12.92% 4.05% 10.38% 12,471 07-Oct-11Crisil MIP Blended Fund Index (Benchmark) - 12.12% 4.41% 7.86% 11,843 Additional Benchmark Not Applicable Funds managed by R.Sivakumar Axis Triple Advantage Fund - Growth 0.71% 19.39% 0.31% 7.24% 12,645 23-Aug-1035% of CNX Nifty + 35% of Crisil Composite Bond Fund Index + 1.91% 15.79% -1.52% 6.88% 12,503 30% Of INR Price of Gold (Benchmark)CNX Nifty -24.62% 27.70% 6.76% 3.90% 11,372 Additional Benchmark Not Applicable Axis Dynamic Bond Fund - Growth - 10.81% 4.92% 7.68% 12,194 27-Apr-11Crisil Composite Bond Fund Index (Benchmark) - 9.38% 3.79% 6.80% 11,930 Additional Benchmark Not Applicable Funds managed by Devang ShahAxis Constant Maturity 10 Year Fund - Growth - - -0.60% 2.94% 10,577 23-Jan-12Crisil 10 Year Gilt Index (Benchmark) - - -0.68% 3.36% 10,663 Axis Dynamic Bond Fund - Growth - 10.81% 4.92% 7.68% 12,194 27-Apr-11Crisil Composite Bond Fund Index (Benchmark) - 9.38% 3.79% 6.80% 11,930 Additional Benchmark Not Applicable Axis Income Fund - Growth - - 4.72% 7.14% 11,292 28-Mar-12Crisil Composite Bond Fund Index (Benchmark) - - 3.79% 6.22% 11,122 Crisil 10 Year Gilt Index (Additional Benchmark) - - -0.68% 4.51% 10,809 Axis Short Term Fund - Growth 9.20% 10.08% 7.30% 7.76% 13,425 22-Jan-10Crisil Short Term Bond Fund Index (Benchmark) 7.84% 9.15% 8.27% 7.48% 13,288 Crisil 1 Year T-Bill Index (Additional Benchmark) 6.42% 8.11% 5.86% 5.82% 12,500 Axis Short Term Fund - Retail Plan - Growth 8.91% 9.56% 7.30% 7.65% 13,269 02-Mar-10Crisil Short Term Bond Fund Index (Benchmark) 7.84% 9.15% 8.27% 7.64% 13,261 Crisil 1 Year T-Bill Index (Additional Benchmark) 6.42% 8.11% 5.86% 5.92% 12,470 Axis Liquid Fund - Growth 8.97% 9.69% 9.20% 8.10% 13,901 09-Oct-09Crisil Liquid Fund Index (Benchmark) 8.17% 8.52% 9.03% 7.42% 13,536 Crisil 1 Year T-Bill Index (Additional Benchmark) 6.45% 8.08% 5.86% 5.61% 12,597 Axis Liquid Fund - Direct Plan - Growth - - 9.27% 9.27% 10,927 31-Dec-12Crisil Liquid Fund Index (Benchmark) - - 9.03% 9.03% 10,903 Crisil 1 Year T-Bill Index (Additional Benchmark) - - 5.86% 5.86% 10,586 Axis Liquid Fund - Retail Plan - Growth 8.61% 9.24% 8.67% 8.13% 13,497 01-Mar-10Crisil Liquid Fund Index (Benchmark) 8.17% 8.52% 9.03% 7.88% 13,380 Crisil 1 Year T-Bill Index (Additional Benchmark) 6.45% 8.08% 5.86% 5.92% 12,472 Axis Hybrid Fund - Series 1 - 11.85% 4.06% 8.90% 12,242 18-Aug-11Crisil MIP Blended Fund Index (Benchmark) - 12.12% 4.41% 7.56% 11,887 Additional Benchmark Not Applicable Axis Hybrid Fund - Series 2 - 12.66% 4.76% 9.34% 12,300 07-Sep-11Crisil MIP Blended Fund Index (Benchmark) - 12.12% 4.41% 7.32% 11,779 Additional Benchmark Not Applicable Axis Hybrid Fund - Series 3 - 12.92% 4.05% 10.38% 12,471 07-Oct-11Crisil MIP Blended Fund Index (Benchmark) - 12.12% 4.41% 7.86% 11,843 Additional Benchmark Not Applicable Axis Capital Protection Oriented Fund - Series 1 - 14.23% 5.15% 11.95% 12,666 28-Nov-11Crisil MIP Blended Fund Index (Benchmark) - 12.12% 4.41% 7.96% 11,739 Additional Benchmark Not Applicable Axis Capital Protection Oriented Fund - Series 2 - 14.83% 5.47% 10.02% 12,167 12-Dec-11Crisil MIP Blended Fund Index (Benchmark) - 12.12% 4.41% 7.85% 11,681 Additional Benchmark Not Applicable Axis Capital Protection Oriented Fund - Series 3 - 16.99% 7.19% 11.93% 12,539 29-Dec-11Crisil MIP Blended Fund Index (Benchmark) - 12.12% 4.41% 8.13% 11,699 Additional Benchmark Not Applicable Axis Capital Protection Oriented Fund - Series 4 - - 6.37% 7.68% 11,509 07-Feb-12Crisil MIP Blended Fund Index (Benchmark) - - 4.41% 6.75% 11,321 Additional Benchmark Not Applicable Axis Capital Protection Oriented Fund - Series 5 - - 5.93% 7.55% 10,882 02-Nov-12Crisil MIP Blended Fund Index (Benchmark) - - 4.41% 5.42% 10,632 Additional Benchmark Not Applicable Funds managed by Kedar KarnikAxis Income Saver - Growth -0.32% 13.08% 5.82% 6.28% 12,348 16-Jul-10Crisil MIP Blended Fund Index (Benchmark) 1.72% 12.12% 4.41% 6.25% 12,335 Additional Benchmark Not Applicable Axis Banking Debt Fund - Growth - - 8.69% 8.93% 11,432 08-Jun-12Crisil Short Term Bond Fund Index (Benchmark) - - 8.27% 8.60% 11,378 Crisil 1 Year T-Bill Index (Additional Benchmark) - - 5.86% 6.50% 11,036 Axis Treasury Advantage Fund - Growth 9.15% 9.71% 9.42% 8.24% 13,976 09-Oct-09Crisil Liquid Fund Index (Benchmark) 8.15% 8.54% 9.03% 7.42% 13,536 Crisil 1 Year T-Bill Index (Additional Benchmark) 6.42% 8.11% 5.86% 5.61% 12,597 Axis Treasury Advantage Fund - Retail Plan - Growth 8.71% 8.87% 8.43% 7.98% 13,420 03-Mar-10Crisil Liquid Fund Index (Benchmark) 8.15% 8.54% 9.03% 7.89% 13,376 Crisil 1 Year T-Bill Index (Additional Benchmark) 6.42% 8.11% 5.86% 5.93% 12,470 Axis Gold ETF 30.37% 10.74% -14.03% 7.60% 12,590 10-Nov-10Domestic Price of Gold 32.72% 8.68% -18.41% 5.83% 11,950 Additional Benchmark Not Applicable Axis Gold Fund - 10.93% -7.48% 2.28% 10,509 20-Oct-11Domestic Price of Gold - 8.68% -18.41% -3.80% 9,184 Additional Benchmark Not Applicable

15
$ Rating Details (Axis Income Fund, Axis Short Term Fund & Axis Banking Debt Fund)
Schemes with this rating are considered to have the highest degree of safety regarding timely receipt of payments from the
investments that they have made. This rating should however, not be construed as an indication of the performance of the
Mutual Fund scheme or of volatility in its returns. The rating should not be treated as a recommendation to buy, sell or hold
units issued by the Mutual Fund.
^ Rating Details (Axis Treasury Advantage Fund and Axis Liquid Fund)
Schemes with this rating are considered to have very strong degree of safety regarding timely receipt of payments from
the investments that they have made. This rating should however, not be construed as an indication of the performance of
the Mutual Fund scheme or of volatility in its returns. The rating should not be treated as a recommendation to buy, sell or
hold units issued by the Mutual Fund.
Statutory Details & Disclaimers : Axis Mutual Fund has been established as a Trust under the Indian Trusts Act, 1882, sponsored by Axis Bank Ltd. (liability
restricted to ` 1 Lakh). Trustee: Axis Mutual Fund Trustee Limited Investment Manager: Axis Asset Management
Company Limited (the AMC). Risk Factors: Axis Bank Limited is not liable or responsible for any loss or shortfall resulting
from the operation of any of the mutual fund schemes launched by the AMC. Mutual Fund Investments are subject to
market risks, read all scheme related documents carefully.
To know more about us, please refer to our website.
FACTSHEETth 28 February 2014
#Past performance may or may not be sustained in future.
Performance of
Equity Funds
(BLUE) investors understand that their principal will be at low risk
(YELLOW) investors understand that their principal will be at medium risk
(BROWN) investors understand that their principal will be at high risk
* Investors should consult their financial advisers if in doubt about whether the product is suitable for them.Note: Risk is represented as :
This product is suitable for investors who are seeking*
Capital appreciation over to long term
Investment in a diversified portfolio predominantly consisting of equity and equity related instruments
High risk (BROWN)
This product is suitable for investors who are seeking*
Capital appreciation over to long term
Investment predominantly in equity and equity related instruments of mid size companies with focus in relatively larger companies within this category
High risk (BROWN)
This product is suitable for investors who are seeking*
Capital appreciation & generating income over to long term
Investment in a diversified portfolio predominantly consisting of equity and equity related instruments
High risk (BROWN)


