Faculty of Engineering Optimisation: Getting More and Better for Less Inaugural Lecture by Vassili Toropov Professor of Aerospace and Structural Engineering School of Civil Engineering School of Mechanical Engineering
Transcript
Faculty of Engineering
Optimisation:Getting More and Better for Less
Inaugural Lecture
by Vassili Toropov
Professor of Aerospace and Structural Engineering
School of Civil Engineering
School of Mechanical Engineering
Opis: Roman goddess of abundance and fertility.
“Opis is said to be the wife of Saturn. By her the Gods designated the earth, because the earth distributes all goods to the human gender“. Festus
Meanings of the word: "riches, goods, abundance, gifts, munificence, plenty".
The word optimus - the best - was derived from her name.
Why do we call it that way?
Mathematical optimisation problem
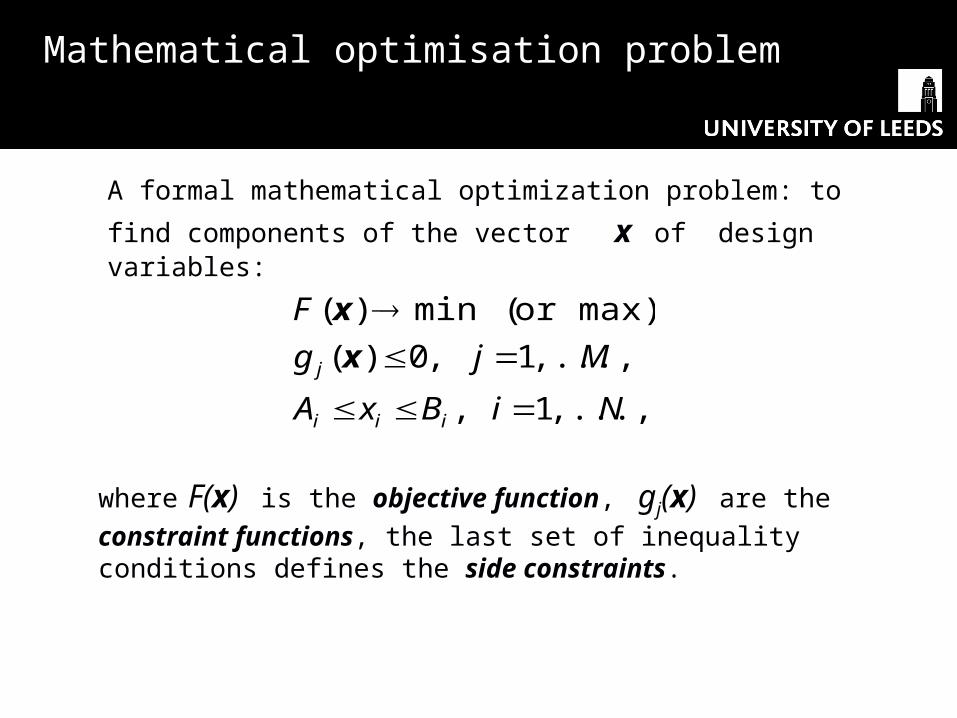
A formal mathematical optimization problem: to find components
of the vector x of design variables:
where F(x) is the objective function, gj(x) are the constraint
functions, the last set of inequality conditions defines the side constraints.
NiBxA
Mjg
F
iii
j
,...,1,
,...,1,0)(
max)or(min)(
x
x
Design variables are selected to uniquely identify a design.
Typical examples:
• areas of cross section of bars in a truss structure
• number of a specific steel section in a catalogue of UB sections
• coordinates points defining the shape of an aerofoil
• etc.
Choice of design variables
Optimization of a steel structure where some of the members are described by 10 design variables. Each design variable represents a number of a UB section from a catalogue of 10 available sections.
One full structural analysis of each design takes 1 second on a computer.
Question: how much time would it take to check all the combinations of cross-sections in order to guarantee the optimum solution?
Example
Answer: 1010 seconds = 317 years
Criteria of system’s efficiency are described by the objective function
that is to be either minimised or maximised.
Typical examples:
• cost
• weight
• use of resources (fuel, etc.)
• aerodynamic drag
• return on investment
• etc.
MATHEMATICAL OPTIMIZATION PROBLEMCriteria of system’s efficiency
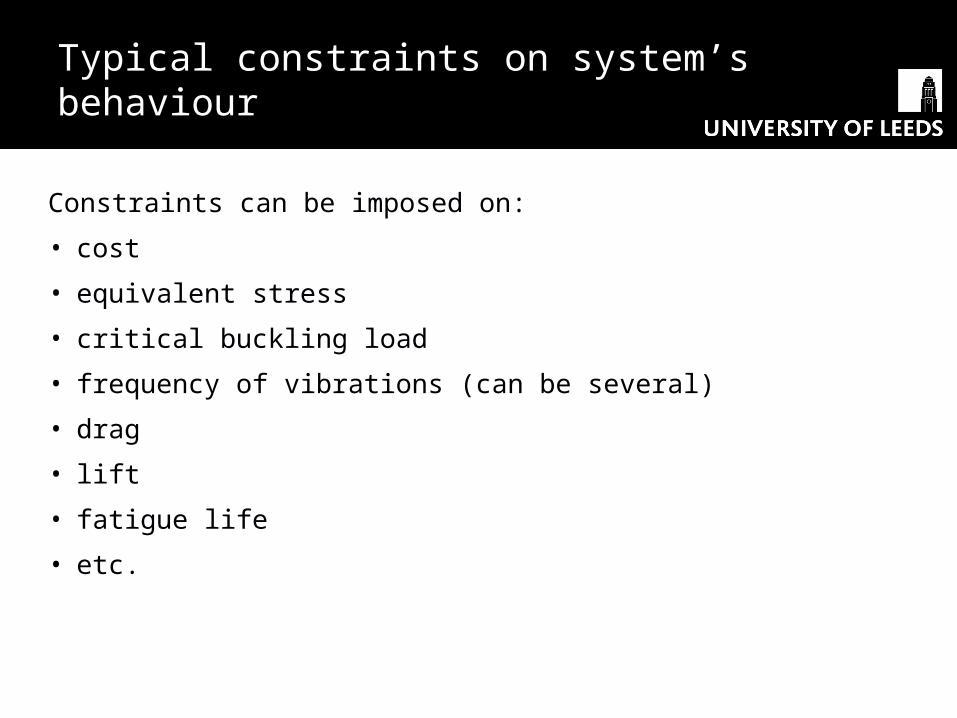
Typical constraints on system’s behaviour
Constraints can be imposed on:
• cost
• equivalent stress
• critical buckling load
• frequency of vibrations (can be several)
• drag
• lift
• fatigue life
• etc.
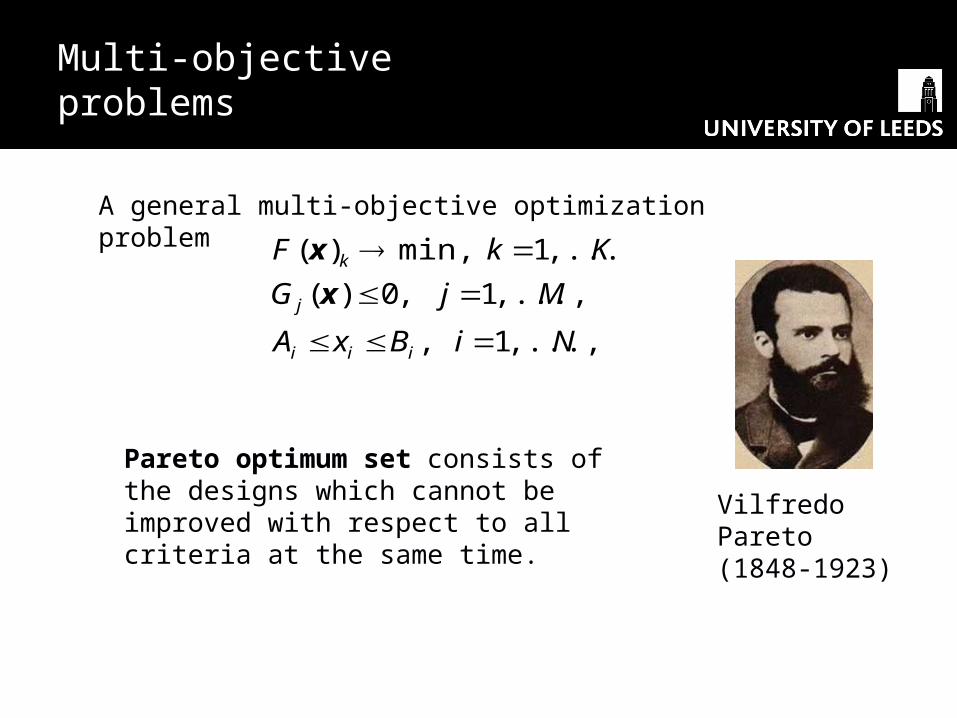
Pareto optimum set consists of the designs which cannot be improved with respect to all criteria at the same time.
NiBxA
MjG
KkF
iii
j
k
,...,1,
,...,1,0)(
,...,1min,)(
x
x
A general multi-objective optimization problem
Multi-objective problems
Vilfredo Pareto (1848-1923)
Multi-objective problems
Example. You are a looking for a plumber in the Yellow Pages and want the job done both quickly and cheaply.
You consider a particular plumber, do your research and see that no other can do the job cheaper as well as come sooner.
It means that this particular plumber is Pareto optimal with respect to the cost and waiting time.
Multi-objective problems
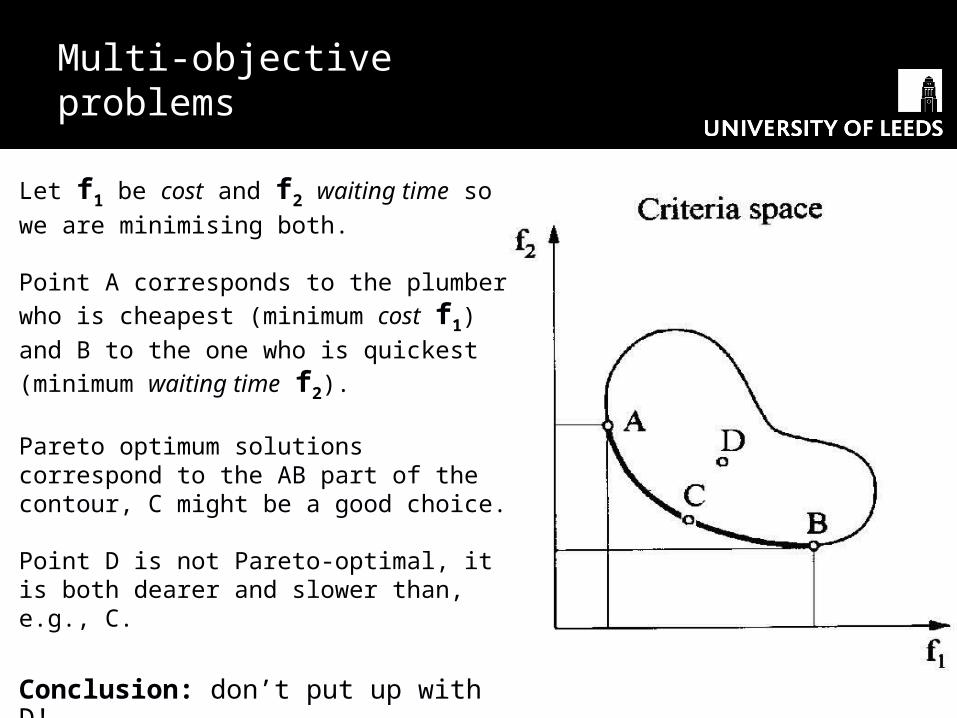
Let f1 be cost and f2 waiting time so we
are minimising both.
Point A corresponds to the plumber who
is cheapest (minimum cost f1) and B to
the one who is quickest (minimum
waiting time f2).
Pareto optimum solutions correspond to the AB part of the contour, C might be a good choice.
Point D is not Pareto-optimal, it is both dearer and slower than, e.g., C.
Conclusion: don’t put up with D!
Do you always get what you pay for?
Not always, only if you are choosing from the Pareto optimum set of solutions
You need to optimise to get there!
How does optimisation relate to saving the planet?
In a variety of ways:
• Reduction in the use of natural resources (oil, gas, metals, etc.)
• Reduction of the environmental impact of various activities (production, travel, etc.)
• Development of technologies for mitigation of natural and man-made disasters
• Freeing up budgets for the use on environmental issues
Don’t confuse optimisation with CATNAP!
Cheapest Available Technology Narrowly Avoiding Prosecution
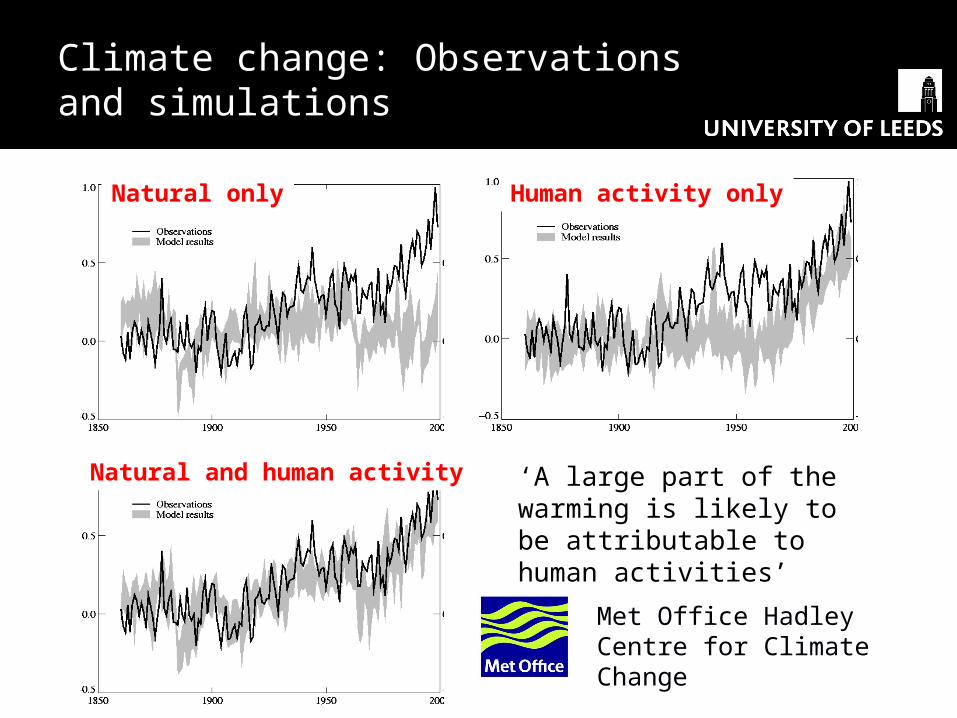
‘A large part of the warming is likely to be attributable to human activities’
Natural only Human activity only
Climate change: Observations and simulations
Met Office Hadley Centre for Climate Change
Natural and human activity
An unlikely Eco-warrior
Honda F1 goes green!
Honda F1 “Earth Car”
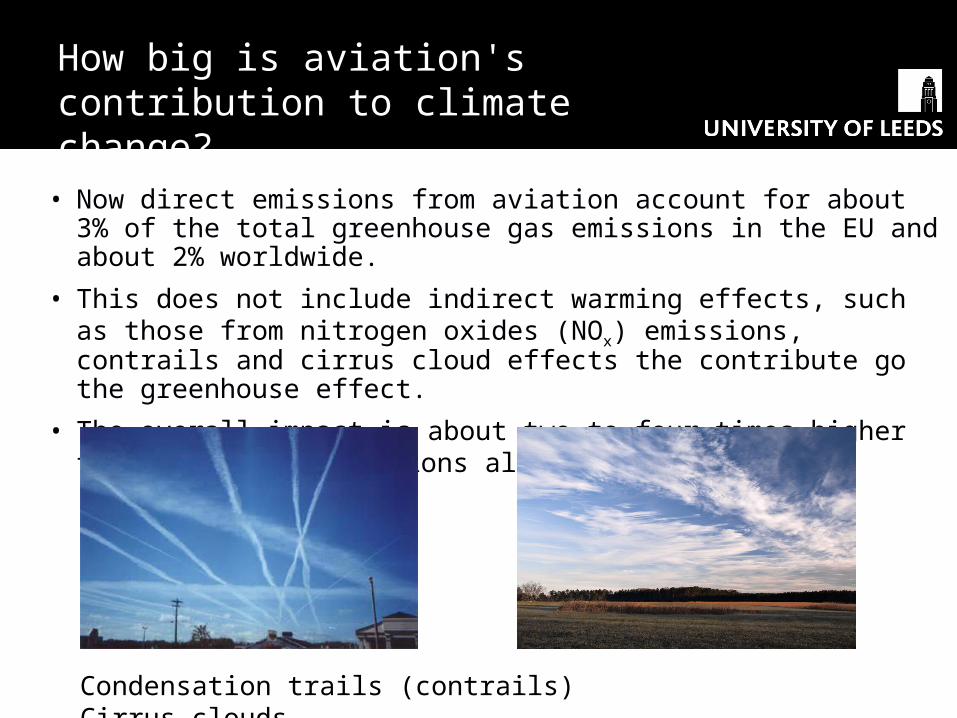
How big is aviation's contribution to climate change?
• Now direct emissions from aviation account for about 3% of the total greenhouse gas emissions in the EU and about 2% worldwide.
• This does not include indirect warming effects, such as those from nitrogen oxides (NOx) emissions, contrails and cirrus cloud effects the contribute go the greenhouse effect.
• The overall impact is about two to four times higher than of its CO2 emissions alone.
Condensation trails (contrails) Cirrus clouds
How big is aviation's contribution to climate change?
• EU emissions from international aviation have increased by 87% since 1990 as air travel becomes cheaper. This is faster than in any other sector.
• Someone flying from London to New York and back generates the same level of emissions as the average family by heating their home for a whole year.
• By 2020, aviation emissions are forecast to more than double from present levels.
Air travel is cheaper than ever before
Greenpeace: “Binge flying”
EU blueprint for aeronautics research
The Advisory Council for Aeronautics Research in Europe (ACARE) includes EU aeronautics industry, Member States, the Commission, Eurocontrol, research centres, airlines, regulators and European users.
11 November 2002: The Strategic Research Agenda in Aeronautics fully endorsed. It will serve as a blueprint in the planning of national and EU research programmes.
EU Strategic Research Agenda in Aeronautics
The Strategic Research Agenda in Aeronautics aims, by the year 2020, to achieve
• 50% cut in CO2 and 80% in NOx emission
• Fivefold reductions in accidents
• Reduction of noise by 50%
• Increased punctuality: 99% of all flights arriving and departing within 15 minutes of schedule
ACARE: The objectives are not achievable without important breakthroughs, in both technology and in concepts of operation - evolutions of current concepts will not be sufficient.
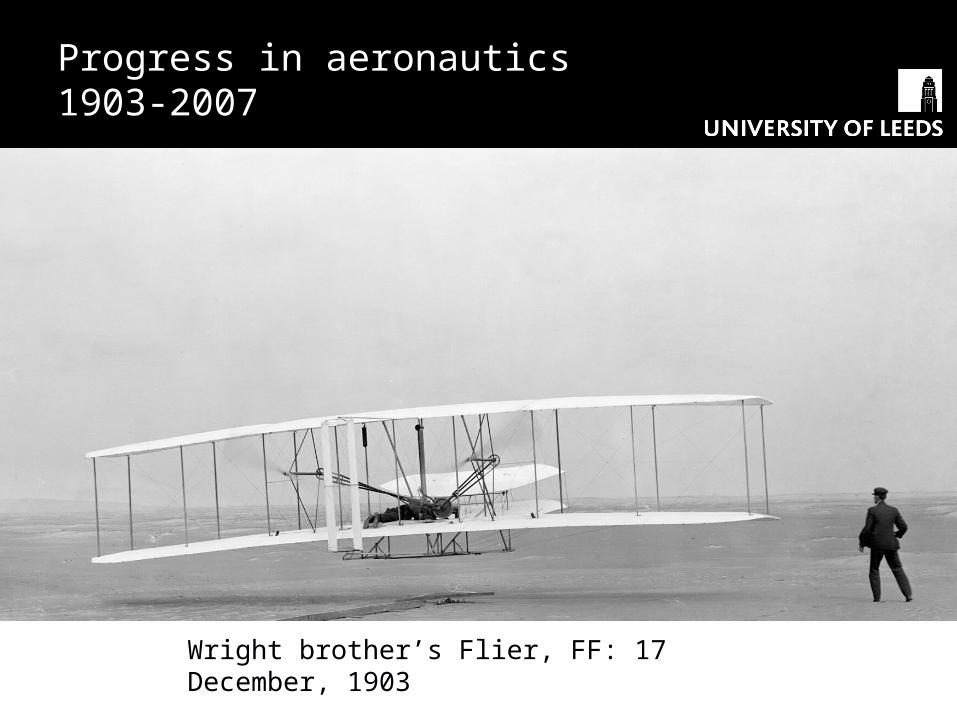
Wright brother’s Flier, FF: 17 December, 1903
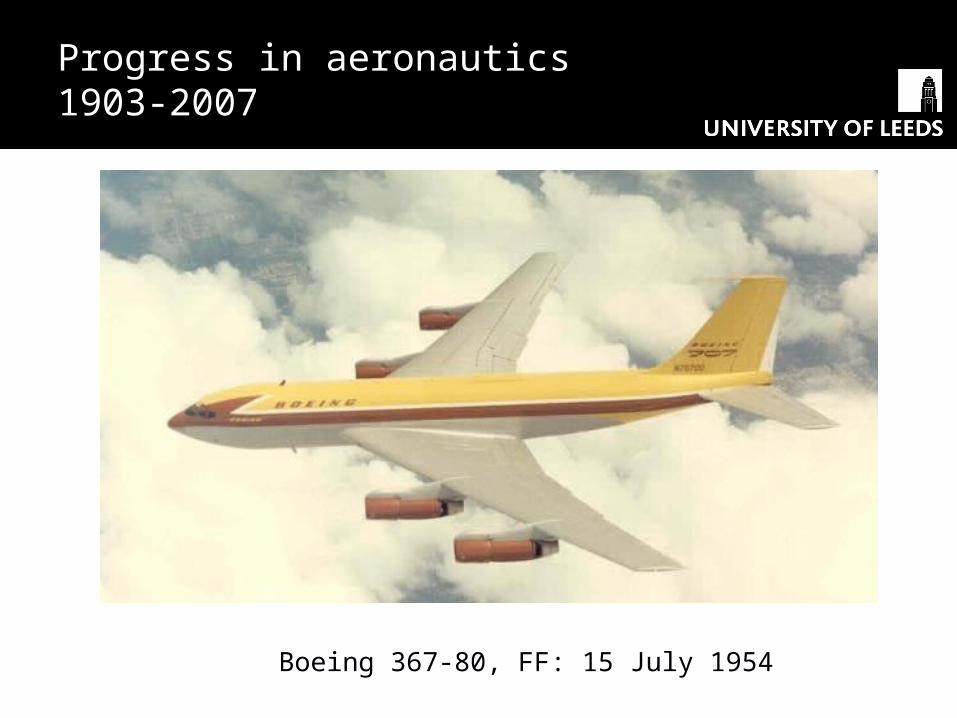
Progress in aeronautics 1903-2007
Boeing 367-80, FF: 15 July 1954
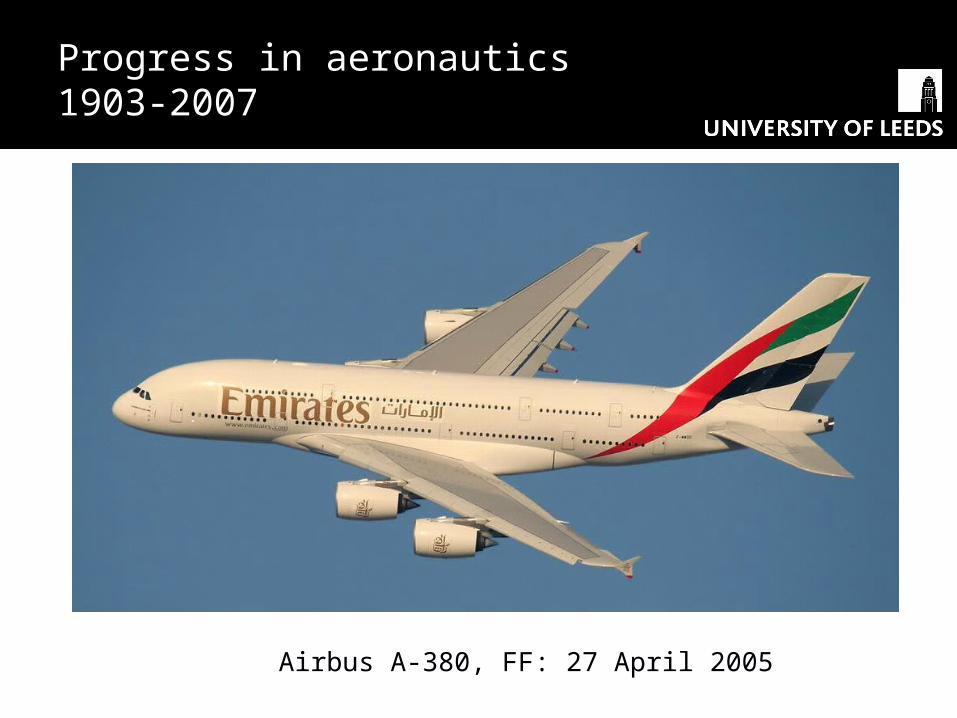
Progress in aeronautics 1903-2007
Airbus A-380, FF: 27 April 2005
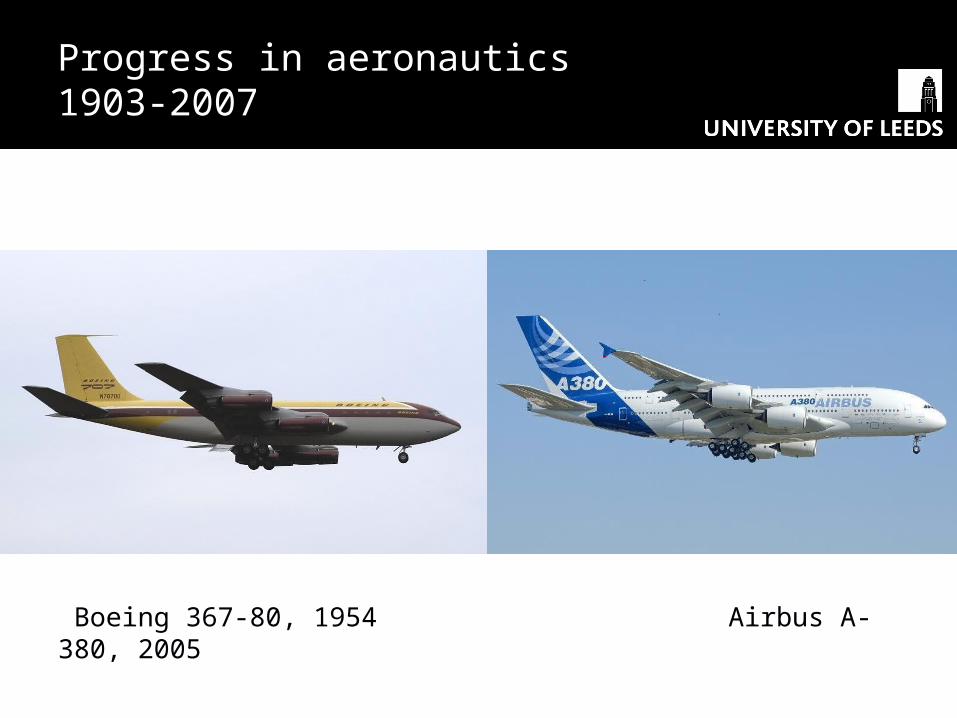
Progress in aeronautics 1903-2007
Boeing 367-80, 1954 Airbus A-380, 2005
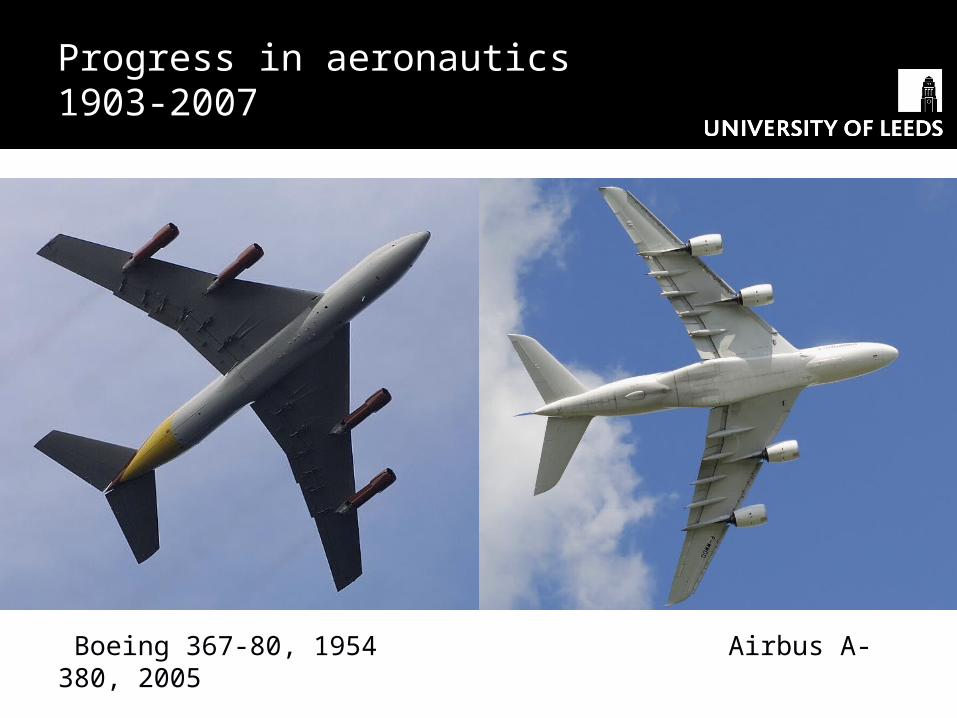
Progress in aeronautics 1903-2007
Boeing 367-80, 1954 Airbus A-380, 2005
Progress in aeronautics 1903-2007
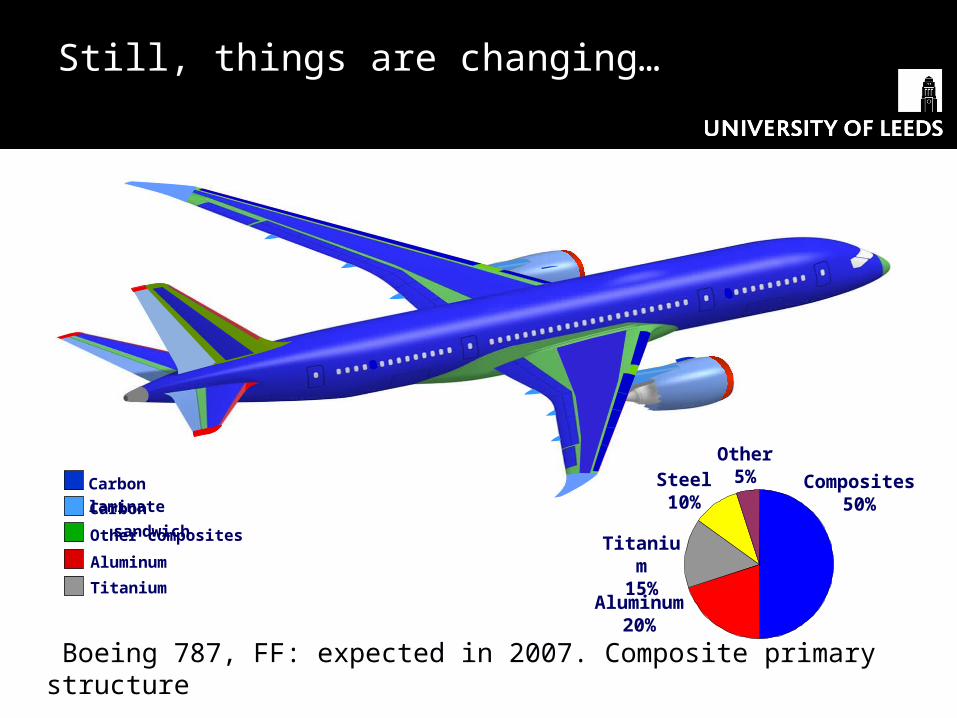
787-8
Carbon sandwich
Carbon laminate
Other composites
Aluminum
Titanium
CFRP 43%
Misc. 9%
Composites50%
Aluminum20%
Titanium15%
Steel10%
Other5%
Still, things are changing…
Boeing 787, FF: expected in 2007. Composite primary structure
Back to the future?
Cryogenic (hydrogen as fuel) aircraft.
Tupolev 155 (FF 15 April 1988)
Starboard engine: experimental hydrogen–powered NK-88. Hydrogen tank of 17.5 m3 capacity in the aft part of the fuselage.
Back to the future - II
Liquefied Natural Gas (LNG)-powered Tupolev 156 (FF 18 January 1989)
Starboard engine: experimental LNG–powered NK-88. Tupolev 156 has made over 100 test flights.
DASA-Tupolev Cryoplane concept based on A-310 (1990-1993)
EADS-Tupolev demonstrator aircraft based on Do-328 (1995-1998)
Challenges
Alternative fuel advantages
• Reduction of emissions, especially for H2
Alternative fuel challenges
• Large volumes are necessary to store liquefied fuels (4 times more for H2)
• Cryogenic tanks are heavier
• Increase in drag of the airframe
• Possible safety issues
• Contrail increase
• New infrastructure to be built
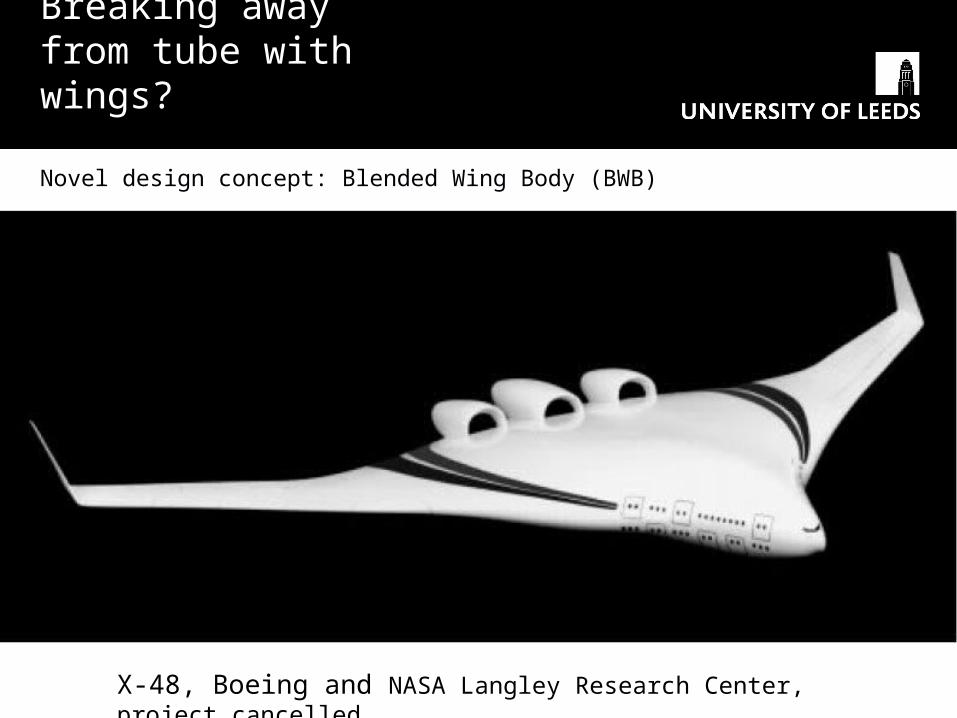
Breaking away from tube with wings?
Novel design concept: Blended Wing Body (BWB)
X-48, Boeing and NASA Langley Research Center, project cancelled
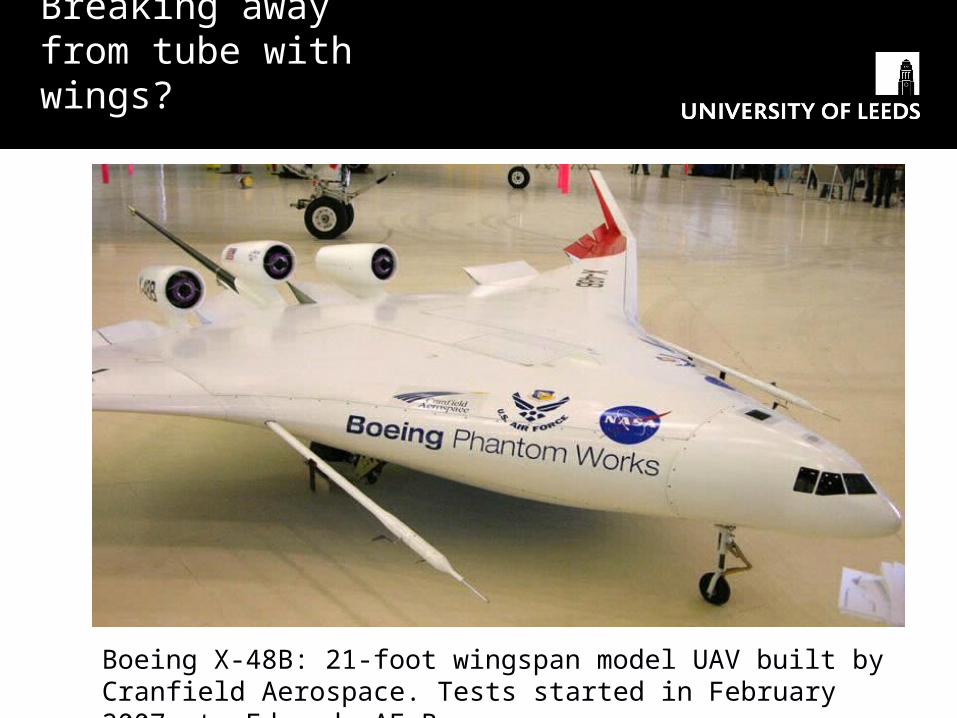
Breaking away from tube with wings?
Boeing X-48B: 21-foot wingspan model UAV built by Cranfield Aerospace. Tests started in February 2007 at Edwards AF Base.
Breaking away from tube with wings?
BWB advantages
• Improved fuel economy
• Reduced noise impact if engines placed above the wings
BWB challenges
• More difficult to control
• Greater strength needed to maintain internal pressure, compared to tube-shaped body
• Most of the passengers will not be able to see a window
• Passengers more affected by acceleration as a result of a steep turn
• Emergency evacuation can be problematic
Grand challenges ahead
It is very likely that the pressure for a greener aircraft will result in a dramatic change of the aircraft design concept in near(-ish) future
• Very likely that BWB concept will be seriously examined
• Alternative fuels will bring new demands to the design concepts
• Ever greater use of new materials
This will be a major challenge for multidisciplinary optimisation!
Grand challenges ahead
Possibly, the pressure for a greener aircraft would push the civil aviation development as hard as the stealth technology pushed the development of military aircraft.
The fitness function defines how good a particular design is
Darwin's principle of survival of the fittest: evolution is performed by breeding the population of individual designs over a number of generations
• crossover combines good information from the parents
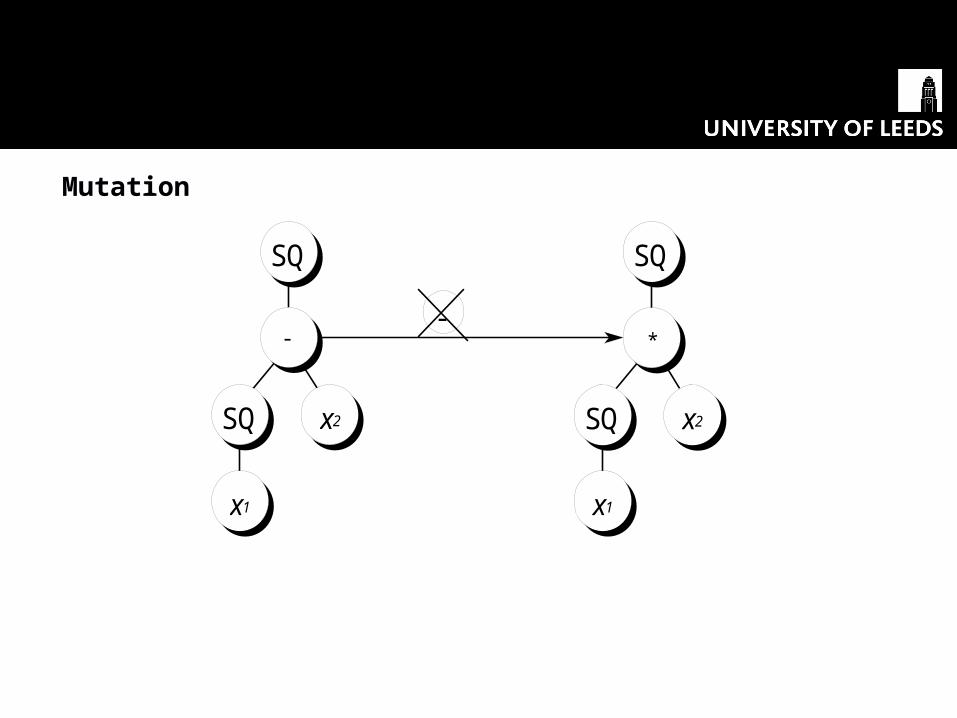
• mutation prevents premature convergence
Genetic Algorithm basics
Randomised
Biased towards the fittest members of population
Selection
Reproduction
Mating
• creating a new chromosome (child) from two current chromosomes (parents)
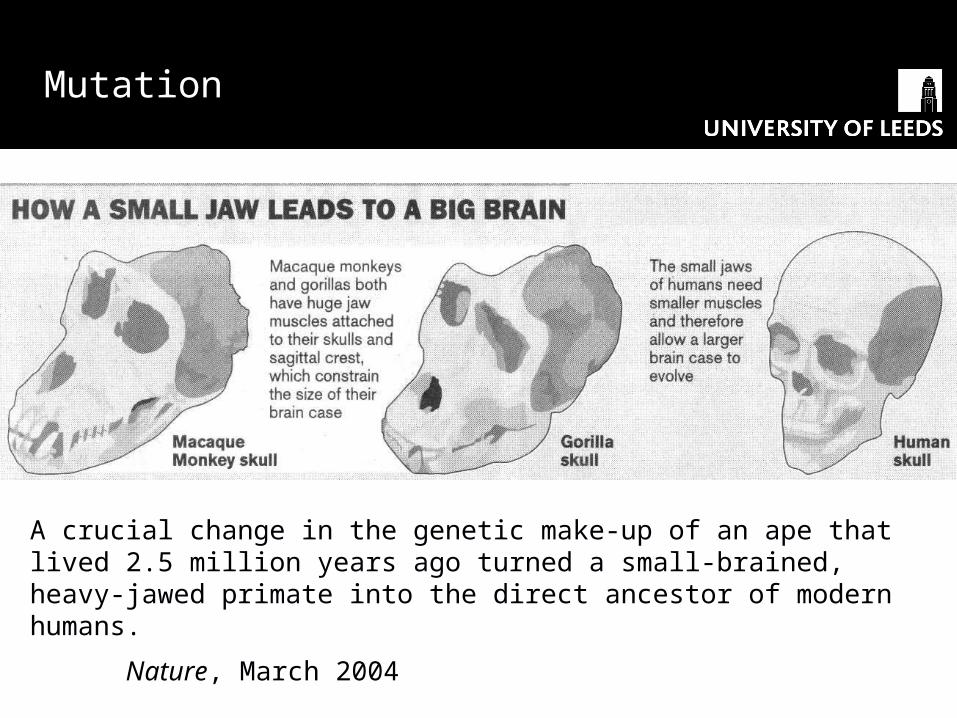
A crucial change in the genetic make-up of an ape that lived 2.5 million years ago turned a small-brained, heavy-jawed primate into the direct ancestor of modern humans.
Nature, March 2004
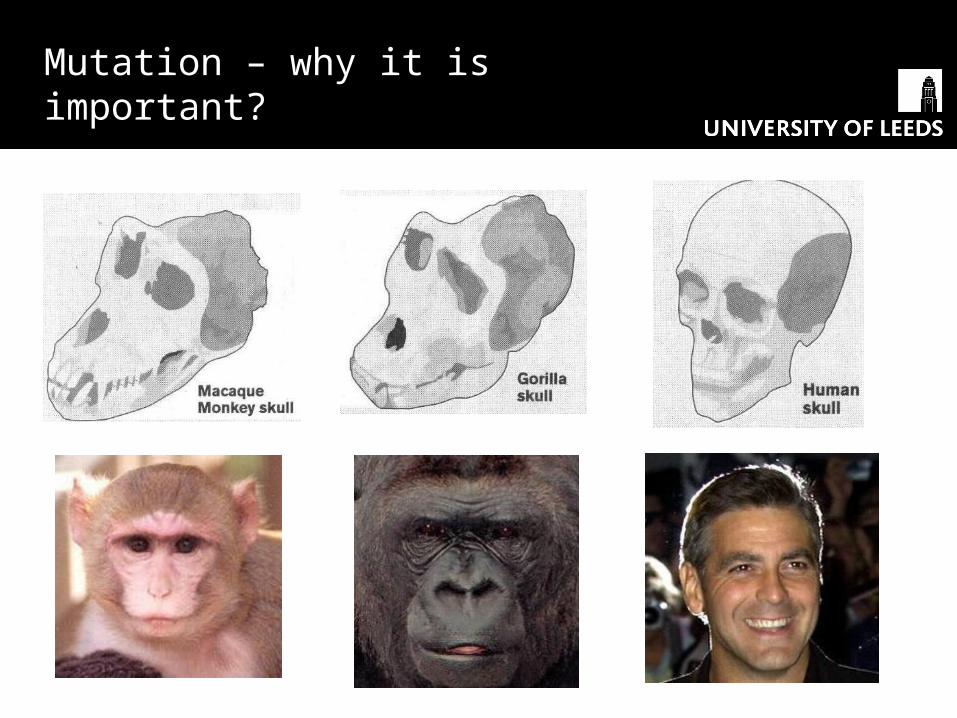
Mutation
Mutation – why it is important?
Evolutionary mechanism of the Genetic Algorithm
G eneticS earch
F itn ess
S e lec tio n
R ep ro d u c tio nC ro sso v e r
M u ta tio n
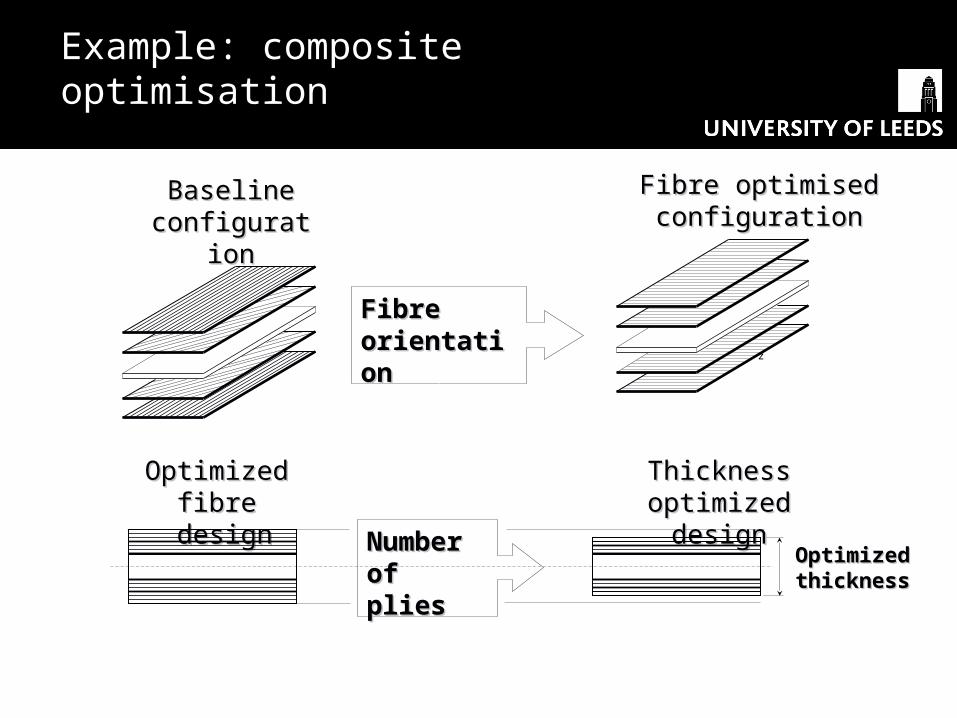
patch 1patch 2
patch 3
patch 5
patch 4
patch 11patch 12 patch 13
patch 14
patch 15
• The wing was split into patches
• Each patch was optimized for number of plies and ply orientation
Case StudiesF1 Jaguar Racing Wing
Aerodynamic loading FIA 50kg point loading
Load Cases Applied
• Successfully optimized wing structure for ply orientation and number of plies
• Final mass of front wing reduced to 4.9kg
• Mass reduction of 15%
• Provided important ply orientation information to Jaguar Racing
4.9
5.1
5.3
5.5
5.7
5.9
Generations
Mas
s (K
g)
Front Wing Optimization Results
Can we afford not to optimise?
Not really, the pressures are too great
Optimise or else…
If it is so good, why don’t we all do it all the time?
Because it is not easy!
There are serious issues to address.
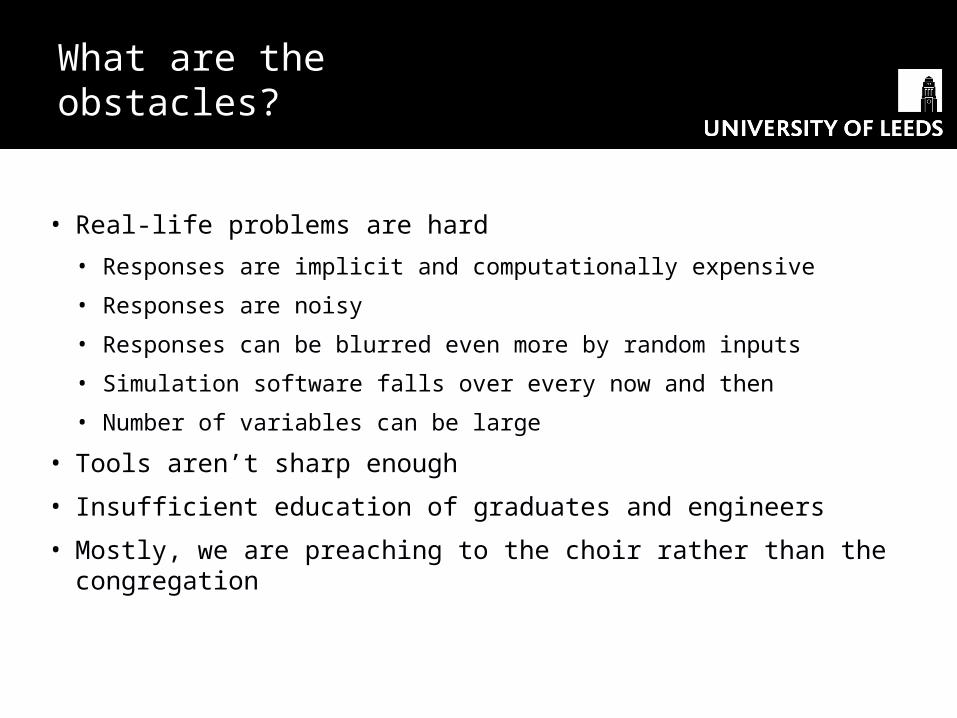
• Real-life problems are hard
• Responses are implicit and computationally expensive
• Responses are noisy
• Responses can be blurred even more by random inputs
• Simulation software falls over every now and then
• Number of variables can be large
• Tools aren’t sharp enough
• Insufficient education of graduates and engineers
• Mostly, we are preaching to the choir rather than the congregation
What are the obstacles?
Computationally expensive and noisy
The start: Computers of the 1970-80s
BESM-6 (1965-1995): 1 Mflop, 32K word RAM, 48 bit word
Linking an optimizer to a simulation model would take a prohibitive amount of computing time
Even if all the computing might is available, convergence of optimization could be affected by numerical noise and domain-dependent calculability
Challenge
High costs of failure: need to know risks
Uncertainties always exist in real life
• Material tolerances
• Environment conditions
• Production tolerances
Deterministic simulation has to be followed by extensive testing to account for uncertainties
Alternative: include uncertainties in simulation
Stochastic analysis
If something's hard to do,
then it's not worth doing!
Homer Simpson
Doing something else?
If the problem “as is” is too hard, use an approximation (=metamodel, = surrogate model) of the given function by a function with required properties (smooth, cheaper to compute, etc.).
Check the approximation quality, if insufficient, refine.
Use approximations!
Metamodels should allow to:
• minimize the number of response evaluations
• reduce the effect of numerical noise – recognise: is it a trend?
Is it a blip?
• If necessary, metamodels can be built in a smaller subregions of the whole design space (trust regions) that are panning and zooming onto the solution
Metamodelling for design optimization
• Similarly to design optimization, the following process for the stochastic analysis has been suggested:
• Build a metamodel
• Check its quality on the independent data set, if quality is not acceptable then refine metamodel
• Run Monte Carlo simulation of a sufficient sampling size on the metamodel
Metamodelling for stochastic analysis
Sampling according to some Designs of Experiments (DOEs) is needed:
• to build a metamodel
• and also to check the metamodel
DOEs for metamodel building
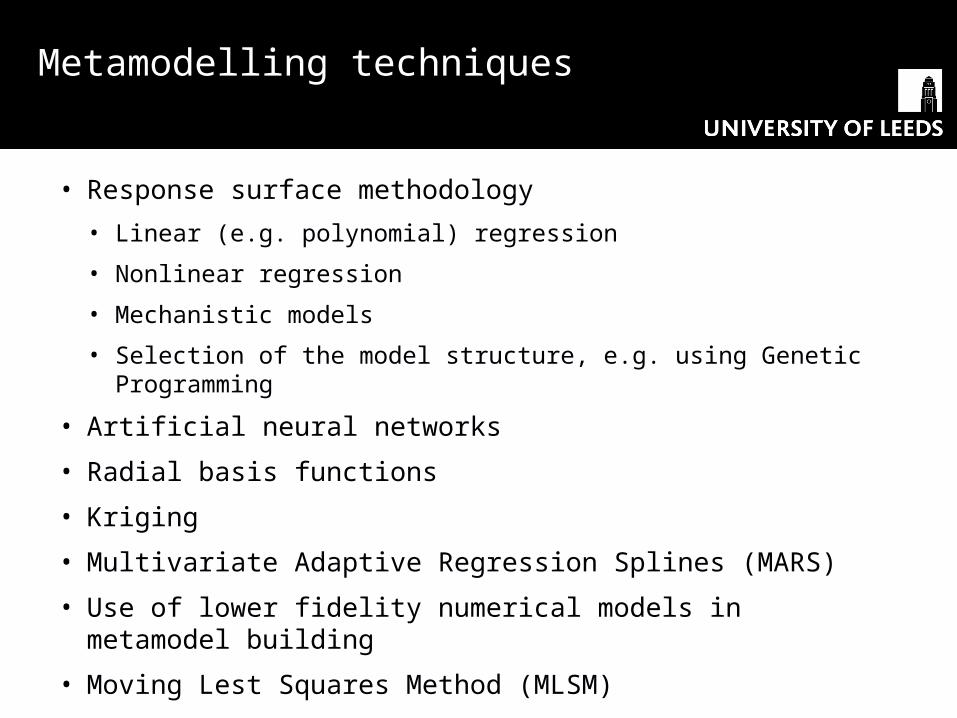
• Response surface methodology
• Linear (e.g. polynomial) regression
• Nonlinear regression
• Mechanistic models
• Selection of the model structure, e.g. using Genetic Programming
• Artificial neural networks
• Radial basis functions
• Kriging
• Multivariate Adaptive Regression Splines (MARS)
• Use of lower fidelity numerical models in metamodel building
• Moving Lest Squares Method (MLSM)
• etc.
Metamodelling techniques
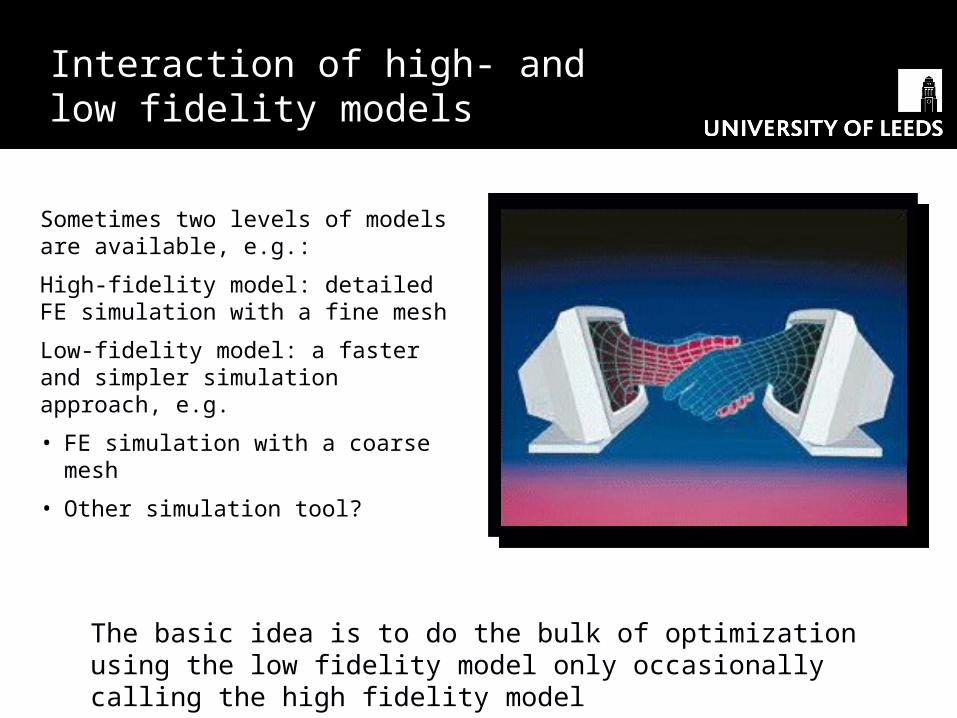
Sometimes two levels of models are available, e.g.:
High-fidelity model: detailed FE simulation with a fine mesh
Low-fidelity model: a faster and simpler simulation approach, e.g.
• FE simulation with a coarse mesh
• Other simulation tool?
The basic idea is to do the bulk of optimization using the low fidelity model only occasionally calling the high fidelity model
Interaction of high- and low Interaction of high- and low fidelity modelsfidelity models
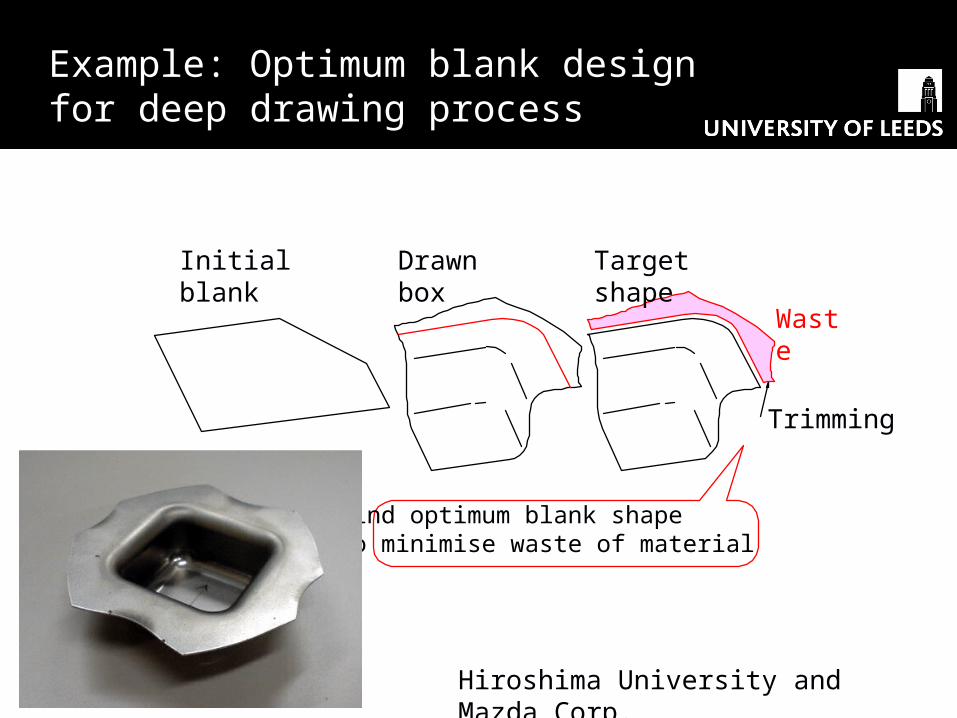
Initial blank Drawn box Target shape
Trimming
Find optimum blank shapeto minimise waste of material
Example: Optimum blank design for deep drawing process
Waste
Hiroshima University and Mazda Corp.
Example of stamping simulation
High-fidelity model (Fine mesh)Elements: 1100Time: 150 sec.
FEM: PAM-STAMP
Low-fidelity model (Coarse mesh)Elements: 120Time: 10 sec.
High- and low-fidelity models
FEM: PAM-QUIKSTAMP
Result:• high-fidelity model only: 1040 min, • interaction with low-fidelity model: 155 min.
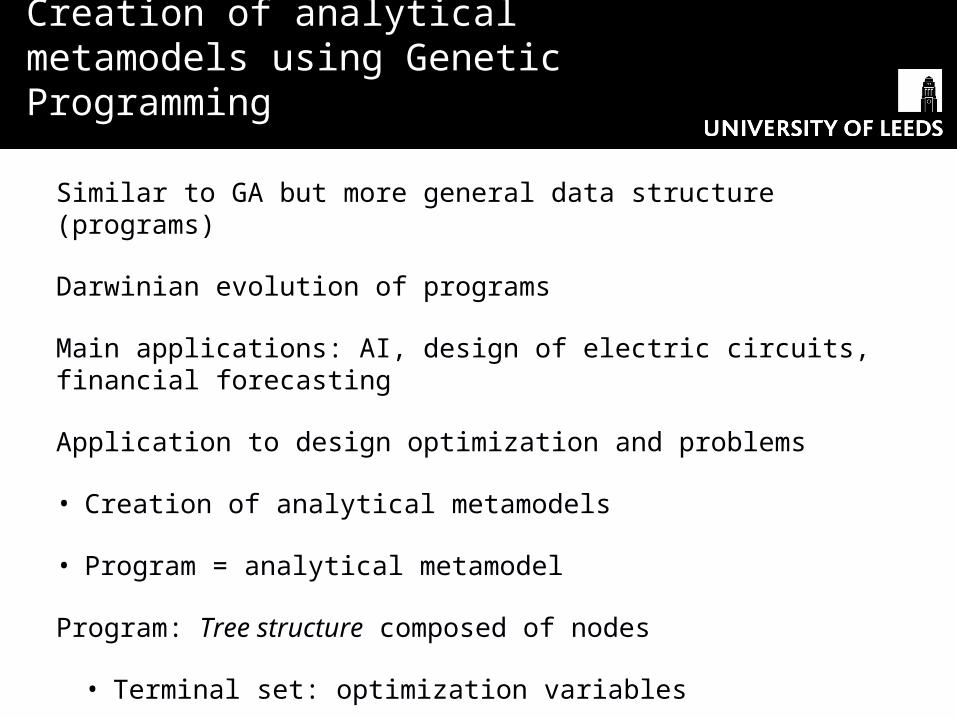
Similar to GA but more general data structure (programs)
Darwinian evolution of programs
Main applications: AI, design of electric circuits, financial forecasting
Application to design optimization and problems
• Creation of analytical metamodels
• Program = analytical metamodel
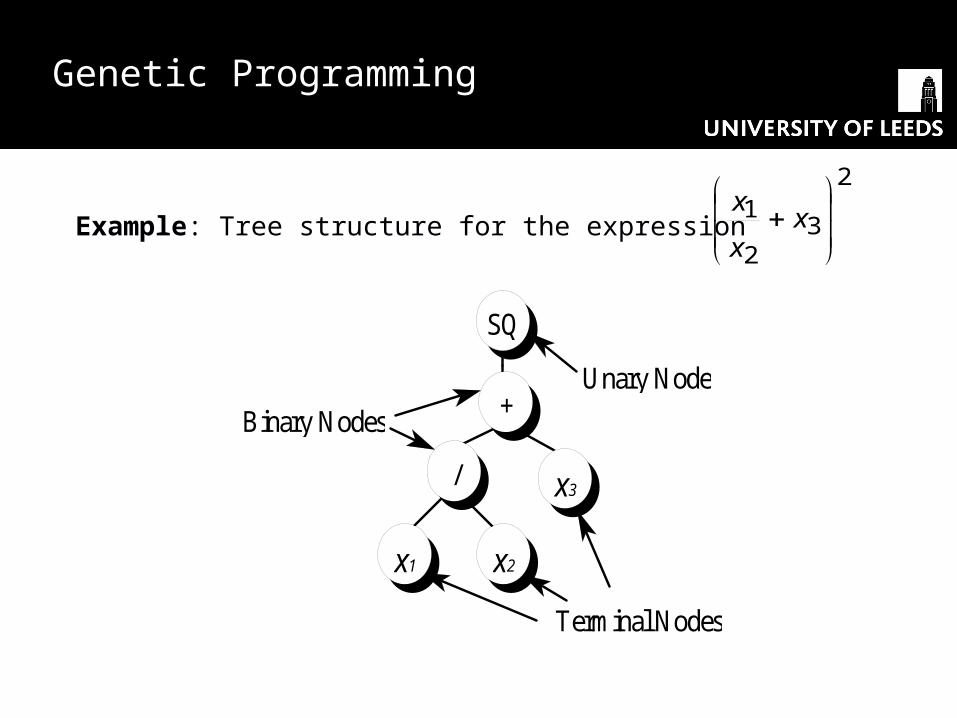
Program: Tree structure composed of nodes
• Terminal set: optimization variables
• Functional set: mathematical operators
Creation of analytical metamodels using Genetic Programming
John Koza: Genetic Programming
Genetic Programming
2
32
1
x
x
x
SQ
+
/
x1 x2
x3
Binary Nodes
Unary Node
Terminal Nodes
Example: Tree structure for the expression
Genetic Programming
Genetic operators:
•Selection
•Crossover
•Mutation
•Elite transfer
Genetic Programming
Crossover +
* /
SQ SQx1
x2
x2
x1
SQ
+
SQ x2
x1
+
*
SQx1
x2
SQ
x1
SQ
+
x2/
SQx2
x1
PARENT 1 PARENT 2
OFFSPRING 1 OFFSPRING 2
Genetic Programming
Mutation
-
SQ
-
SQ
x1
x2
SQ
*
SQ
x1
x2
*/+{ }
Genetic Programming
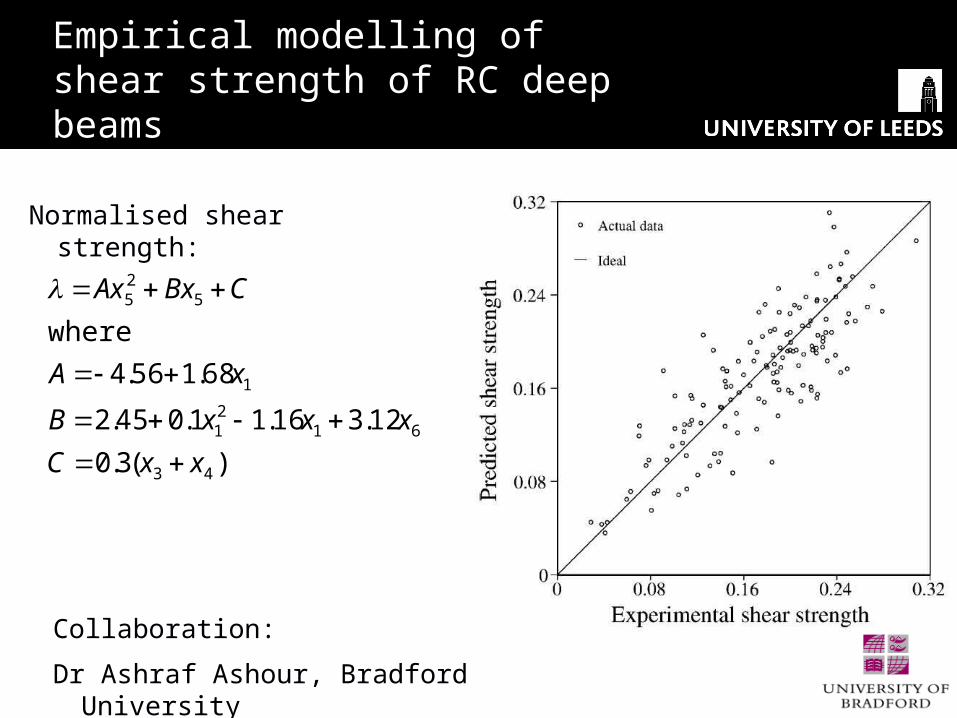
Empirical modelling of shear strength of RC deep beams
Find: normalised shear strength using experimental data
Variables:
• Shear span to depth ratio x1
• Beam span to depth ratio x2
• Smeared vertical web reinforcement ratio x3
• Smeared horizontal web reinforcement ratio x4
• Main longitudinal bottom reinforcement ratio x5
• Main longitudinal top reinforcement ratio x6
• The design of RC deep beams is not covered by BS 8110 that states, ‘‘for the design of deep beams, reference should be made to specialist literature’’.
Empirical modelling of shear strength of RC deep beams
Normalised shear strength:
)(3.0
12.316.11.045.2
68.156.4
43
6121
1
525
xxC
xxxB
xA
CBxAx
where
Collaboration:
Dr Ashraf Ashour, Bradford University
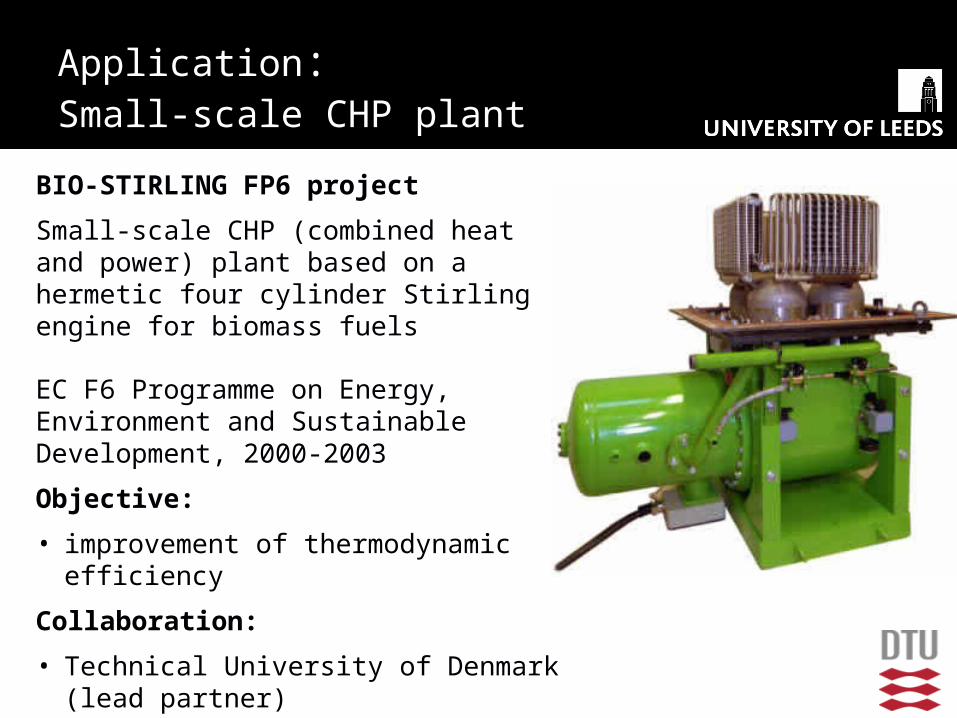
BIO-STIRLING FP6 project
Small-scale CHP (combined heat and power) plant based on a hermetic four cylinder Stirling engine for biomass fuels
EC F6 Programme on Energy, Environment and Sustainable Development, 2000-2003
Objective:
• improvement of thermodynamic efficiency
Collaboration:
• Technical University of Denmark (lead partner)
• Partners from Austria, Denmark, Germany
Application: Small-scale CHP plant
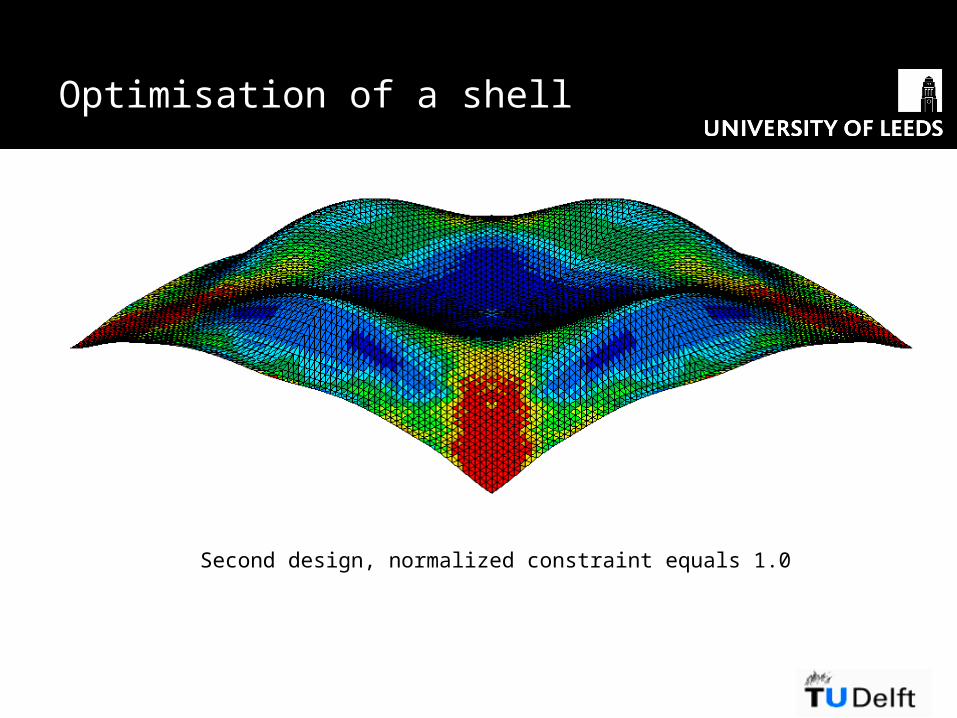
A shell loaded by a uniform load is defined by a square reference plan.
Design variables: out-of-plane coordinates and slopes at the keypoints (12 in total)
Objective: minimization of the maximum displacement
Constraint: volume no greater than prescribes value
Collaboration:
• TU Delft
Application: Optimisation of a shell
First design, normalized constraint equals 1.0
Optimisation of a shell
Second design, normalized constraint equals 1.0
Optimisation of a shell
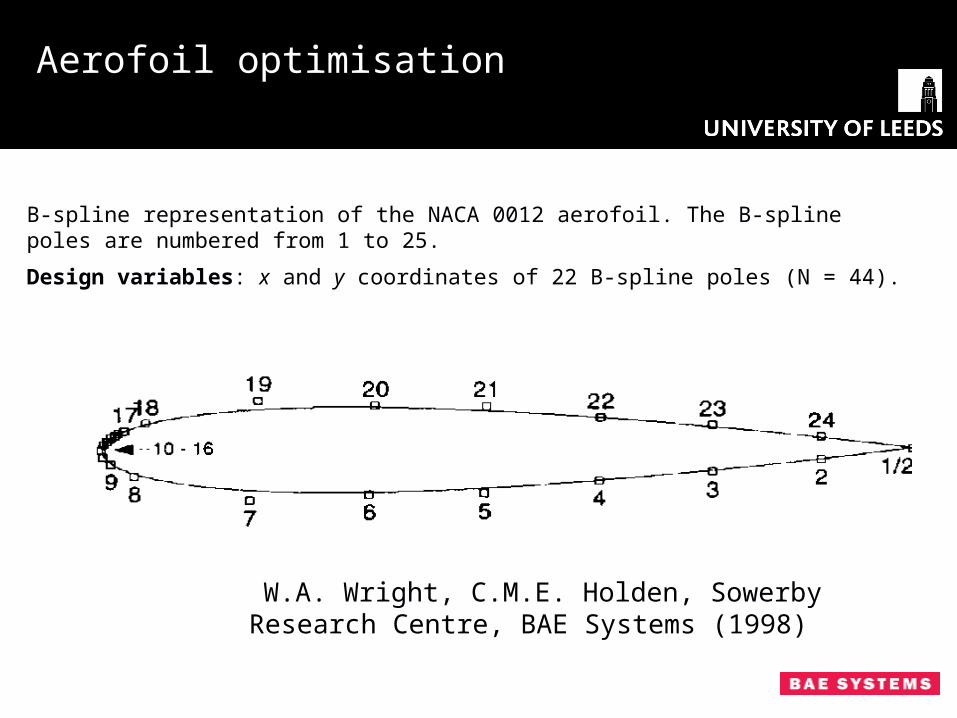
B-spline representation of the NACA 0012 aerofoil. The B-spline poles are numbered from 1 to 25.
Design variables: x and y coordinates of 22 B-spline poles (N = 44).
W.A. Wright, C.M.E. Holden, Sowerby Research Centre, BAE Systems (1998)
Aerofoil optimisation
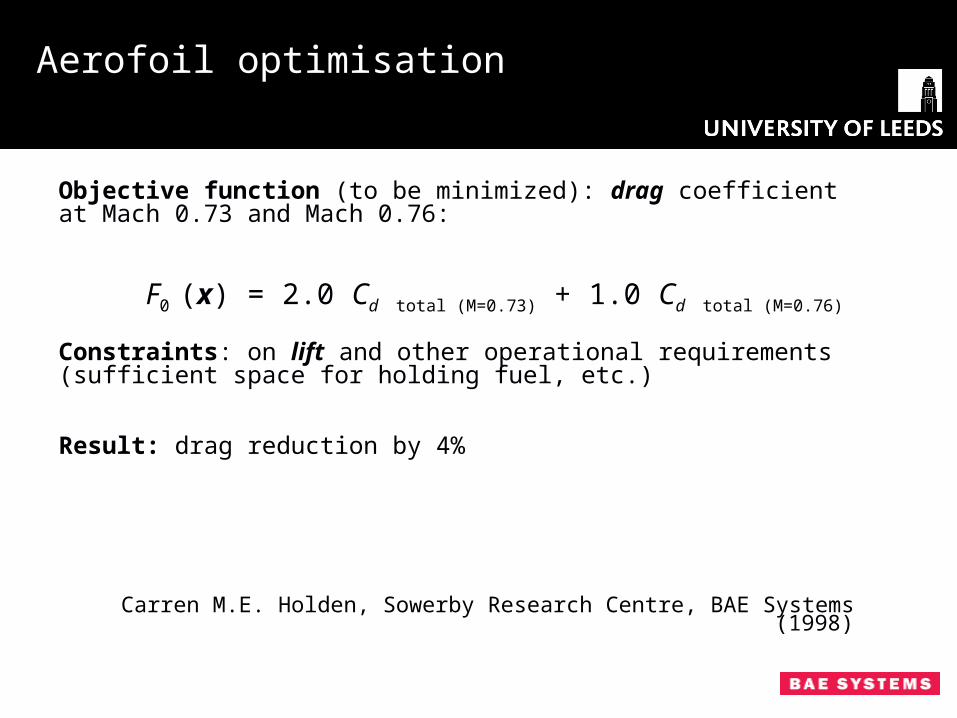
Objective function (to be minimized): drag coefficient at Mach 0.73 and Mach 0.76:
F0 (x) = 2.0 Cd total (M=0.73) + 1.0 Cd total (M=0.76)
Constraints: on lift and other operational requirements (sufficient space for holding fuel, etc.)
Result: drag reduction by 4%
Carren M.E. Holden, Sowerby Research Centre, BAE Systems (1998)
Aerofoil optimisation
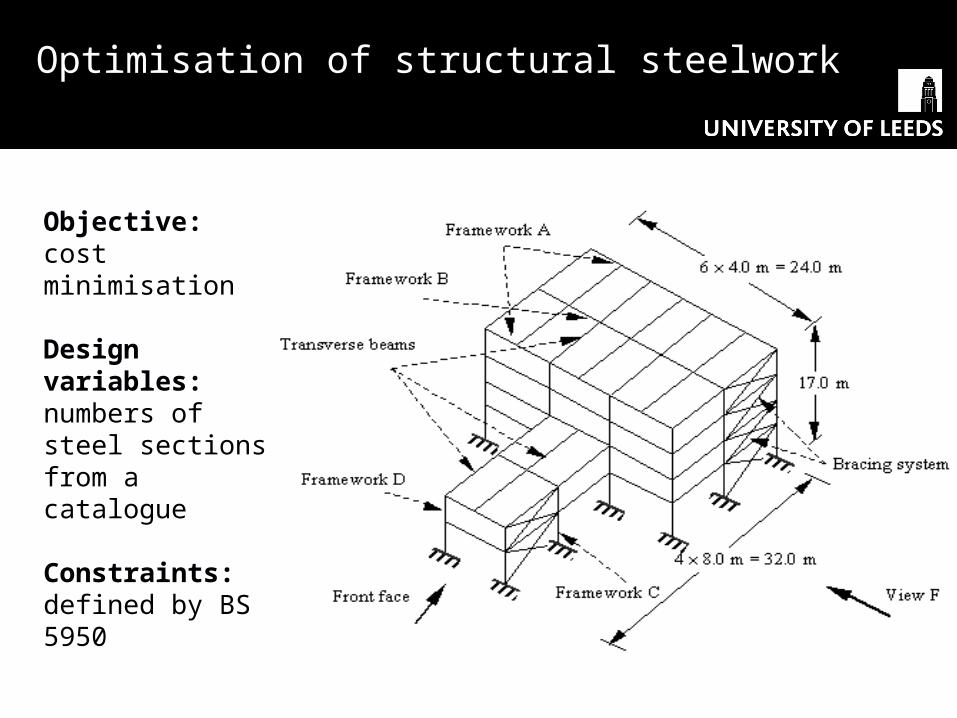
Objective: cost minimisation
Design variables: numbers of steel sections from a catalogue
Constraints: defined by BS 5950
Optimisation of structural steelwork
ESA Aurora exploration programme
240kg mobile robotic exo-biology laboratory
To search for extinct or extant microbial life on Mars
Supporting geology and meteorology experiments
Launch by Ariane 5 or Soyuz in 2013
Currently in Phase B – mission planning and concept design phase
ExoMars space mission
Un-vented type (inflatable ball)
• Multiple bounces
• Established heritage (from Luna-9 in 1966)
• High mass
• Vulnerable to rupture
Mars Pathfinder (NASA/JPL) Beagle 2 (Beagle 2)
Luna 9 (USSR Space Program)
Airbags for space landers
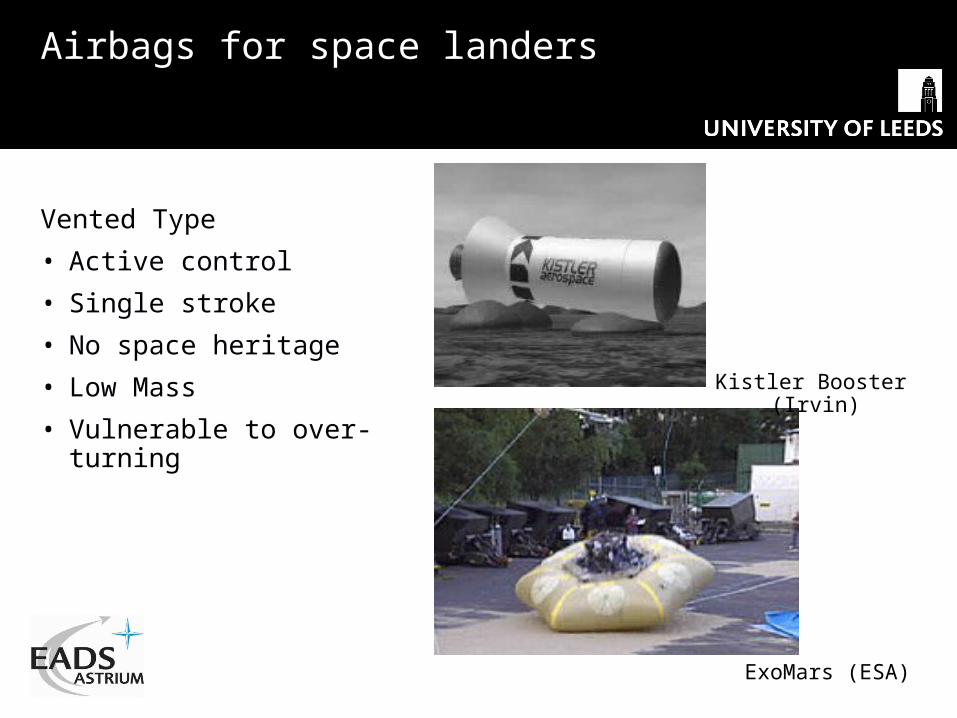
Vented Type
• Active control
• Single stroke
• No space heritage
• Low Mass
• Vulnerable to over-turning
ExoMars (ESA)
Kistler Booster (Irvin)
Airbags for space landers
Design concept considers vented (or “Dead-Beat”) airbag coming to rest on second bounce
Inflated with N2 during descent under main parachute
Stowed rover mounted to platform
Vent patches activated by pyrotechnic cutters
Simple reactive vent control system: simultaneous all-vent trigger at 65g
Airbag landing design concept
Six identical vented chambers
One “anti-bottoming” un-vented toroidal
Airbag configuration
Study objectives
Develop methodology for optimisation and probabilistic reliability assessment of vented airbags
Key requirements:
• No overturning
• Payload acceleration below 70g
• No airbag rupture
Key questions:
• What is the mass of an optimized vented airbag?
• What is the probability of a successful landing?
• What is the sensitivity of landing reliability to changing landing scenarios?
Two landing scenarios – Flat bottom and Inclined rock impacts
Mars environment:• Gravity 3.7 m/s2 = 0.38g
• Pressure 440Pa = 0.4% of Earth air pressure at sea level
= at 36.5 km altitude on Earth
• Temperature 187K = - 86º C
Landing scenarios
All requirements are satisfied by the baseline design
Baseline design: Flat bottom impact
Baseline design: deceleration 980g (target <70g)
Baseline design: Inclined rock impact
ExoMars Lander: LS-DYNA simulation
Optimisation results
• Mass increased by 2.7%• Flat Bottom Impact payload acceleration increased remained below 70g• Rock Impact payload acceleration reduced from 980g to 69g
Reliability assessment of ExoMars lander
Reliability study gives the probability of a successful landing for a given design under a range of conditions of landing, such as
• the wind speed
• terrain roughness
• pitch attitude at impact
• pitch rate at impact
European Mars Climate Database (EMCD) - general circulation model
45N to 45S latitudes
Season 12
Mars Global Surveyor dust loading scenario
PDF fit to EMCD model data
Rayleigh distribution
Mean Resultant Wind Speed
0
100
200
300
400
500
600
700
800
900
1000
0.0
1.0
2.0
3.0
4.0
5.0
6.0
7.0
8.0
9.0
10.0
11.0
12.0
13.0
14.0
15.0
16.0
17.0
18.0
19.0
20.0
21.0
22.0
23.0
24.0
25.0
26.0
27.0
28.0
29.0
Wind Speed (m/s)
Fre
qu
ency
Wind speed probability distribution
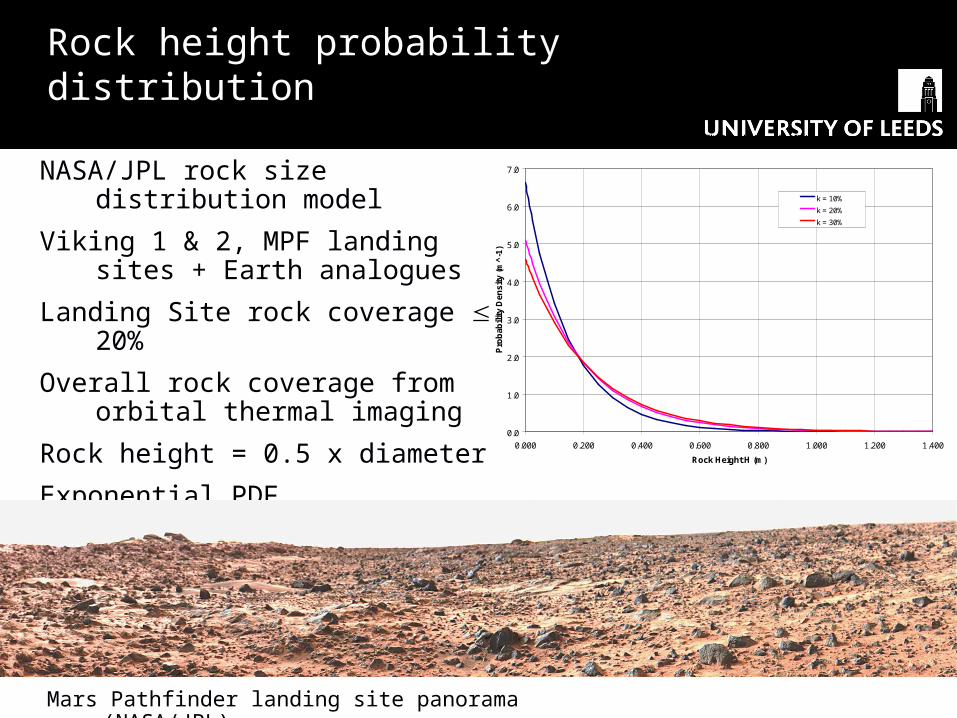
NASA/JPL rock size distribution model
Viking 1 & 2, MPF landing sites + Earth analogues
Landing Site rock coverage 20%
Overall rock coverage from orbital thermal imaging
Rock height = 0.5 x diameter
Exponential PDF
Probability Density Function f(H)
0.0
1.0
2.0
3.0
4.0
5.0
6.0
7.0
0.000 0.200 0.400 0.600 0.800 1.000 1.200 1.400
Rock Height H (m)
Pro
bab
ility
Den
sity
(m
^-1
)
k = 10%
k = 20%
k = 30%
Mars Pathfinder landing site panorama (NASA/JPL)
Rock height probability distribution
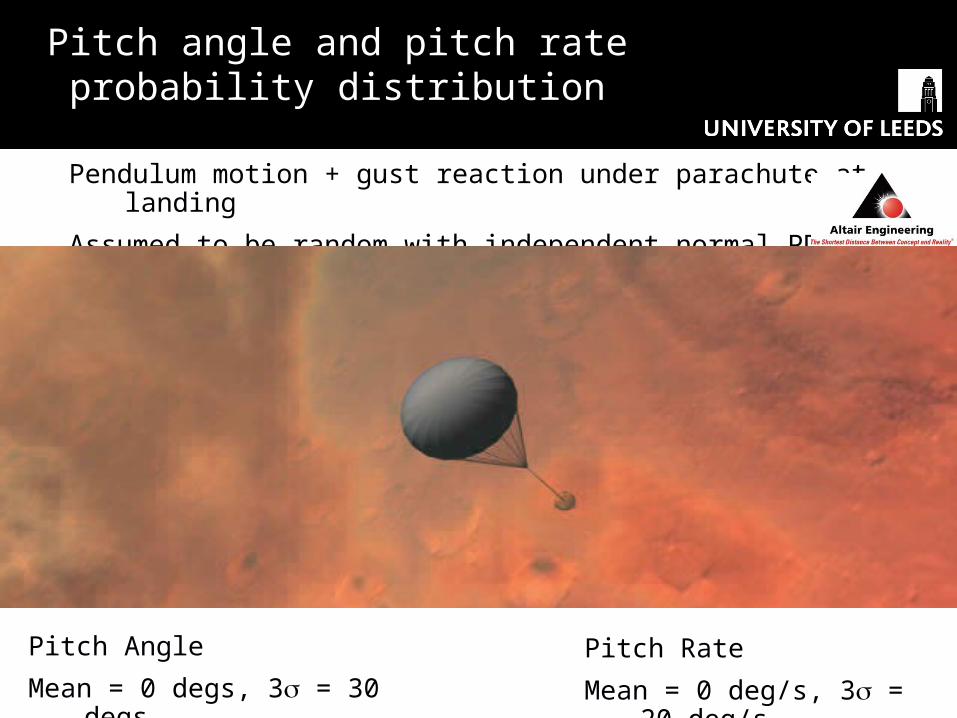
Pendulum motion + gust reaction under parachute at landing
Assumed to be random with independent normal PDFs
Pitch Angle
Mean = 0 degs, 3 = 30 degs
Pitch Rate
Mean = 0 deg/s, 3 = 20 deg/s
Pitch angle and pitch rate probability distribution
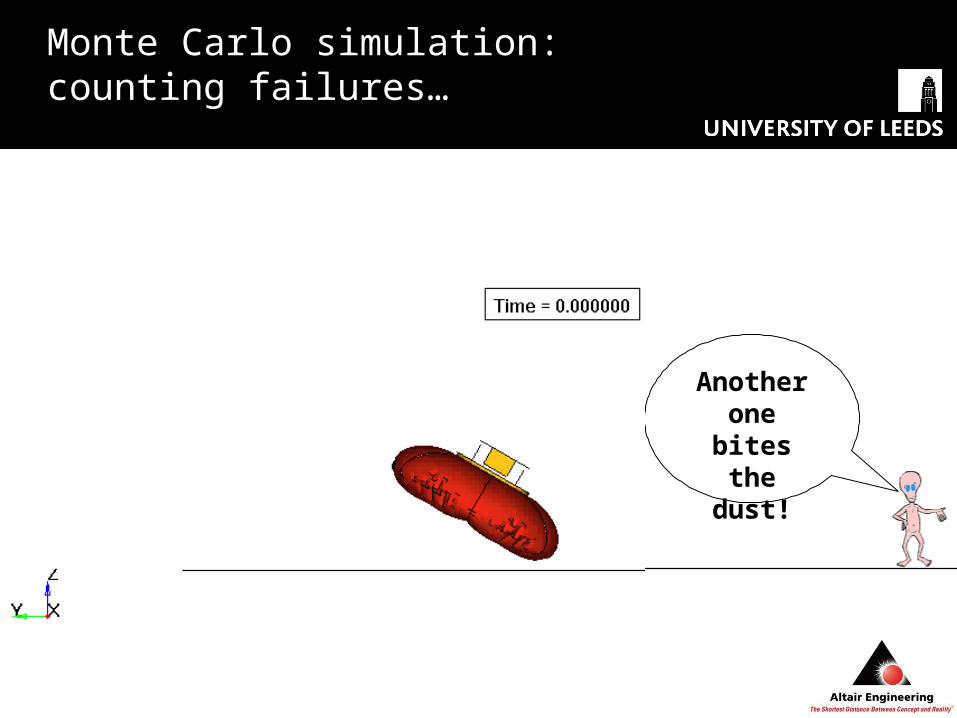
Another one bites the dust!
Monte Carlo simulation:counting failures…
Result of reliability assessment of ExoMars lander
• The optimization study arrived at a design that satisfies the requirements with only a small increase in mass
• Reliability analysis proved that the concept is viable
• Reliability analysis uncovered failure modes that had not previously been considered
• Further design improvements can be made
ExoMars Lander: LS-DYNA simulation
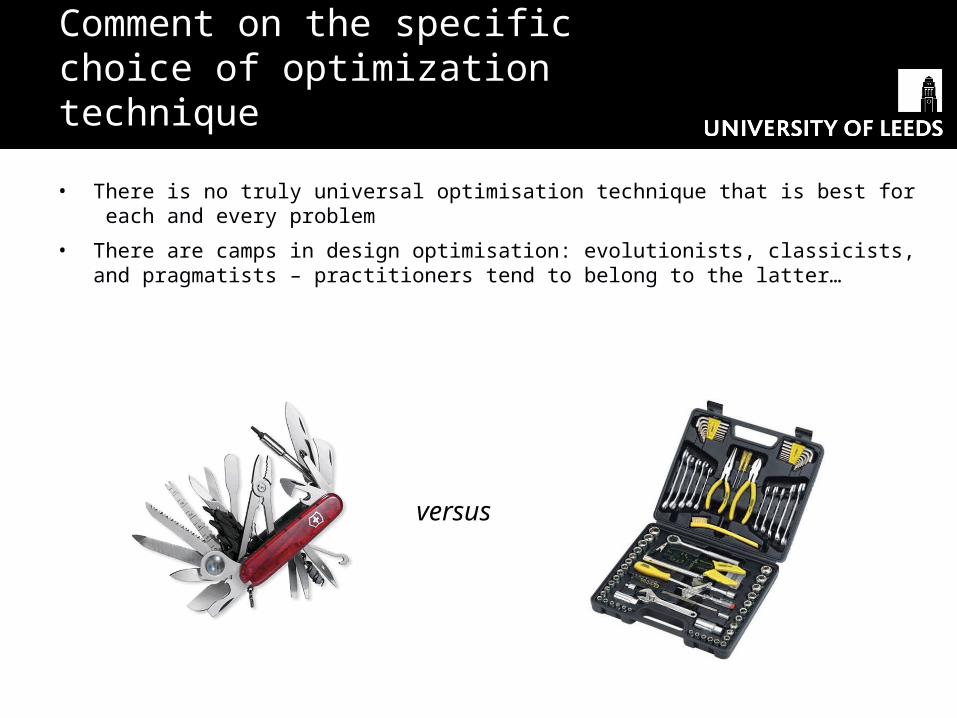
• There is no truly universal optimisation technique that is best for each and every problem
• There are camps in design optimisation: evolutionists, classicists, and pragmatists – practitioners tend to belong to the latter…
versus
Comment on the specific choice of optimization technique
• Curse of dimensionality
• Problems with non-smooth response, e.g. crashworthiness
• Problems of large-scale composite optimisation
• Large scale structural engineering problems
• CFD optimisation problems, e.g. flow control to reduce drag