Page 1
Species Diversity, Species Similarity and Shared Species of Understorey Birds at
Mount Jagoi and Mount Singai, Bau, Sarawak
Cheng Poh Leng
Bachelor of Science with Honours
(Animal Resource Science and Management Programme)
2012
Faculty of Resource Science and Technology
Page 2
Species Diversity, Species Similarity and Shared Species of Understorey Birds at
Mount Jagoi and Mount Singai, Bau, Sarawak
Cheng Poh Leng
23283
The Final Year Project is submitted in partial fulfilment of requirement for degree of
Bachelor of Science with Honours
(Animal Resource Science and Management Programme)
Faculty of Resource Science and Technology
Universiti Malaysia Sarawak
2012
Page 3
I
ACKNOWLEDGEMENT
I would like to express my special thanks of gratitude to my supervisor, Mr. Charlie Justin
Mergie Laman as well as my co-supervisor, Prof. Dr. Mustafa Abdul Rahman for their
guidances in completing this project on the topic Species Diversity, Species Similarity and
Shared Species of Understorey Birds at Mount Jagoi and Mount Singai, Bau, Sarawak. I am
grateful to Luisa Duya Anak Setia for allowing me to reanalyse the bird data of Mount Singai.
Besides, I would like to thanks to Prof. Dr. Andrew Alek Tuen, Assoc. Prof. Dr. Alexander
Kiew Sayok and Assoc. Prof. Dr. Gabriel Tonga Noweg for helping and giving me the
opportunity to conduct this study at Mount Jagoi. I would like to acknowledge the Faculty
Resource Science and Technology and Institute of Biodiversity and Environment
Conservation (IBEC) for providing necessary financial support and sampling tools to facilitate
this study.
Thanks to staff, Mr. Nasron Ahmad, Miss Rahah binti Mohd. Yakub and Mr. Mohd. Hasri Al-
Hafiz b. Haba; postgraduate students, Mary ak Buloh Balang, Bong Hsien Huon, Ik Wadell ak
Ik @ Pahon, Veronica ak Juti and Kishen Bunya; my colleagues and friends, Tay Guan
Khoon, Tham Chook Yan, Nur Shakirah bt. Kamarul Zaman, Frances Hii Dai Sze,
Puvaneswari a/p Puvanasundram, Elizabeth Lendai Anak John Herbert, Nur Mukminah bt.
Naharuddin, Nurshilawati bt. Abdul Latip, Adi Shabrani bin Mohd. Ridzuan, and those I have
no mentioned here, for their supports and encouragements. Finally, I would like to thanks the
local community of Mount Jagoi who willing to help throughout the sampling periods.
Page 4
II
DECLARATION
No portion of the work referred to in dissertation has been submitted in support of an
application for another degree of qualification of this or any other university or institution of
higher learning.
_____________________
CHENG POH LENG
Animal Resource Science and Management Programme
Faculty of Resource Science and Technology
Universiti Malaysia Sarawak
Page 5
III
TABLE OF CONTENTS
Acknowledgement………………………………………………………………………………... I
Declaration……………………………………………………………………………………….. II
Table of Contents…………………………………………………………………………………
List of Figures…………………………………………………………………………………….
List of Tables……………………………………………………………………………………..
List of Appendices………………………………………………………………………………..
Glossaries…………………………………………………………………………………………
III
IV
IV
V
V
Abstract…………………………………………………………………………………………..
1.0 Introduction and Objective.…………………………………………………………………..
1
2
2.0 Literature Review…………………………………………………….....…………………....
2.1 Related Previous Studies ………………………………………………………….....
2.2 Species Richness Estimation………………………………………………………....
2.3 Species Diversity Estimation………………………………………………………....
2.4 Shared Species Estimation …………………………………………………………...
2.5 Species Similarity Estimation………………………………………………………...
2.6 Species Prediction…………………………………………………………………….
2.7 Programs to Estimate Species Diversity, Species Similarity and Shared Species …..
4
4
7
10
11
11
12
13
3.0 Materials and Methods………………………………………………………………………..
3.1 Study Sites…………………………………………………………………………….
3.2 Mist-Netting…………………………………………………………………………..
3.3 Data Analyses…………………………………………………………………………
17
17
18
18
4.0 Results………………………………………………………………………………………...
4.1 Analyses on Birds Recorded at Mount Jagoi…………………………………………
4.2 Analyses on Birds Recorded at Mount Singai………………………………………..
4.3 Comparison on Species Diversity, Species Similarity, and Shared Species………….
5.0 Discussion…………………………………………………………………………………….
5.1 Estimators Preferred…………………………………………………………………..
5.2 Programs Preferred……………………………………………………………………
5.3 Species Composition between Two Communities……………………………………
21
21
26
31
36
36
38
39
6.0 Conclusion…………………………………………………………………………………….
7.0 Recommendation……………………………………………………………………………...
41
42
References………………………………………………………………………………………...
Appendices………………………………………………………………………………………..
43
47
Page 6
IV
List of Figures
Figure Description Page
1 Location of study sites at Mount Jagoi, Bau district, Sarawak. 17
2 Cumulative curve of birds captured in four sampling sites at Mount Jagoi. 23
3 Species accumulation curve of Mount Jagoi. 24
4 Species richness of Mount Jagoi. 25
5 Cumulative curve of birds captured in four sampling sites at Mount Singai. 28
6 Species accumulation curve of Mount Singai. 29
7 Species richness of Mount Singai. 30
8 Comparison of species richness in Mount Jagoi and Mount Singai. 31
9 Shared species between Mount Jagoi and Mount Singai. 35
List of Tables
Table Description Page
1 Comparison of EstimateS and SPADE programs. 16
2 Checklist of birds captured at Mount Jagoi, Bau, Sarawak by mist-netting. 21
3 Sampling effort at Mount Jagoi. 24
4 Value of species richness of Mount Jagoi. 25
5 Checklist of birds captured at Mount Singai, Bau, Sarawak by mist-netting. 26
6 Sampling effort at Mount Singai. 28
7 Value of species richness of Mount Singai. 30
8 Bird diversity of Mount Jagoi and Mount Singai. 32
9 Zar t-test calculation on Shannon’s index. 32
10 Checklist of birds recorded from Mount Jagoi and Mount Singai. 32
11 Similarity between Mount Jagoi and Mount Singai. 35
Page 7
V
List of Appendices
Appendix Description Page
1 Formulation of estimators used in this study. 47
2 Checklist of birds captured at Mount Jagoi, Bau, Sarawak by mist-netting. 51
3 Truncated results showing the species richness of Mount Jagoi and
Mount Singai.
60
4 Truncated results showing the rarefaction of Mount Jagoi and
Mount Singai.
61
5 Truncated results showing the bird diversity of Mount Jagoi and Mount
Singai (SPADE program).
63
6 Truncated results showing the bird diversity of Mount Jagoi and Mount
Singai (DIVERS program).
64
7 Zar-t-test calculation. 66
8 Truncated results showing the shared species estimation. 69
9 Truncated results showing the species similarity between two
communities.
70
Glossaries
Singleton Species which are represented by a single individual in the sample.
Doubleton Species which are represented by two individuals in the sample.
Uniques Species which occur in only one sample.
Duplicates Species which occur in two samples.
Page 8
1
Species Diversity, Species Similarity and Shared Species of Understorey Birds at
Mount Jagoi and Mount Singai, Bau, Sarawak
Cheng Poh Leng
Animal Resource Science and Management Programme
Faculty of Resource Science and Technology
Universiti Malaysia Sarawak
ABSTRACT
Birds are useful in indicating the forest’s vegetation and they are important for environmental monitoring. This
study focuses on the understory bird community at Mount Jagoi and Mount Singai in Bau, Sarawak in terms of
species diversity, species similarity and shared species. Birds at Mount Jagoi were captured by mist-netting from
8th
to 12th
August, 2011, 8th
to 12th November, 2011, and 2
nd to 6
th February, 2012. A total of 298 individuals
comprising 53 species from 22 families were recorded at Mount Jagoi; while there were 127 individuals
comprising 26 species from 12 families were documented at Mount Singai. The most dominant species in both
areas was Little Spiderhunter (Arachnothera longirostra); while the dominant families recorded were
Pycnonotidae and Timaliidae. The results showed that bird community at Mount Jagoi was richer and
significantly more diverse than Mount Singai, but they were having high similarity of bird’s composition. Mount
Jagoi and Mount Singai shared 19 bird species based on available data, where more than 70% of bird species at
Mount Singai are present at Mount Jagoi. This may be resulted from similar habitat and food sources at both
areas. The prediction analyses showed that 32 species should be shared between the two mountains; and for
further survey of 300 individuals, 10 new species should be discovered at both mountains.
Key words: bird community, species diversity, species similarity, shared species
ABSTRAK
Burung adalah berguna untuk menentukan jenis hutan dan ia penting untuk mengawasi persekitaran. Kajian ini
menumpu kepada komuniti burung di Gunung Jagoi dan Gunung Singai di Bau, Sarawak dari segi kepelbagaian,
persamaan dan perkongsian spesis. Burung di Gunung Jagoi ditangkap dengan menggunakan jaring dari 8
hingga 12 Ogos, 2011, 8 hingga 12 November, 2011, and 2
hingga 6 Februari, 2012. Sebanyak 298 individu dari
53 spesis dan 22 keluarga direkodkan di Gunung Jagoi; dan sebanyak 127 individu dari 26 spesis dan 12
keluarga telah direkodkan di Gunung Singai. Spesis yang paling dominan ialah Little Spiderhunter
(Arachnothera longirostra); family yang dominan ialah Pycnonotidae dan Timaliidae. Ia didapati bahawa
komuniti burung di Gunung Jagoi adalah lebih kaya dan lebih pelbagai berbanding dengan Gunung Singai,
tetapi kedua-dua gunung mempunyai persamaan yang tinggi dari segi komposisi burung. Gunung Jagoi dan
Gunung Singai mempunyai 19 spesis burung yang sama, di mana lebih daripada 70% spesis di Gunung Singai
didapati wujud di Gunung Jagoi. Ia mungkin disebabkan oleh habitat dan sumber makanan yang lebih kurang
sama di kedua-dua kawasan. Analisis menganggarkan bahawa kedua-dua gunung tersebut sepatutnya
mempunyai 32 spesis yang sama; bagi 300 individu kajian seterusnya, 10 spesis yang baru dianggarkan akan
diperoleh di kedua-dua gunung ini.
Kata kunci: komuniti burung, kepelbagaian spesis, persamaan spesis, perkongsian spesis
Page 9
2
1.0 INTRODUCTION AND OBJECTIVE
Clout and Hay (1989) stated that birds are one of the significant indicators on forest types.
Some bird species such as New Zealand pigeon (Hemiphaga novaeseelandiae) are actually
selective browsers on certain plants and the presence of this bird is useful to indicate the
forest’s vegetation. Birds are also important for environmental monitoring since they
ecologically function as predator, seed dispersers, pollinators and control of insect population.
According to Gill and Donsker (2011), there are around 10,448 of bird species found in the
world and they have been classified into 40 orders, 233 families and 2233 genera. A total of
622 bird species including migratory birds and 39 endemic species have been recorded in
Borneo (Smythies, 1999). It has been updated to 633 species with 50 endemic species
recorded in Borneo (Myers, 2009), which covered about six per cent of world’s bird species.
Since birds’ diversity study can be used as a tool to conserve the global diversity (Campbell
and Reece, 2002), the birds’ diversity study had become crucial right now due to current threat
to biodiversity.
Mount Jagoi, with its highest peak at 352m is located in Bau district, about 39km southwest of
Kuching City, Sarawak, Malaysia. Bung Jagoi village is situated close to the top of Mount
Jagoi. There is only one family staying in the village at this moment. Numerous orchards, farm
land, plantations and rubber gardens are situated at the foot of the mountain. There is mature
secondary forest near the top of the mountain with a number of fruit trees such as durian
(Durio zibethinus) and cempedak (Artocarpus integer) along the trail to the peak of Mount
Jagoi which are possibly visited by forest mammals or birds.
Page 10
3
Approximately 20 kilometres northeast of Mount Jagoi is Mount Singai, which is higher at
562m. It is a pilgrimage site where the Catholic Memorial and Pilgrimage Centre (CMPC) is
situated near to the mountain slope. There were also the traditional Bidayuh longhouses
located at the mountain since 40 years ago. Several human settlements dotted the foot hill such
as Kampung Tanjong Bowang and Kampung Atas. The foot hill is comprised of orchard and
secondary regrowth. Small waterfall can be found at lowland which is less than 100m
elevation. Along the way up to the mountain, the vegetation is lush with plenty of palms,
ferns, bamboos and fruit trees such as durian.
Since the two mountains are located relatively a short distance apart in geographical scale, i.e.
a mere 20km, one would expect the bird diversity of Mount Jagoi and Mount Singai to be
similar.
The main objective of this study is to survey the understorey bird communities at Mount Jagoi.
The secondary objective is to compare the understorey bird between Mount Jagoi and Mount
Singai in terms of species diversity, species similarity and shared species. Thus the hypothesis
is,
Ho: There is no significant difference on species diversity between Mount Jagoi and Mount
Singai.
HA: There is significant difference on species diversity between Mount Jagoi and Mount
Singai.
Page 11
4
2.0 LITERATURE REVIEW
2.1 Related Previous Studies
2.1.1Related Studies near Mount Jagoi
There is no recorded scientific survey that had been done in Mount Jagoi. Setia (2011)
conducted a preliminary study on the bird diversity at Mount Singai from 13th
to 18th
September, 2010, and 3rd
to 8th
December, 2010; 26 bird species were captured by setting up
30 mist nets. Little Spiderhunter (Arachnothera longirostra) was the dominant species in this
study. Rufous-collared Kingfisher (Actenoides concretus), Green Broadbill (Calyptomena
viridis) and Short-tailed Babbler (Malacocincla malaccensis) which are classified as near
threatened species, were caught during this study. Shannon diversity index showed there was
no significant difference of bird diversity at both elevations. According to Setia (2011), the
birds are probably adapted to human presence. However, there was high species similarity
between both elevations and the areas studied calculated using Chao-Jaccard-Estimate
Abundance-based and Chao-Sorensen-Estimate Abundance-based in EstimateS program.
A bird’s study was conducted by Ng (2006) in three different fallows of varying ages in
Kampung Serasot, Bau, Sarawak which is about 5km away to the east of Mount Jagoi. Little
Spiderhunter was the only similar species for three plots and this species was also the most
dominant species of five and 20 year plots. She found out that there was no significant
different of bird diversities between five year plot, 20 year plot and 30 year plot using
Shannon diversity index. However the bird species was dissimilar in term of composition in
each site and it was mainly caused by different vegetation in each site.
Page 12
5
A study of understory bird of limestone area near Fairy Cave, Bau, Sarawak was conducted by
Rostina (2004) for six days. Fairy Cave is about 9km to the northwest of Mount Jagoi. A total
of 33 species from 101 individuals were mist netted at areas outside the cave and farm land of
ethnic Bidayuh’s village. The dominant species captured was Mossy-nest Swiflet
(Aerodramus salangana) as the study area is near to Fairy Cave and Little Spiderhunter was
the second dominant at these study areas. Shannon index showed the species diversity at farm
land was higher compared to the area outside Fairy Cave.
These studies have some similar characteristics where the study sites were near to human
settlement. Although vegetation types are different, the Little Spiderhunter was still the most
abundant species in those study areas. This information is important as it shows that the
species diversity and composition within an area is depending mainly on availability of food
sources and followed by vegetation types.
2.1.2 Other Related Studies
A study on bird diversity was carried out by Buloh et al. (2008) from 16th
to 23rd
August 2008
in Gunung Sewa, Kampung Giam, Padawan using mist-netting. The study site is about 27km
from Mount Jagoi in the south-eastern direction. This study was aimed to determine the
abundance and diversity of bird species between the orchard and the limestone forests. A total
of 27 species and 14 families were recorded. Out of 27 species captured at Gunung Sewa,
eight species were captured in orchard while 10 species were captured in limestone forest. At
the same time, nine species can be found in both sites. Little Spiderhunter was the most
abundant species with 20 individuals captured during the sampling period. Buloh et al. (2008)
Page 13
6
stated that there was significant difference in species diversity between orchard area and
limestone area.
In August 2009, Leow et al. (2009) conducted another study in Padawan at Gunung Regu,
Kampung Temurang to determine the abundance and diversity of bird species between scree
forest and limestone forest (doline). A total number of 117 individuals comprising of 34
species from 14 families were caught during six days sampling period. Two endemic species
were caught, namely Bornean Blue-flycatcher (Cyornis superbus) and Yellow-rumped
Flowerpecker (Prionochilus xanthopygius). This study concluded that there was a significant
difference in species diversity between the scree forest and the doline.
Bird diversity study at Mount Serapi, Kubah National Park, Matang, Sarawak and nearby area
which is about 29km northeast of Mount Jagoi were conducted during the period of June 1994
to April 1996 (Gregory-Smith, 1997). A total of 125 species were recorded at Mount Serapi,
comprising 15 species of sub-montane or hill-slope by observation and mist-netting. Four
endemic species which are Rufous-fronted Babbler (Malacopteron magnum), Chesnut-crested
Yuhina (Yuhina everetti), Yellow-rumped Flycatcher (Ficedula zanthopygia) and Dusky
Munia (Lonchura fuscans) found at Mount Serapi.
A study on bird’s diversity at different elevation of Mount Serapi at Kubah National Park,
Sarawak was carried out by Razali (2007). Samplings were done within 27th
to 1st
August,
2006, and 2nd
to 6th
December, 2006. The results shown that there were 58 bird species from
19 families had being captured. At the same time, Little Spiderhunter was the most abundant
species at Mount Serapi followed by Red-eyed Bulbul (Pycnonotus brunneus). Analyses
Page 14
7
showed that the species diversity at Mount Serapi was no significant different between
elevations but different in terms of species composition.
A study on diversity and abundance of bird at primary and secondary forest at Kubah National
Park was conducted by Fauzi (2007) during August and December 2006 for four days each.
Forty one species were caught and Little Spiderhunter was the most abundant species recorded
during this study. Besides, the composition of bird communities was different between
primary and secondary forest. Moreover, there was significant different of bird diversity
between dry season and wet season.
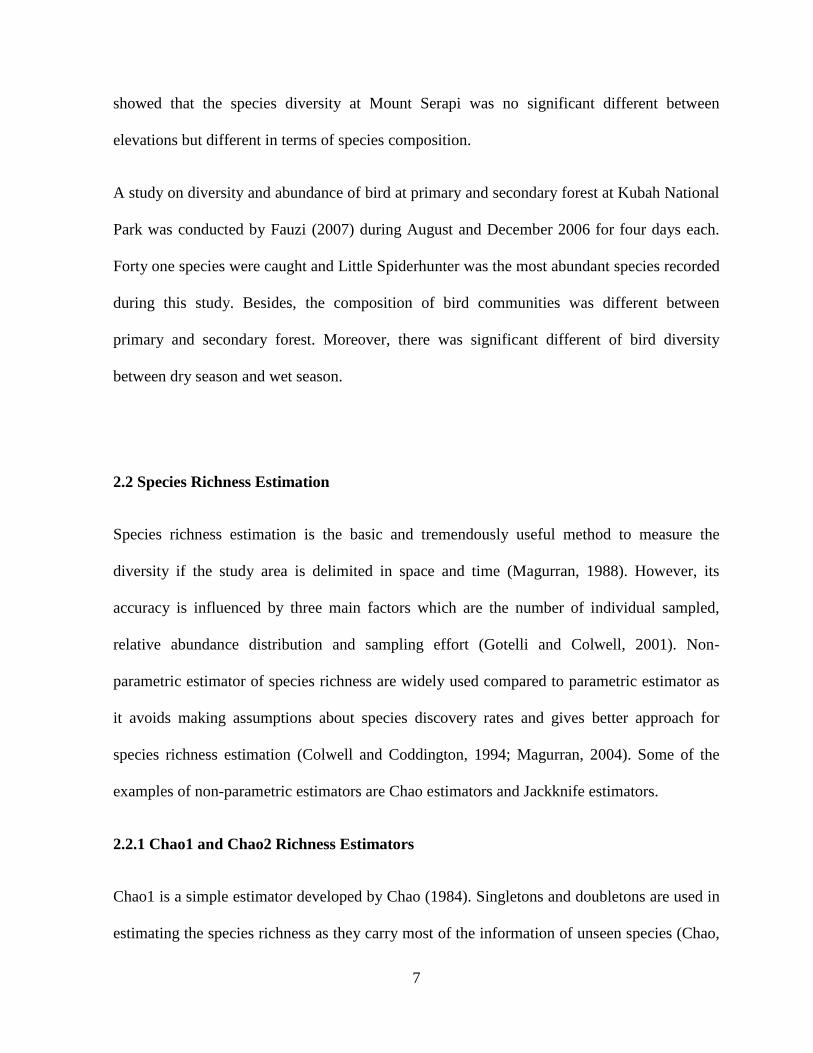
2.2 Species Richness Estimation
Species richness estimation is the basic and tremendously useful method to measure the
diversity if the study area is delimited in space and time (Magurran, 1988). However, its
accuracy is influenced by three main factors which are the number of individual sampled,
relative abundance distribution and sampling effort (Gotelli and Colwell, 2001). Non-
parametric estimator of species richness are widely used compared to parametric estimator as
it avoids making assumptions about species discovery rates and gives better approach for
species richness estimation (Colwell and Coddington, 1994; Magurran, 2004). Some of the
examples of non-parametric estimators are Chao estimators and Jackknife estimators.
2.2.1 Chao1 and Chao2 Richness Estimators
Chao1 is a simple estimator developed by Chao (1984). Singletons and doubletons are used in
estimating the species richness as they carry most of the information of unseen species (Chao,
Page 15
8
1984). Since the Chao1 estimator is subject to availability of abundance data, it was modified
by Chao (1987) known as Chao2 estimator which taking accounts the frequencies of uniques
and duplicates in incidence data. However, there is a loophole in both estimators where the
estimators will breaks down when doubletons in abundance data or duplicates in incidence
data is absent. Hence, these estimators are revised and developed to a bias-corrected
formulation (Chao, 2005).
2.2.2 Abundance-based and Incidence-based Coverage Estimators
Abundance-based Coverage Estimator (ACE) was proposed by Chao and Lee (1992). Species
richness is estimated through separating the observed species into two groups which are rare
and abundant groups. The rare groups are important for the estimation of the number of
unseen species. A cut-off points (10 individuals) obtained from empirical evidence is
suggested where the rare groups are represented by species with one up to 10 individuals, and
the abundant groups are represented by species with more than 10 individuals (Chao et al.,
1993). Incidence-based Coverage Estimators (ICE) was proposed later by Lee and Chao
(1994). It requires incidence data and is concentrated on species observed in less than 10
samples (Magurran, 2004).
Coefficient of variation (CV) is an important approach for both ACE and ICE to measure the
degree of heterogeneity among species detection probabilities for rare species (Chao et al.,
2000). The larger the CV, the greater the degree of heterogeneity among species detection
probabilities.
Page 16
9
2.2.3 Jackknife estimators
Jackknife estimators are originally used for capture-recapture study to estimation the
population size; it is subsequently modified to first-order Jackknife and second-order
Jackknife for species richness estimation used (Burnham and Overton, 1979; Smith and van
Belle, 1984). Both estimators have been designed for both the abundance and incidence data to
meet the ecologists and statisticians’ need. First-order Jackknife uses only singletons or
uniques to estimate the species richness. Unlike the first-order Jackknife, the second-order
Jackknife is similar with Chao2 estimator where it includes the singletons and doubletons or
uniques and duplicates for the species richness estimation.
2.2.4 Bootstrap Estimator
Bootstrap method is an alternative method of measuring species richness from quadrat
samples by obtaining results from simulation on computer (Krebs, 1999). It is a popular
method to estimate the accuracy of ecological indices via confidence interval or standard error
(Dixon, 2001). Although this estimator and its variance were developed originally for quadrate
sampling, the procedure can be used for other type of sampling (Chao, 2005). After a
sufficient number of bootstrap estimates are computed, their average is taken as the final
estimate (Chao, 2005).
2.2.5 Rarefaction
Rarefaction method was proposed by Sanders (1968) and it had been discussed by Krebs
(1999) and Magurran (2004). It standardizes different samples sizes from different
communities to produce a smooth species accumulation curves (Krebs, 1999; Magurran,
Page 17
10
2004). The comparison of species richness can be made where the larger community is
rarefied down to the smaller community with either sample-based or individual-based data
(Colwell, 2009b; Gotelli and Entsminger, 2011).There are some limitations on the use of
rarefaction where the communities should be taxonomically similar, same sampling methods
and the assumption of individuals are randomly dispersed in the community (Krebs, 1999;
Magurran, 2004).
2.3 Species Diversity Estimation
Species diversity can be separated into two distinct categories which are species richness and
species evenness. Simpson’s index and Shannon’s index are the most commonly used indices
to measure the species diversity where these indices cover both species richness and evenness
(Colwell, 2009a).
2.3.1 Simpson’s Index
Simpson’s index is the first nonparametric diversity measure proposed where it emphasizes
the most abundant species rather than species richness (Magurran, 2004). It is measured by
using the proportion of individuals in each species to estimate the diversity of extremely large
community. It ranges from 0 (low diversity) to almost 1.
2.3.2 Shannon’s Index
The most popular and widely used diversity index is Shannon’s index. It focuses more on rare
species and tends to highlight the richness of a community by obtaining the information such
as the number of species and the number of individuals in each species (Krebs, 1999; Mouillot
Page 18
11
and Lepretre, 1999; Magurran, 2004). The value of Shannon index is normally fell within 1.5
to 3.5.
2.4 Shared Species Estimation
The number of shared species can be used as a measure of similarity between two
communities. However, the observed number of shared species is usually treated as the real
number of shared species in particular community; but there might have some undiscovered
shared species in the incomplete survey (Chao et al., 2000). Thus, Chao et al. (2000, 2006)
had developed shared species approach which uses the concept of sample coverage to estimate
the shared species between two communities.
2.5 Species Similarity Estimation
Species similarity and dissimilarity estimators are used to compare the species composition
and diversity within two or more study sites using quantitative data (Magurran, 2004). Jaccard
index and Sorensen index which measure the species similarity based on incidence or
abundance data are the most widely used indices (Magurran, 2004; Chao et al., 2005).
2.5.1 Jaccard Index and Sorensen Index
Jaccard index and Sorensen index are closely related to each other. Classis Jaccard index and
Classic Sorensen index are basically computed using incidence data from two communities
(Magurran, 2004). The range is from zero (no similarity) to one (complete similarity). The
Page 19
12
values of both indices will small if the richness of one community is much larger than another
one; it truly expresses the differences of species composition between the communities (Jost et
al., 2011). However, both indices usually biased downward estimation when the sampling is
incomplete due to their sensitivity to sample size and species richness (Chao et al., 2005).
Chao et al. (2006) adjusted these two indices to reduce the bias that effected by dominant
species and the ignorant of rare species.
2.5.2 Morisita-Horn Index
Morisita-Horn index is one of the widely used and satisfactory similarity estimators. The value
of modified Morisita index is from zero (no similarity) to about one (complete similarity). It is
abundance-based similarity index where it focuses on the differences of relative abundances of
each species in two communities; and this resulted to the ignorance of rare species (Jost et al.,
2011). In fact, this estimator is influenced by species richness and sample size (Wolda, 1981).
2.6 Species Prediction
Species prediction is necessary in assisting the management and conservation of biological
communities. According to Shen et al. (2003), there are two types of approaches which used
to predict the number of new species; one approach is extrapolation and another one is based
on statistical sampling model. It is important to forecast the number of new species that
probably appear in the future survey because complete species inventories are almost
unachievable goal (Boneh et al., 1998; Shen et al., 2003).
Page 20
13
Several predictors were formulated through different aspects including Efron and Thisted
(1976), Boneh et al. (1998), Solow and Polasky (1999) and Shen et al. (2003). Keating et al.
(1998) compared 11 predictors and developed some recommendation on how to choose the
best predictors for different studies. Recently, Shen et al. (2003) found out Solow and
Polasky’s methods and predictor proposed by Shen et al. (2003) were among the more stable
and accurate approaches.
2.7 Programs to Estimate Species Diversity, Species Similarity and Shared Species
With the advance technology for analysis procedures, species diversity, similarity and shared
species estimation can be computed from developed software tools such as PAST (Hammer et
al., 2001), EstimateS (Colwell, 2009b), or SPADE (Chao and Shen, 2010).
2.7.1 EstimateS Program
EstimateS (Statistical Estimation of Species Richness and Shared Species from Samples)
software was developed by Colwell (2009b). Colwell (2009b) stated that more than 60,000
users in more than 100 countries have downloaded EstimateS and 237 publications recognized
that cited EstimateS. Its computing features are more focus on numerous biodiversity
functions, estimators, and indices based on biotic sampling data. The common species
diversity and similarity estimators such as Simpson index, Shannon index, Jaccard index and
Sorensen index can be calculated from this software. Researchers such as De Silva and
Medellin (2001), Raman and Sukumar (2002), and Sekercioglu (2002) had used it to estimate
bird diversity.
Page 21
14
A case study of Mexican land birds was carried out by De Silva and Medellin (2001). They
compare bird species assemblages within six study areas and seven biological stations in
Mexico mainland; using EstimateS software to estimate the species diversity. They found out
that seven families and two genera of land birds are widely spread in Mexico mainland.
Raman and Sukumar (2002) studied that responses of tropical rainforest birds to abandoned
plantations, edges and logged forest in the Western Ghats, India. By using EstimateS to
calculate species diversity and similarity, they concluded that bird communities were more
similar within sites with more similar in tree species composition. Besides, the results shown
the rare, large-bodied birds were affected by habitat alternation.
Sekercioglu (2002) used EstimateS to estimate species richness and similarity to study the
effects of forestry practices on four vegetation structure and bird community in Kibale
National Park, Uganda. Through the analyzed results, forest-dependent birds occur mostly in
unlogged native forest and followed by selectively logged forest at low intensity. The results
shown the abundance and species richness of birds were highest in unlogged or lightly logged
forests.
2.7.2 SPADE Program
SPADE (Species Prediction and Diversity Estimation) program is introduced by Chao and
Shen (2010) to provide various biodiversity estimations based on different kinds of sample
data obtained from one to multiple communities. It contains the estimators for species
richness, shared species richness in two communities, prediction the number of new species,
diversity and similarity indices, multi-community diversity measure and also genetic analysis
Page 22
15
on allele similarity and differentiation. SPADE is recently used by researchers such as
MacGregor-Fors and Schondube (2011) to conduct statistical analysis of bird studies.
MacGregor-Fors and Schondube (2011) surveyed the tropical dry forests and agricultural
areas used by neotropical bird communities in the Pacific coast of Jalisco, Mexico. SPADE
was used to determine the sufficiency of survey effort on the bird communities in their study
sites. They observed the tropical dry forests had the highest species richness and evenness.
Cattle pastures habitat and cropfields had low species richness and evenness values compared
to tropical dry forests. In the end of this survey, it shown that the bird community structure,
diversity and composition were different between tropical dry forest and agricultural habitats.
2.7.3 Similarity and Difference between Programs Used
EstimateS and SPADE are using the same formulation of estimators to compute the data in
which the way these programs present the data analysed is different. EstimateS computes the
data by showing the accumulated or value for each sample while SPADE gives the exact
results of estimators. Analysed data from EstimateS has to be transferred into Microsoft Excel,
a graphing application to visualize the data. Some estimators are only available in certain
software such as species prediction estimators are only accessible in SPADE but not
EstimateS. Therefore, these programs have their own advantages and give options to
researchers to choose the best way to present and explain their findings. Table 1 below shows
the comparison of those programs.
Page 23
16
Table 1. Comparison of EstimateS and SPADE programs.
Programs
Particulars
EstimateS SPADE
Formulation Same
Same
Output Value is provided for each sample,
Accumulated value
Exact value
Graph application Available, Need to export to
Microsoft Excel
Not available
Species richness indices
Yes Yes
Diversity indices Yes
Yes
Significant test No No
Shared species estimators
Yes Yes
Species similarity indices Yes Yes
Species prediction
No Yes
Page 24
17
Mount Jagoi, view from Kampung Serasot
3.0 MATERIALS AND METHODS
3.1 Study Sites
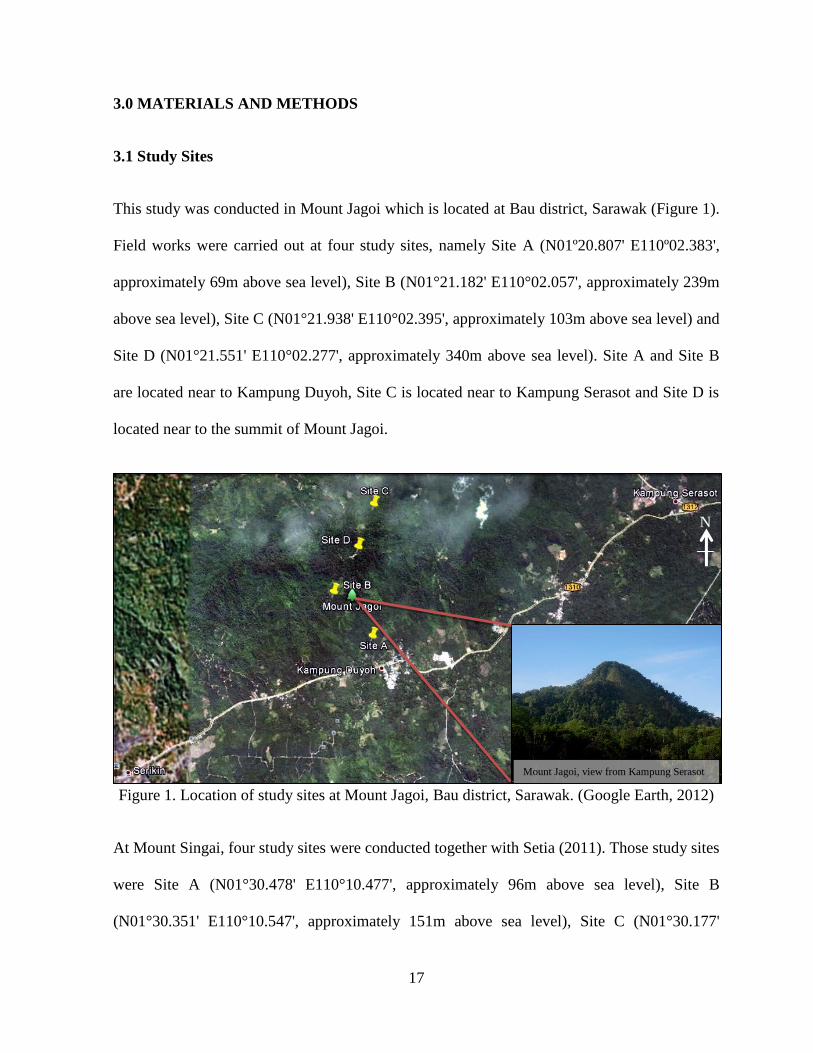
This study was conducted in Mount Jagoi which is located at Bau district, Sarawak (Figure 1).
Field works were carried out at four study sites, namely Site A (N01º20.807' E110º02.383',
approximately 69m above sea level), Site B (N01°21.182' E110°02.057', approximately 239m
above sea level), Site C (N01°21.938' E110°02.395', approximately 103m above sea level) and
Site D (N01°21.551' E110°02.277', approximately 340m above sea level). Site A and Site B
are located near to Kampung Duyoh, Site C is located near to Kampung Serasot and Site D is
located near to the summit of Mount Jagoi.
Figure 1. Location of study sites at Mount Jagoi, Bau district, Sarawak. (Google Earth, 2012)
At Mount Singai, four study sites were conducted together with Setia (2011). Those study sites
were Site A (N01°30.478' E110°10.477', approximately 96m above sea level), Site B
(N01°30.351' E110°10.547', approximately 151m above sea level), Site C (N01°30.177'
N