Page 1
Water and Sediment Quality of Rajang River at Pelagus Area, Sarawak
Phan Tze Pei (38390)
Bachelor of Science with Honours
(Resource Chemistry)
2015
Faculty of Resource Science and Technology
Page 2
II
Acknowledgement
I would like to gratefully acknowledge the financial support of Sarawak Energy
Berhad and the facilities provided by Universiti Malaysia Sarawak.
Page 3
III
Declaration
I, Phan Tze Pei, 38390, from FACULTY OF RESOURCE SCIENCE AND
TECHNOLOGY hereby declare that the work entitled. “WATER AND SEDIMENT
QUALITY OF RAJANG RIVER AT PELAGUS AREA, SARAWAK” is my original
work. I have not copied from any other students’ work or from any other sources except where
due reference or acknowledgement is made explicitly in the text, nor has any part been written
for me by another person.
_______________ _____________________
Date of submission Signature of Student
Page 4
IV
Tables of Contents
Acknowledgement........................................................................................................... I
Declaration…………………………………………………………………….………. II
Table of Contents……………………………………………………………………… III
List of Abbreviations………………………………………………………………….. IV
List of Figure and Tables……………………………………………………………… V
Abstract………………………………………………………………………………… 1
Introduction……………………………………………………………………………. 2
Literature Review…………………………………………………………………...… 5
Water quality……………………………………………………………….…… 6
Sediment quality…………………………………………………………….….. 23
Impact of Bakun Dam and Murum Dam to downstream river…………….…… 29
Materials and Methodologies…………………………………………….…………… 30
Study sites and sample collection………………………………………………. 30
Preparation before sample collection………………………………….………... 36
Laboratory analysis…………………………………………………….……….. 38
Water Quality Analysis……………………………………….………… 39
Sediment Quality Analysis……………………………………………… 47
Statistical Analysis……………………………………………………………… 53
WQI Classification……………………………………………………………… 54
Results………………………………………………………………………………….. 54
Water Quality…………………………………………………………………… 54
Sediment Quality……………………………………………………………….. 64
Discussions……………………………………………………………………………… 68
Water Quality……………………………………………………………………. 68
Water Quality Index (WQI)………………………………………………….….. 83
Sediment Quality………………………………………………………………… 85
Conclusion………………………………………………………………………………. 90
References………………………………………………………………………………. 91
Appendixes……………………………………………………………………………… 100
Page 5
V
List of Abbreviations
DO = Dissolved oxygen
EC = Electrical conductivity
TSS = Total suspended solids
NO3- -N = Nitrate
NO2- -N = Nitrite
TAN = Total ammonia nitrogen
Org-N = Total Organic nitrogen
TN = Total nitrogen
SRP / PO4 2-
-P= Soluble reactive phosphate
TP = Total phosphorus
TS2-
= Total Sulphide
COD = Chemical oxygen demand
BOD = Biochemical oxygen demand
WC = Water content
LOI / OM = Organic content
TOC = Total organic carbon
Page 6
VI
List of Figures and Tables
Figure 1: Location of the existing and proposed HEP dams in Sarawak (Sarawak Integrated
Water Resources Management Master Plan, 2008).
Figure 2: Phosphorus cycle between atmosphere and water.
Figure 3: Nitrogen cycle (Pidwirny, 2006).
Figure 4: Sulphur cycle (Lenntech, 2014).
Figure 5: Rajang River Upstream of Pelagus, Bakun Dam and Murum Dam sites.
Figure 6: Sampling stations along Rajang River at Pelagus.
Figure 7: (a) Water discharge and (b) velocity of each of the station.
Figure 8: (c) Temperature, (d) dissolved oxygen (DO) and (e) pH at subsurface water of the
stations.
Figure 9: (f) Electrical conductivity (EC) and (g) depth at subsurface water of the stations.
Figure 10: (h) Transparency, (i) turbidity and (j) total suspended solids (TSS) of subsurface
water of the stations.
Figure 11: (k) Nitrate (NO3- -N), (l) nitrite (NO2
- -N), (m) total ammonia nitrogen (TAN) and
(n) total organic nitrogen (Org-N) and (o) total nitrogen (TN) of the subsurface
water of the stations.
Figure 12: (p) Soluble reactive phosphate (SRP), (q) total phosphorus (TP) of the subsurface
water of stations.
Figure 13: (r) Total sulphide (TS), (s) chemical oxygen demand (COD) and (t) biological
oxygen demand (BOD) of the subsurface water of stations.
Figure 14: (a) pH, (b) water content (WC) and (c) organic matter (LOI) of sediments of
stations.
Page 7
VII
Figure 15: (d) Sand fraction, (e) silt fraction and (f) clay fraction from particle sizes of
sediments.
Figure 16: (g) Total organic carbon (TOC), (h) total nitrogen (TN) and (i) total phosphorus
(TP) of sediments of stations.
Figure 17: Correlation between water content (WC) and organic matter (OM).
Table 1: Sampling stations along Rajang River.
Table 2: Types of filter and preservation for each of the water quality’s parameter.
Table 3: WQI and water quality classification of the stations.
Page 8
1
Water and Sediment Quality of Rajang River at Pelagus Area, Sarawak
Phan Tze Pei Resource Chemistry, Faculty of Resource Science and Technology, Universiti Malaysia Sarawak
ABSTRACT
This study was carried out to examine the water and sediment quality of Rajang River at Pelagus area to produce
a baseline reference of the environment before the construction of a hydroelectric power dam that has been
scheduled in the development plan of Sarawak. Samples were collected at 12 stations along the Rajang River
from Pelagus Rapid to Punan Bah on 27th
to 28th
August 2014 and 14th
to 15th
January 2015. Results of this study
show that water quality was affected by logging, vegetation and waste from households and animals around the
study area. The total suspended solids and turbidity of stations 1, 5, 6, 7, 10, 11 and 12 exceeded Class II limit of
50 mg/L while dissolved oxygen of stations 1, 6 and 11 fall into Class III (3 – 5 mg/L) based on INWQS.
Biochemical oxygen demand of stations 1, 2, 4, 5, 6, 7, 8, 9, 10, 11 and 12 are not complied with Class II (1 – 3
mg/L) while chemical oxygen demand of all the stations are exceeded Class II limit 25 mg/L based on INWQS.
Moreover, total ammonia nitrogen of all the stations except station 8 exceeded Class II limit of 0.3 mg/L
According WQI, only stations 2, 3, and 4 which are tributaries are classified under Class II (76.5 – 92.7) while
stations 1, 6, 7 and 11 that are located at main river and other stations 5, 8, 9, 10 and 12 which are located at
tributaries are not compliance with Class II. WQI of station 7 – 12 which are more nearer to the Bakun Dam are
classified in Class III as the chemical oxygen demand and biochemical oxygen demand of them are higher than
others. Dissolved oxygen, turbidity, total suspended solids and total sulphide of most of the stations that located
at main river are higher than stations at tributaries. Sediment samples are mineral acidic and higher organic
matter has recorded with higher weight of water content whereas the total phosphorus and total nitrogen in
sediment are 46.53 – 102.86 mg/kg and 0.73 – 6.17 mg/kg.
Key words: Water quality, sediment quality, logging, INWQS, WQI
Kualiti air dan sedimen di Sungai Rajang di Kawasan Pelagus, Sarawak
Phan Tze Pei Sumber Kimia, Fakulti Sains Sumber dan Teknologi, Universiti Malaysia Sarawak
ABSTRAK
Kajian ini telah dijalankan untuk memeriksa kualiti air dan sedimen di Sungai Rajang di kawasan Pelagus untuk
menghasilkan rujukan garis dasar alam sekitar sebelum pembinaan empangan kuasa hidroelektrik yang telah
dijadualkan di dalam pelan pembangunan Sarawak. Sampel telah dikumpulkan di 12 stesen di sepanjang Sungai
Rajang daripada Pelagus Rapid ke Punan Bah pada 27-28 Ogos 2014 dan 14-15 Januari 2015. Keputusan
kajian ini menunjukkan bahawa kualiti air terjejas akibat pembalakan, tumbuh-tumbuhan dan bahan buangan
dari isi rumah dan haiwan di seluruh kawasan kajian. Jumlah pepejal terampai dan kekeruhan stesen 1, 5, 6, 7,
10, 11 dan 12 melebihi Kelas II had 50 mg / L manakala oksigen terlarut stesen 1, 6 dan 11 jatuh ke dalam Kelas
III (3-5 mg / L) berdasarkan INWQS. Permintaan oksigen biokimia stesen 1, 2, 4, 5, 6, 7, 8, 9, 10, 11 dan 12
tidak dipatuhi Kelas II (1-3 mg / L) manakala permintaan oksigen kimia semua stesen dilampaui Kelas II had 25
mg / L berdasarkan INWQS. Selain itu, jumlah nitrogen ammonia daripada semua stesen kecuali stesen 8
melebihi had Kelas II 0.3 mg / L Menurut WQI, hanya stesen 2, 3, dan 4 anak sungai yang dikelaskan di bawah
Kelas II (76.5-92.7) manakala stesen 1, 6 , 7 dan 11 yang terletak di sungai utama dan stesen lain 5, 8, 9, 10 dan
12 yang terletak di anak sungai tidak mematuhi Kelas II. WQI stesen 7-12 yang lebih dekat kepada Empangan
Bakun dikelaskan dalam Kelas III kerana permintaan oksigen kimia dan permintaan oksigen biokimia daripada
mereka adalah lebih tinggi daripada yang lain. Oksigen, kekeruhan, jumlah pepejal terlarut digantung dan
jumlah sulfida kebanyakan stesen yang terletak di sungai utama adalah lebih tinggi daripada stesen di anak
sungai. Sampel sedimen adalah mineral berasid dan lebih tinggi bahan organik telah dirakam dengan berat
badan yang lebih tinggi daripada kandungan air manakala jumlah fosforus dan jumlah nitrogen dalam sedimen
adalah 46.53-102.86 mg / kg dan 0.73-6.17 mg / kg.
.Kata kunci: Kualiti air, kualiti sedimen, pembalakan, INWQS, WQI
Page 9
2
INTRODUCTION
Water is an important requirement of human life and activities related to industry,
agriculture, and others, and it is considers one of the most fragile parts of the environment
(Badaii et al., 2013). Quality of water criteria are water characteristics, the levels of individual
pollutants or descriptions of conditions of the water body that, if met, will generally protect
the designated use (U.S.EPA Science Advisory Board Consultation, 2003). Conserving the
river water and sediments quality is important due to the sensitivity of aquatic ecosystem in
the river (Ling et al., 2010a). Factors that affect the quality of river water are geologic,
climatic and anthropogenic (Meybeck et al., 1996). Anthropogenic pollutants associated with
land use causes extreme deterioration of aquatic systems in watersheds and it is the factor that
can be controlled to protect the quality of river water (Badaii et al., 2013; Ling et al., 2010b).
Livestock wastewater consists of high concentrations of organic and inorganic nitrogen,
ammonia nitrogen, and pathogenic bacteria while the runoff of the nutrient rich waste results
in depletion of oxygen (Badaii et al., 2013).
River sediments are essential compartments of the aquatic ecosystems because they
provide habitat and shelter for many organisms and it also act as a long-term source of
contamination, as pollutants can be momentarily unavailable for uptake when bound to
particles then released to aquatic phase gradually (Flueck et al., 2010). Sediment is the greatest
water pollutants by weight or volume, and the erosion and sedimentation process has many
effects throughout our environment (Alabama State Water Program, n. d.). Hence, sediments
should not accumulate any persistent pollutants in order to protect the aquatic life (Flueck et
al., 2010). In river and streams, habitat for macroinvertebrates and fish spawning are
influenced by fine inorganic sediments, especially silts and clay while suspended sediment
Page 10
3
affects the light available for photosynthesis by plants and visual capacity of animals
(U.S.EPA Science Advisory Board Consultation, 2003). We are able to determine the sources
and assess the effects of the pollutants on the aquatic environment by analyzing the quantity,
quality and characteristic of sediment in streams (Alabama State Water Program, n.d.).
Domestic wastewater was reported to be the main factor in water pollution of Jinshui
River in China (Bu et al., 2010). Sullage from Kuching City’s residential area was reported to
be high in oxygen demand and nutrients like ammonia-nitrogen, reactive phosphorus, total
phosphorus and total nitrogen and low in dissolved oxygen (Ling et al., 2010b).
The Rajang River is the longest river in Malaysia. It flows about 563 km to the South
China Sea and it is the main drainage system for central Sarawak which originates from the
Nieuwenhius Mountain Range and the upper Kapuas mountain that is located in northwest of
Borneo (Encyclopedia Britannica 1911, n. d.). Rajang River is importance to Sarawak and the
rest of Malaysia as logging is the main source of income for Sarawak and it also serve as
transportation (Parenti & Lim 2005). Forests Monitor (2006) stated that the construction of
logging roads and camps, skid trails and logging itself contribute upstream soil erosion.
Therefore, river basins contained extremely high suspended sediment loads and high turbidity
(Heyzer, 1996).
Agricultural activities might contaminate the river water as the common agriculture
contaminants are nitrate, phosphorus and sulfates; therefore, concentration of nitrate,
phosphorus and sulfates will be higher near to the site with agriculture activities (Kumar,
2005).
Page 11
4
However, other developments in the watershed such as residential areas and
construction may contribute to degradation of the water quality and also impact the survival of
aquatic organisms (Ling et al., 2010b). We must limit the sediments in water to safeguard the
future of our water resources (U.S.EPA Science Advisory Board Consultation, 2003).
There are a few researches on the fishes of the Rajang basin (Parenti & Lim, 2005),
macrofauna of Rajang River (Shabdin, 2010) and modeling of Batang Rejang for extreme
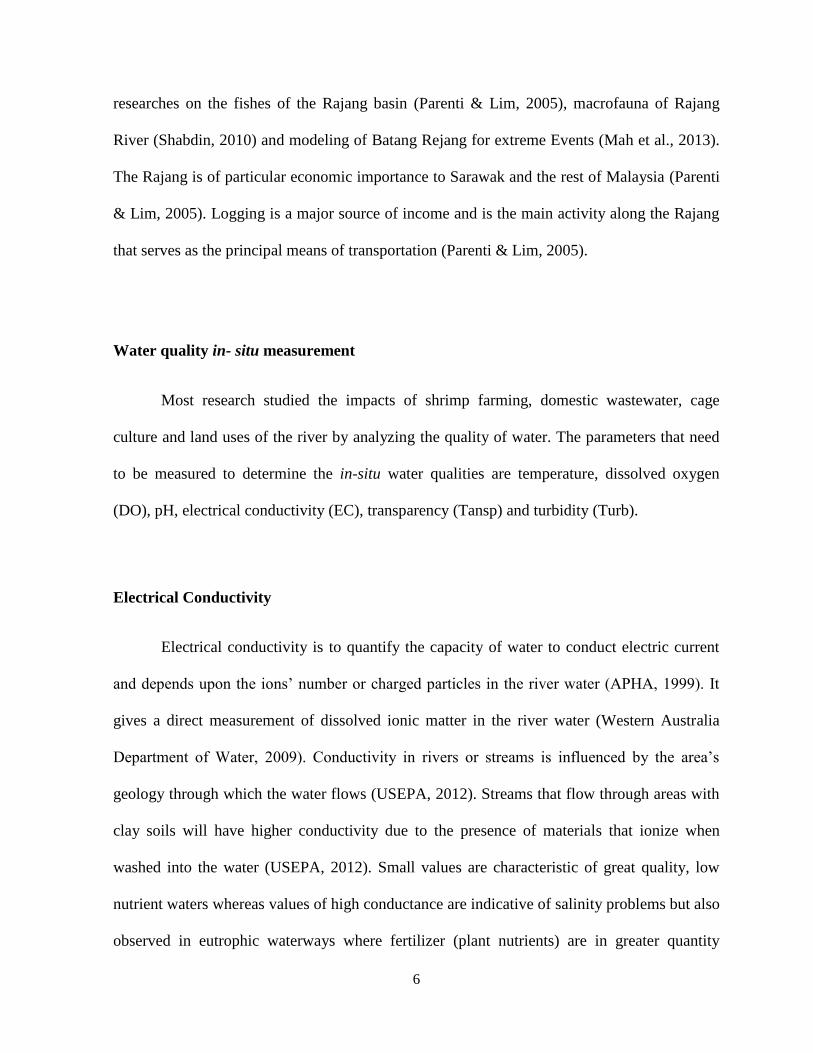
Events (Mah et al., 2013). Rajang River at Pelagus area has been scheduled or proposed for
hydroelectric power dam in the development plant of Sarawak (Sarawak Integrated Water
Resources Management Master Plan, 2008).
Figure 1: Location of the existing and proposed HEP dams in Sarawak (Sarawak Integrated Water Resources
Management Master Plan, 2008).
Page 12
5
In this study, all the in-situ and ex-situ parameters were measured and classified based
on Interim National Water Quality Standard (INWQS) to identify the effects of anthropogenic
land use activities on the water quality condition. Moreover, the river water was categorized
by calculating the sub index of several parameters based on Department of Environment
Water Quality Classification Based on Water Quality Index. The objectives of the study are to
determine the water and sediments quality, the concentration or contents of nutrients in river
water and sediment and total suspended solids in water of Rajang River at Pelagus area,
providing the baseline data. Throughout this study to examine the status of the water and
evaluate whether the water quality is suitable for aquatic ecosystem and whether treatments
are needed to be applied for water supply. Comparison can be made by using this baseline data
after the dam construction has finished to evaluate the effect or impact of hydroelectric power
on the Pelagus area.
LITERATURE REVIEW
Analysis of water and sediment quality of selected areas in the river identifies areas
where the river is likely to become contaminated or polluted due to land use or human
activities. The capability of a river system to sustain life depends in part on the water and
sediment quality found in the aquatic environment. Quality of water and sediment depend on
the characteristics of the river drainage basin (Regional Aquatics Monitoring Program, n. d.).
There are many research studies on the impact of water and sediments quality, impacts
of land use on water and sediments quality and water and sediments quality of rivers,
reservoirs and dams that have been conducted or done by other researchers. There are a few
Page 13
6
researches on the fishes of the Rajang basin (Parenti & Lim, 2005), macrofauna of Rajang
River (Shabdin, 2010) and modeling of Batang Rejang for extreme Events (Mah et al., 2013).
The Rajang is of particular economic importance to Sarawak and the rest of Malaysia (Parenti
& Lim, 2005). Logging is a major source of income and is the main activity along the Rajang
that serves as the principal means of transportation (Parenti & Lim, 2005).
Water quality in- situ measurement
Most research studied the impacts of shrimp farming, domestic wastewater, cage
culture and land uses of the river by analyzing the quality of water. The parameters that need
to be measured to determine the in-situ water qualities are temperature, dissolved oxygen
(DO), pH, electrical conductivity (EC), transparency (Tansp) and turbidity (Turb).
Electrical Conductivity
Electrical conductivity is to quantify the capacity of water to conduct electric current
and depends upon the ions’ number or charged particles in the river water (APHA, 1999). It
gives a direct measurement of dissolved ionic matter in the river water (Western Australia
Department of Water, 2009). Conductivity in rivers or streams is influenced by the area’s
geology through which the water flows (USEPA, 2012). Streams that flow through areas with
clay soils will have higher conductivity due to the presence of materials that ionize when
washed into the water (USEPA, 2012). Small values are characteristic of great quality, low
nutrient waters whereas values of high conductance are indicative of salinity problems but also
observed in eutrophic waterways where fertilizer (plant nutrients) are in greater quantity
Page 14
7
(Western Australia Department of Water, 2009). Generally, most of the freshwaters
conductivity is ranging from 10 to 1000 µs/cm (Gandaseca et al., 2011). Conductivity range of
distilled water is 0.5 - 3 µs/cm and range outside of 150 - 500 µs/cm is unsuitable for certain
species of fish and macroinvertebrates (USEPA, 2012). Conductivity might be increased due
to a failing sewage system due to the presence of chloride, phosphate, and nitrate while oil
spill would lower the conductivity (USEPA, 2012).
DO
DO measures quantity of oxygen dissolved in an aqueous solution (APHA, 1999). The
quantity of oxygen dissolved in water is largely dependent upon the temperature of water;
water with low temperature can carry extra dissolved oxygen than water with higher
temperature (Western Australia Department of Water, 2009). DO is a significant water quality
parameter influencing the health of river and it is important to aquatic life and eco-system, DO
concentrations of unpolluted fresh water will be close to 10 mg/L as when DO levels drop
below 5 mg/L, detrimental effects may occur (Naik & Manjapp, 2010). Lower DO values
from Belaga to Sibu were recorded where the flow became slower and fewer rapids formed
when moved downstream (Lau, 2011). The author from the studies of impact of domestic
wastewater and aquaculture on Santubong River stated that the increase of current and wave
action would have affected and raised the DO values (Ling et al., 2010b). Flowing water will
have higher DO value than stagnant water because of its churning (USEPA, 2012). In flowing
water, oxygen- rich water at the surface is constantly being replaced by water containing less
oxygen as a result of turbulence while stagnant water undergoes less internal mixing, the
upper layer of oxygen-rich water will stay at the surface (Water Quality Control, n.d.).
Page 15
8
Amount of DO in river water can be influenced by aquatic plants by producing dissolved
oxygen during daytime and consume dissolved oxygen overnight (Grand River Conservation
Authority, 2014). Low DO level might due to the high discharge of organic pollutants and
nutrients into river water which raise the respiration during degradation of organic matter
(Yisa & Jimoh, 2010). From the study of total sulphide concentration in the effluent streams,
oxygen conditions will be reduced by forming sulphate, thiosulphate and sulphide with the aid
of sulphur oxidizing bacteria and lead to higher TS level (Tangri, 2008). Bellingham (n.d.)
stated that waters contaminated with fertilizers, suspended material or petroleum waste,
microorganisms such as bacteria will break down the contaminants and the oxygen will be
consumed, decrease DO level in water.
pH
Concentration of H+
determine pH of a solution, it shows the alkalinity or acidity of a
solution (APHA, 1999). Water is neutral with pH 7; lower pH values show rising acidity,
while pH values higher than 7 designate progressively more alkalinity (Western Australia
Department of Water, 2009). Range of 6.5 – 8.0 is preferred by largest variety of aquatic
animals, pH exceeding the range decreases the diversity in the river by stressing the
physiological systems of a large amount of organism and the reproduction (USEPA, 2012).
The optimum pH for river is around 7.4 while acidity of water can be raised by acid rain
which harmful to immature fish, insect and speeds up the leaching of heavy metals harmful to
fish (Grand River Conservation Authority, 2014). Concentration of hydroxide and represented
by a pH > 7 will control the alkalinity of natural waters while boron, phosphorus, nitrogen
containing compounds and potassium will contribute to an alkaline pH too (Bellingham, n. d.).
Page 16
9
The author from the research of effects of domestic wastewater and aquaculture on water
quality of Santubong river stated that pH value that reached 8 could be due to anthropogenic
input of nutrients that result in more algae photosynthesis and fish feed and faeces that
contribute nutrients to alga growth (Ling et al., 2010b). Besides, the emission of fossil fuel to
the atmosphere will combine with river water to produce acid (Marlborough District Council,
2015). Lau (2011) stated that the pH of river water will decrease to between 6 – 6.93 in rainy
seasons and varied from 7.33 to 7.90 during dry season. Acid produced from decomposition of
vegetation debris in the forest floor might be washed down into the river during raining season
(Lau, 2011). The higher the pH; the more PO43-
are formed from the deprotination of HPO42-
.
Unlike total ammonia, phosphate are less soluble and less volatile, therefore, it formed salts
with sodium and calcium and accumulate in the sediment falling out from solution. Phosphates
in ions in natural water are existed in solution in its ionized form, as salts, in organic form or
as a particulate species (Bellingham, n. d.).
Turbidity
Turbidity in water is due to suspended and colloidal matter like silt, clay, finely
divided inorganic and organic matter, and other microscopic organisms and plankton (Grand
River Conservation Authority, 2014). It is an asses of the transparency of water body and is a
visual measurement that evaluates the light intensity scattered by a water sample with the light
intensity that scattered by a standard reference suspension (Western Australia Department of
Water, 2009). Turbidity measurements are always used as an indicator of water clarity and
Page 17
10
predicted total suspended solids in water (Fondriest Enviromental Inc., 2015). Factors that
affect turbidity of water are soil erosion, waste discharge, urban runoff, eroding stream banks,
construction and logging activities (USEPA, 2012). The flow of stormwater runoff from
impervious surfaces rapidly increases stream velocity and increase the erosion rates of
streambanks and channels therefore, turbidity is closely related to stream flows and velocity
(USEPA, 2012). High turbidity of the water shows high scattering or absorption of incident
light by particles (APHA, 1999). Turbidity in drinking water quality standard of Malaysia is 0
- 5.0 NTU (Ministry of Health Malaysia, 2010). In the study of water quality at Batang Rajang
at the upstream and downstream of Bakun Dam reported that turbidity ranged from 20 – 46
NTU and 3 – 11 NTU at their tributaries during dry season and ranged between 288 – 442
NTU during raining season (Lau, 2011). The turbidity of the stations in Bakun Hydroelectric
Reservoir is majorly due to suspended solids consisting of particles from the eroded soil
transported through surface runoff from the logging in watershed upstream (Nyanti et al.,
2012). Turbidity of river water at wildlife sanctuary Sibuti mangrove forest, Miri, Sarawak is
10.2 - 15.3 NTU due to high amount of TSS (Gandaseca et al., 2011).
Transparency
Transparency of the river water is measured using secchi disk (USEPA, 2012).
Markings will be made at 10 cm intervals in turbid water whereas markings will be made at 50
cm intervals in clearer waters (Western Australia Department of Water, 2009). Water in the
major channel of Rajang River is in yellowish color with water transparency of between 4 to 5
cm (Shabdin, 2010). In the study of freshwater fish diversity and composition in Batang
Kerang floodplain, Balai Ringin, Sarawak, secchi transparency of brown water is around 63.20
Page 18
11
cm while for black water is around 126.30 cm (Rahim et al., 2009). Transparency of water is
directly related to turbidity as turbidity is a measure of water clarity (Fondriest Environmental
Inc., 2015). Transparency decreases as turbidity increases due to high scattering or absorption
of incident light by particles (USEPA, 2012).
Temperature
Water temperature affects the rates of photosynthesis, rates of metabolism and growth
of aquatic organisms and lower dissolved oxygen in the river water (Grand River
Conservation Authority, 2014). Heat sources and sinks to a water body include evaporative
cooling and heat conduction, incident solar radiation, back radiation, thermal dischargers,
tributary inflows and groundwater discharge (Western Australia Department of Water, 2009).
Weather condition, solar radiation, evaporation, fresh water influx, sampling time and location
might affect the increase or decrease of temperature (Western Australia Department of Water,
2009; Badaii et al., 2013). Higher temperature can increase the rate of chemical reaction to
dissolve more minerals from rocks which contribute to higher electrical conductivity and
warm river water holds less dissolved oxygen than cool water which might influences the
biological activities or aquatic life (Chapman & Kimstach, 1996). The studies of water and
sediment quality in Selang Sibu River shows the mean temperature range from 29.2 - 31.2 °C
which is typical of the estuarine water of a typical country and temperature increase seaward
(Ling et al., 2012; Nyanti et al., 2012).
Water flow & discharge
The current flow of the river water is directly related to the quantity of water flowing
off the watershed into the river channel and it is influenced by the climate or seasons of the
Page 19
12
year, raising during rainstorm and declining during dry periods (USEPA, 2012). Velocity of
river water has direct and indirect effects on biota (Meybeck et al., 1996). Besides, large
differences can be observed between porous rocks, clays, marshy soil and fissured rocks.
Vegetation also exerts an influence on the generation of river discharge because it largely
determines the quantity of surface run-off (Meybeck et al., 1996). Turbidity of water increased
with the raised volume of river water release and volume of river water discharge decreases
when water is less turbid but high water discharge will not affect pH, DO, EC and temperature
of river water (Rak, Said & Moamed, 2010). Moreover, at higher river discharge rate, the
ecological effects of a polluted effluent in a river are less harmful (Meybeck et al., 1996). The
large swiftly flowing rivers can receive pollution discharges and be little affected (USEPA,
2012). Rapid running streams will cause the sediment suspended longer in the water column
and have greater DO value than slow streams (USEPA, 2012). Greatest velocities appear in
the centre of the channel but are reduced to zero at the bank by frictional forces exerted by the
shallow bank zone and the bank itself (Meybeck et al., 1996). The velocity gradient thus tends
to force any influent waters from a tributary, industrial or municipal point source to the side of
the river which they entered (Meybeck et al., 1996). Concentration of TSS in rivers increases
as a function of flow. Particles are derived from bank, sheet and gully erosion in the watershed
and by re-suspension of particles deposited in the river bed (Meybeck et al., 1996). The flow
rate of velocity of water body is the main factor in amount of TSS. High velocity water can
carry more particles and larger-sized sediment (Murphy, 2007).
TSS
TSS is identified as the fraction of total solids in a water sample (Western Australia
Department of Water, 2009). These solids include everything floating in the water, from
Page 20
13
sediment, silt and sand to plankton and algae and also the organic particle that decomposed
from decomposing materials also contribute to the TSS concentration (Fondriest
Environmental Inc., 2015). All the wastewater or rubbish might contain food residue, human
waste and other solid materials which can raise suspended solids to a stream (Murphy, 2007).
TSS is higher as it received input from the on-going construction work in addition to the
residential areas (USEPA, 2006). The TSS value of Wildlife Sanctuary Sibuti mangrove
forest’s river water ranged from 0.00119 - 0.4361 mg/L as TSS is consider as the natural
pollutants in surface water and act as land erosion indicator level (Gandaseca et al., 2011).
Another research in Semenyih River, Selangor, Malaysia shows that the TSS value during
raining season ranged from 11.7 – 58.1 mg/L while it ranged from 10.3 – 446 mg/L and based
on INWQS (Badaii et al., 2013). From the study of Water quality and loading of pollutants
from shrimp ponds during harvesting at Sarawak, Ling et al. (2010a) reported that high TSS
value might be caused by new roads and housing development which results in the removal of
vegetation thus exposing the soil to erosion. Lau (2011) stated that the Rajang River are
heavily loaded with suspended solid during rainy season and TSS ranged between 460 – 1009
mg/L. The decaying of logs could release suspended organic particles and contributed to
amount of TSS (Murphy, 2007). Elevated levels of solids increase turbidity reducing
penetration of light at depth within the water column and limit the growth of desirable aquatic
plants (Meybeck et al., 1996). High level of TSS reduced the light from passing through the
water, photosynthesis slows down. Reduced rates of photosynthesis caused less dissolved
oxygen to be released into the water by plants (Murphy, 2007).
Page 21
14
SRP
Soluble reactive phosphate is largely a measure of orthophosphate (PO43-
) (USEPA,
2012). Natural cycling of phosphorus, fertilizers, detergents and soil erosion are the sources of
phosphate (Western Australia Department of Water, 2009). Natural range of P- PO43-
in river
is 0.002 – 0.025 mg/L (Meybeck et al., 1996). Ling et al. (2011) stated the stations that near to
settlement, household phosphorus from laundry and septic tank discharge might have given
rise to high RP value. Another research in Semenyih River examined the concentration of
phosphate (PO4) ranged from 0.08 – 0.95 mg/L during raining season and 0.62 – 1.9 mg/L
during dry season, the value generally exceed the normal level of INWQS for Malaysian rivers
which is 0.2 mg/L, thus, fall into class V (Badaii et al., 2013). Household waste water which
contains detergents (laundry, bathing and washing), fertilizer runoff and toilet flushing that
discharge directly into the river are the main reasons of high concentration of phosphate in
river water (Bellingham, n. d.). Furthermore, rainfall can cause varying amounts of phosphates
to wash from farm soils into nearby waterways too (Oram, 2014). According to Chapman &
Kimstach (1996), the higher the pH, the more PO43-
will form from the deprotination of
HPO42-
.
TP
Phosphorus occurs as inorganic and organic phosphate in aquatic systems (USEPA,
2012). Total phosphorus test examines all classes of phosphorus which are known as
orthophosphates (PO43-
), condensed phosphates (pyro-, meta-, and other polyphosphates), and
organic or inorganic forms of phosphorus (APHA, 1999). Phosphorus changes form as it
cycles (Figure 2) throughout the aquatic environment, aquatic plants get dissolved inorganic
phosphorus and switch to organic phosphorus while animals take in organic phosphorus by
Page 22
15
consuming animals, aquatic plants or decomposing animal and plant material (USEPA, 2012).
Organic phosphorus from animal and plants excrete wastes or die plants and animals descends
to the bottom, switches back to inorganic phosphorus via bacterial decomposition then gets
back to water column when the bottom is swirled up by anthropogenic activity, chemical
interaction, water current or animals (USEPA, 2012). Sources of phosphorus enhancement
may include some detergents, runoff from fertilized lawns, disturbed land areas, animal faeces,
sewage and some industrial wastes (Western Australia Department of Water, 2009). In streams
system, phosphorus cycle will move the phosphorus to downstream as current carries decaying
animal and plant tissue and dissolved phosphorus (USEPA, 2012). Loads of total phosphorus
upstream from the Hudson impoundment normally exceeded those downstream during the
same sampling periods throughout the study (Zimmerman & Savoie, 2013). Ling et al. (2013)
stated that the sources of phosphorus are organic phosphorus from human urine and feces and
domestic animals. Water bodies that have TP concentration <10 ppb, is considered nutrient-
deprived and unable to support huge quantities of algae and aquatic plants while TP
concentration >100 ppb classify lakes as highly eutrophic, with great nutrient and algae levels
(Minnesota Pollution Control Agency, 2007). Surface waters that have TP concentration
maintained at 0.01 – 0.03 mg/L tend to remain unpolluted or uncontaminated by algal blooms
(NC SU Water Quality Group, 1976).
Figure 2: Phosphorus cycle between atmosphere and water
Page 23
16
Nitrite & Nitrate
Nitrogen cycle represents one of the most essential nutrient cycles found in terrestrial
ecosystem (Figure 3). NO2- is an intermediate form of nitrogen and short-lived as it is quickly
oxidized to nitrate (APHA, 1999). EPA has set a highest contaminant level at 1 mg/L of nitrite
and 10 mg/L of nitrate for drinking water (USEPA, 2012). Nitrite levels are normally low (<
0.01 mg/L) in unpolluted waters (Environment Protective Agency, n.d.). Nitrite may enter the
water supply system during its utilize as a deterioration inhibitor in industrial process water
(APHA, 1999). Study of Ling et al. (2010b) shows that higher value of NO2-N might be due to
its location near the shrimp farm discharge tributary or cage culture site. NO3- is an important
plant nutrient and its concentrations in natural waterways are generally low (< 1 mg/L)
(Western Australia Department of Water, 2009). Sources of nitrate are manure, agricultural
fertilizers, garbage dumps, industrial waste waters, septic system, sanitary landfills and animal
feed lots (Minnesota Pollution Control Agency, 2008). Level of nitrate exceed 5 mg/L in
natural water generally indicates man made pollution and nitrate level at about 30 mg/L will
become toxic to fish (Bellingham, n. d.). Concentration of nitrate in Semenyih River ranged
from 4,23 - 8.53 mg/L during raining season while during dry season, it ranged from 1 – 6.3
mg/L and the nitrate values were within maximum permissible limit set by INWQS, Malaysia
(Badaii et al., 2013). Another research shows there is a higher value of NO3-N in the river
water near to the construction and residential areas or shrimp culture site (Ling et al., 2010b).
Page 24
17
Figure 3: Nitrogen cycle (Pidwirny, 2006).
TAN
TAN is the total amount of ammonia nitrogen and ammonium nitrogen species which
exist in equilibrium in aqueous solution (APHA, 1999). Decomposition of organic waste
matter, fertilizers, gas exchange with atmosphere, animal and human waste are sources of
ammonia (Western Australia Department of Water, 2009; USEPA, 2013). In, addition, higher
concentrations could be an indicator of organic pollution (domestic waste) (Chapman &
Kimstach, 1996). Unpolluted natural water contain very small amount of ammonia (< 0.02
mg/L as N) (Environment Protective Agency, n. d.). Ammonia concentration that exceeded the
recommended limit might harm the aquatic life in the river (Gandaseca et al., 2011). The
limited value of ammonia in water bodies class II are 3.7 mg/L NH3-N to pH < 7.5 and 2 mg/L
NH3 –N to pH > 7.5 (Braz, 2009). Ammonia will be the predominate form at higher pH and
ammonia ion will be predominate at lower pH. As the pH increases, unionized ammonia, NH3
is much more volatile than ionized form and will leave the aqueous solution by volatilization.