39
p a Fahrzeugkomfort und Akustik durch Weiterent- wicklungen der Transferpfadanalyse optimieren Arnd Balger Where today meets tomorrow. Unrestricted © Siemens 2020

p
a
Fahrzeugkomfort und Akustik durch Weiterent-
wicklungen der Transferpfadanalyse optimieren
Arnd Balger
Where today meets tomorrow.Unrestricted © Siemens 2020

Unrestricted © Siemens 2020
Page 2 Siemens Digital Industries Software
Typical NVH engineering challenges that can be addressed with
Transfer Path Analysis
Electric motor
Road Noise
Wind noise
HVAC
Engine
Pass-by noise

Unrestricted © Siemens 2020
Page 3 Siemens Digital Industries Software
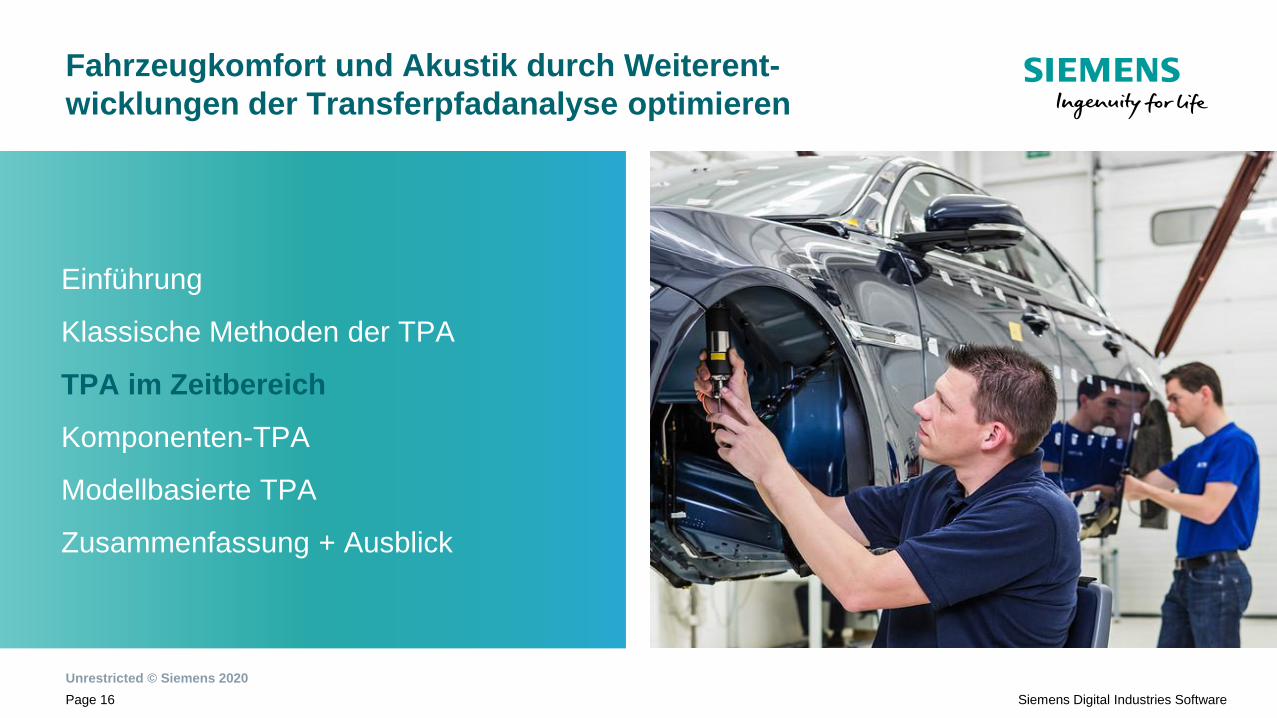
Einführung
Klassische Methoden der TPA
TPA im Zeitbereich
Komponenten-TPA
Modellbasierte TPA
Zusammenfassung + Ausblick
Fahrzeugkomfort und Akustik durch Weiterent-
wicklungen der Transferpfadanalyse optimieren

Unrestricted © Siemens 2020
Page 4 Siemens Digital Industries Software
P
a
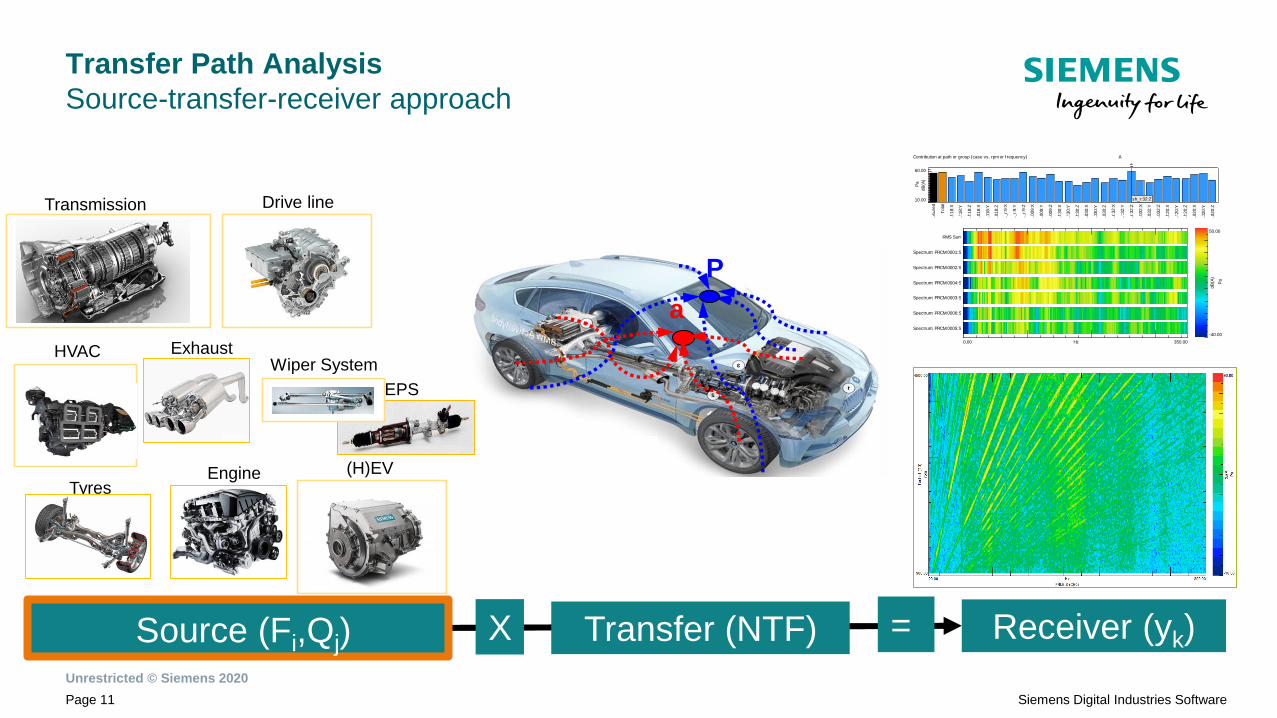
Transfer Path Analysis
Source-transfer-receiver approach
X =Source (Fi,Qj) Transfer (NTF) Receiver (yk)
Engine
Exhaust
Tyres
EPS
(H)EV
Drive lineTransmission
HVACWiper System
Measure
d..
Tota
l
be_f:18:X
..
be_f:18:Y
..
be_f:18:Z
..
be_f:5018:X
..
be_f:5018:Y
..
be_f:5018:Z
..
be_r:
9:X
..
be_r:
9:Y
..
be_r:
9:Z
..
be_r:
5009:X
..
be_r:
5009:Y
..
be_r:
5009:Z
..
sh_f:30:X
..
sh_f:30:Y
..
sh_f:30:Z
..
sh_f:5030:X
..
sh_f:5030:Y
..
sh_f:5030:Z
..
sh_r:
32:X
..
sh_r:
32:Y
..
sh_r:
32:Z
..
sh_r:
5032:X
..
sh_r:
5032:Y
..
sh_r:
5032:Z
..
subf:20:X
..
subf:20:Y
..
subf:20:Z
..
subf:5020:X
..
subf:5020:Y
..
subf:5020:Z
..
10.00
60.00
dB
(A)
Pa
sh_r:32:Z
0.00 350.00Hz
RMS Sum
Spectrum: PRCM:0001:S
Spectrum: PRCM:0002:S
Spectrum: PRCM:0004:S
Spectrum: PRCM:0003:S
Spectrum: PRCM:0006:S
Spectrum: PRCM:0005:S
-40.00
50.00
dB
(A)
Pa
Contribution at path or group (case vs. rpm or frequency) A

Unrestricted © Siemens 2020
Page 5 Siemens Digital Industries Software
Order: 2.0 Order: 3.0 Order: 4.0 Order: 5.0 Order: 6.0
90.00Pa
Order: 2.0
80.26 FRLE
4400950 rpm
Measured
BODY:0005
FSUB:0101
BODY:0002
FSUB:0601
FSUB:0102
FSUB:0105
90
-10
dB(A
)
Pa
3800
1:1
90.00 40.00Pa 90.00Pa
90.00
Pa
90.00
Pa
FSUB:0602FSUB:0601
FSUB:0105
BODY:0603FSUB:0605
BODY:0002
BODY:0103
FSUB:0102
BODY:0001
FSUB:0101
BODY:0005
Measured
Total
Vector contribution A
Contributions at Single Cursor Complex ( values as available ) Vector View
Introduction to Transfer Path Analysis
TPA as part of Contribution Analysis
Ste
p 2
:
Path
Sourc
e T
ransfe
r
Ste
p 1
: C
ontr
ibution A
naly
sis
Pa
ths
Frequency
Amplitude Phase Modal
Force
Transfer
Contribution

Unrestricted © Siemens 2020
Page 6 Siemens Digital Industries Software
Transfer Path Analysis
Throughout the vehicle development cycle
Bench marking &
Target setting
Concept Analysis
CAE based contribution
analysis
Auralization & Optimization
Critical component & Path
Identification
Troubleshooting
What-if games &
optimization
Target Setting Concept validation Detailed Engineering Validation/Refinement
Load Identification
Classical TPA Test/CAE combined TPA Classical TPA

Unrestricted © Siemens 2020
Page 7 Siemens Digital Industries Software
Einführung
Klassische Methoden der TPA
TPA im Zeitbereich
Komponenten-TPA
Modellbasierte TPA
Zusammenfassung + Ausblick
Fahrzeugkomfort und Akustik durch Weiterent-
wicklungen der Transferpfadanalyse optimieren

Unrestricted © Siemens 2020
Page 8 Siemens Digital Industries Software
P
a
Transfer Path Analysis
Source-transfer-receiver approach
X =Source (Fi,Qj) Transfer (NTF) Receiver (yk)
Engine
Exhaust
Tyres
EPS
(H)EV
Drive lineTransmission
HVACWiper System
Measure
d..
Tota
l
be_f:18:X
..
be_f:18:Y
..
be_f:18:Z
..
be_f:5018:X
..
be_f:5018:Y
..
be_f:5018:Z
..
be_r:
9:X
..
be_r:
9:Y
..
be_r:
9:Z
..
be_r:
5009:X
..
be_r:
5009:Y
..
be_r:
5009:Z
..
sh_f:30:X
..
sh_f:30:Y
..
sh_f:30:Z
..
sh_f:5030:X
..
sh_f:5030:Y
..
sh_f:5030:Z
..
sh_r:
32:X
..
sh_r:
32:Y
..
sh_r:
32:Z
..
sh_r:
5032:X
..
sh_r:
5032:Y
..
sh_r:
5032:Z
..
subf:20:X
..
subf:20:Y
..
subf:20:Z
..
subf:5020:X
..
subf:5020:Y
..
subf:5020:Z
..
10.00
60.00
dB
(A)
Pa
sh_r:32:Z
0.00 350.00Hz
RMS Sum
Spectrum: PRCM:0001:S
Spectrum: PRCM:0002:S
Spectrum: PRCM:0004:S
Spectrum: PRCM:0003:S
Spectrum: PRCM:0006:S
Spectrum: PRCM:0005:S
-40.00
50.00
dB
(A)
Pa
Contribution at path or group (case vs. rpm or frequency) A

Unrestricted © Siemens 2020
Page 9 Siemens Digital Industries Software
Traditional TPA methods
Efficient & Accurate FRF Acquisition
Reciprocal FRF measurement
• Measurement of multiple/all NTF
(noise transfer functions) at once,
faster than roving hammer or
shakers
Direct FRF Measurements
• Modal Hammer
✓ Common.limited quality and
repeatability
• Shaker
✓ shakers overcome hammer
issues, if small and applicable
Receiver
Ptotal
P/F1
P/F2
Receiver
Ptotal
P/F1
P/F2

Unrestricted © Siemens 2020
Page 10 Siemens Digital Industries Software
Traditional TPA methods
Requirements: Verify data quality and gain insight – the Heatmap
Gain insight in the system dynamics
1000+ FRFs in one view
Instant verification of FRF consistency by checking reciprocity,
linearity and directions errors
Unrestricted © Siemens 2020
Page 11 Siemens Digital Industries Software
P
a
Transfer Path Analysis
Source-transfer-receiver approach
X =Source (Fi,Qj) Transfer (NTF) Receiver (yk)
Engine
Exhaust
Tyres
EPS
(H)EV
Drive lineTransmission
HVACWiper System
Measure
d..
Tota
l
be_f:18:X
..
be_f:18:Y
..
be_f:18:Z
..
be_f:5018:X
..
be_f:5018:Y
..
be_f:5018:Z
..
be_r:
9:X
..
be_r:
9:Y
..
be_r:
9:Z
..
be_r:
5009:X
..
be_r:
5009:Y
..
be_r:
5009:Z
..
sh_f:30:X
..
sh_f:30:Y
..
sh_f:30:Z
..
sh_f:5030:X
..
sh_f:5030:Y
..
sh_f:5030:Z
..
sh_r:
32:X
..
sh_r:
32:Y
..
sh_r:
32:Z
..
sh_r:
5032:X
..
sh_r:
5032:Y
..
sh_r:
5032:Z
..
subf:20:X
..
subf:20:Y
..
subf:20:Z
..
subf:5020:X
..
subf:5020:Y
..
subf:5020:Z
..
10.00
60.00
dB
(A)
Pa
sh_r:32:Z
0.00 350.00Hz
RMS Sum
Spectrum: PRCM:0001:S
Spectrum: PRCM:0002:S
Spectrum: PRCM:0004:S
Spectrum: PRCM:0003:S
Spectrum: PRCM:0006:S
Spectrum: PRCM:0005:S
-40.00
50.00
dB
(A)
Pa
Contribution at path or group (case vs. rpm or frequency) A

Unrestricted © Siemens 2020
Page 12 Siemens Digital Industries Software
Load identification methods
Mount stiffness and Matrix inversion
Matrix InversionMount Stiffness
2
))()(()()(
−
−=
piai
ii
aaKF )()()(
1 aHF =
−
Unrestricted © Siemens 2020
Page 13 Siemens Digital Industries Software
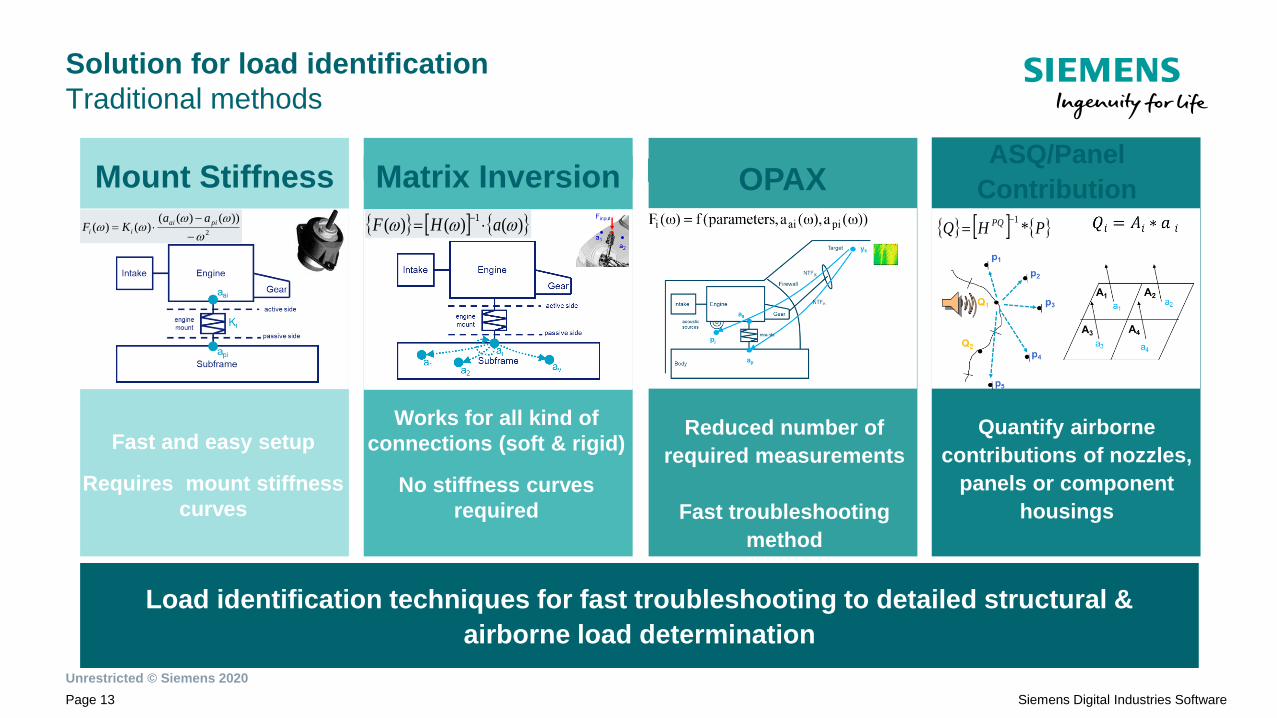
Matrix InversionMount Stiffness OPAX
Solution for load identification
Traditional methods
ASQ/Panel
Contribution
Reduced number of
required measurements
Fast troubleshooting
method
Quantify airborne
contributions of nozzles,
panels or component
housings
Works for all kind of
connections (soft & rigid)
No stiffness curves
required
Fast and easy setup
Requires mount stiffness
curves
Load identification techniques for fast troubleshooting to detailed structural &
airborne load determination
2
))()(()()(
−
−=
piai
ii
aaKF )()()(
1 aHF =
−
PHQ PQ *1−
=

Unrestricted © Siemens 2020
Page 14 Siemens Digital Industries Software
TPA method: Strain sensors based
Separating nearby paths
Strain FRF
Acceleration FRF
)()()(1
aHF =−
Advanced approach:
Strain Indicators
→ Strain responses are
dominated by a high
amount of local
structural body modes
→ Extended possibilities for
load separation /
identification
Classic approach:
Acceleration Indicators
→ Acceleration responses
are dominated by a
limited amount of global
structural body modes
→ Potential limitation for
force estimation
possibilities
Unrestricted © Siemens 2020
Page 15 Siemens Digital Industries Software
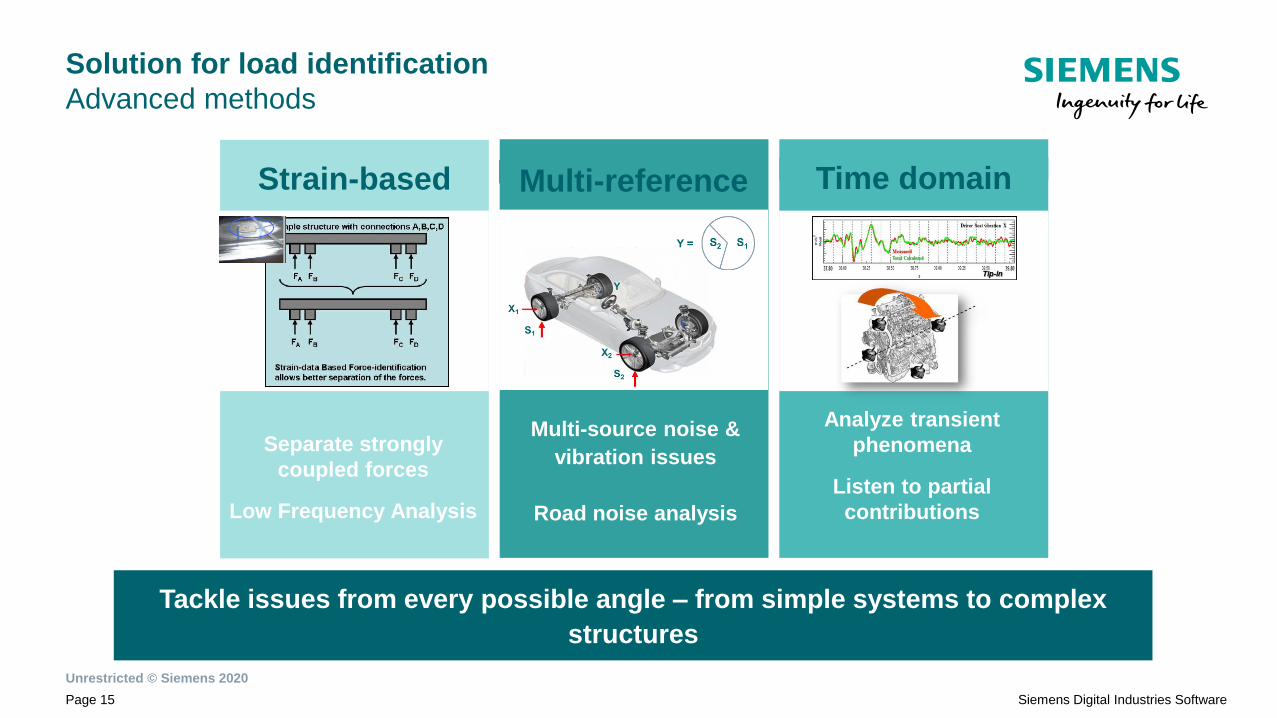
Time domainStrain-based Multi-reference
Solution for load identification
Advanced methods
Multi-source noise &
vibration issues
Road noise analysis
Analyze transient
phenomena
Listen to partial
contributions
Separate strongly
coupled forces
Low Frequency Analysis
Tackle issues from every possible angle – from simple systems to complex
structures
Unrestricted © Siemens 2020
Page 16 Siemens Digital Industries Software
Einführung
Klassische Methoden der TPA
TPA im Zeitbereich
Komponenten-TPA
Modellbasierte TPA
Zusammenfassung + Ausblick
Fahrzeugkomfort und Akustik durch Weiterent-
wicklungen der Transferpfadanalyse optimieren

Unrestricted © Siemens 2020
Page 17 Siemens Digital Industries Software
Frequency-domain vs. Time-domain TPA
FIR Filter =
=X
NTF
Auralization, Signature Analysis, Sound Quality metrics ...
Loads (orders,
spectra)
Path contributions
(orders, spectra)
Frequency
transfer
model
Loads (time traces) Path contributions
(time traces)
440.0020.00 Hz
FSUB:0105:+Y (CH1)
4500.00
900.00
rpm
Tacho1 (
T1)
20.00
-80.00
dB N
440.0020.00 Hz
FRLE:S (CH2)
4500.00
900.00
rpm
Tacho1 (
T1)
70.00
-30.00
dB Pa
120.000.00 s
24.00
-24.00
Real
N
1.00
0.00
Am
plit
ude
120.000.00 s
0.10
-0.12
Real
Pa
1.00
0.00
Am
plit
ude
Frequency-domain TPA
➔ Order analysis
➔ Spectrum analysis
✓ Run-up & run-down
✓ Stationary: e.g road noise
Time-domain TPA
➔ Time traces
✓ Run-up & run-down
✓ Stationary: e.g road noise
✓ Transient: e.g. engine start-up
✓ Semi-stationary: e.g. idle noise,
frequency modulation …

Unrestricted © Siemens 2020
Page 18 Siemens Digital Industries Software
Time-domain TPA for Tip-in/Tip-out
Application Example
…Transfer Path Analysis (TPA)
Insights in contribution
to NVH Comfort
…in “full NVH Context”
To link transient loads
to Dynamic Interface Forces…
Transient Load identification
Strain gage technology
Low frequency
Strain responses
(right) during Tip-in
Typical Tip-in / Tip-out
Response
Transient torque oscillations in the driveline
Amplified by P/T, suspension and body modes
Resulting seat and steering-wheel vibrations
Time-domain Transfer Path Analysis for Transient Phenomena Applied to Tip-in/Tip-out (Shock & Jerk)
H. Shiozaki, Y.Iwanaga, MMC, T. Geluk ,F. Daenen, J, Van Herbruggen, LMS, SAE 2012-01-1545
Time domain Path
Contribution Analysis for
Seat vibrations X-direction

Unrestricted © Siemens 2020
Page 19 Siemens Digital Industries Software
Transfer Path Analysis:
More insight with TPA Synthesis
Immediate
assessment of design
modifications. real-
time filtering and
auralization of partial
contributions for
subjective sound
qualification and A/B
comparisons
Unrestricted © Siemens 2020
Page 20 Siemens Digital Industries Software
Einführung
Klassische Methoden der TPA
TPA im Zeitbereich
Komponenten-TPA
Modellbasierte TPA
Zusammenfassung + Ausblick
Fahrzeugkomfort und Akustik durch Weiterent-
wicklungen der Transferpfadanalyse optimieren
Unrestricted © Siemens 2020
Page 21 Siemens Digital Industries Software
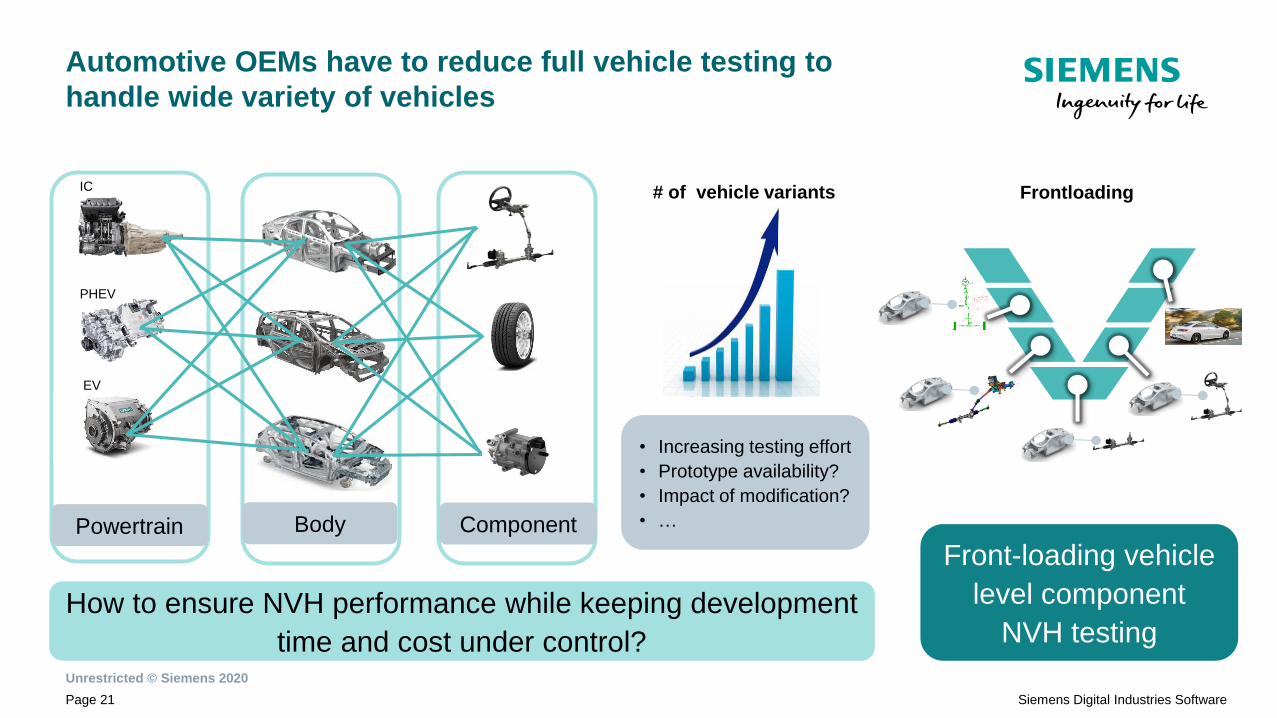
Automotive OEMs have to reduce full vehicle testing to
handle wide variety of vehicles
Body Component
• Increasing testing effort
• Prototype availability?
• Impact of modification?
• …
How to ensure NVH performance while keeping development
time and cost under control?
Powertrain
Front-loading vehicle
level component
NVH testing
Frontloading# of vehicle variantsIC
PHEV
EV
Unrestricted © Siemens 2020
Page 22 Siemens Digital Industries Software
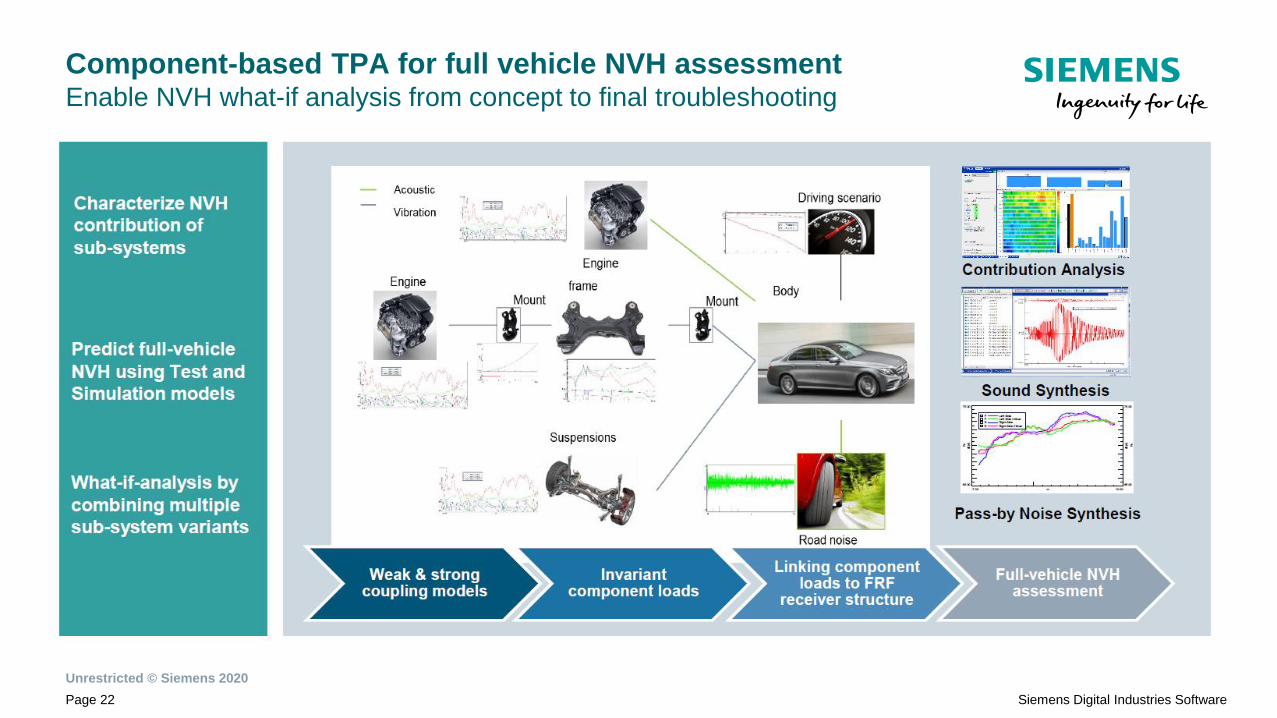
Component-based TPA for full vehicle NVH assessmentEnable NVH what-if analysis from concept to final troubleshooting
Unrestricted © Siemens 2020
Page 23 Siemens Digital Industries Software
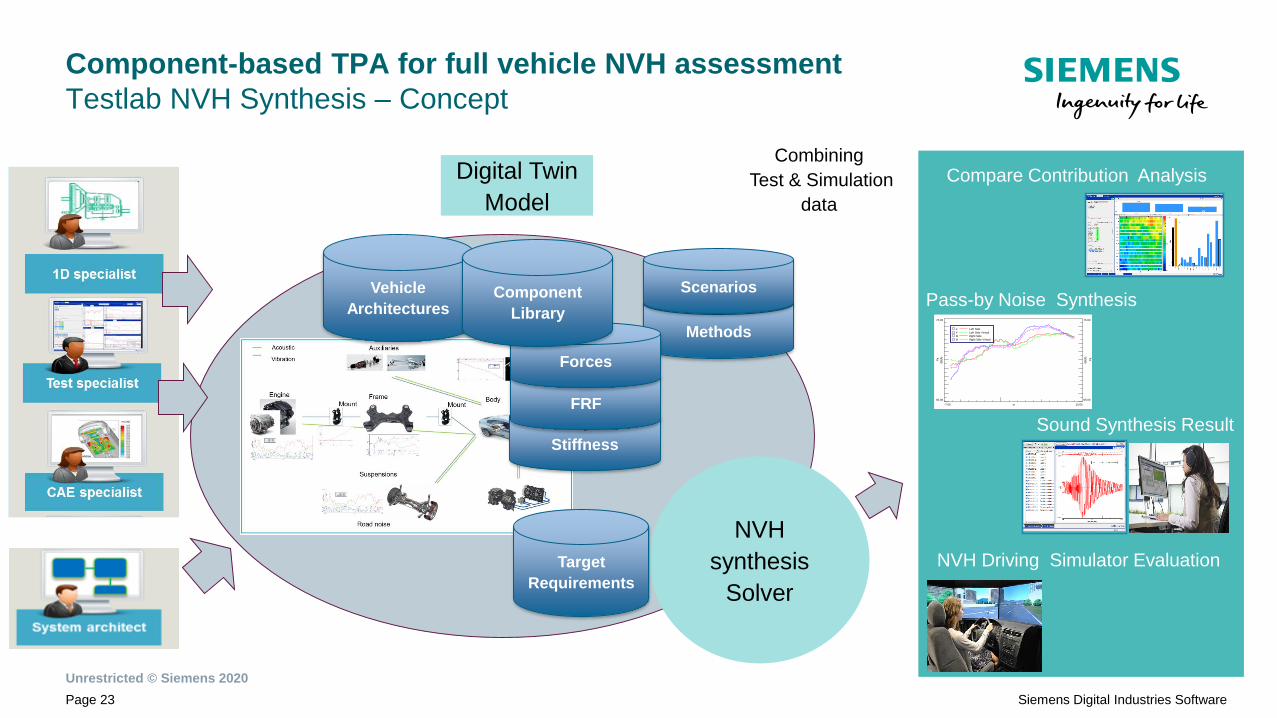
Component-based TPA for full vehicle NVH assessment
Testlab NVH Synthesis – Concept
NVH
synthesis
Solver
Digital Twin
Model
Methods
Scenarios
-7.00 10.00m
65.00
75.00
dB
(A)
Pa
65.00
75.00
dB
(A)
Pa
F Left Side
F Left Side Virtual
B Right Side
B Right Side Virtual
Compare Contribution Analysis
Sound Synthesis Result
Pass-by Noise Synthesis
NVH Driving Simulator Evaluation
Combining
Test & Simulation
data
Vehicle
Architectures
Stiffness
FRF
Forces
Component
Library
Target
Requirements

Unrestricted © Siemens 2020
Page 24 Siemens Digital Industries Software
Component-based TPA
Invariant load characterization
Structure-borne:
Airborne:
Blocked Forces
Volume Velocities
Receiver independent, allowing:
• Validating sources against
receiver independent targets
• Benchmarking or validating
modifications
• Predicting NVH performance in
arbitrary source-receiver
assemblies
Invariant load characterization

Unrestricted © Siemens 2020
Page 25 Siemens Digital Industries Software
1. Blocked Force
Source A
12
F source
𝑭2,𝐵𝑙𝑜𝑐𝑘𝑒𝑑
2. Free Velocity/Acceleration
Source A
12
F source𝒂𝟐,𝑭𝒓𝒆𝒆
𝑯22𝐴 −𝟏𝒂𝟐,𝑭𝒓𝒆𝒆 = 𝑭2,𝐵𝑙𝑜𝑐𝑘𝑒𝑑
3. In-Situ TPA
Source A Receiver B
12
5
4
F source
4
𝑯24𝐴𝐵
𝑭2,𝐵𝑙𝑜𝑐𝑘𝑒𝑑 = 𝑯24𝐴𝐵 +𝒂𝟒
Source:Elliott, Moorhouse, Characterization of the structure borne
sound sources from measurements in-situ, 2008
Source: Mondot, Petersson, Characterization of structure-borne
sound sources: The source descriptor and the coupling function
1987
Three possible methodologies to obtain independent source description
Rigid test rig → Often not possible Source in free free conditions (ISO 9611) Any receiver is valid (ISO 20270-2019)
Component-based TPA
Invariant load characterization for structural paths
3

Unrestricted © Siemens 2020
Page 26 Siemens Digital Industries Software
50020 50 100 150 200 250 300 350 400 450
Hz
20
-60
-50
-40
-30
-20
-10
0
10
dBg
180.00
-180.00
Phase
°
Harmonic Spectrum P3:T1:+Z Measured
Harmonic Spectrum P3:T1:+Z<Total Contact bench
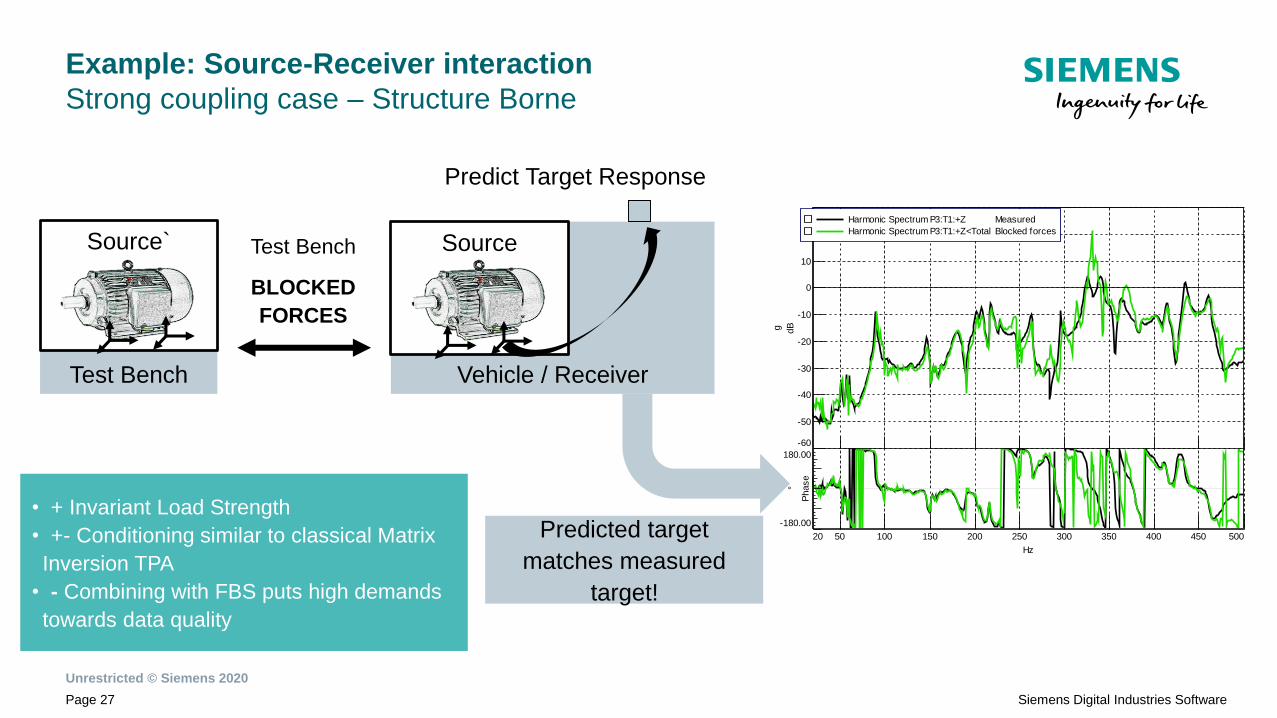
Example: Source-Receiver interaction
Strong coupling case – Structure Borne
Test Bench
Source`
Vehicle / Receiver
Source
Predict Target Response
Test bench
CONTACT
FORCES
Predicted target
deviates from
measured target!
Unrestricted © Siemens 2020
Page 27 Siemens Digital Industries Software
50020 50 100 150 200 250 300 350 400 450
Hz
30
-60
-50
-40
-30
-20
-10
0
10
20
dBg
180.00
-180.00
Phase
°
Harmonic Spectrum P3:T1:+Z Measured
Harmonic Spectrum P3:T1:+Z<Total Blocked forces
Example: Source-Receiver interaction
Strong coupling case – Structure Borne
Test Bench
Source`
Vehicle / Receiver
Source
Predict Target Response
Predicted target
matches measured
target!
Test Bench
BLOCKED
FORCES
• + Invariant Load Strength
• +- Conditioning similar to classical Matrix
Inversion TPA
• - Combining with FBS puts high demands
towards data quality

Unrestricted © Siemens 2020
Page 28 Siemens Digital Industries Software
Virtual Point Transformation
Accurate FRFs at interface connection points
Solution:
▪ Geometrical Reduction / Virtual Point
Transformation
▪ Assumption: local rigidity in the connection
▪ Input: Geometry Information and FRFs
Challenge:
▪ High quality transfer functions at precise
locations.
▪ Transfer functions at difficult to access
positions
▪ Translational and rotational transfer
functions (DOFs)1000.000.00 Hz
80.00
-80.00
dBN
180.00
-180.00
Phase
°
Blocked force
at connection
Blocked force
off connection
VP for correct blocked force estimation
VP for correct assembly using FBS
VP
Unrestricted © Siemens 2020
Page 29 Siemens Digital Industries Software
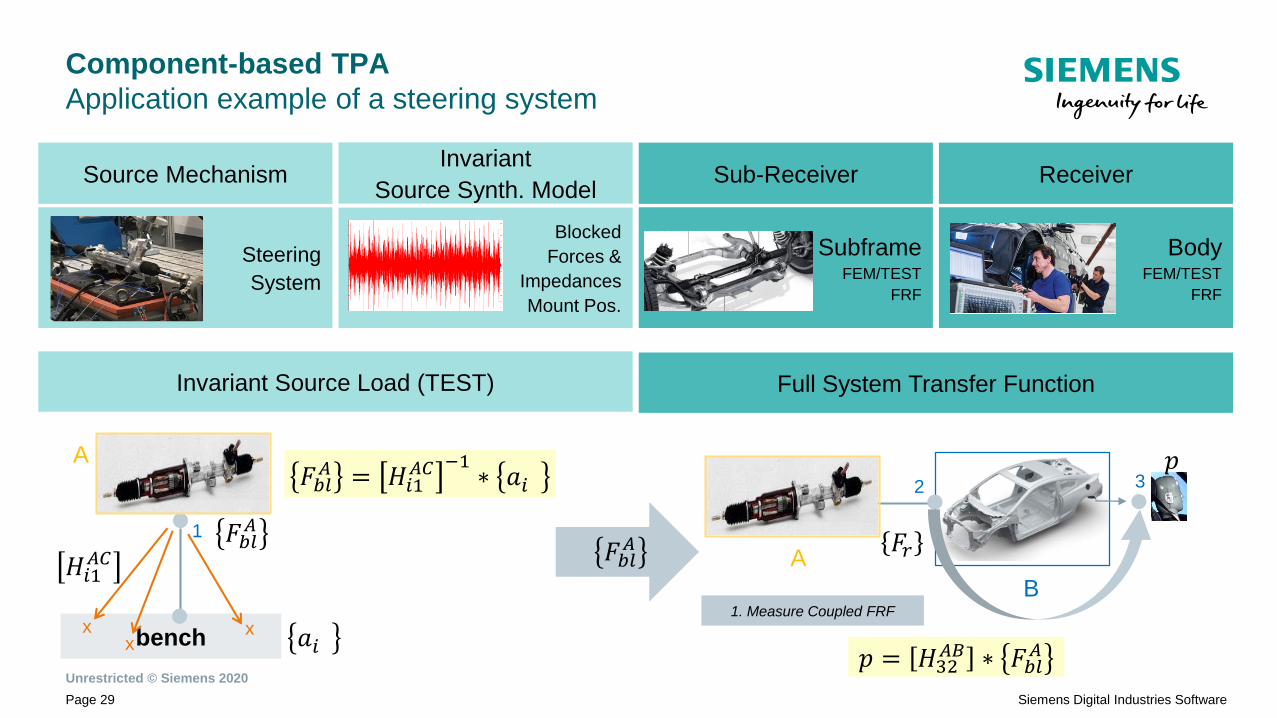
Component-based TPA
Application example of a steering system
Source MechanismInvariant
Source Synth. ModelSub-Receiver Receiver
Steering
System
Blocked
Forces &
Impedances
Mount Pos.
SubframeFEM/TEST
FRF
BodyFEM/TEST
FRF
Invariant Source Load (TEST) Full System Transfer Function
bench
1
A
𝑎𝑖xx
x
𝐻𝑖1𝐴𝐶
𝐹𝑏𝑙𝐴
𝐹𝑏𝑙𝐴 = 𝐻𝑖1
𝐴𝐶 −1∗ 𝑎𝑖
𝐹𝑏𝑙𝐴
3𝑝
1 2
A
B
𝐹𝑟
𝑝 = 𝐻32𝐴𝐵 ∗ 𝐹𝑏𝑙
𝐴
1. Measure Coupled FRF
Unrestricted © Siemens 2020
Page 30 Siemens Digital Industries Software
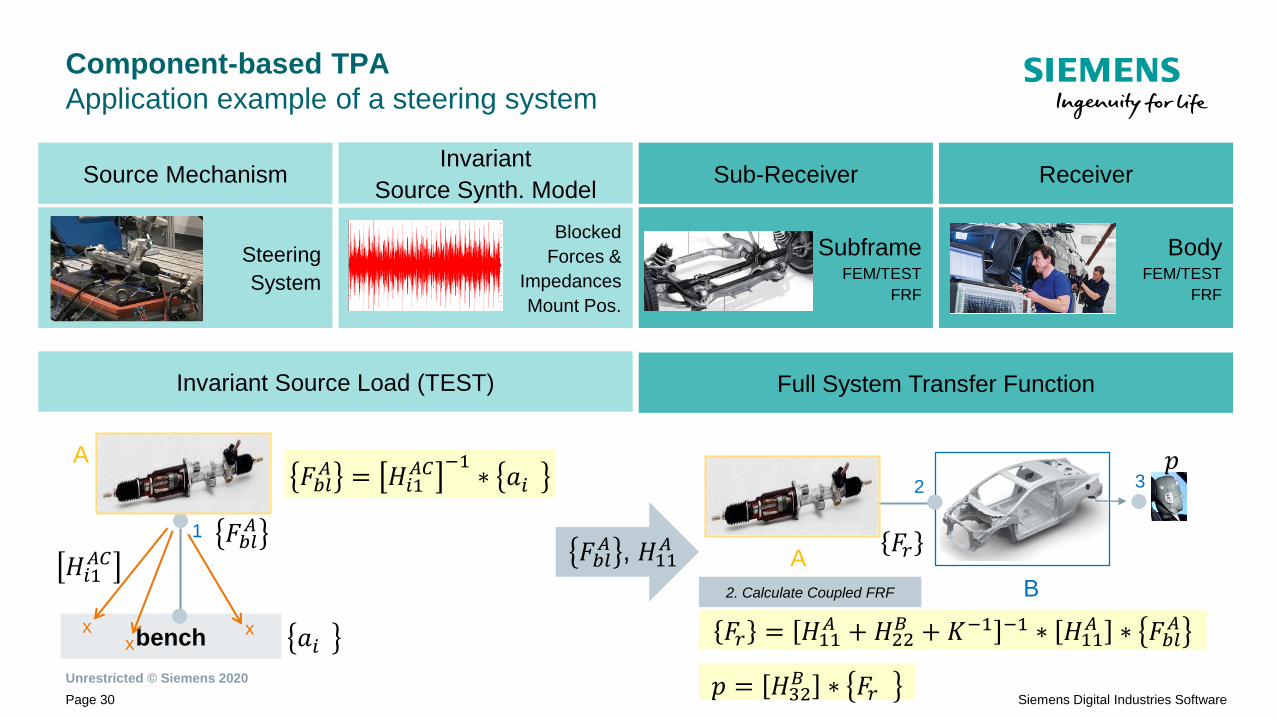
Component-based TPA
Application example of a steering system
Source MechanismInvariant
Source Synth. ModelSub-Receiver Receiver
Steering
System
Blocked
Forces &
Impedances
Mount Pos.
SubframeFEM/TEST
FRF
BodyFEM/TEST
FRF
Invariant Source Load (TEST) Full System Transfer Function
bench
1
A
𝑎𝑖xx
x
𝐻𝑖1𝐴𝐶
𝐹𝑏𝑙𝐴
𝐹𝑏𝑙𝐴 = 𝐻𝑖1
𝐴𝐶 −1∗ 𝑎𝑖
𝐹𝑏𝑙𝐴 , 𝐻11
𝐴
3𝑝
1 2
A
B
𝐹𝑟
𝐹𝑟 = 𝐻11𝐴 + 𝐻22
𝐵 + 𝐾−1 −1 ∗ 𝐻11𝐴 ∗ 𝐹𝑏𝑙
𝐴
𝑝 = 𝐻32𝐵 ∗ 𝐹𝑟
2. Calculate Coupled FRF

Unrestricted © Siemens 2020
Page 31 Siemens Digital Industries Software
2. Load & Contribution Prediction1. Assembly Definition
Component-based TPA
Assembly & Prediction (Simcenter Testlab 2019.1)
The complete Component Based TPA process fully integrated in Simcenter Testlab

Unrestricted © Siemens 2020
Page 32 Siemens Digital Industries Software
Airborne example application:
PBN Performance Prediction
SOURCE
Invariant description of
sources
Recombine with selected
components to synthesize
SYSTEMS
Predict NVH performance
VA
RIA
NT
A
VA
RIA
NT
B
All Design Variants
VE
HIC
LE
1
VE
HIC
LE
VA
RIA
NT
S
Vehicle Variants
Unrestricted © Siemens 2020
Page 33 Siemens Digital Industries Software
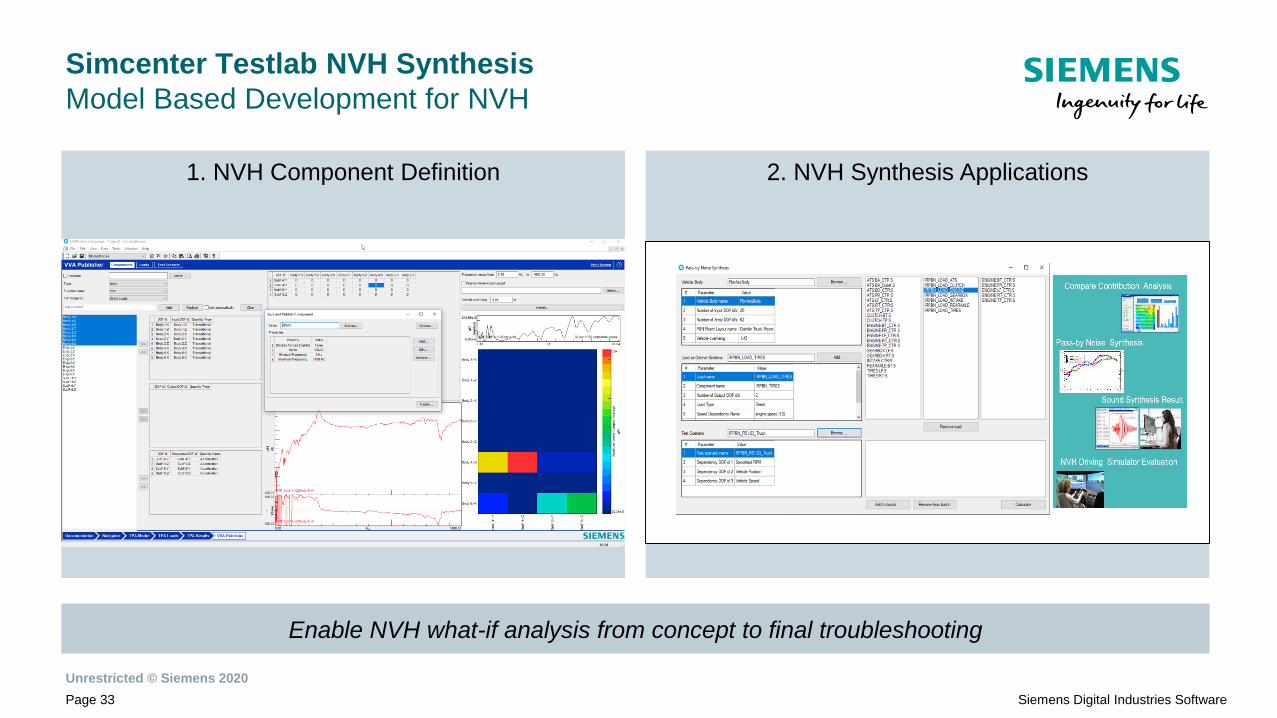
2. NVH Synthesis Applications
Simcenter Testlab NVH Synthesis
Model Based Development for NVH
1. NVH Component Definition
Enable NVH what-if analysis from concept to final troubleshooting

Unrestricted © Siemens 2020
Page 34 Siemens Digital Industries Software
Einführung
Klassische Methoden der TPA
TPA im Zeitbereich
Komponenten-TPA
Modellbasierte TPA
Zusammenfassung + Ausblick
Fahrzeugkomfort und Akustik durch Weiterent-
wicklungen der Transferpfadanalyse optimieren

Unrestricted © Siemens 2020
Page 35 Siemens Digital Industries Software
Model-base TPA
Gearbox Noise – Multi-Body Dynamics + Structural Dynamics
SOURCE PATH TRANSFER RECEIVER
Operational surface vibrations
Operational connection forces (to body)Gear rattle or meshing forces in
function of volute profile, misalignment,
torque load, …
Full system of gears, axles and body
including their respective flexibility

Unrestricted © Siemens 2020
Page 36 Siemens Digital Industries Software
Gearbox Noise – Structural Dynamics and Acoustics
Operational surface vibrations
(Airborne noise)
Operational connection forces
(structure borne noise) Vibro-Acoustic FRFs
Acoustic FRFs SPL/ surface vibration
Cabin Powertrain Noise
Installed condition
Free radiation condition
Exterior Pass-By Noise
Ext. Component Noise
SOURCE PATH TRANSFER RECEIVER

Unrestricted © Siemens 2020
Page 37 Siemens Digital Industries Software
Model-based TPA
Application example: Low frequency driveline booming
Vibro-acoustic
response
TPA Analysis
Driveline properties
Geometric & mount design
Driveline + Chassis
& Vehicle
Controls development Traditional NVH Engineering
Transmission Model
Clutch +
Transmission +
Torque Converter
ECU / TCU
Combustion
Pressure Engine Model
Extending TPA to system simulation and controls development

Unrestricted © Siemens 2020
Page 38 Siemens Digital Industries Software
Einführung
Klassische Methoden der TPA
TPA im Zeitbereich
Komponenten-TPA
Modellbasierte TPA
Zusammenfassung + Ausblick
Fahrzeugkomfort und Akustik durch Weiterent-
wicklungen der Transferpfadanalyse optimieren
Unrestricted © Siemens 2020
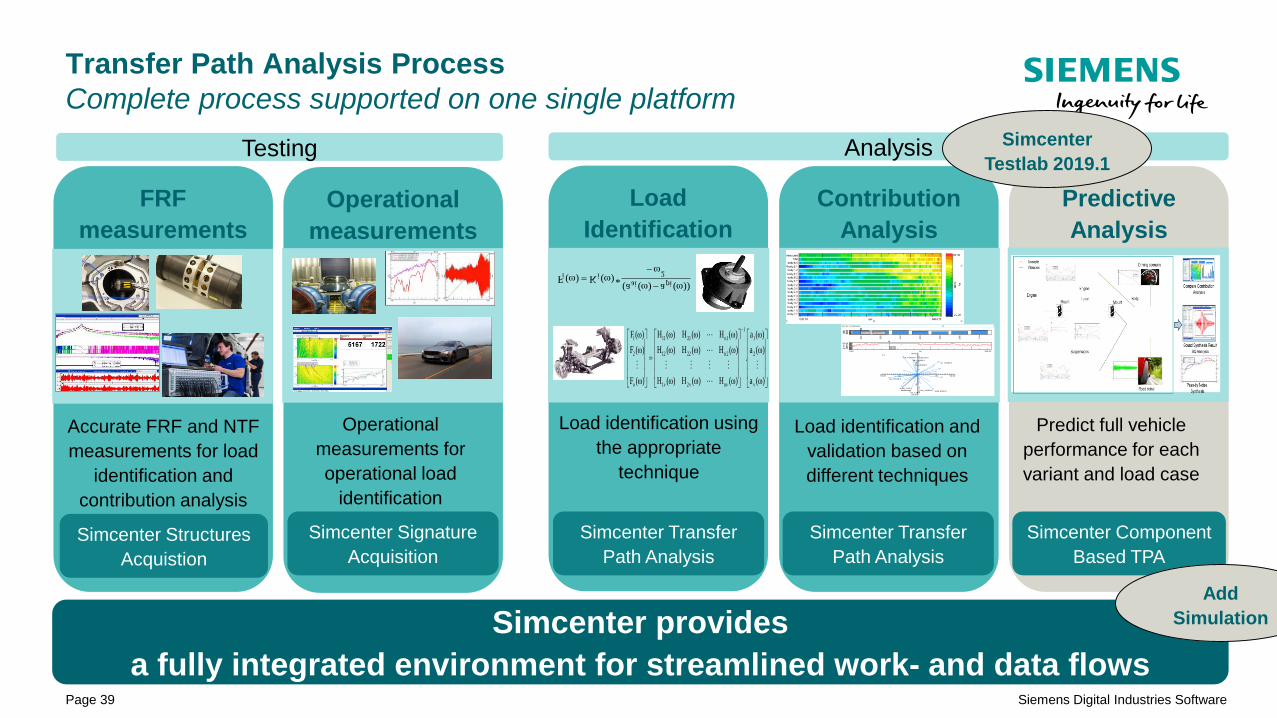
Page 39 Siemens Digital Industries Software
Predictive
Analysis
Contribution
Analysis
Load
Identification
Operational
measurements
FRF
measurements
Transfer Path Analysis Process
Complete process supported on one single platform
Accurate FRF and NTF
measurements for load
identification and
contribution analysis
Simcenter Structures
Acquistion
Simcenter provides
a fully integrated environment for streamlined work- and data flows
Simcenter Signature
Acquisition
Simcenter Transfer
Path Analysis
Simcenter Transfer
Path Analysis
Simcenter Component
Based TPA
Operational
measurements for
operational load
identification
Load identification using
the appropriate
technique
Load identification and
validation based on
different techniques
Predict full vehicle
performance for each
variant and load case
Spe
ctru
m: P
RC
M:0
001:
S..
Spe
ctru
m: P
RC
M:0
002:
S..
Spe
ctru
m: P
RC
M:0
003:
S..
Spe
ctru
m: P
RC
M:0
004:
S..
Spe
ctru
m: P
RC
M:0
005:
S..
Spe
ctru
m: P
RC
M:0
006:
S..
RM
S S
um..
10.00
60.00
dB(A
)
Pa
Spectrum: PRCM:0001:S
0.00 350.00Hz
-40.00
60.00
dB(A
)
Pa
99.00
1:1
0.0050.00 Pa 50.00Pa
50.00
Pa
50.00
Pa
be_f:5018:X
be_f:18:Xsubf:5020:X
subf:20:X
sh_f:5030:Y
be_f:5018:Z
be_r:5009:X
be_f:18:Y
be_r:5009:Y
be_r:5009:Z
Measured
Vector contribution A
=
−
)(a
)(a
)(a
.
)(H)(H)(H
)(H)(H)(H
)(H)(H)(H
)(F
)(F
)(F
v
2
1
1
nvv2v1
2n2212
1n2111
n
2
1
2
piaiii
))(a)(a(*)(K)(F
−
−=
Testing Analysis Simcenter
Testlab 2019.1
Add
Simulation


