NASA/TM-2005-213530 Failure Models and Criteria for FRP Under In-Plane or Three-Dimensional Stress States Including Shear Non-Linearity Silvestre T. Pinho Imperial College, London, UK Carlos G. Dávila NASA Langley Research Center, Hampton, Virginia Pedro P. Camanho University of Porto, Porto, Portugal Lorenzo Iannucci Imperial College, London, UK Paul Robinson Imperial College, London, UK February 2005 https://ntrs.nasa.gov/search.jsp?R=20050110223 2018-05-20T02:34:16+00:00Z
Transcript
NASA/TM-2005-213530
Failure Models and Criteria for FRP Under In-Plane or Three-Dimensional Stress States Including Shear Non-Linearity
Silvestre T. Pinho Imperial College, London, UK
Carlos G. Dávila NASA Langley Research Center, Hampton, Virginia
Pedro P. Camanho University of Porto, Porto, Portugal
Since its founding, NASA has been dedicated to the advancement of aeronautics and space science. The NASA Scientific and Technical Information (STI) Program Office plays a key part in helping NASA maintain this important role. The NASA STI Program Office is operated by Langley Research Center, the lead center for NASA’s scientific and technical information. The NASA STI Program Office provides access to the NASA STI Database, the largest collection of aeronautical and space science STI in the world. The Program Office is also NASA’s institutional mechanism for disseminating the results of its research and development activities. These results are published by NASA in the NASA STI Report Series, which includes the following report types: • TECHNICAL PUBLICATION. Reports of
completed research or a major significant phase of research that present the results of NASA programs and include extensive data or theoretical analysis. Includes compilations of significant scientific and technical data and information deemed to be of continuing reference value. NASA counterpart of peer-reviewed formal professional papers, but having less stringent limitations on manuscript length and extent of graphic presentations.
• TECHNICAL MEMORANDUM.
Scientific and technical findings that are preliminary or of specialized interest, e.g., quick release reports, working papers, and bibliographies that contain minimal annotation. Does not contain extensive analysis.
• CONTRACTOR REPORT. Scientific and
technical findings by NASA-sponsored contractors and grantees.
• CONFERENCE PUBLICATION. Collected papers from scientific and technical conferences, symposia, seminars, or other meetings sponsored or co-sponsored by NASA.
• SPECIAL PUBLICATION. Scientific,
technical, or historical information from NASA programs, projects, and missions, often concerned with subjects having substantial public interest.
• TECHNICAL TRANSLATION. English-
language translations of foreign scientific and technical material pertinent to NASA’s mission.
Specialized services that complement the STI Program Office’s diverse offerings include creating custom thesauri, building customized databases, organizing and publishing research results ... even providing videos. For more information about the NASA STI Program Office, see the following: • Access the NASA STI Program Home
Page at http://www.sti.nasa.gov • E-mail your question via the Internet to
Desk at (301) 621-0134 • Telephone the NASA STI Help Desk at
(301) 621-0390 • Write to:
NASA STI Help Desk NASA Center for AeroSpace Information 7121 Standard Drive Hanover, MD 21076-1320
NASA/TM-2005-213530
Failure Models and Criteria for FRP UnderIn-Plane or Three-Dimensional Stress StatesIncluding Shear Non-Linearity
Silvestre T. Pinho Imperial College, London, UK
Carlos G. Dávila NASA Langley Research Center, Hampton, Virginia
Pedro P. Camanho University of Porto, Porto, Portugal
Lorenzo Iannucci Imperial College, London, UK
Paul Robinson Imperial College, London, UK
National Aeronautics and Space Administration
NASA Langley Research CenterHampton, VA 23681
February 2005
Available from:
NASA Center for AeroSpace Information National Technical Information Service7121 Standard Drive 5285 Port Royal RoadHanover, MD 21076-1320 Springfield, VA 22161301-621-0390 703-605-6000
Failure models and criteria for FRP under
in-plane or three-dimensional stress states
including shear non-linearity
S T Pinho a, C G Davila b, P P Camanho c, L Iannucci a,P Robinson a
aDepartment of Aeronautics, South Kensington Campus, Imperial College London,SW7 2AZ, London, U.K.
bNASA Langley Research Center, Hampton, VA, USAcDEMEGI, Faculdade de Engenharia, Universidade do Porto, Rua Dr. Roberto
Frias, 4200-465 Porto, Portugal
Abstract
A set of three-dimensional failure criteria for laminated fiber-reinforced composites,denoted LaRC04, is proposed. The criteria are based on physical models for eachfailure mode and take into consideration non-linear matrix shear behaviour. Themodel for matrix compressive failure is based on the Mohr-Coulomb criterion and itpredicts the fracture angle. Fiber kinking is triggered by an initial fiber misalignmentangle and by the rotation of the fibers during compressive loading. The plane offiber kinking is predicted by the model. LaRC04 consists of 6 expressions that canbe used directly for design purposes. Several applications involving a broad rangeof load combinations are presented and compared to experimental data and otherexisting criteria. Predictions using LaRC04 correlate well with the experimentaldata, arguably better than most existing criteria. The good correlation seems to beattributable to the physical soundness of the underlying failure models.
1 Introduction
The greatest difficulty in the development of an accurate and computationallyefficient numerical procedure to predict damage has to do with how to model
the material micro-structural changes and how to relate those changes to thematerial response. The results of the Word Wide Failure Exercise (WWFE)[1] indicate that—even for simple unidirectional layup and in-plane loading—current failure models and criteria fall short of providing a satisfactory de-scription and prediction of failure. In fact, the mechanisms that lead to failurein composite materials are not fully understood yet.
If composite materials are to be used in structural applications, then the un-derstanding of how each failure mode takes place—i.e. having a physical modelfor each failure mode—becomes an important point of concern. These phys-ical models should establish when failure takes place, and also describe thepost-failure behaviour. For instance, a physical model for matrix compressionfailure should predict that failure occurs when some stress state is achieved, aswell as what orientation should the fracture plane have and how much energyshould the crack formation dissipate.
The main failure modes of laminated fiber-reinforced composites are:
Delamination. Composite materials made of different plies stacked togethertend to delaminate. The bending stiffness of delaminated panels can be signif-icantly reduced, even when no visual defect is visible on the surface or the freeedges. The physics of delamination is to a certain degree understood, and oneof the best numerical tools to predict the propagation of delamination consistson the use of Decohesion Elements. These elements have been developed [2,3],and implemented in a commercial Finite Element (FE) code [4]; no furtherdiscussion of delamination as a failure mode is thus carried here.
Matrix compression failure. What is commonly referred to as matrix com-pression failure is actually shear matrix failure. Indeed, the failure occurs atan angle with the loading direction, which is evidence of the shear nature ofthe failure process.
Fiber compression failure. This failure mode is largely affected by the resinshear behaviour and imperfections such as the initial fiber misalignment angleand voids. Typically, kinking bands can be observed at a smaller scale, andare the result of fiber micro-buckling, matrix shear failure or fiber failure.
Matrix tensile failure. The fracture surface resulting from this failure modeis typically normal to the loading direction. Some fiber splitting at the fracturesurface can usually be observed.
Fiber tensile failure. This failure mode is explosive. It releases large amountsof energy, and, in structures that cannot redistribute the load, it typicallycauses catastrophic failure.
In this work, the LaRC03 plane stress criteria [5] are extended to account for
2
general three-dimensional (3D) loading and for in-plane shear non-linearity.Matrix compressive failure is addressed with a modified 3D version of thePuck [6] matrix compression failure criterion. For the fiber failure in compres-sion, a 3D criterion based on Argon’s [7] approach considering matrix failureprompted by material imperfections is used in a framework similar to the oneproposed in LaRC02 [8] and LaRC03 [5]. A failure model for matrix in tensionand shear is derived from Dvorak and Laws’s [9] fracture mechanics analysesof cracked plies, as in LaRC03 [5].
Section 2 presents the background on damage mode-based failure criteria. TheLaRC04 failure criteria are developed and proposed for each failure mode inSection 3. Examples and validation follow in Section 4, and conclusions arepresented in Section 5. A summary of the LaRC04 criteria is presented inAppendix.
In the following sections, the index 1 refers to the longitudinal (fiber) direction,the index 2 refers to the in-plane transverse direction and the index 3 refersto the through-the-thickness direction.
2 Damage mode-based failure criteria
Strength-based failure criteria are commonly used to predict failure events incomposite structures. A large number of continuum-based criteria have beenderived to relate stresses and experimental measures of material strength tothe onset of failure. Parıs [10] discusses the ad hoc nature of the formulationof most strength-based criteria.
Hashin [11,12] and Puck [13,14] are credited for establishing the need for fail-ure criteria that are based on failure mechanisms. In his 1973 proposal [11],Hashin used his experimental observations of failure of tensile specimens topropose two different failure criteria, one related to fiber failure and the otherrelated to matrix failure. The criteria assume a quadratic interaction betweenthe tractions acting on the plane of failure. In 1980 [12], he introduced fiberand matrix failure criteria that distinguish between tension and compressionfailure. Given the difficulty in obtaining the plane of fracture for the ma-trix compression mode, Hashin used a quadratic interaction between stressinvariants. Such derivation was based on logical reasoning rather than mi-cromechanics. Although the Hashin criteria were developed for unidirectionallaminates, they have also been applied successfully to progressive failure anal-yses of laminates by using in-situ unidirectional strengths to account for theconstraining interactions between the plies [15]. The two-dimensional versionsof the failure criteria proposed by Hashin in 1973 and 1980 are summarizedin Table 1.
3
Table 1Hashin criteria for plane stress
Constituent Tension Compression
Matrix FIM =(
σ2
Y T
)2 +(
τ12SL
)2
1973 : FIM =(
σ2
Y C
)2 +(
τ12SL
)2
1980 : FIM =(
σ2
2ST
)2 +
+[(
Y C
2ST
)2− 1
]σ2
Y C +(
τ12SL
)2
Fiber FIF =(
σ1
XT
)2 +(
τ12SL
)2FIF = − σ1
XC
Numerous studies conducted over the past decade indicate that the stressinteractions proposed by Hashin do not always fit the experimental results,especially in the case of matrix or fiber compression. It is well known, for in-stance, that moderate transverse compression (σ22 < 0) increases the apparentshear strength of a ply, which is not predicted by Hashin’s criterion. In addi-tion, Hashin’s fiber compression criterion does not account for the effects ofin-plane shear, which significantly reduces the effective compressive strengthof a ply. Several researchers have proposed modifications to Hashin’s criteriato improve their predictive capabilities.
More recently, the WWFE [16] was conducted to assess the real predictingcapability of the current available failure criteria. Leading researchers in fail-ure of composites were invited to participate in a round-robin in which theypresented their approaches and predictions.
In the exercise, Hart-Smith [17,18] presented the original version of the max-imum strain criterion, as well as a truncated form and a generalized form ofthe criterion. Gotsis et al. [19] used the maximum stress criterion, superposedwith a modified distortion energy (quadratic polynomial) criterion. McCart-ney [20] applied the principles of mechanics at the microstructural level topredict damage formation. Rotem [21] used a criterion originally published in1973 [11], but with the matrix failure criterion modified in order to accountfor axial stresses. Surprisingly, Sun and Tao [22] used the Hashin-Rotem crite-rion [11], even though Sun had proposed previously [23] a criterion for matrixcracking that is acknowledged to represent better the matrix failure [8]. Liuand Tsai [24] used the Tsai-Wu [25] failure criterion. Wolfe and Butalia [26]used a strain-energy based failure criterion, containing a sum on exponents ofthe longitudinal, transverse and shear strain energies. Edge [27] used a phe-nomenological approach based on the stress interaction within each failuremode, with some similarities to the maximum stress, the Hashin-Rotem [11]and Hashin [12] criteria. Zinoviev [28] used the simple maximum stress crite-rion. Puck and Schurmann [6] were perhaps the authors who achieved betteragreement between their predictions and the experiments. Their criterion isphenomenological, as different failure modes are considered. Arguably, theirmodel for matrix compression failure possesses the most sound physical basis
4
of the theories proposed in the exercise.
Several lessons can be learned from the WWFE. Firstly, most criteria wereunable to capture some of the trends in the failure envelopes of the experimen-tal results. Secondly, on what concerns phenomenological failure criteria, mostexpressions proposed to predict each failure mode are still to some extent em-pirical. It is somewhat difficult to choose between the criteria due to the lack ofexperimental data needed to validate them against each other. Despite severalefforts to develop sound phenomenological criteria, non-phenomenological cri-teria like Tsai-Wu [25] are often better prediction tools than some phenomeno-logical criteria [24]. Although test results are not provided in the WWFEfor several stress combinations that remain open for discussion, significantprogress was made. From the limited predictive capabilities of the most accu-rate analyses available, it is clear that further developments in failure modeltheories and criteria are required before any analysis approach can be usedwith confidence to predict the strength of a typical aerospace composite com-ponent.
3 LaRC04 criteria for matrix failure
3.1 Tensile matrix failure
3.1.1 Critical energy release rates for non-linear shear behaviour
This subsection generalizes the expression given by Laws [29] for the energyrelease rate for an elliptical crack in a composite with a non-linear shear be-haviour. The procedure presented here uses Eshelby’s [30] application of theeigenstrain problem to solve the stress field around an oval crack, in a frame-work similar to Laws’s [29]. Since the referred procedure is considerably com-plex, and yet not devoid of approximations, an alternative generalization thatleads to the same result is presented in the Appendix. This alternative gen-eralization is much simpler, though cruder; it is pragmatic in the sense thatno complex mathematical manipulations are required, and the result followsfrom the concept of critical energy release rate and intuitive approximations.
The Eigenstrain problem Consider an infinite solid that undergoes somephysical process that will generate some inelastic strain. The physical processcould for instance be plastic deformation or phase transformation. Probablydue to the later, this inelastic strain is commonly called transformation strain.The problem consists in determining the stress and strain fields due to thetransformation strains.
5
The total strain tensor ε in the transformed region is the sum of an elasticstrain tensor εel with the transformation strain tensor εt:
ε = εel + εt. (1)
The stresses result from the elastic component of the strain,
σ = C : εel = C :(ε− εt
). (2)
Neglecting body forces acting on the body, the equilibrium equation is
∇ · σ = C :(∇ · ε−∇ · εt
)= 0 (3)
and can be written as
C :∇ · ε− bt = 0 (4)
where bt is a fictitious body force distribution defined as
bt = C :(∇ · εt
). (5)
If the transformation strains are known, then Eq. (4) can be solved for ε usingFourier transforms or Papkovich-Neuber potentials [31,32].
Consider the particular case of an elliptic region in an infinite body, undergoingchange of form that, without the constraint imposed by the surrounding ma-terial would result in an arbitrary homogeneous strain εt. The elliptic region,defined by (
x
a
)2
+(
y
b
)2
+(
z
c
)2
≤ 1, (6)
has volume V and is bounded by the surface S. The fictitious body forces arein this case nil everywhere except on the surface S where they are
bt = C : εtδ
((x
a
)2
+(
y
b
)2
+(
z
c
)2
− 1
)· n (7)
n being the normal to the ellipsoid and δ (·) the Dirac delta function.
Within the ellipsoid, the total strain field ε = εel + εt is uniform and can beexpressed as [29]
ε = P : C : εt (8)
where the fourth order tensor P results from solving Eq. (4) with bt from Eq.(7), and depends on the elastic properties of the material and geometry of theellipsoid only. The derivation of the tensor P can be found in Refs. [31,32].The stress field is then obtained as
σ = C : εel = C :(ε− εt
)= − (C−C : P : C) : εt = −Q : εt (9)
6
with
Q = C−C : P : C. (10)
Eshelby’s inclusion problem Eshelby [30] showed that the eigenstrainproblem can be used for the determination of the stress and strain fields dueto an elliptic inclusion. Consider an elliptical inclusion with constitutive tensorC∗ in a homogeneous infinite solid with constitutive tensor C. Suppose nextthat the solid is loaded by a uniform stress or strain at infinity, σ∞ and ε∞,respectively. The stress and strain in the solid can be expressed as
σ = σ∞ + σ and ε = ε∞ + ε (11)
where σ∞ and ε∞ are the uniform stress and strain tensors induced in thesolid if the inclusion was not present, while σ and ε represent a perturbationdue to the presence of the inclusion.
The perturbation due to the inclusion can be computed using the eigenstrainanalogy. In fact, the stress field σ = σ∞ solves the equilibrium equationseverywhere in the solid, except in the inclusion, where the error in the stressis uniform: (C∗ −C) : ε∞. This suggests that the stress state can be correctedby using a transformation strain inside the inclusion. For the inclusion andthe transformed region to be equivalent, the stress in both cases must be thesame. For the case of the hypothetical transformed region, the stress is
σ = C : εel = C :(ε− εt
)(12)
while in the case of the inclusion, the stress tensor is obtained as
σ = C∗ : ε. (13)
For the transformed region to be equivalent to the inclusion, then Eqs. (12)and (13) can be equated, resulting in
C :(ε− εt
)= C∗ : ε. (14)
Decomposing the strain in its two components ε∞ and ε, and considering Eq.(8), then Eq. (14) is obtained as
(C∗ −C) : ε∞ = [C− (C−C∗) : P : C] : εt. (15)
For a void, C∗ = 0 and Eq. (15) reduces to
εt = Q−1 : σ∞. (16)
7
The determination of εt in Eq. (16) is an important result, since the strainand stress at the cavity wall follow as
ε = ε∞ + ε = ε∞ + P : C : εt = ε∞ + P : C : Q−1σ∞ (17)
σ = C : ε. (18)
The interaction energy can be defined as the energy released by the introduc-tion of a cavity [29]. Following from Eshelby’s work for a linear material [30],the interaction energy for a solid loaded at infinity can be written as
Eint =∫
V
[∫ εt
0σ∞ : dεt
]dV = V
∫ εt
0σ∞ : dεt (19)
where V is the volume of the cavity.
The solution for a crack was obtained from the solution for an ellipsoidalcavity by Laws [29]. Laws considered first an infinite elliptic cylinder by lettingc →∞, then expressed the interaction energy per unit length of the cylinderin a form similar to
Eint = πa2ε∫ εt
0σ∞ : dεt, with ε =
b
a(20)
and proceeded to a crack by making ε → 0. Since the tensor Q becomessingular when ε → 0, but not the product εQ−1, some care has to be taken.Eq. (20) can be transformed in
Eint = πa2∫ σ∞
0σ∞ : εQ−1 : dσ∞. (21)
Making ε → 0 and defining Λ = εQ−1, the interaction energy can be expressedas
Eint = πa2∫ σ∞
0σ∞ : Λ :dσ∞ (22)
where the non-zero components of the tensor Λ were calculated by Laws [29].Assuming a non-linear shear behaviour, Eq. (22) can then be written as
Eint =1
2πa2
(Λo
22σ222 + Λo
23τ223 + 2
∫ τ12
0τ12Λ
o12dτ12
)
=1
2πa2
(Λo
22σ222 + Λo
23τ223 + 2
∫ γ12
0τ12dγ12
)
=1
2πa2
[Λo
22σ222 + Λo
23τ223 + χ (γ12)
]. (23)
where χ (γ12) is defined as
χ (γ12) = 2∫ γ12
0τ12dγ12 (24)
8
and, from Laws [29],
Λo22 = Λo
23 = 2
(1
E22
− ν221
E11
). (25)
It is important to take into account some simplifications of the previouslypresented formulation:(i) Laws [29] derivation of the crack tensor Λ is only approximate.(ii) The superposition principle has been used, and it is not strictly valid for anon-linear shear behaviour. It is not clear if an expression for the interactionenergy such as Eq. (23) could also be derived without using superposition.
In-plane shear contribution to the critical energy release rates Thein-plane shear contribution to the critical energy release rate can be com-puted from Eq. (23) with σ22 ≡ τ23 = 0. Suppose that the dimension of thecrack in the longitudinal direction is aL. Proceeding like Dvorak and Laws[9], the change in cracked area for crack propagation in the transverse direc-tion is ∂A = 2aL∂ao and the critical energy release rate for the case of crackpropagation in the transverse direction is obtained as
GTc =
∂aLEint
∂A=
1
2
∂Eint
∂ao
=πao
2χ (γu
12) (26)
where γu12 is the engineering shear strain at failure. For crack propagation in
the longitudinal direction, the change in cracked area is ∂A = 2ao∂aL and thecritical energy release rate is defined as
GLc =
∂aLEint
∂A=
Eint
2ao
=πao
4χ (γu
12) . (27)
3.1.2 In-situ effect
A failure criterion to predict matrix cracking under the presence of both in-plane shear and transverse tensile stresses should represent the ‘in-situ’ effectoccurring in laminated composites. The in-situ effect, originally detected inParvizi’s tensile tests of cross-ply glass fiber reinforced plastics [33], is char-acterized by higher transverse tensile and shear strengths of a ply when itis constrained by plies with different fiber orientations in a laminate, whencompared with the strength of the same ply in a unidirectional laminate. Thein-situ strength also depends on the number of plies clustered together, andon the fiber orientation of the constraining plies.
The orientation of the constraining plies and the number of plies clusteredtogether also affect the crack density and the stiffness reduction of the cracked
9
Thin ply model
[ 25/90 ]s± n
[0/ /0]90n
[25 /-25 /90 ]s2 2 2
[90 ]s8
Onset ofdelamination
Thin Thick
Thick ply model
Unidirectional
T300/944
0
0.1
0.2
0.3
0.4 0.8 1.2 1.6 2.00
Tran
sver
se S
tren
gth
of 9
0 P
ly, G
Pa
°
Inner 90 Ply Tickness 2a, mm°
Fig. 1. Transverse tensile strength as a function of number of plies clustered together,with models from Dvorak [9] based on experimental data from Wang [34].
ply. Wang’s [34] tests of (0/90n/0) (n = 1, 2, 3, 4) carbon/epoxy laminateshave shown higher crack densities for thinner 90◦ layers. The reduction of theelastic properties of a cracked ply is normally predicted using elastic analysesof cracked plies [15,35] or Continuum Damage Models [36–39].
The in-situ effect is illustrated in Fig. 1, where the relation between the in-situtransverse tensile strength and the total thickness of the 90◦ plies clusteredtogether is represented.
Accurate in-situ strengths are necessary for any stress-based failure crite-rion for matrix cracking in constrained plies. Both experimental [34,40,41]and analytical methods [9,35,42] have been proposed to determine the in-situstrengths. In the following, the in-situ strengths are calculated using fracturemechanics solutions for the propagation of cracks in a constrained ply.
3.1.3 Fracture Mechanics Analysis of a Cracked Ply
The failure criterion for predicting matrix cracking in a ply subjected to in-plane shear and transverse tension proposed here is based on the fracturemechanics analysis of a slit crack in a ply, as proposed by Dvorak and Laws
10
� � � � �� � ��
� � �
� � �
� � �
� � �
Fig. 2. Slit crack geometry (after Dvorak [9])
[9]. The slit crack represents a manufacturing defect that is idealized as lyingon the (1, 3) plane, as represented in Fig. 2. It has a length 2ao across thethickness of a ply, t. Physically, this crack represents a distribution of matrix-fiber debonds that may be present in a ply as a consequence of manufacturingdefects or from residual thermal stresses resulting from the different coefficientsof thermal expansion of the fibers and of the matrix. Therefore, the slit crack isan ‘effective crack,’ representing the macroscopic effect of matrix-fiber debondsthat occur at the micromechanical level [34].
The transverse tensile stress σ22 is associated with mode I loading, whereasthe in-plane and transverse shear stresses τ12 and τ23 respectively are associ-ated with mode II loading. The crack represented in Fig. 2 can grow in the1 (longitudinal, L) direction, in the 3 (transverse, T ) direction, or in bothdirections.
The components of the energy release rate for the crack geometry representedin Fig. 2 were determined by Dvorak and Laws [9] for a linear orthotropicmaterial and an extension of their analysis for non-linear shear behaviour hasbeen presented here. For mixed-mode loading, the energy release rate for crackgrowth in the T and L directions, G(T ) and G(L), respectively, are given by
G(T ) = πao
2[η2
IΛo22σ
222 + η2
IIΛo23τ
223 + η2
IIIχ (γ12)]
G(L) = πao
4[ξ2
IΛo22σ
222 + ξ2
IIΛo23τ
223 + ξ2
IIIχ (γ12)](28)
where it can be observed that the energy release rate G(L) for longitudinalpropagation is a function of the transverse slit size and that it is not a functionof the slit length in the longitudinal direction.
The parameters ηi, i = I, II, III in Eq. (28) are stress intensity reductioncoefficients for propagation in the transverse direction, and the parametersξi, i = I, II, III are reduction coefficients for propagation in the longitudi-nal direction. These coefficients account for the constraining effects of theadjoining layers on crack propagation: the coefficients are nearly equal to1.0 when 2ao ¿ t, and are less than 1.0 when ao ≈ t. Experimental re-sults [41] have shown an increase in the in-situ transverse tensile strengthof [±θ/90n]s, θ = 0◦, 30◦, 60◦, laminates for increasing stiffness of adjoiningsublaminates ±θ. This implies that the value of the parameter ηi decreases
11
with increasing stiffness of adjoining sublaminates. Considering that a trans-verse crack can promote delamination between the plies, Dvorak and Laws[9] suggested that the effective value of ηi can be larger than obtained fromthe analysis of cracks terminating at the interface, and suggested the use ofηi = ξi = 1.
The mode II and III components of the energy release rate are combined in ashear mode, GSH , as
GSH = GII + GIII . (29)
Such an approach was initially proposed by Li and Sen [43] and Li [44], andused in the simulation of delamination using the Virtual crack Closure Tech-nique (VCCT) and decohesion finite elements [2]. By combining modes II andIII, it is not necessary to track the relative orientation of the crack front withrespect of the in-plane displacement jumps. In addition, no conclusive evi-dence is available showing that GIIc and GIIIc are different. In fact, there isno standard for measuring GIIIc. Furthermore, there is no mixed-mode testmethod for mixed mode II and mode III loading.
The components of the energy release rate are then obtained for the T -direction using Eq. (28) with ηi = 1:
GI(T ) =πao
2Λo
22σ222 (30)
GSH(T ) =πao
2
[Λo
23τ223 + χ (γ12)
]. (31)
The corresponding components of the fracture toughness are given as
GIc(T ) =πao
2Λo
22
(Y T
is
)2(32)
GSHc(T ) =πao
2χ
(γu
12pis)
(33)
where Y Tis is the in-situ transverse tensile strength, and γu
12pis is the in-situin-plane shear ultimate strain.
For propagation in the longitudinal direction, the mode I and mode II com-ponents of the energy release rate are
GI(L) =πao
4Λo
22σ222 (34)
GSH(L) =πao
4
[Λo
23τ223 + χ (γ12)
](35)
and the components of the fracture toughness are
GIc(L) =πao
4Λo
22
(Y T
is
)2(36)
12
GSHc(L) =πao
4χ
(γu
12pis). (37)
Having obtained expressions for the components of the energy release rate andfracture toughness, a failure criterion can be applied to predict the propaga-tion of the slit crack represented in Fig. 2. Under the presence of in-plane andtransverse shear, as well as transverse tension, the critical energy release rateGc depends on the combined effect of all microscopic energy absorbing mech-anisms such as the creation of new fracture surface. Relying on microscopicexaminations of the fracture surface, Hahn [45] observed that the fracturesurface topography strongly depends on the type of loading. With increasingproportion of the stress intensity factor KII , more hackles are observed inthe matrix, thereby indicating more energy absorption associated with crackextension. Hahn proposed a mixed-mode criterion written as a first-order poly-nomial in the stress intensity factors KI and KII . Written in terms of the modeI and mode II energy release rates, the Hahn criterion is
(1− g)
√√√√ GI(i)
GIc(i)+ g
GI(i)
GIc(i)+
GSH(i)
GSHc(i)= 1, i = T, L (38)
where the material constant g is defined from Eqs. (36) and (37) as g =GIc/GSHc which leads to the following expression for g:
g =Λo
22
(Y T
is
)2
χ (γu12pis)
. (39)
A failure index for matrix tension can be expressed in terms of the ply stressesand in-situ strengths by substituting either Eqs. (30)-(33) or (34)-(37) into thecriterion in Eq. (38) to get
LaRC04 #1 FIM = (1− g)σ22
Y Tis
+g
(σ22
Y Tis
)2
+Λo
23τ223 + χ (γ12)
χ (γu12pis)
= 1. (40)
The criterion presented in Eq. (40), with linear and quadratic terms in σ22, aquadratic term in τ23 and a term on the in-plane shear internal energy, χ (γ12),is similar to the criteria proposed by Hahn [45], Liu [24] (for transverse tensionand in-plane shear), and Puck [6]. It can be observed that using g = 1 in Eq.(38) results in the linear version of the criterion proposed by Wu and Reuter[46] for the propagation of delamination in laminated composites
GI
GIc
+GII
GIIc
= 1. (41)
Furthermore, using g = 1, assuming linear in-plane shear, and neglectingτ23, Eq. (40) reverts to the well-known Hashin criterion [11] for transverse
13
2a �
t τ12, S�
t 2a �
σ22, Y�
Fig. 3. Unidirectional specimen with initial crack (after Dvorak [9])
matrix cracking under both in-plane shear and transverse tension, where theply strengths are replaced by the in-situ strengths
FIM =
(σ22
Y Tis
)2
+
(τ12
SLis
)2
= 1. (42)
Finally, the non-linear term in Eq. (40) is also found to be similar to thestrain-energy based criterion proposed by Sandhu [47], later used by Changand Scott [48].
3.1.4 Application to unidirectional laminates
The application of the fracture mechanics analysis of a cracked ply to unidirec-tional laminates yields expressions relating toughness values to crack dimen-sions which can subsequently be used to relate the strength of thick embeddedplies to that of a unidirectional laminate.
Dvorak and Laws [9] regarded the fracture of a unidirectional specimen asthe fracture of an unconstrained thick ply, with the critical initial slit cracklocated at the surface of the laminate. For tensile loading, the crack can belocated at the edge of the laminate, which increases the energy release ratewhen compared with a central crack. In the case of shear loading, there is nofree edge, so the crack is a central crack, as shown in Fig. 3. The defect sizeis 2ao and is considered to be much smaller than the ply thickness, 2ao ¿ t.
For unidirectional laminates, the crack will grow unstably in the transversedirection [9], and Eqs. (32), (33), (36) and (37) apply with a geometric fac-tor which is obtained from the classic solution of the free edge crack [5,49],resulting in
GIc(T ) = 1.122πaoΛo2
(Y T
)2(43)
GSHc(T ) = πaoχ (γu12) (44)
where Y T is the transverse tensile strength and γu12 is the in-plane shear strain
at failure, for a unidirectional laminate.
The toughness ratio g can also be calculated in terms of the unidirectional
14
2a � t
�
���S,12τ����Y,22σ
Fig. 4. Geometry of slit crack in a thick embedded ply subjected to tension andshear loads
properties by using Eq. (43) and (44), resulting in
g =GIc
GSHc
= 1.122Λo
22
(Y T
)2
χ (γu12)
. (45)
3.1.5 In-situ strength of thick embedded plies
A thick ply is defined as one in which the length of the slit crack is muchsmaller than the ply thickness, 2ao ¿ t, as illustrated in Fig. 4. The minimumthickness for a thick ply depends on the material used. For E-glass/epoxyand carbon/epoxy laminates, Dvorak and Laws [9] calculated the transitionthickness between a thin and a thick ply to be approximately 0.7mm , or about5 to 6 plies.
For the geometry represented in Fig. 4, the crack can grow in the transverse orin the longitudinal direction. Comparing Eqs. (30) and (31) to Eqs. (34) and(35), however, indicates that the energy release rate for the crack slit is twiceas large in the transverse direction as it is in the longitudinal direction. SinceEqs. (30) and (31) also indicate that the energy release rate is proportional tothe crack length, the crack will grow unstably in the transverse direction. Oncethe crack reaches the constraining plies, it can propagate in the longitudinaldirection, as well as induce a delamination.
Crack propagation is predicted using Eq. (40), and the in-situ strengths canbe calculated from the corresponding fracture toughness, as expressed in Eqs.(32) and (33). For mode I, the in-situ transverse tensile strength is definedfrom Eq. (32) as
Y Tis =
√√√√2GIc(T )
πaoΛo22
(46)
and, taking into account Eq. (43),
Y Tis = 1.12
√2Y T . (47)
For a thick embedded ply loaded in pure in-plane shear, the expressions getmore complex due to shear non-linearity. The in-situ in-plane ultimate strain
15
is obtained as
γu12pis = χ−1
(2GSHc(T )
πao
)(48)
and, taking into account Eq. (44),
γu12pis = χ−1 [2χ (γu
12)] . (49)
Considering the constitutive law for the shear behavior to be expressed by thefunction fCL such that
τ = fCL (γ) , (50)
then the in-situ in-plane shear strength is defined as
SLis = fCL
(γu
12pis). (51)
As a particular case of non-linear in-plane shear behaviour, consider the poly-nomial relation between the shear strain and the shear stress proposed byHahn and Tsai [50],
γ12 =1
G12
σ12 + βσ312. (52)
With the non-linear shear law expressed in Eq. (52), Eq. (48) reverts to
GSHc(T ) = πao
(SL
is
)2
2G12
+3
4β
(SL
is
)4
(53)
and Eq. (44) can be written as
GSHc(T ) = 2πao
(SL
)2
2G12
+3
4β
(SL
)4
. (54)
Equating Eqs. (53) and (54), the in-situ shear strength of a thick embeddedply, SL
is, can be related to the shear strength of a unidirectional laminate:
(SL
)2
G12
+3
2β
(SL
)4=
(SL
is
)2
2G12
+3
4β
(SL
is
)4. (55)
The in-situ shear strength of an thick embedded ply, SLis, is the positive, real
root of Eq. (55):
SLis =
√√√√√√
√1 + β
(12(SL)2
G12+ 18β (SL)4
)(G12)
2 − 1
3βG12
. (56)
It can be observed from Eqs. (47) and (56) that the in-situ strengths of thickembedded plies—Y T
is , and SLis—are independent of the ply thickness, as has
16
t
�
���S,12τ����Y,22σ
Fig. 5. Geometry of slit crack in a thin embedded ply
been observed by Dvorak and Laws [9] and Leguillon [51], and as was shownin Fig. 1. The general expression for SL
is in Eq. (56) can be written for a linearmaterial by letting β tend to zero, in which case the in-plane shear strengthcome as
SLis =
√2SL for a linear shear law. (57)
Eq. (57) is equal to the one obtained by Dvorak and Laws [9] and Davila etal. [5] for a linear shear behaviour.
3.1.6 In-situ strengths of thin embedded plies
Thin plies are defined as having a thickness smaller than the typical defect, t <2ao, so the slit crack represented in Fig. 2 extends across the entire thicknesst of the ply, as represented in Fig. 5.
In the case of thin plies, crack defects can only grow in the longitudinal (L)direction, or trigger a delamination between the plies. The in-situ strengths canbe calculated from the components of the fracture toughness, as expressed inEqs. (36) and (37). For transverse tensile loading, the corresponding strengthis expressed as
Y Tis =
√√√√8GIc(L)
πtΛo22
. (58)
For a thin embedded ply loaded in pure in-plane shear, the ultimate in-planeshear strain is defined as
γu12pis = χ−1
(8GSHc(L)
πt
)(59)
and the in-situ in-plane shear strength is defined as
SLis = fCL
(γu
12pis). (60)
Considering again Eq. (52) as a particular case of non-linear in-plane shearbehaviour, Eq. (59) can be written as
(SL
is
)2
8G12
+3
16β
(SL
is
)4=
GSHc(L)
πt. (61)
The in-situ shear strength of a thin ply, SLis, is the positive real root of Eq.
17
(61):
SLis =
√√√√√√
√1 + β
48GSHc(L)
πt(G12)
2 − 1
3βG12
(62)
It can be observed from Eqs. (58) and (62) that the in-situ strengths aredependent on the thickness t.
Eq. (62) can be written for a linear material by letting β tend to zero, in whichcase the shear strength come as
SLis =
√8G12GSHc(L)
πtfor a linear shear law. (63)
Eq. (63) is equal to the one obtained by Dvorak and Laws [9] and Davila etal. [5] for a linear shear behaviour.
If in the absence of specific data, the toughness values GIc(L) and GSHc(L)can be assumed to have the values measured by standard Fracture Mechanicstests, such as the DCB for mode I and the ENF test for mode II. Using Eq.(58), Dvorak and Laws [9] obtained a good correlation between the predictedand experimentally obtained in-situ tensile strengths of both thick and thin90◦ plies in [0/90n/0] laminates, as was shown in Fig. 1.
3.2 Compressive matrix failure
Matrix compression specimens fail by shear, which would suggest that the an-gle of the fracture surface with the through-the-thickness direction, as shownin Fig. 6(a), should be αo = 45◦, i.e., along the plane of the maximum shearstress. However, experiments indicate that the angle of fracture under uniaxialcompression is generally αo = 53 ± 2◦ for most technical composite materi-als [6,52,53]. The fact that αo > 45◦ can be explained by the existence ofa compressive stress acting on the potential fracture surfaces, and its associ-ated friction. The magnitude of the compressive stress, and hence the frictionstress, is maximum for a fracture surface with αo = 0◦ and decreases mono-tonically until αo = 90◦, in which case the compressive (and friction) stress iszero. Although the shear stress is maximum for αo = 45◦, the friction stresswhich opposes fracture, decreases with larger values of the angle αo. As aresult, fracture is expected for values of αo larger than 45◦, where a criticalcombination of shear and normal stress acts.
Experimental evidence on the fracture surface of specimens failing by matrixcompression suggest that the Mohr-Coulomb (M-C) criterion is applicable tothe matrix compression failure; Puck [13] and Puck and Schneider [14] were
18
the first to propose a matrix failure model for composites based on the M-Ccriterion.
The M-C criterion is commonly used in applications where fracture under ten-sion loading is different from fracture under compression loading, such as insoil mechanics or in the fracture of cast iron. The application of the M-C crite-rion to multiaxial failure of epoxy resins was studied by Kawabata [54] basedon correlation with his own test results. While studying the failure of choppedglass-fiber/epoxy mat laminates under confining pressures, Boehler and Raclin[55] found the Tsai-Wu criterion to be inadequate, and formulated a shearingcriterion based on the M-C criterion that fit his experimental measurementswell. Taliercio and Sagramoso [56] used the M-C criterion within a non-linearmicromechanical model to predict the macroscopic strength properties of fibercomposites.
The M-C criterion is represented geometrically by the diagram illustrated inFig. 6(b). The Mohr’s circle represents a state of uniaxial compression. Theangle of the plane of fracture is αo. The M-C criterion postulates that in astate of biaxial normal stress, fracture occurs for any Mohr’s circle that istangent to the M-C fracture line.
DiLandro and Pegoraro [57] explain the role of internal friction on the strengthof carbon-fiber composites by noting the absence of chemical bonds betweenfiber and matrix, and that adhesion is attributed to Van der Waal’s interac-tions. When subjected to an external load, the shear slipping of the two phasesis prevented until the shear stress at the fiber-matrix interface reaches a lim-iting value. DiLandro and Pegoraro also note that the friction coefficient is anempirical factor that encompasses all chemical-physical interactions, includ-ing the thermal residual shrinkage of the matrix around the fiber. Larson andMiles [58] examined the relative effects of interfacial friction and roughness onthe length of interfacial sliding which proceeds from the tip of an impingingfracture oriented perpendicular to the interface. According to Larson, slidingis key to the cracking behavior of fibrous brittle matrix composites in that itaffects the stress concentration on the fibers, the matrix crack spacing, and,therefore, the global toughness of a composite material.
For a general loading situation, shown in Fig. 6(c), the angle of the fractureplane with the through-the-thickness direction, denoted as α, might assume adifferent value than the one for pure compression (αo). The orientation of thefracture plane depends on the particular combination of shear (τT and τL) andnormal (σn) tractions for each value of α, shown in Fig. 6(d). In plane-stressformulations, the tractions at potential fracture planes are obtained from thein-plane shear stress τ12, the compressive stress σ22, and the fracture plane
19
2
3
1
α
nσ
LτTτ
σ
τ
cY− 2cY−
TSoα2
oα2
(a) (b )
(c ) (d )
2.6mm 2
3 αο
Fig. 6. (a) Pure transverse compression failure, for a CFRP specimen; (b) stressesin the fracture plane; (c) geometrical representation of the Mohr-Coulomb criterion;(d) fracture plane for a 3D stress state;
angle α by using the transformation equations
σn =σ22
2(1 + cos (2α))
τT = −σ22
2sin (2α)
τL = τ12 cos (α) .
(64)
In a 3D formulation, the tractions are obtained from the components of thestress tensor and the fracture plane angle α:
σn =σ22 + σ33
2+
σ22 − σ33
2cos (2α) + τ23 sin (2α)
τT = −σ22 − σ33
2sin (2α) + τ23 cos (2α)
τL = τ12 cos (α) + τ31 sin (α)
(65)
where α is comprised in the interval ]−π, π].
The M-C failure criterion is expressed in terms of the tractions in the frac-ture plane, and can be written in several forms. Considering first the casewhere τL = 0 (i.e., τ12 = 0 for the 2D formulation), the M-C criterion can beexpressed as ∣∣∣τT
∣∣∣ + ηT σn = ST (66)
where ηT is a friction coefficient and ST is the transverse (to the fibers) shearstrength. The geometrical representation of this criterion in a (σ,|τ |) space isa line with negative slope (−ηT ), shown in Fig. 6(b). In this figure, the Mohr
20
circle corresponding to the case of pure compression is represented througha semi-circumference tangent to the M-C criterion’s line. The slope of theM-C criterion’s line can be related to the angle of the fracture plane in puretransverse compression, αo, through
tan(2αo) = − 1
ηT. (67)
Furthermore, writing Eq. (66) for a pure compression case establishes therelation between ST , Y C and αo:
ST = Y C cos (αo)
(sin (αo) +
cos (αo)
tan (2αo)
). (68)
The angle αo can be easily determined from simple compression tests. Theparameters ηT and ST are calculated from αo using Eqs. (67) and (68).
The M-C criterion (Eq. (66)) can be expressed in several forms, namely con-sidering that friction affects (increases) the strength,
∣∣∣τT∣∣∣
ST − ηT σn
= 1, (69)
or that is affects (decreases) the applied stress,
⟨∣∣∣τT∣∣∣ + ηT σn
⟩
ST= 1, (70)
where the operator 〈·〉 is the Mc Cauley bracket defined by
〈x〉 =
0 ⇐ x ≤ 0
x ⇐ x > 0, x ∈ R. (71)
Motivated by those two different forms of expressing the same criterion forτL = 0, Puck and Schurmann [6,52] initially proposed for the general case(τL 6= 0)
FIM =
(τT
ST − ηT σn
)2
+
(τL
SL − ηLσn
)2
≤ 1 (72)
whereas it was proposed, first for the LaRC02 [8], and after for the LaRC03 1
[5] failure criteria
FIM =
⟨∣∣∣τT∣∣∣ + ηT σn
⟩
ST
2
+
⟨∣∣∣τL∣∣∣ + ηLσn
⟩
SL
2
≤ 1 (73)
1 For the LaRC03 criteria [5], the in-situ longitudinal shear strength SLis was con-
sidered in equation 73 instead of SL
21
where ηT σn and ηLσn are shear stresses due to friction. While Puck andSchurmann (Eq. (72)) consider that the compression stress (σn) increases theeffective strength, LaRC02 and LaRC03 (Eq. (73)) consider that the compres-sion stress reduces the effective shear stress. For reasons of simplicity, Puckand Schurmann [6,52] transformed Eq. (72) into
FIM =
(τT
)2
(ST )2 − 2ηT ST σn
+
(τL
)2
(SL)2 − 2ηLSLσn
≤ 1. (74)
Eq. (74) is obtained by expanding the denominators in Eq. (72) and neglectingthe terms in (σn)2. Puck and Schurmann [6] have shown that it is possible tosolve Eq. (74) in a closed form for the angle of the fracture plane α in the caseof a plane stress situation.
To obtain the friction coefficient ηL in the absence of experimental data, Puckand Schurmann [6] suggest the relation
ηL
SL=
ηT
ST(75)
where ηT is computed using Eq. 67 and ST is computed using Eq. 68. Thissuggestion has also been considered for the LaRC02 [8] and LaRC03 criteria[5].
The comparison of the criteria expressed in Eqs. (72), (73) and (74) is shown inFig. 7 for a E-glass/DY063 epoxy used in the WWFE, with material propertiespresented in Table 2. Also shown in Fig. 7 is the much simpler Sun [23] criterion
FIM =(
σ22
Y C
)2
+
(τ12
SL − ηLσ22
)2
≤ 1. (76)
The Sun criterion also represents a similar trend in the failure envelope, al-though it is not based on a physical mechanism of failure.
While the initial and final Puck criteria (Eqs. (72) and (74)) yield similarresults, LaRC03 criterion (Eq. (73)) is less conservative. This is related to thefact that the effect of friction is over-estimated in Eq. (73). Indeed, affectingthe shear tractions by a friction term as in Eq. (73) over-estimates the frictionforces whenever both τT and τL are acting simultaneously [59]. As Fig. 8(a)represents, supposing a very simple case with isotropic friction (ηT = ηL), thefriction stresses are over-estimated by a factor of
√2 when using Eq. (73).
It is interesting to notice the effect that an orthotropic friction model has on
22
Table 2Mechanical properties of a E-glass/DY063 epoxy used in the WWFE, from Sodenet al. [60]
Fig. 9. Failure envelope for the LaRC04 matrix failure criterion, using Eq. 81 andseveral values for the angle of the fracture plane, α
or, simplifying,
τ fric.T = σnηT cos (θ)
τ fric.L = σnη
L sin (θ)(78)
where θ is the angle formed by the shear-traction vector τ and the transversedirection in the fracture plane, i.e., θ = arctan
(τL/τT
).
The LaRC03 criterion given by Eq. (73) can be modified using Eqs. (78) toaccount more accurately for the friction terms, which results in
FIM =
⟨∣∣∣τT∣∣∣ + ηT σn cos (θ)
⟩
ST
2
+
⟨∣∣∣τL∣∣∣ + ηLσn sin (θ)
⟩
SL
2
≤ 1 (79)
Interestingly, the modified criterion given by Eqs. (79) yields an envelope thatis coincident with Puck’s initial criterion (Eq. (72)), as shown in Fig. 7.
The use of one of Eqs. (72), (73), (74), and (79) for the failure criterion impliesthe use of the set of Eqs. (65) for the transformation of stresses. In turn,this means that the fracture angle has to be known. In theory, it could beanalytically determined as
α :∂FIM
∂α= 0. (80)
Puck and Schurmann [6] have solved Eq. 80 for the criterion in Eq. (74) ina plane-stress situation, but it is not possible to do the same with Eqs. (72),(73) and (79) for 3D stress states. However, Fig. 9, drawn using the data from
24
Table 2 and Puck’s initial criterion (Eq. (72)), shows that it is possible todraw the envelope with reasonable accuracy by using a very small number oftrial angles.
Since it is not possible to obtain a closed-form solution for the fracture angle ina generic 3D situation, there does not seem to be a reason to drop the physicalsignificance of the criteria expressed through Eqs. (72), (73) and (79). As itwas demonstrated, Eq. (73) over-estimates the friction stresses. Since Eqs.(72), (79) yield similar results, but Eq. (72) is simpler, the later is proposedfor LaRC04,
LaRC04 #2 FIM =
(τT
ST − ηT σn
)2
+
(τL
SLis − ηLσn
)2
≤ 1 (81)
where it should be noted that the in-situ longitudinal shear strength SLis is
used, as was proposed for LaRC03 [5].
4 LaRC04 criteria for fiber failure
4.1 Tensile fiber failure
The LaRC04 criterion for fiber tensile failure is a non-interacting maximumallowable stress criterion. Consequently, the LaRC04 failure index for fibertensile failure is simply
LaRC04 #3 FIF =σ11
XT≤ 1. (82)
4.2 Compressive fiber failure
Fiber compression failure is a field where significant research is still being per-formed. For matrix compression failure, a relatively simple mechanical modelas the one proposed by Puck and Schurmann [6,13,14,52] seems to correctlyrepresent failure, and can be easily expressed as a failure criterion that canbe incorporated in numerical codes. Depending on the material, different fibercompressive failure modes are possible [61]:
Microbuckling. This failure mode consists of the microbuckling of the fibersin the elastic matrix. The first mechanical model for this failure mode can betracked back to Rosen’s work [62] where the fibers are represented by infinite
25
beams 2 in an elastic matrix and failure is attained when the compressive loadequals the buckling load. This model provides an upper bound for the failurestress, as it generally predicts a failure stress typically two to three times largerthan the experimental one (for carbon reinforced composites [61]). Modelsbased on microbuckling have been widely studied over the last decades. Forthese models, the matrix shear properties as well as material imperfectionsplay an important role.
Kinking. Kinking can be defined as the localized shear deformation of thematrix, along a band. Typically, the fibers break at the edges of the band, andsometimes also in the interior. It should be noted that some authors considerkinking as a consequence of microbuckling, while others consider it as a sepa-rate failure mode [61]. Argon [7] was the first to develop a mechanical modelfor fiber kinking as a separate failure mode. For Argon, failure is the resultof matrix shear failure, prompted by an initial fiber misalignment. For thismodel, and those that follow it, matrix elastic behaviour and initial materialimperfections play an important role.
Fiber failure. Fiber failure can be expected to occur for fibers with lowcompressive strength, such as Aramid, but is not expected to happen forcarbon, glass or boron fibers [61].
Rosen [62] was the first to propose a mechanical model to describe fiber mi-crobuckling. By minimizing the internal energy, Rosen obtained the fiber’sbuckling stresses. The analysis was performed for two instability modes: (i)an extension mode, where the deformed shapes of adjacent fibers are in oppo-sition of phase; and (ii) a shear mode, where the deformed shapes of adjacentfibers are in phase. Rosen found that for composites with a high fiber volumefraction, the shear mode is critical, and the associated stress is
XC =Gm
1− Vf
(83)
where Gm is the shear modulus of the matrix and Vf is the fiber volume frac-tion. Considering the rule of mixtures, Eq. (83) reduces to XC = G12, i.e., theshear modulus of the composite. This relation (Eq. (83)) was later modified toaccount for an elastic-perfectly plastic resin [63]. In fact, several modificationswere attempted, in order to incorporate less restrictive hypotheses (see Ref.[61] for a state of the art review). However, Rosen’s approach yields smallerfailure stresses than similar models assuming linear elasticity and straightfibers [61] and is simpler. Still, there is little success in predicting the fail-ure stress of advanced composites using Rosen’s result. The problem is that,when compared to experimental data, Eq. (83) gives results typically 1.5 times
2 In fact, Rosen’s approach is 2D and the fibers are thus represented by layers(plates), and not beams
26
higher for Boron composites, 2 to 3 times higher for carbon composites and 4times higher for glass composites [61]. It was with the introduction of geomet-ric non-linearity and initial fiber misalignment that the prediction got closerto the experimental results.
Schultheisz and Waas [61] pointed out that most buckling models tend to repli-cate the model-composite that was studied by Greszczuk [64–67]. Greszczukperformed a series of experiments on model-composites whose reinforcementsconsisted of either (i) rods (of steel or aluminum) having diameters in therange 0.5 to 3.2mm ; or (ii) aluminum plates with thickness in the rangeof 0.3 to 1mm . The basic idea was to duplicate the 2D geometries used inthe analytical models. Greszczuk found that the compressive strength of hismodel-composites exceeded Rosen’s prediction. However, when including theenergy associated with bending of the fibers, Greszczuk found good agree-ment. He also concluded that while his model-composites with low-modulusmatrix failed by microbuckling, those with intermediate-modulus matrix failedby longitudinal cracking (matrix cracking), and composites with high-modulusmatrix failed through compression of the fibers.
Most buckling models follow the 2D approach of Rosen [62]. However, realtechnical composites are 3D structures. It has been suggested [68,69] that3D effects may be a cause of the reduction in the failure stress from Rosenmodel. Indeed, evidence of the 3D aspect of fiber microbuckling has been re-ported in the literature [70,71]. One important 3D consideration, discussedby Schultheisz and Waas [61], is the arrangement of fibers and matrix, whichinduce different types of interaction (among the fibers and matrix) during thebuckling for different packing densities. Furthermore, the laminated construc-tion may lead to different fiber arrangements within the plane of a laminaand in the through-the-thickness direction. Fiber misalignment angles havefirst been reported to be smaller in the through-the-thickness direction [72],but more recent results suggest they are similar in magnitude [73]. Models in-corporating 3D aspects were attempted [67,74–78], and Schultheisz and Waas[61] concluded that FE analysis would be an excellent candidate to handle the3D aspect of microbuckling.
In most high fiber-volume-fraction advanced composite materials, compressivefailure is seen as a failure mode which is localized in a band across the speci-men in which the fibers have rotated by a large amount, and the matrix hasundergone large shearing deformation—kinking. A schematic representation ofa kink band is shown in Fig. 10(a). In the literature, kinking is often seen as aconsequence of microbuckling, and not a failure mode itself. However, kinkingis other times identified as an independent failure mode. On the discussion onwhether or not kinking is a consequence of microbuckling, the main argumenthas to do with the orientation of the kink-band boundary. Indeed, if kinking isa consequence of microbuckling, then one would expect the kink-band bound-
ary to lie normal to the loading axis (original fiber direction), i.e., to lie in theplane of highest bending stresses. In Fig. 10(a), this would mean an angle βequal to zero. However, it is found that in most cases β lie in the range of 30◦.On the other hand, the similarity between the kink bands and shear bandsmay suggest that shear is the main factor at the onset of kink-band formation.In this case, it would be expected that kink bands would occur in the planesof maximum shear stress, i.e., for β = 45◦. Some thick kink bands have beenfound near 45◦ [61], but this is generally not the case.
Another argument supporting kinking as a separate failure mode was intro-duced by Chaplin [79], who noted that microbuckling should occur everywherein the composite at about the same time, whereas kinking in his experimentswas clearly initiated from some kind of defect.
Effendi [80] carried a set of experimental tests on different carbon-fiber com-posites and also carried an analytical buckling analysis, which included initialfiber waviness, and computed the stresses in the fiber and matrix constituents.He found that before the buckling load was attained, the stress levels in theconstituents exceeded the respective failure stress. To refine the modelling, heconducted a numerical FE analysis, where a non-linear matrix behaviour wasincorporated. The results confirmed that constituent failure happened first.Composites with small initial imperfections or weaker fiber would fail by fiberfailure, while in composites with large initial imperfections or stronger fibers,the matrix would fail first.
On their review of the state of the art on compression failure of composites,Schultheisz and Waas [61] concluded that the experimental observations onthe kinking phenomenon support the contention that kink bands seen in high
28
fiber-volume-fraction advanced composite materials occur via a mechanismthat is different from the global microbuckling mode suggested by Rosen [62].Furthermore, in advanced composites, kinking seems to be initiated by localmicrostructural defects, such as fiber misalignments and longitudinal (matrixor interfacial) cracking. Therefore, kinking is better understood by treatingthe problem of stress redistribution, including dynamics, and including bothnon-linear geometry and material response.
Whether kinking is a result of fiber microbuckling or a separate failure mode, itis the most common failure feature observed after testing. The kink-band angleand kink width were studied by Hahn [81] for carbon fiber composites (CFRP),glass fiber composites (GFRP) and Aramid fiber composites (AFRC). Thekink-band angle β, and the band width w, were found to be the smaller forCFRP at room temperature (β ≈ 20◦ and w ≈ 0.07 to 0.2mm ). For GFRPno clear kink bands were observed at room temperature. However, at 100◦C ,a kink angle β ≈ 30◦ and a width w ≈ 1.2mm were observed. For AFRPtested at room temperature, the kink angle was found as β ≈ 40◦ and widthw ≈ 0.45mm . Chaplin [79] noted the angle of rotation of the fibers in the kinkband was twice the angle β, so that no volumetric changes happened in thekinked region.
Argon [7] was the first researcher to provide a model for kink-band formation.In his model, it is assumed that an initial fiber misalignment exists, whichleads to shearing stresses between the fibers. The shearing stresses would actas to further rotate the fibers, which would in turn lead to further increasein the shear stresses. This closed-loop effect would then lead to failure. Themain result from his analysis is the relation between the compressive failurestress, XC , the matrix in-plane shear failure stress, SL, and the initial fibermisalignment angle ϕo:
XC =SL
ϕo. (84)
From Argon’s analysis, a kink-band angle β = 45◦ should also result. Severalauthors since reported the sensitivity of the compressive failure stress to theshear failure stress [82–85]. Budiansky [84] later extended Argon’s analysis to
XC =SL
ϕo + γu(85)
where γu is the shear strain at failure. Failure occurs when the shear failurestress is reached.
4.2.1 2D Kinking model
Consider a unidirectional composite with a misaligned region being com-pressed, as depicted in Fig. 10(b). The stresses in the misalignment frame
29
are
σ1m1m =σ11 + σ22
2+
σ11 − σ22
2cos (2ϕ) + τ12 sin (2ϕ)
σ2m2m =σ11 + σ22
2− σ11 − σ22
2cos (2ϕ)− τ12 sin (2ϕ)
τ1m2m = −σ11 − σ22
2sin (2ϕ) + τ12 cos (2ϕ) .
(86)
For failure under pure compression (σ11 = −XC and σ22 ≡ τ12 = 0), Eqs. (86)lead to
σc1m1m = −XC cos2 (ϕ) ,
σc2m2m = XC sin2 (ϕ) and
τ c1m2m = XC sin (ϕ) cos (ϕ) .
(87)
The stress state in the misalignment coordinate frame can now be used tocheck for fiber kinking. For a material with linear shear behaviour, replacingit in an appropriated matrix failure criterion leads directly to the expression forthe specific value of the misalignment angle ϕ at failure for a pure compressioncase—ϕc. For a material with non-linear shear behaviour, it will become clearat the end of this section that kinking can result either from (i) matrix failure(i.e. the verification of a matrix failure criterion), or (ii) instability, due to theloss of (shear) stiffness for larger shear strain values.
Without loss of generality, suppose first the case of failure by the verificationof an appropriate matrix failure criterion.
Case 1 Kinking for pure compression as the result of matrix failure
Using LaRC04 matrix compression failure criterion, Eq. (81), the expressionfor the specific value of the misalignment angle ϕ at failure for a pure com-pression case (ϕc) is obtained as
XC(sin (ϕc) cos (ϕc)− ηL sin2 (ϕc)
)= SL. (88)
The angle ϕc is the sum of an initial misalignment with the rotation due toloading. Eq. (88) can be solved for ϕc [5], resulting in
ϕc = arctan
1−√
1− 4(
SL
XC + ηL)
SL
XC
2(
SL
XC + ηL)
. (89)
It can be observed that by neglecting ηL, and assuming ϕc to be small andconstant, Eq. (88) yields Argon’s equation (Eq. (84)). In fact, assuming allthe above but not that ϕc is constant yields Budiansky’s Eq. (85).
From the constitutive law, the shear stress in the misaligned frame is obtained
30
as a function of the shear strain
τ1m2m = fCL(γ1m2m) (90)
and from the transformation equations (Eqs. (86)), the shear stress in thesame frame for pure axial compressive failure is
τ c1m2m =
1
2sin (2ϕc) XC . (91)
Equating Eqs. (90) and (91), the shear strain at failure for a pure axial com-pression case, γc
1m2m , is obtained as
γc1m2m = f−1
CL
(1
2sin (2ϕc) XC
). (92)
For instance, for a material with a linear shear strain vs. shear stress behavior,Eq. (92) becomes simply
γc1m2m =
sin (2ϕc) XC
2G12
. (93)
Assuming small angle approximations, a simpler expression for Eq. (93) canbe obtained,
γc1m2m =
ϕcXC
G12
. (94)
Either way, the initial misalignment angle comes then as
ϕo = ϕc − γc1m2m (95)
where γc1m2m can be defined through Eqs. (92), (93) or (94).
Writing Eq. (92) in the form
fCL (γc1m2m) =
1
2sin [2 (ϕo + γc
1m2m)] XC (96)
and plotting the left and right hand side of it in a (γ, τ) space and providesinsight into the meaning of the solution of Eq. (92). Fig. 11(a) represents bothsides of Eq. (96) for a material with linear shear behaviour.
The Left Hand Side (LHS) of Eq. (96) is the shear strain vs. shear stress ma-terial law. The Right Hand Side (RHS) of Eq. (96) represents the shear stressresulting from the compressive longitudinal loading, in a rotated coordinatesystem. As the compressive stress increases, the ‘RHS’ curve correspondingto a general stress level shifts up, and the intersection with the ‘LHS’ curvedefines the strain in the misalignment frame γ1m2m . At failure (when the com-pressive stress equals XC), the strain in the misalignment frame is defined asγc
1m2m and is shown in Fig. 11(a).
31
τ
γ
RHS
L HS
τ
γ
RHS
L HS
×
τ
γ
RHS
L HS
(a) (b) (c)
�
��
21γ
�
��
21γ
�
��
21γ
Fig. 11. Left and Right hand side of Eq. (96), for a material with a (a) linearshear behavior, (b) non-linear shear behavior, and failure by matrix cracking, and(c) non-linear shear behavior, and failure by instability
For a material with non-linear shear behaviour, there could be more thanone intersection point for each stress level, as represented in Fig. 11(b) for theparticular case of failure onset. For such a non-linear material, the equilibriumposition, which defines the orientation of the misaligned frame, correspondsto the first intersection (lower energy). As the compressive loading increases,the ‘RHS’ curve corresponding to a general stress level shifts up, and theintersection with the ‘LHS’ curve defines the strain in the misalignment frameγ1m2m . At failure (when the compressive stress equals XC), the strain in themisalignment frame is defined as γc
1m2m and is shown in Fig. 11(b). Therefore,γc
1m2m has to correspond to the first intersection of the two curves. However,this is not guaranteed by the solution of Eqs. (89), (92) and (95). If the referredsolution corresponds to the second intersection, then the solution is not validand failure is due to a different mechanism, which is now discussed.
Case 2 Kinking for pure compression as the result of instability
A second mechanism that can promote fiber kinking is elastic instability of thematrix, due to the softening character of the constitutive law. As a compositeis progressively loaded in compression, the curve ‘RHS’ in Fig. 11(b) shiftsup, also progressively. Suppose that at the moment the two curves (‘LHS’and ‘RHS’) are tangent to each other, Fig. 11(c), the matrix compressionfailure criterion (LaRC#2, Eq. (81)) is not yet verified. Then, a small increasein the compressive load results in the two curves not touching each other.Physically, this means that there is no equilibrium position and catastrophicfailure results, due to unstable rotation of the fibers. It is concluded thatthe compressive strength measured for pure axial compression is in this caseactually a failure due to instability, rather than matrix failure.
The values of ϕo and γc1m2m corresponding to this type of failure can be ob-
tained from the system that results from Eq. (96) and the condition that
32
expresses that the left and right hand side of Eq. (96) have the same slope atγc
1m2m :
fCL(γc1m2m) =
XC
2sin [2 (ϕo + γc
1m2m)]
∂fCL(γ1m2m)
∂γ1m2m
∣∣∣∣∣γc1m2m
= XC cos [2 (ϕo + γc1m2m)] .
(97)
To summarize, the three variables ϕo, γc1m2m and ϕc can be determined by
Eqs. (89), (92) and (95) (matrix compressive failure) or by Eqs. (95) and (97)(elastic instability).
If the instability solution occurs for FM < 1 (in LaRC#2, Eq. (81)), thenthe instability solution must be considered; otherwise the matrix compressivefailure solution is considered. Either way, ϕo, γc
1m2m and ϕc are always defined.
The initial misalignment angle ϕo is a material property, and could be regardedas an equivalent angle that embodies microstructural defects (that can triggerkink-band formation) other than the initial misalignment, like oscillations inthe fiber volume fraction or in the bonding to the resin. Knowing ϕo allowsthe establishment of an equation defining the misalignment angle for a genericplane stress situation, ϕ, by using the transformation Eqs. (86),
Note that, in Eq. (98), |τ12| was used instead of τ12 because it is the easiestway of considering simultaneously the possibility of an initial misalignment±ϕo.
Solving this equation (where for any load case the only unknown variable isγ1m2m) for non-linear shear responses is probably the most complex task ofthe whole model. For most practical cases, Eq. (98) can be simplified withoutsignificant error by assuming small angle approximations:
Solving Eq. (100) depends on the particular form of the constitutive law τ =fCL(γ). For a linear shear behaviour, Eq. (100) was solved by Davila et al. [5],resulting in
γ1m2m =ϕoG12 + |τ12|
G12 + σ11 − σ22
− ϕo. (101)
33
(a) (b )
� �����
� �����
� �
��� �
�� ��� ��� ��� ��� � ��� �
σ �������������
σ �������������
� ��� � � �
�"!$#&%
� �����
� �����
� �
��� �
�� ������� ��� ��� � �����
σ �������������
σ ���������"���
� ��� � � ��"!$#'%
Fig. 12. Failure envelopes for longitudinal compression acting with inplane shear for(a) linear shear behaviour and (b) non-linear shear behaviour
For non-linear shear behaviour, there might be no easy way of solving Eq.(98) or (100) without iterating. Furthermore, Eq. (98) does not always havea solution, since failure by instability is also possible. If, for a specific loadstate, Eq. (98) does not have a solution (this can be easily checked by plottingthe left and right hand side of the equation in a (τ, γ) space), then failure hastaken place by instability. The envelope for failure by instability is definedby the system that results from the following two conditions: (i) Eq. (98) isverified; and (ii) the slope (in a (τ, γ) space) of the left hand side of Eq. (98)is the same as the slope of the right hand side. Mathematically, the followingsystem follows,
= − (σ11 − σ22) cos (2 (ϕo + γ1m2m))− 2 |τ12| sin (2 (ϕo + γ1m2m)) .
(102)
As long as no instability takes place, the misalignment frame can be defined,the stresses can be rotated to that frame, and a matrix failure criterion canbe used to check for possible kink-band formation or matrix failure.
Fig. 12 shows the application of this analysis to a biaxial compression in thefiber and matrix direction for a E-glass/DY063 epoxy used in the WWFE [16].The material properties used are given by Soden et al. [60] and presented inTable 2. For the non-linear behaviour, the experimental data stress vs. strainpoints given by Soden et al. [60] are used directly by the model (Fig. 13).
Fig. 12(a) shows the different envelopes obtained when using the LaRC04matrix failure criterion (Eq. (81)) and the Puck matrix failure criterion (Eq.(74)), considering a linear shear behaviour.
Fig. 12(b) presents the application of this failure model for a non-linear shearbehaviour (see Eqs. (92) and (98)). Shear non-linearity was not consideredexplicitly; instead, interpolation and extrapolation was used to get the re-
Fig. 13. Linear and non-linear shear curves for an E-glass/DY063 epoxy used in theWWFE, experimental points from Soden et al. [60]
quired information from the experimental data points. The linear and non-linear shear strain vs. shear stress curves are represented in Fig. 13. The effectof the non-linearity on the envelope—Fig. 12(b)—is seen to be considerable,which reinforces the importance of a more comprehensive characterization ofcomposite materials under shear loading.
Note the interesting implications of this model: the failure envelope is de-pendent on the elastic properties of the material. This is common in fibercompression failure models and in this case reflects the fact that failure takesplace in a rotating misalignment frame. Indeed, the magnitude of the rotationof the fibers, γ1m2m , depends on the shear response.
4.2.2 3D kinking model
The mechanics of kink-band formation is particularly complex. Therefore, aphysically-based model that simulates all the details of kink-band formation—initiation, subsequent fiber rotation, fiber fracture at kink-band boundaries,kink-band width, angle, broadening, and that takes into account magnitude,distribution and orientation of initial defects, in-plane shear non-linearity, andall this for a generic 3D stress state—does not seem possible. For the validationof emerging, simplified models, an added difficulty results from the difficultiesin obtaining trustworthy experimental data for compression failure under amultiaxial stress state. Consequently, the validation of a specific mechanicalmodel for fiber kinking is bounded to some controversy.
The 2D model for fiber kinking just presented assumes that the initiation ofkink-band formation is triggered by matrix failure due to initial fiber misalign-
35
1
3
2
1
3
2
3
2ψ
33σ
33σ
22σ22σ
ψψσ22
ψψσ22
ψψσ33
ψψσ33
2
3
32τ23τ
32τ 23τ
ψ
ψ
(a) (b )
(c ) (d )
11f
33F
22F22F
Fig. 14. 3D kinking model
ment. As with most fiber-kinking models, the 2D model assumes that kinkinghappens in the plane of the lamina.
However, there is significant evidence supporting the importance of 3D anal-yses for understanding failure by kink-band formation [61,67–71,73–78]. Themodel that follows generalizes the previous one for a generic 3D stress state.
Consider a unidirectional lamina under compressive stress as shown in Fig.14(a). The stresses acting on the (2, 3) plane are shown in Fig. 14(b). Thekink plane is at an angle ψ with the 2 axis, as shown in Figs. 14(c) and (d).The actual value of the angle ψ depends on the particular stress state 3 . A 2Dkinking model assumes that the angle ψ in Fig. 14(c) and (d) is equal to zero.If the composite is constrained so that it cannot move laterally, then the kinkplane would have an angle ψ = 90◦. In general, ψ will have a value between 0and 180◦.
The local stresses in the (2, 3) plane can be found as a function of ψ throughthe use of transformation equations. For a potential kinking plane orientedat an angle ψ, a negative stress σ3ψ3ψ will act as to close microcracks in the
3 In reality, defects as fiber initial misalignment are not necessarily homogeneouslydistributed and the kinking plane orientation could in fact also be influenced by aparticular distribution
36
matrix for alternative kinking planes, while a positive σ2ψ2ψ will act as toopen microcracks thus favouring kinking in that plane. Therefore, the kinkingplane is expected to be created at the orientation that maximizes σ2ψ2ψ andminimizes σ3ψ3ψ , which coincide with the local principal directions. Anotherargument is that the reduced shear stiffness in the kink band would resultin fibers rotating in different directions, in case τ2ψ3ψ was nonzero—however,experimental observations support the contention that kink bands lie in aplane.
With the assumption that the kink plane happens at an angle such thatτ2ψ3ψ = 0, the value of the angle ψ that defines the kink plane is given by
tan (2ψ) =2τ23
σ22 − σ33
. (103)
The stresses in the kink plane are defined as
σ2ψ2ψ =σ22 + σ33
2+
σ22 − σ33
2cos (2ψ) + τ23 sin (2ψ)
σ3ψ3ψ = σ22 + σ33 − σ2ψ2ψ
τ12ψ = τ12 cos (ψ) + τ31 sin (ψ)
τ2ψ3ψ = 0
τ3ψ1 = τ31 cos (ψ)− τ12 sin (ψ) .
(104)
After defining the kink plane, the stresses are then rotated to the misalign-ment frame. This misalignment frame is defined by first determining γ1m2m bysolving the following equation iteratively:
(105)After obtaining γ1m2m from Eq. (105), the angle ϕ is obtained from
ϕ =τ12ψ
|τ12ψ | (ϕo + γ1m2m) . (106)
If Eq. (105) has no solution, then failure has taken place by instability. Oth-erwise, the misalignment frame is defined and the stresses can be rotated toit to check for matrix failure. In the misalignment frame, the stresses can be
37
written as
σ1m1m =σ11 + σ2ψ2ψ
2+
σ11 − σ2ψ2ψ
2cos (2ϕ) + τ12ψ sin (2ϕ)
σ2m2m = σ11 + σ2ψ2ψ − σ1m1m
τ1m2m = −σ11 − σ2ψ2ψ
2sin (2ϕ) + τ12ψ cos (2ϕ)
τ2m3ψ = τ2ψ3ψ cos (ϕ)− τ3ψ1 sin (ϕ)
τ3ψ1m = τ3ψ1ψ cos (ϕ) .
(107)
The LaRC04 criteria for matrix tension failure, Eq. (40), and matrix compres-sion failure, Eq. (81), can be applied in the misalignment frame to predictfailure. The type of failure predicted is matrix failure, and this might or notpromote subsequent fiber kinking. While it might be trivial in some cases topredict that subsequent fiber kinking takes place—like for pure compressionin the fiber direction, the same is not true for all load combinations.
For σ2m2m < 0, it seems reasonable to assume that failure is by kink-bandformation only if Eq. (81) is verified with α = 0. Otherwise, the failure isconsidered to lead to matrix failure, without kink-band formation. Thus, kink-band formation with σ2m2m < 0 is predicted with the criterion
LaRC04 #4 FIF =|τ1m2m|
SLis − ηLσ2m2m
≤ 1 (108)
while matrix failure under biaxial compression is predicted by
LaRC04 #5 FIM =
(τTm
ST − ηT σmn
)2
+
(τLm
SL − ηLσmn
)2
≤ 1 (109)
with
σmn =
σ2m2m + σ3ψ3ψ
2+
σ2m2m − σ3ψ3ψ
2cos (2α) + τ2m3ψ sin (2α)
τTm = −σ2m2m − σ3ψ3ψ
2sin (2α) + τ2m3ψ cos (2α)
τLm = τ1m2m cos (α) + τ3ψ1m sin (α)
(110)
where the angle α, which is comprised in the interval ]0, π[, is obtained bytrying a small number of tentative angles.
For σ2m2m ≥ 0, it seems more difficult to agree on a criterion for eventual fiber-kinking after matrix failure, in the absence of experimental data. Possiblesolutions to identify the conditions triggering fibre-kinking are the use of athreshold value for σ11, or to consider fibre-kinking when the last term of Eq.(40) is equal to 1. Without further support from experimental data, XC/2 istaken here as the threshold value. Thus, for σ2m2m ≥ 0 and from Eq. (40),
38
the criterion for matrix tensile failure under longitudinal compression (witheventual fiber-kinking) is,
LaRC04 #6 FIM/F = (1− g)σ2m2m
Y Tis
+ g
(σ2m2m
Y Tis
)2
+
+Λo
23τ22m3ψ + χ (γ1m2m)
χ (γu12pis)
≤ 1. (111)
5 Applications
5.1 Failure envelope (σ22, τ12)
A comparison of results from various failure criteria with the experimen-tal results in the (σ22, τ12) stress plane for an unidirectional composite E-glass/LY556, is shown in Fig. 15. The material properties and test resultswere reported in the WWFE by Soden et al. [60,86]. The compressive, tensileand shear strengths shown in Table 3 were obtained by averaging the corre-sponding test data presented in Refs. [60,86]. To apply the Puck tensile matrixfailure criterion, it was assumed that (∂τ12/∂σ22)|σ2=0− = (∂τ12/∂σ22)|σ2=0+ .The envelopes for Hashin’s 1980 criteria and Sun’s criteria were calculated us-ing a transverse shear strength obtained from Eq. (68). The friction parameterηL for Sun’s criteria was obtained from Eq. (75) with ηT from Eq. (67).
It can be observed that within the positive range of σ22, all the quadraticfailure criteria and LaRC04 give satisfactory results. The most interestingbehavior develops when σ22 becomes compressive. Hashin’s 1973 criterion givesan elliptical envelope with diminishing τ12 as the absolute value of compressiveσ22 increases, while the experimental data shows a definite trend of shearstrength increase as σ22 goes into compression.
The envelope for Hashin’s 1980 criteria provides a modest improvement inaccuracy compared to the 1973 criterion. Of the criteria shown in Fig. 15,Sun (Eq. (76)), LaRC04 #2 (Eq. (81)), and Puck (Eq. (74)) capture the shearstrength increase at the initial stage of compressive σ22. The results indicatea significant improvement over Hashin’s criteria.
Fig. 16 shows the application of LaRC04 for AS4/55A, tested by Swanson etal. [87]. The material properties used are given in Table 3. The predictionsfor T800/3900-2 composite tested by Swanson et al. [77] are shown in Fig. 17,and the material properties in Table 3.
39
Table 3Mechanical properties of E-glass/MY750, from Soden et al. [60,86]
Material E11 E22 G12 SL Y T Y C αo
(GPa ) (GPa ) (GPa ) (MPa ) (MPa ) (MPa ) (◦ )
E-Glass/LY556 53.48 17.7 5.83 66.5 37.5 130.3 53
AS4/55A 126 11 6.6 51.3 27 91.8 53
T800/3900-2 155 8.5 5.5 100.9 48.8 201.7 53
0
5 0
1 00
- 1 5 0 - 1 00 - 5 0 0 5 0
σ22 ( M P a )
τ12 ( M P a )
Experimental,W W F E
A v erag e o fexperimental,inpu t f o r th ec riteria
S u n
L a R C 04 # 2P u c k
H a s h i n ’ 8 0
H a s h i n ’ 7 3H a s h i n
L a R C 04 # 1
Fig. 15. Failure envelopes and WWFE test data for unidirectional compositeE-Glass/LY556
5.2 Failure envelope (σ11, σ22)
All of the failure modes represented by the six LaRC04 criteria (Eqs. (40),(81), (82), (108), (109) and (111), and summarized in the Appendix) canbe represented as a failure envelope in the (σ1, σ2) plane. Testing for biaxialloads presents a number of complexities, and experimental results are rare.However, Waas and Schultheisz [88] report a number of references in whichmultiaxial compression was studied by superposing a hydrostatic pressure inaddition to the compressive axial loading. For all materials considered, thereis a significant increase in compressive axial strength with increasing pressure.
As an example, a test case from the WWFE [1] is studied here: the biaxialcompression of a 0◦ E-glass/MY750 epoxy lamina, with material propertiesgiven in Table 4. In addition to those properties, the in-plane Poisson’s ratiois ν12 = 0.278 and the fracture angle for pure in-plane transverse compressionis αo = 53◦. For the application of the model with non-linear shear behaviour,
40
0
5 0
1 00
- 1 00 - 7 5 - 5 0 - 2 5 0 2 5
σ22 ( M P a )
τ12 ( M P a )Experimental,S w ans o n et. al. ,1 9 8 7
S u n
L a R C 04 # 2P u c k
H a s h i n ’ 8 0
H a s h i n ’ 7 3
H a s h i n
L a R C 04 # 1
Fig. 16. Failure envelopes and test data from Swanson et al. [87], for an AS4/55Acomposite
0
5 0
1 00
1 5 0
- 2 5 0 - 2 00 - 1 5 0 - 1 00 - 5 0 0 5 0 1 00
σ22 ( M P a )
τ12 ( M P a )Experimental,S w ans o n et. al. ,1 9 9 2
S u nL a R C 04 # 2
P u c k
H a s h i n ’ 8 0
H a s h i n ’ 7 3
H a s h i n
L a R C 04 # 1
Fig. 17. Failure envelopes and test data from Swanson et al. [77], for an T800/3900-2composite
the experimental curve given by Soden et al. [60] is used directly. The linearand non-linear shear laws are plotted in Fig. 18(a).
For the LaRC04 3D kinking model, the kinking angle is predicted using Eq.(103). The magnitude of σ3 is unknown, and depends on the existence ofconstrains on the 3 direction. Therefore, the 2 roots of Eq. (103) must beconsidered and are ψ1 = 0◦ and ψ2 = 90◦, meaning that the kink plane caneither be in the plane of the lamina, or in the through-the-thickness direction.
Fig. 18. (a) Linear and non-linear shear law; (b) biaxial (σ1, σ2) failure envelope of0◦ E-glass/MY750 epoxy lamina, assuming a kink band in the plane of the lamina
Assuming first that the kink band develops in the plane of the lamina (ψ = 0◦),either due to the micromechanics of the material or imposed by the testing, thefailure envelope comes as in Fig. 18(b). Puck’s analysis results, which showeda particularly good correlation with experimental results in the WWFE [1],is also shown for comparison. In the figure, there is good agreement betweenLaRC04 and Puck in all quadrants except biaxial compression, where LaRC04predicts—for a kink band developing in the plane of the lamina—an increaseof the axial compressive strength with increasing transverse compression.
If it is assumed that the kink band is formed in the through-the-thicknessdirection (second root of Eq. (103), ψ = 90◦), the envelope shown in Fig.19(a) is predicted. If the orientation of the kink plane is unrestricted, theenvelope in Fig. 19(b) is obtained.
5.3 Axial compression with superposed hydrostatic pressure
There is not much experimental data on fiber kinking under a multi-axialstress state. One exception is the compressive behaviour of composite rods
Fig. 19. Biaxial (σ11, σ22) failure envelope of 0◦ E-glass/MY750 epoxy lamina (a)assuming through-the-thickness kinking; (b) assuming that there are no restrictionsto the kinking plane
with superposed hydrostatic pressure [89,90].
Wronsky and Parry [89] made a characterization of the effect of hydrostaticpressure on the compressive strength for a glass fiber reinforced composite. Thecompressive strength without superposed hydrostatic pressure was measuredas 1150 MPa. Three values of shear strength are reported, depending on thetest method and specimen dimensions, 42, 48 and 59 MPa. The biggest value ofthe three is used herein, because it is expected to be the most representative ofthe three. These material properties are not sufficient to completely define thematerial. Therefore, some material properties have to be assumed from theirtypical values. The shear modulus is 6.6 GPa, the fracture angle in matrixcompression is αo = 53◦, and the transverse compressive strength is 140 MPa.Linear and a non-linear approximations of the material’s shear response areshown in Fig. 20(a). The non-linear curve uses the logarithmic 4 function τ =k1 ln (k2γ + 1), with k1 = 200 MPa and k2 = 33, which yields the correctinitial shear modulus, G12 = k1k2 = 6.6 GPa, and matches particularly wellthe experimental points, as shown in Fig. 20(b). The same figure shows that,considering a linear shear model, the global trend is captured, but an over-prediction of the axial strength results for the higher values of superposedhydrostatic pressure.
Parry and Wronsky [90] compressed 8 mm carbon-epoxy rods for several valuesof superposed hydrostatic pressure. Three values of compressive strength atatmospheric pressure are reported (depending on the test specimen’s batchand its shape): 1.3 MPa, 1.33 MPa and 1.5 MPa. The corresponding averageis considered here. The shear strength reported is 75 MPa. As before, somematerial properties have to be assumed to apply the present model. The shear
4 A logarithmic function is used because, while correctly representing the shearnon-linear behaviour of composites, it can be easily inverted
Fig. 20. Test case corresponding to Wronsky and Parry’s [89] experiments (a) linearand non-linear shear curves considered; (b) compressive strength as a function ofthe hydrostatic pressure
Fig. 21. Test case corresponding to Parry and Wronsky’s [90] experiments (a) linearand non-linear shear curves considered; (b) compressive strength as a function ofthe hydrostatic pressure
modulus is 6.6 GPa, the fracture angle in matrix compression is αo = 53◦, thetransverse compressive strength is 170 MPa. The predictions for a linear shearmodel (Fig. 21(a)) are shown in Fig. 21(b). The effect of shear non-linearityis the same as for the previous example. Considering the non-linear stressvs. strain curve in Fig. 21(a) (logarithmic curve, τ = k1 ln (k2γ + 1), withk1 = 120 MPa and k2 = 55, which yields the same initial shear modulus), thepredictions in Fig. 21(b) are in good agreement with the experimental points.
The comparison of experimental results and predictions in Figs. 20 and 21suggests that the physics of the compressive behaviour is captured by thekinking model.
5.4 Cross-ply laminates
Shuart [73] studied the compression failure of [±θ]s laminates and found thatfor θ < 15◦, the dominant failure mode in these laminates is interlaminarshearing; for 15◦ < θ < 50◦, it is in-plane matrix shearing; and for θ > 50◦, it
Fig. 22. Compressive strength as a function of ply orientation for AS4-3502 [±θ]slaminates
is matrix compression. Fiber scissoring due to matrix material non-linearitycaused the switch in failure mode from in-plane matrix shearing to matrixcompression failure at larger lamination angles. The material properties usedfor the analysis are given by Shuart [73] and shown in Table 5. Further to thoseproperties, the fracture angle in pure transverse compression is considered tobe αo = 53◦.
The results shown in Fig. 22 indicate that the predicted strengths usingLaRC04 criteria correlate well with the experimental results. The compres-sive strength predicted using Hashin’s 1980 criteria is also shown in Fig. 22.For θ < 20◦, the Hashin criterion for fiber compression results in an over-prediction of the failure load because the criterion does not account for theeffect of in-plane shear on fiber failure. For lamination angles near 70◦, theuse of the Hashin criteria result in an under-prediction of the failure loadbecause the criteria do not account for the increase in shear strength causedby transverse compression. All of these effects are correctly captured by theLaRC04 criteria, which results in a good correlation between the calculatedand experimental values.
45
6 Conclusions
Material models based on the physics of failure can yield criteria that succeedin predicting failure under a broad range of load combinations. Consider-ing the current difficulties in accurately predicting failure [1], the ability ofphysically-based models to capture the physics of the failure process and cor-rectly predict failure envelopes is particularly significant and should encouragefurther research. In this paper, physically-based models of the different failuremodes result in a set of six physically-based failure criteria devoid of empiricalvariables—the LaRC04 criteria—that can be used directly by the designer. Afew considerations on the models presented are now discussed; some of themwill be the focus of further work.
Non-linear shear behaviour is an important factor affecting strength in a gen-eral loading situation. Furthermore, it is known that the shear behaviour de-pends on the stress in the in-plane transverse direction (the shear responsegets “stiffer” with compressive transverse stresses [6]). In the future, it wouldbe desirable to consider the dependence of the shear stress on eventual su-perposed transverse stress. Furthermore, the shear strength reported in theliterature is often the shear stress at some strain level—as recommended byactual standard methods [91]. Although convenient for design purposes, thisvalue of the shear stress has no direct correspondence with failure and is mean-ingless for physically-based failure models.
For fiber kinking, only matrix failure (as well as some form of instability) isassumed to trigger the failure. This consideration is believed to be accurate forcarbon-reinforced composites. However, a more general model that includesthe possibility of fiber buckling, as well as fiber failure itself would be desirable.Furthermore, the strength in a generic loading situation is very sensitive to theinitial fiber misalignment angle. However, this misalignment angle results frommanufacturing limitations, and should be expected to be different for panelsor components with different dimensions and geometry. Therefore, the valuemeasured using standard compression specimens could not be representativefor other more complex components. Finally, residual stresses—present in thecompression specimens—affect the value measured of the fiber misalignmentangle. In more complex components, the residual stresses will certainly bedifferent, and relax over time, which restricts the applicability of the proposedmodel, and should be addressed in the future.
Acknowledgements
The first author whishes to acknowledge the funding from the Portuguese
46
Foundation for Science and Technology.
References
[1] M. J. Hinton, P. G. Soden, A comparison of the predictive capabilities of currentfailure theories for composite laminates, judged against experimental evidence,Composites Science and Technology 62 (2002) 1725–1797.
[2] P. P. Camanho, C. G. Davila, M. F. de Moura, Numerical simulation of mixed-mode progressive delamination in composite materials, Journal of CompositeMaterials 37 (16) (2003) 1415–1438.
[3] A. Turon, P. P. Camanho, J. Costa, C. G. Davila, An interface damage modelfor the simulation of delamination under variable-mode ratio in compositematerials, Tech. Rep. NASA/TM-2004-213277, National Aeronautics and SpaceAdministration, U. S. A. (2004).
[4] ABAQUS Users Manual Version 6.1, Hibbit, Karlsson and Sorensen Inc. (2000).
[5] C. G. Davila, P. P. Camanho, Failure criteria for FRP laminates in planestress, Tech. Rep. NASA/TM-2003-212663, National Aeronautics and SpaceAdministration, U. S. A. (2003).
[6] A. Puck, H. Schurmann, Failure analysis of FRP laminates by means ofphysically based phenomenological models, Composites Science and Technology58 (1998) 1045–1067.
[7] A. S. Argon, Fracture of composites, in: Treatise on Materials Science andTechnology, Academic Press, New York, 1972, pp. 79–114.
[8] C. G. Davila, N. Jaunky, S. Goswami, Failure criteria for FRP laminates inplane stress, in: 44th AIAA/ ASME/ ASCE/ AHS/ ASC Structures, StructuralDynamics, and Materials Conference, 2003, AIAA Paper 2003-1991.
[9] G. J. Dvorak, N. Laws, Analysis of progressive matrix cracking in compositelaminates II. First ply failure, Journal of Composite Materials 21 (1987) 309–329.
[10] F. Paris, A study of failure criteria of fibrous composite materials, Tech. Rep.NASA/CR-2001-210661, National Aeronautics and Space Agency (2001).
[11] Z. Hashin, A. Rotem, A fatigue failure criterion for fibre reinforced materials,Journal of Composite Materials 7 (1973) 448–464.
[12] Z. Hashin, Failure criteria for unidirectional fibre composites, Journal of AppliedMechanics 47 (1980) 329–334.
[13] A. Puck, Calculating the strength of glass fibre/plastic laminates undercombined load, Kunststoffe, German Plastics 55 (1969) 18–19, original inGerman.
47
[14] A. Puck, W. Schneider, On failure mechanisms and failure criteria of filament-wound glass-fibre/resin composites, Plastics and Polymers (1969) 33–44.
[15] I. Shahid, F. K. Chang, An accumulative damage model for tensile and shearfailures of laminated composite plates, Journal of Composite Materials 29 (1995)926–981.
[16] M. J. Hinton, P. G. Soden, Predicting failure in composite laminates: thebackground to the exercise, Composites Science and Technology 58 (1998) 1001–1010.
[17] L. J. Hart-Smith, Prediction of the original and truncated maximum-strainfailure models for certain fibrous composite laminates, Composites Science andTechnology 58 (7) (1998) 1151–1178.
[18] L. J. Hart-Smith, Predictions of a generalized maximum-shear-stress failurecriterion for certain fibrous composite laminates, Composites Science andTechnology 58 (7) (1998) 1179–1208.
[19] P. K. Gotsis, C. C. Chamis, L. Minnetyan, Prediction of composite laminatefracture: micromechanics and progressive fracture, Composites Science andTechnology 58 (7) (1998) 1137–1149.
[20] L. N. McCartney, Predicting transverse crack formation in cross-ply laminates,Composites Science and Technology 58 (7) (1998) 1069–1081.
[21] A. Rotem, Prediction of laminate failure with the rotem failure criterion,Composites Science and Technology 58 (7) (1998) 1083–1094.
[22] C. T. Sun, J. Tao, Prediction of failure envelopes and stress/strain behaviour ofcomposite laminates, Composites Science and technology 58 (7) (1998) 1125–1136.
[23] C. T. Sun, B. J. Quinn, D. W. Oplinger, Comparative evaluation of failureanalysis methods for composite laminates, DOT/FAA/AR (1996) 95–109.
[24] K.-S. Liu, S. W. Tsai, A progressive quadratic failure criterion for a laminate,Composites Science and Technology 58 (7) (1998) 1023–1032.
[25] S. W. Tsai, E. M. Wu, A general theory of strength for anisotropic materials,Journal of Composite Materials 5 (1971) 58–80.
[26] W. E. Wolfe, A strain-energy based failure criterion for non-linear analysisof composite laminates subjected to biaxial loading, Composites Science andTechnology 58 (7) (1998) 1107–1124.
[27] E. C. Edge, Stress-based grant-sanders method for predicting failure ofcomposite laminates, Composites Science and Technology 58 (7) (1998) 1033–1041.
[28] P. A. Zinoviev, S. V. Grigoriev, O. V. Lebedeva, L. P. Tairova, The strengthof multilayered composites under a plane-stress state, Composites Science andTechnology 58 (7) (1998) 1209–1223.
48
[29] N. Laws, A note on interaction energies associated with cracks in anisotropicsolids, Philosophical Magazine 36 (2) (1977) 367–372.
[30] J. D. Eshelby, The determination of the elastic field of an ellipsoidal inclusion,and related problems, Proceedings of the Royal Society A 241 (1957) 376–396.
[31] N. Kinoshita, T. Mura, Elastic fields of inclusions in anisotropic media, PhysicaStatus Solidi: A 5 (1971) 759–768.
[32] G. Faivre, Heterogeneites ellipsoıdales dans un milieu elastique anisotrope, LeJournal de Physique 32 (1971) 325–331.
[33] A. Parvizi, K. Garrett, J. Bailey, Constrained cracking in glass fibre-reinforcedepoxy cross-ply laminates, Journal of Material Science 13 (1978) 195–201.
[34] A. S. D. Wang, Fracture mechanics of sublaminate cracks in compositematerials, Composites Technology Review 6 (2) (1984) 45–62.
[35] S. C. Tan, R. J. Nuismer, A theory for progressive matrix cracking in compositelaminates, Journal of Composite Materials 23 (1989) 1029–1047.
[36] R. Talreja, Transverse cracking and stiffness redction in composite laminates,Journal of Composite Materials 19 (1985) 355–375.
[37] D. H. Allen, C. E. Harris, S. E. Groves, A thermomechanical constitutive theoryfor elastic composites with distributed damage- I. theoretical developments,International Journal of Solids and Structures 23 (9) (1987) 1301–1318.
[38] D. H. Allen, C. E. Harris, S. E. Groves, A thermomecanical constitutive theoryfor elastic coposites with distributed damage- II. application to matrix crackingin laminated composites, International Journal of Solids and Structures 23 (9)(1987) 1319–1338.
[39] R. Talreja, S. Yalvac, L. D. Yats, D. G. Wetters, Transverse cracking andstiffness reduction in cross ply laminates of different matrix toughness, Journalof Composite Materials 26 (11) (1992) 1644–1663.
[40] F. K. Chang, M. H. Chen, The in situ ply shear strength distribuctionsin graphite/epoxy laminated composites, Journal of Composite Materials 21(1987) 708–733.
[41] D. L. Flaggs, K. M. H, Experimental determination of the in situ transverselamina strength in graphite/epoxy laminates, Journal of Composite Materials16 (1982) 103–116.
[42] N. Laws, G. J. Dvorak, Progressive transverse cracking in composite laminates,Journal of Composite Materials 22 (1988) 900–919.
[43] J. Li, J. K. Sen, Analysis of frame-to-skin joint pull-off tests and prediction ofthe delamination failure, in: 42nd AIAA/ASME/ASCE/AHS/ASC Structures,Structural Dynamics and Materials Conference, Seattle, WA, USA, 2000.
49
[44] J. Li, Three-dimensional effects in the prediction of flange delamination incomposite skin-stringer pull-off specimens, in: 15th Conference of the AmericanSociety for Composites, Texas, USA, 2000.
[45] H. T. Hahn, T. Johannesson, Fracture of unidirectional composites: Theory andapplications, in: G. J. Dvorak (Ed.), Mechanics of Composite Materials, AMD,1983, pp. 135–142.
[46] E. M. Wu, R. C. J. Reuter, Crack extension in fiberglass reinforced plastics anda critical examination of the general fracture criterion. theoretical and applyedmechanics report no. 275, University of Illinois (1965).
[47] R. S. Sandhu, Nonlinear response of unidirectional and angle-ply laminates, in:AIAA Paper No. 74-380, 15th AIAA-ASME Structural Dynamics and MaterialsConference, Las Vegas, Nevada, 1974.
[48] F.-K. Chang, R. A. Scott, Failure strength of nonlinearly elastic compositelaminates containing a pin loaded hole, Journal of Composite Materials 18(1984) 464–477.
[49] H. Tada, P. C. Paris, G. R. Irwin, The Stress Analysis of Cracks Handbook,3rd. Ed., Americal society of Mechanical Engineers, New York, 2000.
[50] H. T. Hahan, S. W. Tsai, Nonlinear elastic behavior of unidirectional compositelaminae, Journal of Composite Materials 7 (1973) 102–118.
[51] D. Leguillon, Strength or toughness? A criterion for crack onset at a notch,European Journal of Mechanics - A/Solids 21 (1) (2002) 61–72.
[52] A. Puck, H. Schurmann, Failure analysis of FRP laminates by means ofphysically based phenomenological models, Composites Science and Technology62 (2002) 1633–1662.
[53] R. M. Christensen, S. J. de Teresa, Failure plane orientations for transverseloading of a unidirectional fiber composite, International Journal of Solids andStructures 40 (25) (2003) 7055–7062.
[54] S. Kawabata, Strength of epoxy resin under multiaxial stress field, in:Proceedings of the ICCM-IV, Tokyo, 1982, pp. 191–168.
[55] J. P. Boehler, J. Raclin, Failure criteria for glass-fiber reinforced compositesunder confining pressure, Journal of Structural Mechanics 13 (3-4) (1985) 371–392.
[56] A. Taliercio, P. Sagramoso, Uniaxial strength of polymeric-matrix fibrouscomposites predicted through a homogenization approach, InternationalJournal of Solids and Structures 32 (14) (1995) 2095–2123.
[57] L. DiLandro, M. Pegoraro, Carbon fibre-thermoplastic matrix adhesion, Journalof Material Science 22 (1987) 1980–1986.
[58] M. C. Larson, H. F. Miles, On the effects of friction, roughness and toughnesson interfacial sliding in brittle composites, Mechanics of Materials 27 (2) (1998)77–89.
50
[59] S. T. Pinho, L. Iannucci, P. Robinson, Physically-based failure modelsand criteria for laminated fibre-reinforced composites. Part I: Development,Submitted to Composites: Part A (2004).
[60] P. D. Soden, M. J. Hinton, A. S. Kaddour, Lamina properties, lay-upconfigurations and loading conditions for a range of fibre-reinforced compositelaminates, Composites Science and Technology 58 (1998) 1011–1022.
[61] C. R. Schultheisz, A. M. Waas, Compressive failure of composites, part I:Testing and micromechanical theories, Progress in Aerospace Sciences 32 (1996)1–42.
[62] V. W. Rosen, Mechanics of composite strengthening, Fiber Composite MaterialsAmerican Society of Metals, Metals Park, Ohio (1965) 37–75.
[63] H. Schuerch, Prediction of compressive strength in uniaxial boron fiber-metalmatrix composite materials, AIAA Journal 4 (1) (1966) 102–106.
[64] L. B. Greszczuk, Microbuckling of unidirectional composites, Tech. Rep. AirForce Materials Laboratory Technical Report, OHAFML-TR-71-231, Wright-Patterson Air Force Base, OH (1972).
[65] L. B. Greszczuk, Failure mechanics of composites subjected to compressiveloading, Tech. Rep. Air Force Materials Laboratory Technical Report, AFML-TR-72-107, Wright-Patterson Air Force Base, OH (1972).
[66] L. B. Greszczuk, Microbuckling of lamina reinforced composites, in: Compositematerials: Testing and Design (Third Conference), ASTM STP 546, AmericanSociety for Testing and Materials, Philadelphia, 1974, pp. 5–29.
[67] L. B. Greszczuk, Microbuckling failure of circular fiber-reinforced composites,AIAA Journal 13 (10) (1975) 1311–1318.
[68] J. R. Lager, R. R. June, Compressive strength of boron-epoxy composites,Journal of Composite Materials 3 (1969) 48–56.
[69] M. E. de Ferran, B. Harris, Compression strength of polyester resin reinforcedwith steel wires, Journal of Composite Materials 4 (1970) 62–72.
[70] D. Purslow, R. T. Potter, The effect of environment on the compression strengthof notched CFRP / a fractografic investigation, Composites 15 (2) (1984) 112–120.
[71] A. M. Waas, C. D. J. Babcock, W. G. Knauss, An experimental study ofcompression failure of fibrous laminated composites in the presence of stressgradients, International Journal of Solids and Structures 26 (9-10) (1990) 1071–1098.
[72] J. G. Davis Jr, Compressive strength of fiber-reinforced composite materials,in: Composite Reliability, ASTM STP 580, Americal Society for Testing andMaterials, Philadelphia, 1975, pp. 364–377.
51
[73] M. J. Shuart, Failure of compression-loaded multidirectional compositelaminates, AIAA Journal 27 (1989) 1274–1279.
[74] M. J. Shuart, Short-wavelength buckling and shear failures for compression-loaded composite laminates, Tech. Rep. NASA Technical Memorandum, TM-87640, NASA (1985).
[75] J. C. Grandidier, M. Potier-Ferry, Microbuckling and homogenization for longfiber composites, Zeitschrift fur Angewandte Mathematik und Mechanik 71 (4)(1991) T371–T374.
[76] A. Agah-Tehrani, S. Gunawardena, Micro- and macrobifurcation of fibrousmetal-matrix composites under uniaxial compression, Journal of the Mechanicsand Physics of Solids 39 (1991) 1073–1103.
[77] S. R. Swanson, A micro-mechanical model for in-situ compression strength offiber composite laminates, Transactions of the American Society of MechanicalEngineers. Series H, Journal of Engineering Materials and Technology 114(1992) 8–12.
[78] I. G. Tadjbakhsh, Y. M. Wang, Fiber buckling in three-dimensional periodic-array composites, International Journal of Solids and Structures 29 (1992) 3169–3183.
[79] C. R. Chaplin, Compressive fracture in unidirectional glass-reinforced plastics,Journal of Materials Science 12 (1977) 347–352.
[80] R. R. Effendi, J. J. Barrau, D. Guedra-Degeorges, Failure mechanism analysisunder compression loading of unidirectional carbon/epoxy composites usingmicromechanical modelling, Composite Structures 31 (2) (1995) 87–98.
[81] H. T. Hahn, M. M. Sohi, Buckling of a fiber bundle embedded in epoxy,Composites Science and Technology 27 (1986) 25–41.
[82] M. R. Piggott, B. Harris, Compression strength of carbon, glass and kevlar-49fibre reinforced polyester resins, Journal of Materials Science 15 (1980) 2523–2538.
[83] M. R. Piggott, A theoretical framework for the compressive properties of alignedfibre composites, Journal of Materials Science 16 (1981) 2837–2845.
[84] B. Budiansky, Micromechanics, Computers and Structures 16 (1983) 3–12.
[85] B. Budiansky, N. A. Fleck, Compressive failure of fibre composites, Journal ofthe Mechanics and Physics of Solids 41 (1) (1993) 183–211.
[86] P. D. Soden, M. J. Hinton, A. S. Kaddour, Biaxial test results forstrength and deformation of a range of e-glass and carbon fibre reinforcedcomposite laminates: Failure exercise benchmark data, Composites Science andTechnology 62 (2002) 1489–1514.
[87] S. R. Swanson, M. J. Messick, Z. Tian, Failure of Carbon/Epoxy lamina undercombined stress, Journal of Composite Materials 21 (1987) 619–630.
52
[88] A. M. Waas, C. R. Schultheisz, Compressive failure of composites, part II:experimental studies, Progress in Aerospace Sciences 32 (1996) 43–78.
[89] A. S. Wronsky, T. V. Parry, Compressive failure and kinking in uniaxiallyaligned glass-resin composite under superposed hydrostatic pressure, Journalof Materials Science 17 (1982) 3656–3662.
[90] T. V. Parry, A. S. Wronsky, Kinking and compressive failure in uniaxiallyaligned carbon fibre composite tested under superposed hydrostatic pressure,Journal of Materials Science 17 (1982) 893–900.
[91] ASTM Standard D3518/D3518M(2001), Standard test method for in-planeshear reponse of polymer matrix composite materials by tensile test of a +/-45laminate (2001).
[92] R. S. Rivlin, A. G. Thomas, Rupture of rubber. I. Characteristic energy fortearing, Journal of Polymer Science 10 (1953) 291–318.
53
Appendix - Pragmatic solution for the critical energy release ratesfor non-linear shear behaviour
Introduction
Consider a generic solid made of a linear elastic material with an initial crack—Fig. 23(a). Let the crack grow by an area ∂A. The energy absorbed by thesolid to create the surface of area ∂A is ∂Ws. Neglecting thermal effects, energybalance requires ∂Ws to be equal to the energy transferred to the body throughexternal work, ∂F , minus the change in strain energy ∂U of the body, i.e.,
∂Ws = ∂F − ∂U. (112)
By definition of energy release rate G, it follows that
G =∂Ws
∂A=
∂F − ∂U
∂A= −∂Π
∂A(113)
where Π is the potential energy defined as Π = U − F .
Considering the diagram in Fig. 23(b), it can be concluded that
∂U =1
2(P + ∂P ) (∆ + ∂∆)− 1
2P∆ (114)
and
2a
∂∆
∂P
P
∆
(i )
(i i )
P
P ( a ) ( b )
Fig. 23. (a) Generic cracked body being loaded; (b) load displacement curve corre-sponding to a crack length 2a (i) and 2 (a + ∂a) (ii)
54
∂F = P∂∆ +1
2∂P∂∆ =
(P +
∂P
2
)∂∆ (115)
Thus,
∂ (F − U) =1
2(P∂∆−∆∂P ) (116)
and the critical energy release rate is expressed as
G =1
2
(P
∂∆
∂A− ∂P
∂A
)=
1
2b
(P
∂∆
∂a− ∂P
∂a
)(117)
where b is the thickness of the solid and a is the crack length. Defining thecompliance C of the cracked body as
C =∆
P(118)
it follows that∂∆ = P∂C + C∂P (119)
and, designating the load at onset of crack propagation as Pc, the criticalenergy release rate is
Gc =P 2
c
2b
∂C
∂a. (120)
Non-linear in-plane shear behaviour
Considering the energy release rate given by Eq. (113), but carrying the differ-entiation at constant displacement of the load application-points, hence withno work done by the external forces, it follows, at onset of crack propagation,
−(
∂U
∂A
)= Gc. (121)
Following the approach first proposed by Rivlin and Thomas [92], the assump-tion is made that the presence of a crack in a body will reduce the strain-energydensity to zero over a well-defined volume V , and will not affect it outside thatarea. Let the uniform strain density of the uncracked body be
Wo =∫ εij
0σijdεij (122)
and for the particular case of pure in-plane shear loading
Wo =∫ γ12
0τ12dγ12. (123)
55
The loss in strain energy due to the presence of the crack is
− (U − Uo) = WoV =1
2χ (γ12) V (124)
whereχ (γu
12) = 2∫ γ12
0τ12dγ12 (125)
and Uo is the strain energy of the body for the situation without a crack. Thecritical energy release rate is
GIIc =1
2χ (γu
12)∂V
∂A. (126)
Consider first the situation where the elliptical crack grows in the transversaldirection. The area of the crack is proportional to aoaL and thus
∂A ∝ aL∂ao. (127)
The volume where the strain energy density is reduced to zero due to the crackcan be assumed to be proportional to a2
oaL and thus
∂V ∝ aoaL∂ao. (128)
It follows from Eqs. 127 and 128 that
∂V
∂A∝ ao. (129)
In order to recast Dvorak and Laws’s solution for linear elastic materials [9],the constant of proportionality in Eq. 129 has to be π. Thus, the expressionfor GIIc(T ) results:
GIIc(T ) =πao
2χ (γu
12) . (130)
Proceeding in the same way for propagation in the longitudinal direction, thefollowing expression results:
GIIc(L) =πao
4χ (γu
12) . (131)
56
Appendix - Summary of LaRC04 failure criteria
The LaRC04 criteria is summarized in Table 6. The required unidirectionalmaterial properties for the criteria are: E11, E22, G12, ν12, XT , XC , Y T , Y C ,SL, GIc, GIIc. The following optional properties may be provided: ηL, αo. Theexpressions needed to obtain the parameters used in in Table 6 are given infollowing sub-sections.
Expressions for matrix tensile failure
The in-situ strength values for thick embedded plies are
Y Tis = 1.12
√2Y T and
γu12pis = χ−1 [2χ (γu
12)] .(132)
The in-situ strengths for thin embedded plies are:
Y Tis =
√8GIc
πtΛo22
γu12pis = χ−1
(8GIIc
πt
)where Λo
22 = 2
(1
E22
− ν221
E11
). (133)
The toughness ratio g is obtained from fracture mechanics test data or fromthe unidirectional properties. For a thin embedded ply,
g =GIc
GIIc
, (134)
otherwise, g can be obtain from either of the following expressions:
g = 1.122Λo
22
(Y T
)2
χ (γu12)
. (135)
57
Tab
le6
Sum
mar
yof
the
LaR
C04
crit
eria
MA
TR
IXFA
ILU
RE
Mat
rix
tensi
lefa
ilure
σ22≥
0M
atri
xco
mpre
ssiv
efa
ilure
σ22
<0
LaR
C#
1σ
11
<−Y
CLaR
C#
5σ
11≥−Y
CLaR
C#
2
FI M
=(1−
g)
σ2
YT is
+g
(σ
2
YT is
) 2+
+Λ
o 23τ
2 23+
χ(γ
12)
χ( γ
u 12pis
)F
I M=
(τ
Tm
ST−
ηTσ
m n
) 2+
(τ
Lm
SL is−
ηLσ
m n
) 2F
I M=
(τ
T
ST−
ηTσ
n
) 2+
(τ
L
SL is−
ηLσ
n
) 2
FIB
ER
FAIL
UR
E
Fib
erte
nsi
lefa
ilure
σ11≥
0Fib
erco
mpre
ssiv
efa
ilure
σ11
<0
LaR
C#
3σ
2m
2m
<0
LaR
C#
4σ
2m
2m≥
0LaR
C#
6
FI F
=σ
11
XT
FI F
=(
τ 1m
2m
SL is−
ηLσ
2m
2m
) 2F
I M/F
=(1−
g)σ
2m
2m
YT is
+g
( σ2
m2
m
YT is
) 2+
+Λ
o 23τ
2 2m
3ψ
+χ
(γ1
m2
m)
χ( γ
u 12pis
)
58
Expressions for matrix compressive failure
The fracture angle for pure transverse compression can be considered as αo =53◦ if no experimental value is available. The friction parameter ηT is obtainedfrom
tan(2αo) = − 1
ηT, (136)
the transverse strength ST is defined as
ST = Y C cos (αo)
(sin (αo) +
cos (αo)
tan (2αo)
)(137)
and, in the absence of experimental data to obtain ηL, this is defined from therelation
ηL
SLis
=ηT
ST. (138)
The stresses in the potential fracture planes (in the interval α ∈ [0, π[) areobtained with
σn =σ22 + σ33
2+
σ22 − σ33
2cos (2α) + τ23 sin (2α)
τT =σ22 + σ33
2− σ22 − σ33
2sin (2α) + τ23 cos (2α)
τL = τ12 cos (α) + τ31 sin (α) .
(139)
Expressions for fiber kinking and for biaxial compressive failure
For the determination of γc1m2m , ϕo and ϕc, a two steps solution is required,
since kinking can be promoted by instability or matrix failure 5 . The solutionfor instability results from solving the following system for ϕo and γc
1m2m
fCL(γc1m2m) = −XC
2sin [2 (ϕo + γc
1m2m)]
∂fCL(γ1m2m )
∂γ1m2m
∣∣∣∣γc1m2m
= −XC cos [2 (ϕo + γc1m2m)]
(140)
and ϕc follows as ϕc = ϕo + γc1m2m . If this solution is verified with FM < 1
(in LaRC04 #2, Eq. (81) or from Table 6), then the instability solution mustbe considered; otherwise the matrix compressive failure solution is considered,and ϕc, γc
1m2m and ϕo are defined as follows:
5 For a linear material, there is no need to check for the instability solution
59
ϕc = arctan
1−√
1− 4(
SL
XC + ηL)
SL
XC
2(
SL
XC + ηL)
(141)
γc1m2m = f−1
CL
(1
2sin (2ϕc) XC
)(142)
where fCL is the in-plane shear constitutive shear law. For a linear behaviourit simplifies to
γc1m2m =
ϕcXC
G12
. (143)
Either way, the initial misalignment angle comes then as
ϕo = ϕc − γc1m2m . (144)
The plane where kinking takes place is defined by
tan (2ψ) =2τ23
σ22 − σ33
(145)
and the stresses rotated to that plane are
σ2ψ2ψ =σ22 + σ33
2+
σ22 − σ33
2cos (2ψ) + τ23 sin (2ψ)
σ3ψ3ψ = σ22 + σ33 − σ2ψ2ψ
τ12ψ = τ12 cos (ψ) + τ31 sin (ψ)
τ2ψ3ψ = 0
τ3ψ1 = τ31 cos (ψ)− τ12 sin (ψ) .
(146)
The shear strain in the misalignment frame γu1m2m is obtained by iteratively
(147)which, for a linear shear behaviour and with small angle approximation reducesto
γ1m2m =ϕoG12 + |τ12|
G12 + σ11 − σ22
− ϕo (148)
and the angle ϕ comes as
ϕ =τ12ψ
|τ12ψ | (ϕo + γ1m2m) . (149)
Eq. (147) does not always have a solution, since failure by instability is alsopossible. If, for a specific load state, Eq. (147) does not have a solution (this
60
can be easily checked by plotting the left and right hand side of the equationin a (γ, τ) space), then failure has taken place by instability. The envelope forfailure by instability is defined by the following system:
= − (σ11 − σ2ψ2ψ) cos (2 (ϕo + γ1m2m))− 2 |τ12ψ | sin (2 (ϕo + γ1m2m)) .
(150)
If Eq. (147) has a solution (and thus the material has not failed by insta-bility), matrix failure is checked next. After knowing the orientation of themisalignment frame, the stresses can be rotated to it using
σ1m1m =σ11 + σ2ψ2ψ
2+
σ11 − σ2ψ2ψ
2cos (2ϕ) + τ12ψ sin (2ϕ)
σ2m2m = σ11 + σ2ψ2ψ − σ1m1m
τ1m2m = −σ11 − σ2ψ2ψ
2sin (2ϕ) + τ12ψ cos (2ϕ)
τ2m3ψ = τ2ψ3ψ cos (ϕ)− τ3ψ1 sin (ϕ)
τ3ψ1m = τ3ψ1ψ cos (ϕ) .
(151)
For biaxial compression failure, the rotation to the potential fracture planes(in the interval α ∈ ]0, π[) are obtained with
σmn =
σ2m2m + σ3ψ3ψ
2+
σ2m2m − σ3ψ3ψ
2cos (2α) + τ2m3ψ sin (2α)
τTm = −σ2m2m − σ3ψ3ψ
2sin (2α) + τ2m3ψ cos (2α)
τLm = τ1m2m cos (α) + τ3ψ1m sin (α) .
(152)
For σ2m2m ≥ 0, it is considered that fiber kinking follows matrix failure onlyif σ11 < −XC/2.
61
Appendix - Particularization of the non-linear shear behaviour fora 3rd order polynomial
The LaRC04 criteria presented here accounts for a generic non-linear shear be-haviour. Any expression for non-linear shear can be used, such as a polynomial,a logarithmic, any other best fit to experimental data or the experimental dataitself. This appendix presents the particularization of the criteria for Hahn andTsai’s 3rd order polynomial representation for shear non-linearity [50]:
γ12 =1
G12
τ12 + β (τ12)3 (153)
with β obtained from the shear tests (β = 0 for linear behaviour).
Expressions for matrix tensile failure
The in-plane shear strength of thick embedded plies and thin plies have thesame general form,
SLis =
√√√√√(1 + βφ (G12)
2)1/2 − 1
3βG12
(154)
where the parameter φ is obtained as:
φ =12
(SL
)2
G12
+72
4β
(SL
)4for a thick embedded ply (155)
φ =48GIIc
πtfor a thin ply (156)
A linear shear behaviour is obtained when the constant β tends to zero in Eq.(153)
limβ→0
SLis = lim
β→0
√√√√√(1 + βφ (G12)
2)1/2 − 1
3βG12
=
√φG12
6. (157)
The particular values of the in-situ shear strengths for a linear shear behaviourcan thus be expressed as
SLis =
√2SL for a thick embedded ply (158)
SLis =
√8G12GIIc
πtfor a thin ply (159)
62
Expressions for fiber kinking and for biaxial compression failure
Initial misalignment angle For the determination of γc1m2m , ϕo and ϕc, a
two steps solution is required, since kinking can be promoted by instabilityor matrix failure 6 . The solution for instability results from solving iterativelythe following system for ϕo and τ c
1m2m
τ c1m2m = −XC
2sin
[2
(ϕo + 1
G12τ c1m2m + β (τ c
1m2m)3)]
11
G12+ 3α (τ c
1m2m)2 = −XC cos[2
(ϕo + 1
G12τ c1m2m + β (τ c
1m2m)3)] (160)
and then compute γc1m2m and ϕc as
γc1m2m =
1
G12
τ c1m2m + β (τ c
1m2m)3 (161)
ϕc = γc1m2m + ϕo. (162)
If this solution is verified with FM < 1 (in LaRC04 #2, Eq. (81) or from Table6), then the instability solution must be considered; otherwise the matrixcompressive failure solution is considered, and ϕc is determined from Eq. (141),γc
1m2m comes from
γc1m2m =
1
G12
(1
2sin (2ϕc) XC
)+ β
(1
2sin (2ϕc) XC
)3
(163)
and ϕo = ϕc − γc1m2m .
Current misalignment frame The shear strain in the misalignment frameγ1m2m is obtained by iteratively solving the equation
Eq. (164) does not always have a solution, since failure by instability is alsopossible. If, for a specific load state, Eq. (164) does not have a solution (this canbe easily checked by plotting the left and right hand side of the equation), then
6 For a linear material, there is no need to check for the instability solution
63
failure has taken place by instability. The envelope for failure by instability isdefined by the following system:
τ1m2m = −σ11 − σ2ψ2ψ
2sin
(2
(ϕo + 1
G12τ1m2m + β (τ1m2m)3
))+
+ |τ12ψ | cos(2
(ϕo + 1
G12τ1m2m + α (τ1m2m)3
))
11
G12+ 3β (τ1m2m)2 = − (σ11 − σ2ψ2ψ) cos
(2
(ϕo + 1
G12τ1m2m + β (τ1m2m)3
))−
−2 |τ12ψ | sin(2
(ϕo + 1
G12τ1m2m + β (τ1m2m)3
)).
(166)
64
REPORT DOCUMENTATION PAGE Form ApprovedOMB No. 0704-0188
2. REPORT TYPE
Technical Memorandum 4. TITLE AND SUBTITLE
Failure Models and Criteria for FRP Under In-Plane or Three-Dimensional Stress States Including Shear Non-Linearity
5a. CONTRACT NUMBER
6. AUTHOR(S)
Pinho, Silvestre T.; Davila, Carlos G.; Camanho, Pedro P.; Iannucci, Lorenzo; and Robinson, Paul
7. PERFORMING ORGANIZATION NAME(S) AND ADDRESS(ES)
NASA Langley Research CenterHampton, VA 23681-2199
9. SPONSORING/MONITORING AGENCY NAME(S) AND ADDRESS(ES)
National Aeronautics and Space AdministrationWashington, DC 20546-0001
8. PERFORMING ORGANIZATION REPORT NUMBER
L-19089
10. SPONSOR/MONITOR'S ACRONYM(S)
NASA
13. SUPPLEMENTARY NOTESPinho, Iannucci, and Robinson: Imperial College; Davila: Langley Research Center; Camanho: University of PortoAn electronic version can be found at http://ntrs.nasa.gov
12. DISTRIBUTION/AVAILABILITY STATEMENTUnclassified - UnlimitedSubject Category 39Availability: NASA CASI (301) 621-0390
A set of three-dimensional failure criteria for laminated fiber-reinforced composites, denoted LaRC04, is proposed. The criteria are based on physical models for each failure mode and take into consideration non-linear matrix shear behaviour. The model for matrix compressive failure is based on the Mohr-Coulomb criterion and it predicts the fracture angle. Fiber kinking is triggered by an initial fiber misalignment angle and by the rotation of the fibers during compressive loading. The plane of fiber kinking is predicted by the model. LaRC04 consists of 6 expressions that can be used directly for design purposes. Several applications involving a broad range of load combinations are presented and compared to experimental data and other existing criteria. Predictions using LaRC04 correlate well with the experimental data, arguably better than most existing criteria. The good correlation seems to be attributable to the physical soundness of the underlying failure models.
Prescribed by ANSI Std. Z39.18Standard Form 298 (Rev. 8-98)
3. DATES COVERED (From - To)
5b. GRANT NUMBER
5c. PROGRAM ELEMENT NUMBER
5d. PROJECT NUMBER
5e. TASK NUMBER
5f. WORK UNIT NUMBER
23-064-30-22
11. SPONSOR/MONITOR'S REPORT NUMBER(S)
NASA/TM-2005-213530
16. SECURITY CLASSIFICATION OF:
The public reporting burden for this collection of information is estimated to average 1 hour per response, including the time for reviewing instructions, searching existing data sources, gathering and maintaining the data needed, and completing and reviewing the collection of information. Send comments regarding this burden estimate or any other aspect of this collection of information, including suggestions for reducing this burden, to Department of Defense, Washington Headquarters Services, Directorate for Information Operations and Reports (0704-0188), 1215 Jefferson Davis Highway, Suite 1204, Arlington, VA 22202-4302. Respondents should be aware that notwithstanding any other provision of law, no person shall be subject to any penalty for failing to comply with a collection of information if it does not display a currently valid OMB control number.PLEASE DO NOT RETURN YOUR FORM TO THE ABOVE ADDRESS.


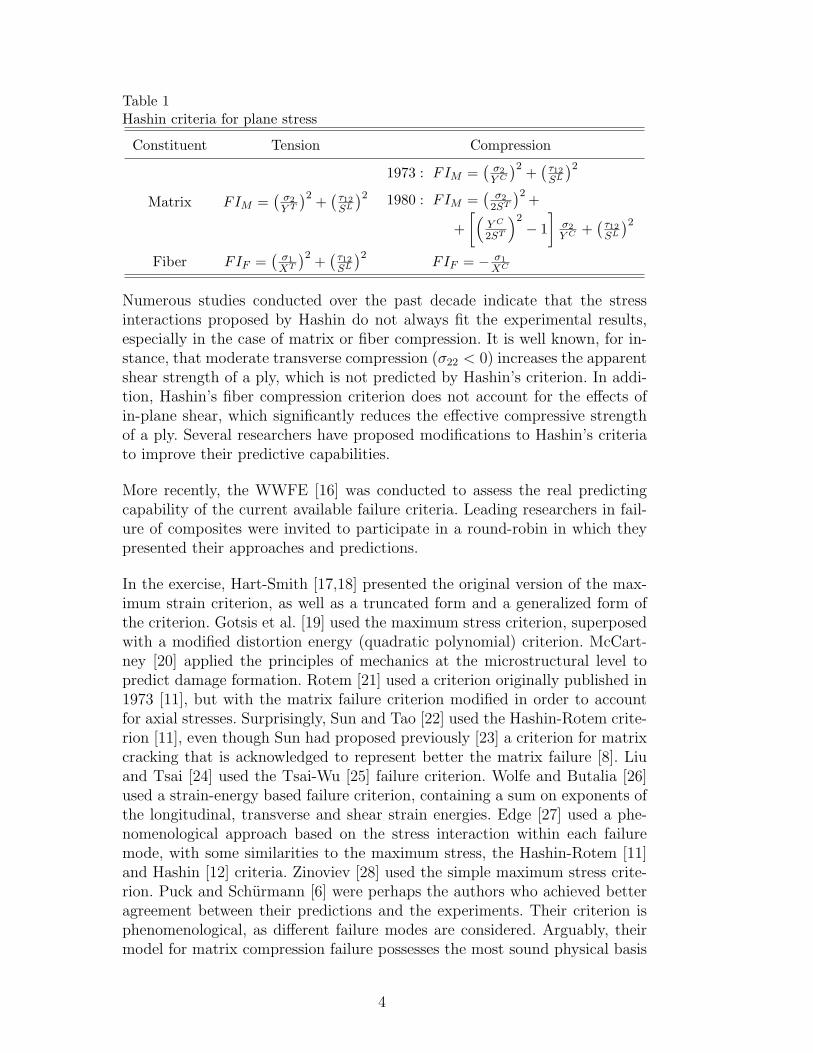


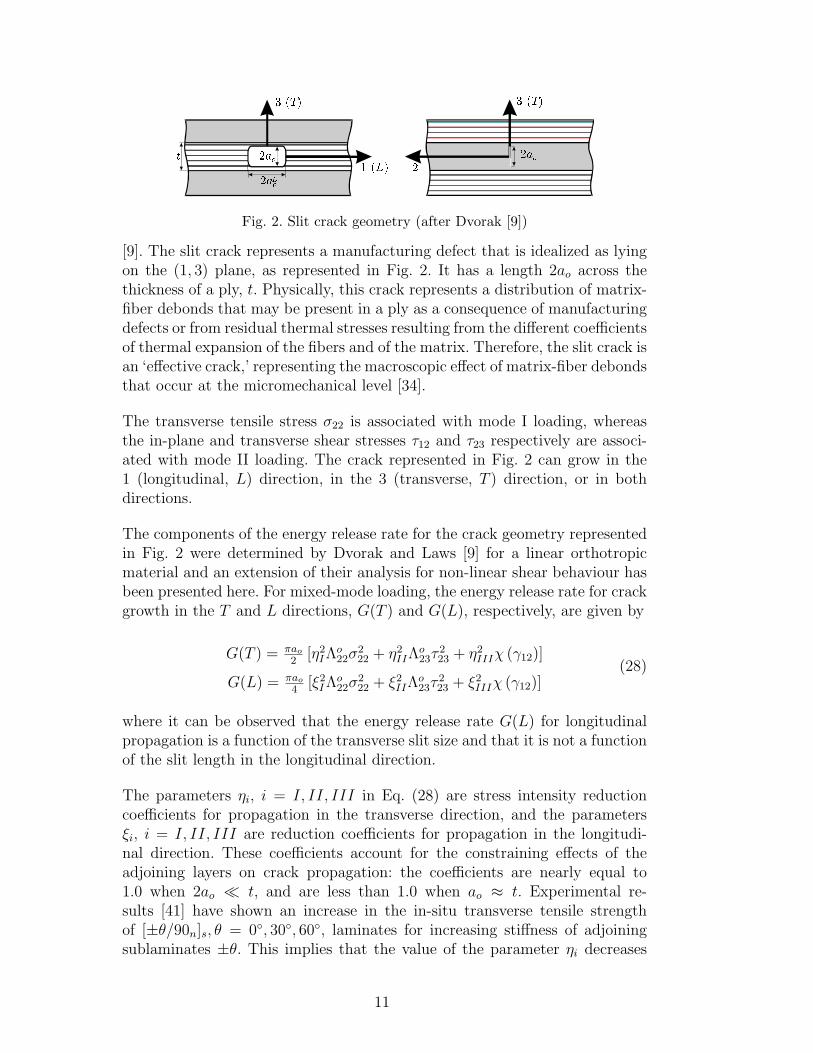

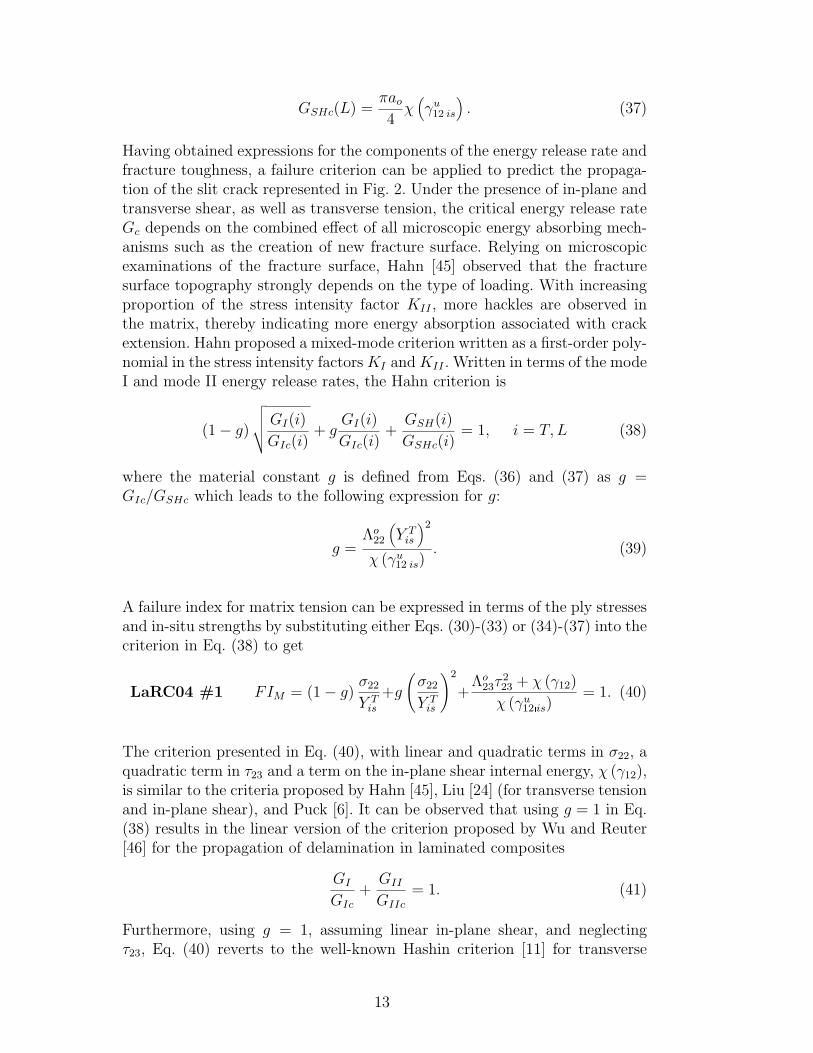
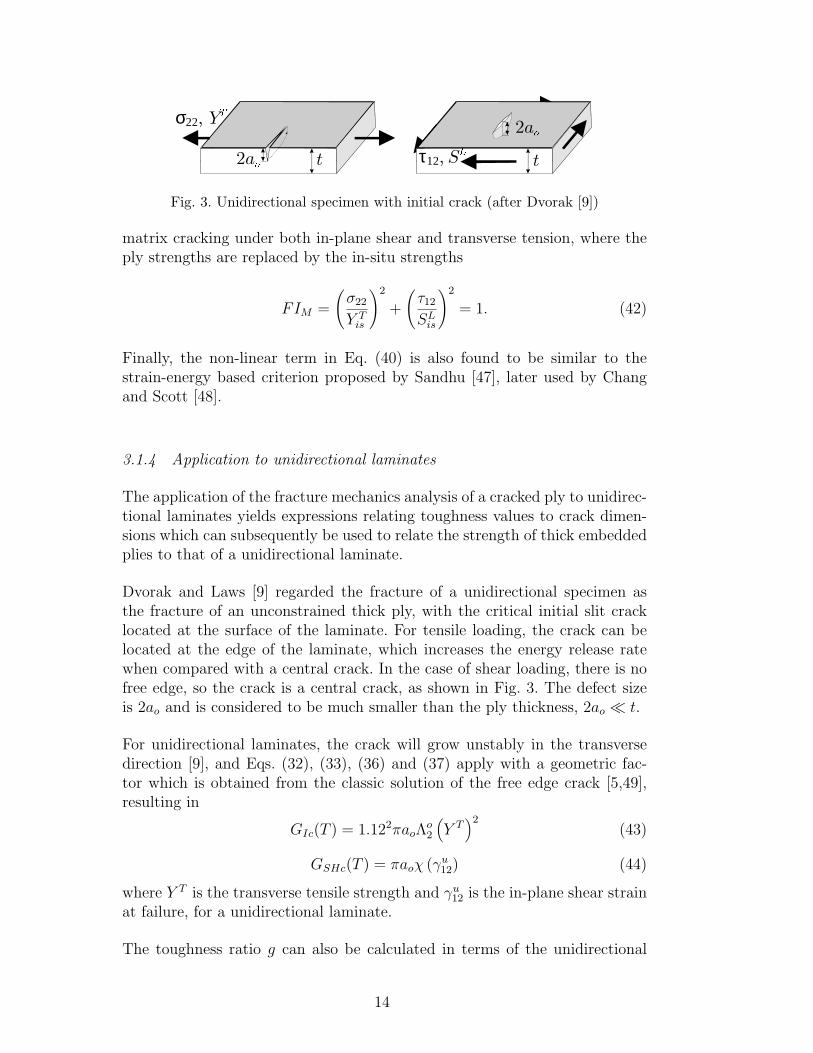
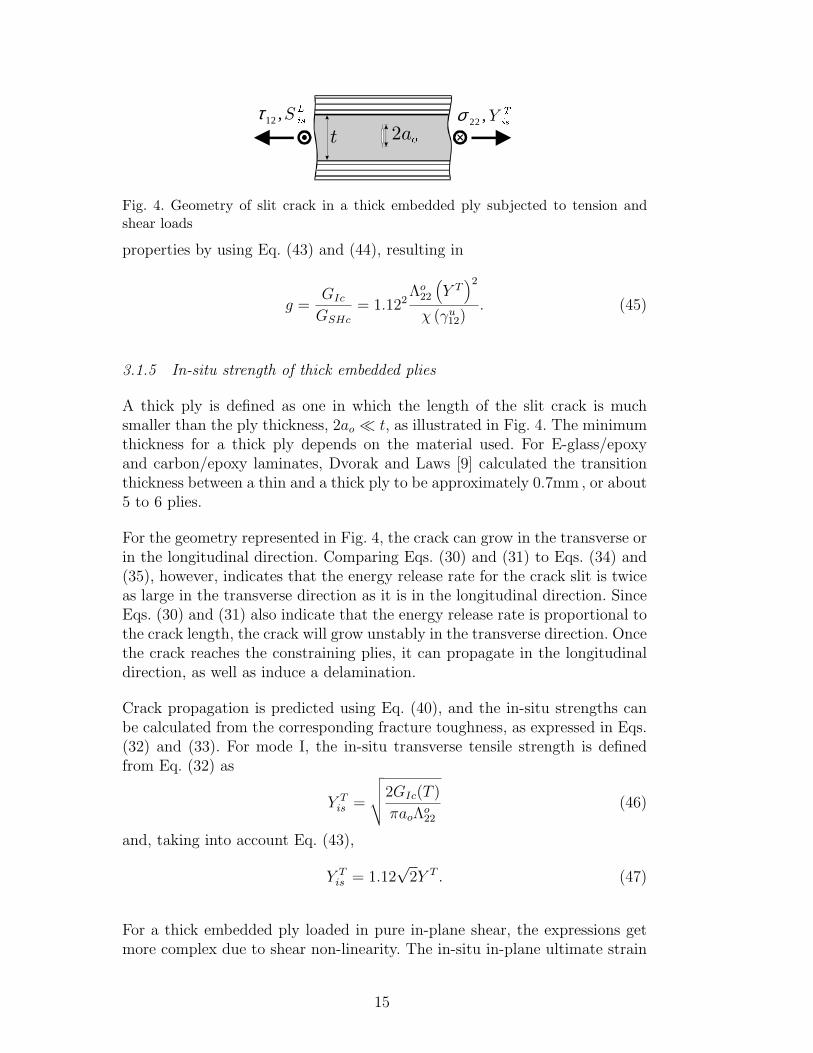


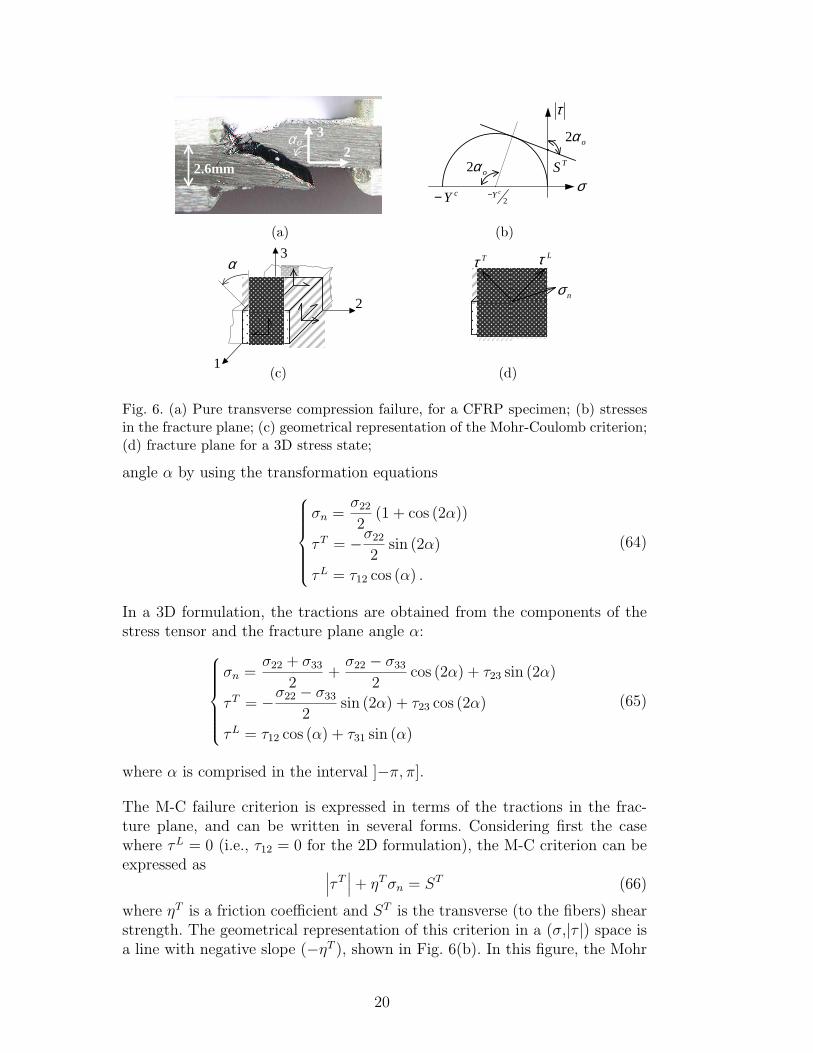


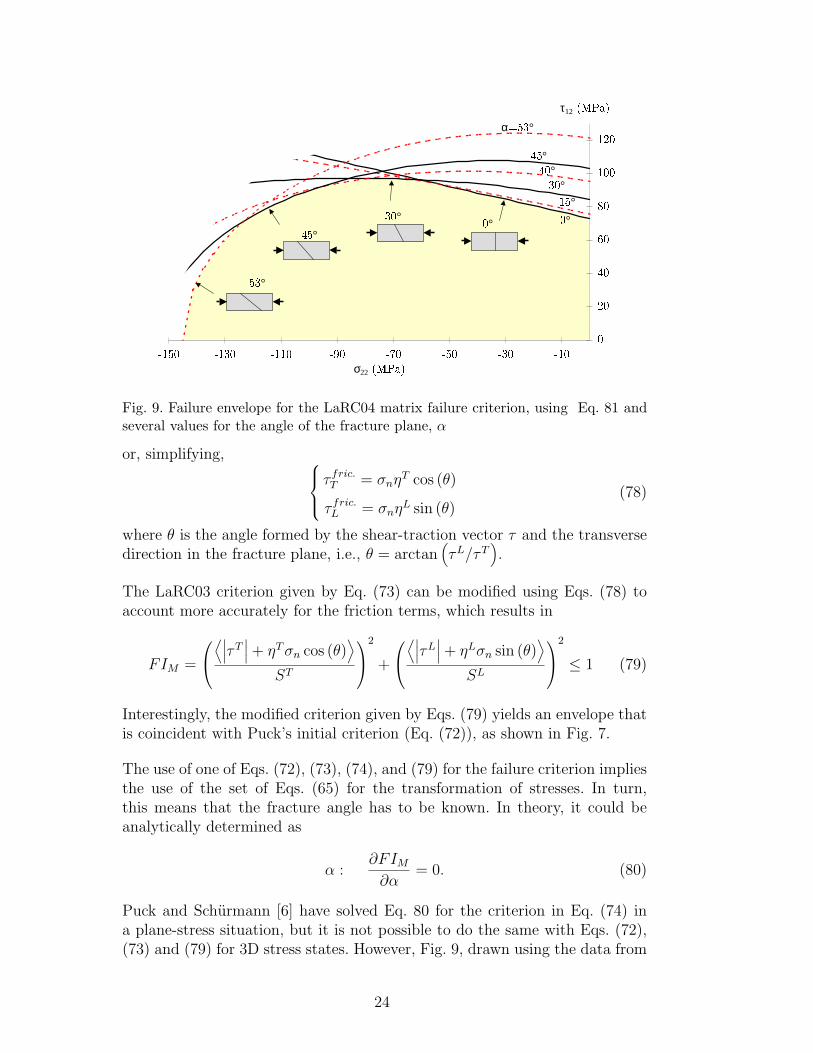


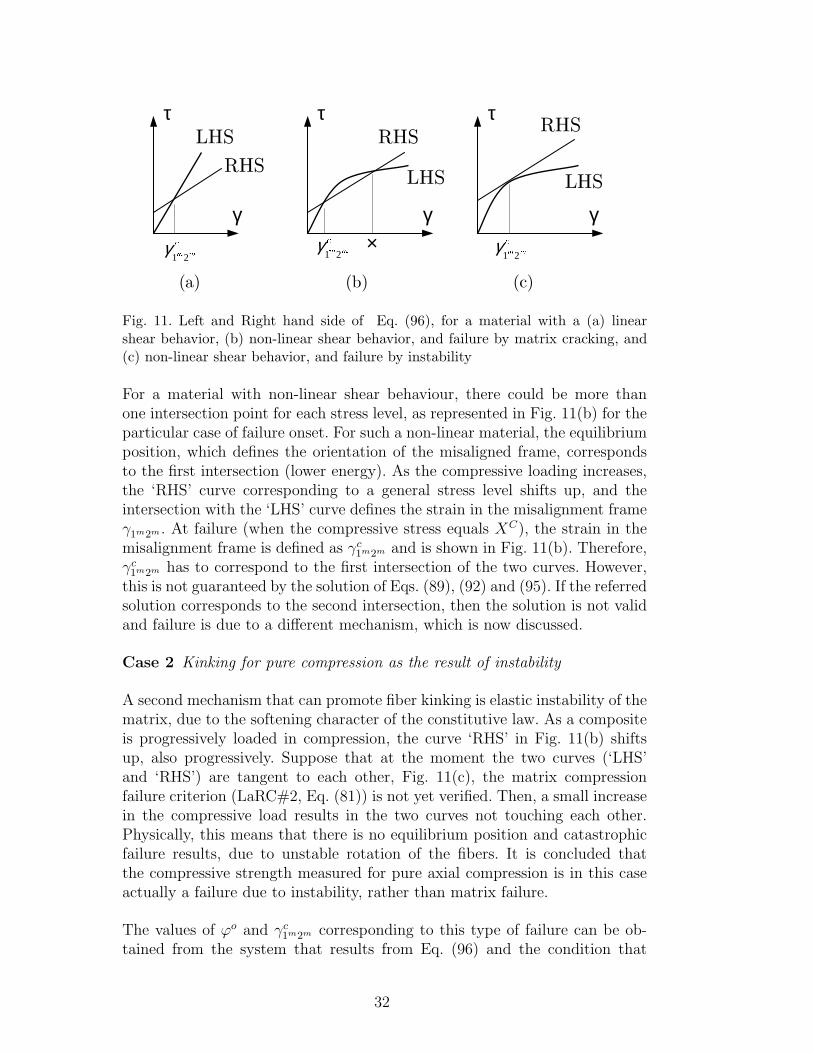
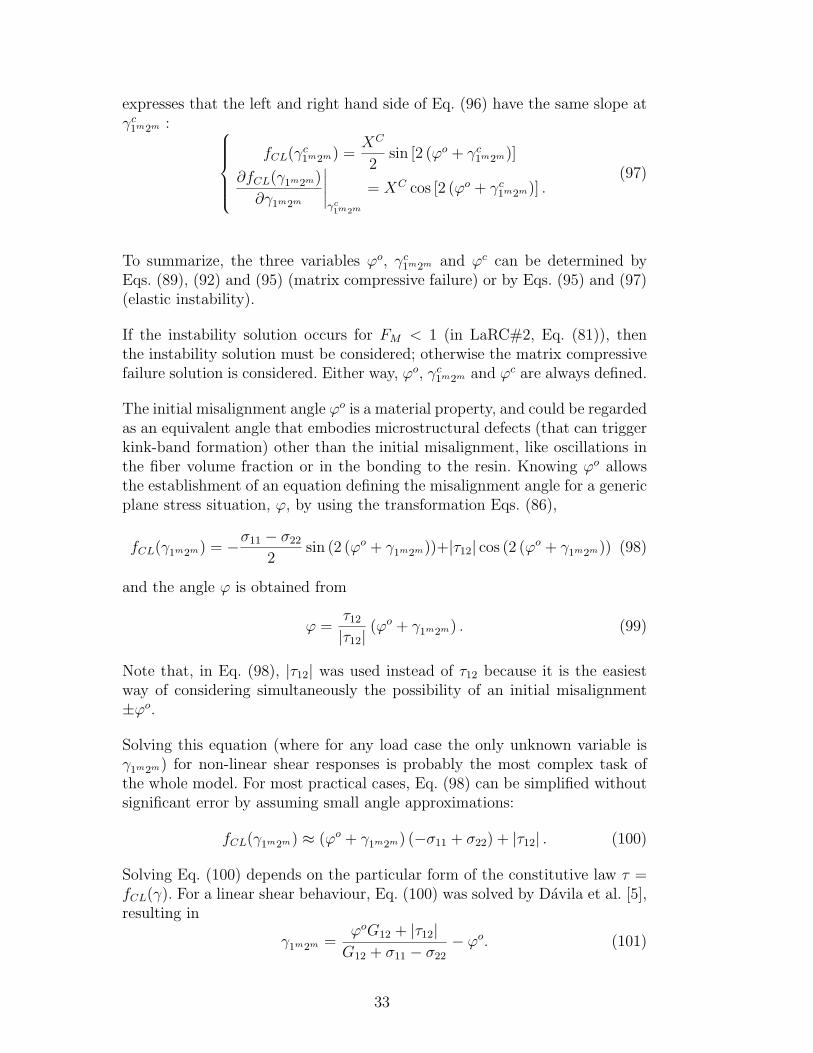
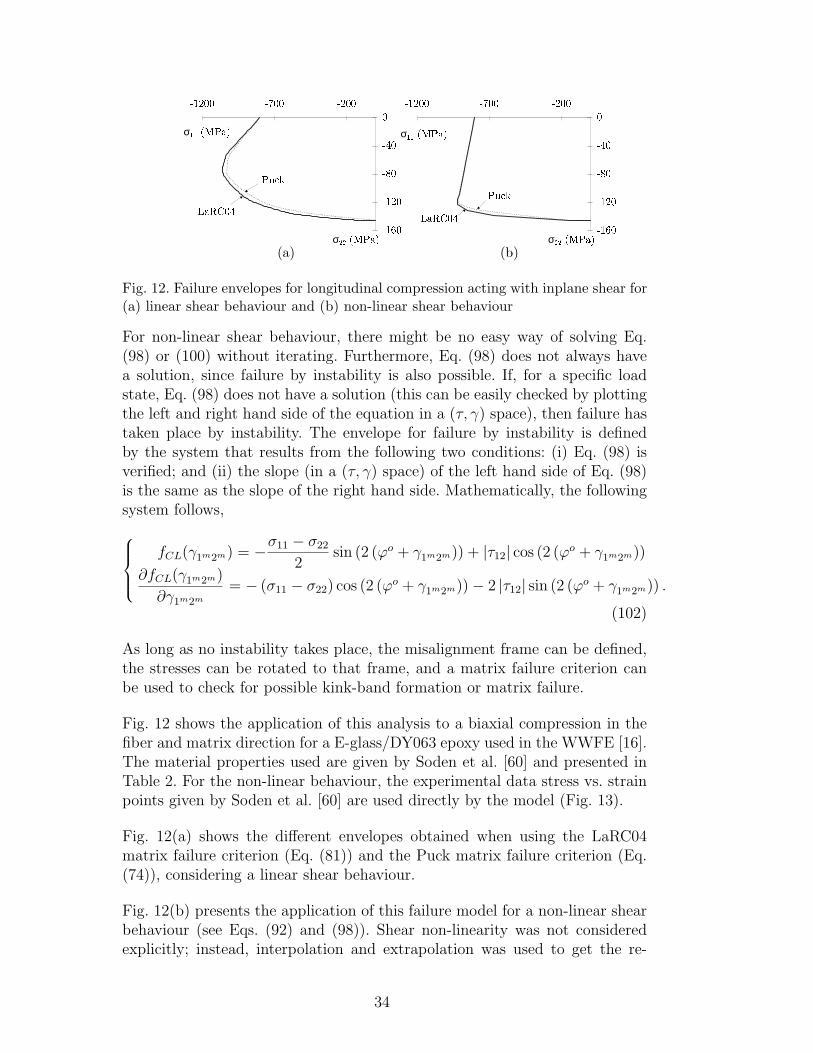
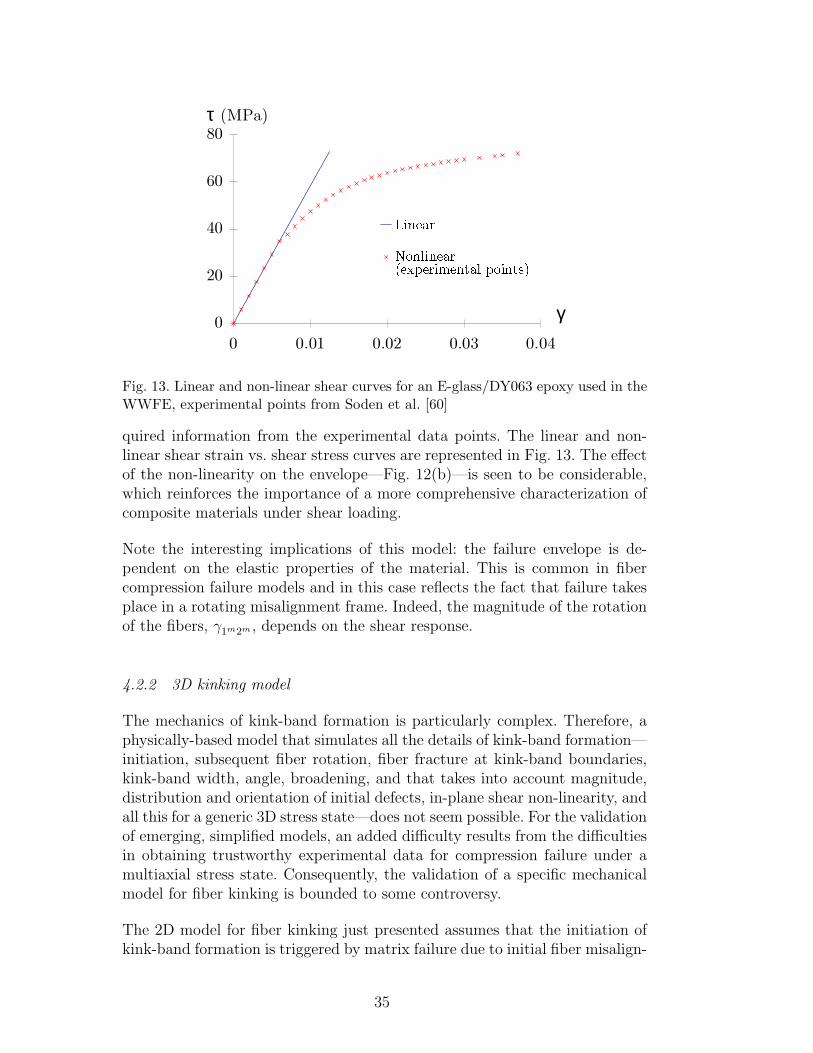


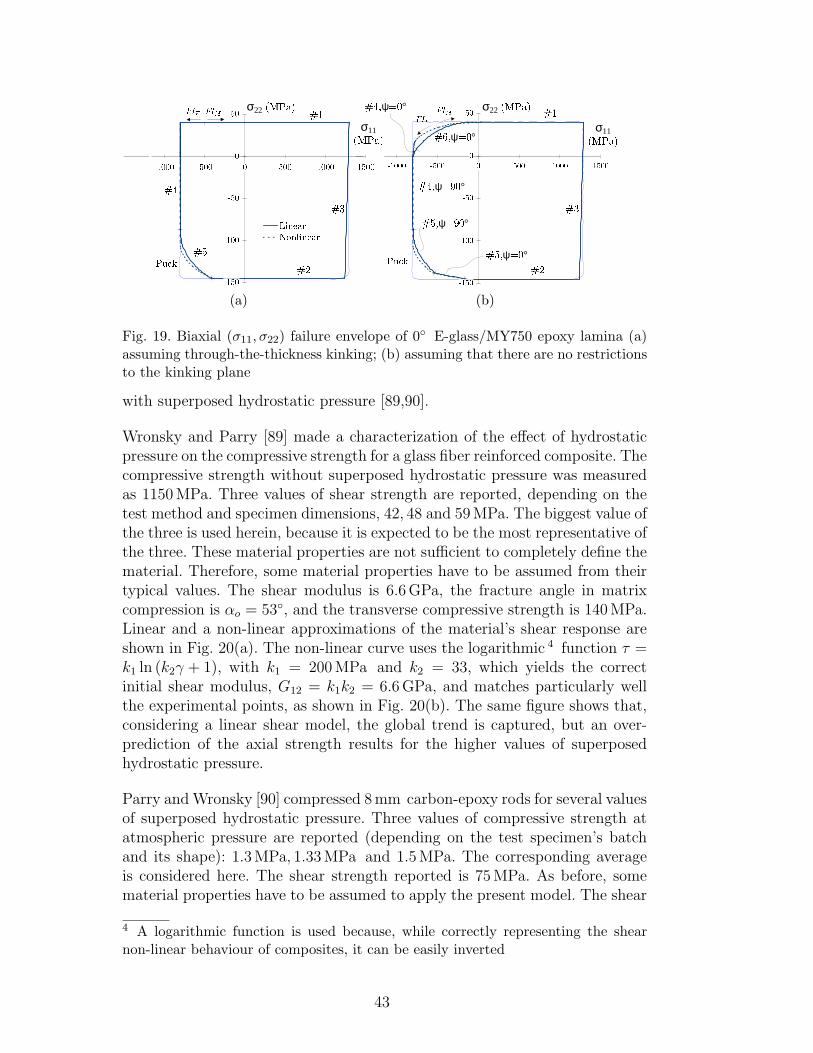


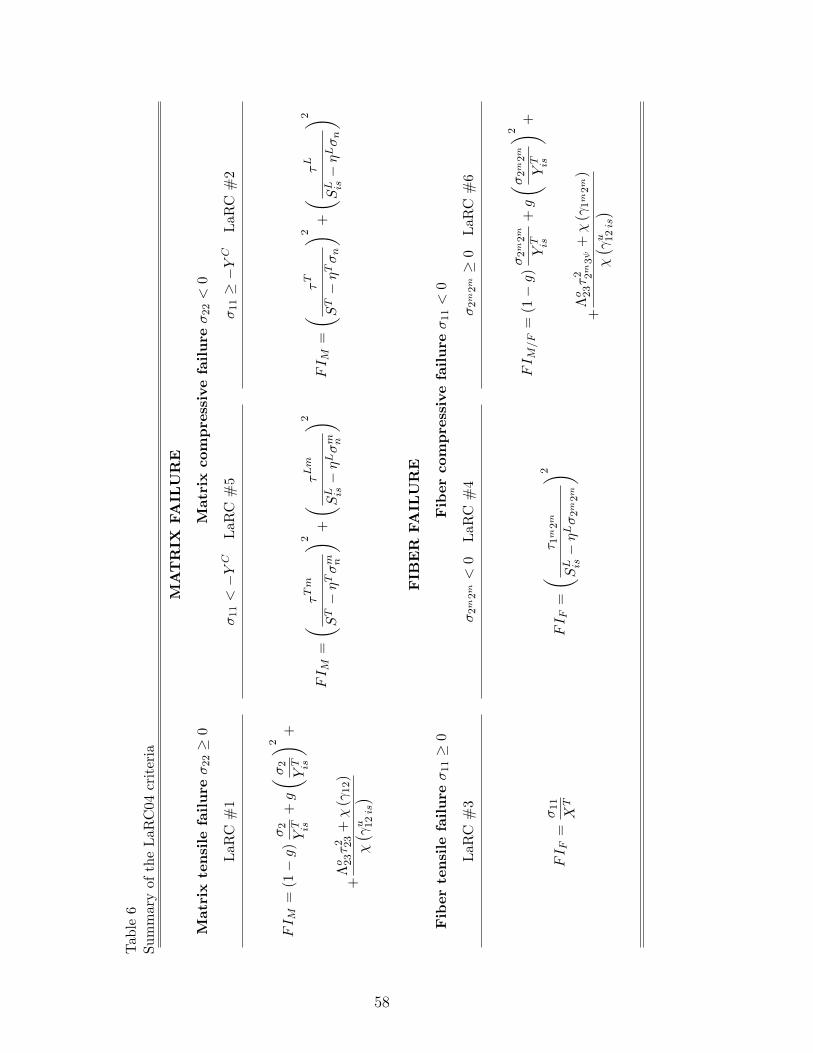
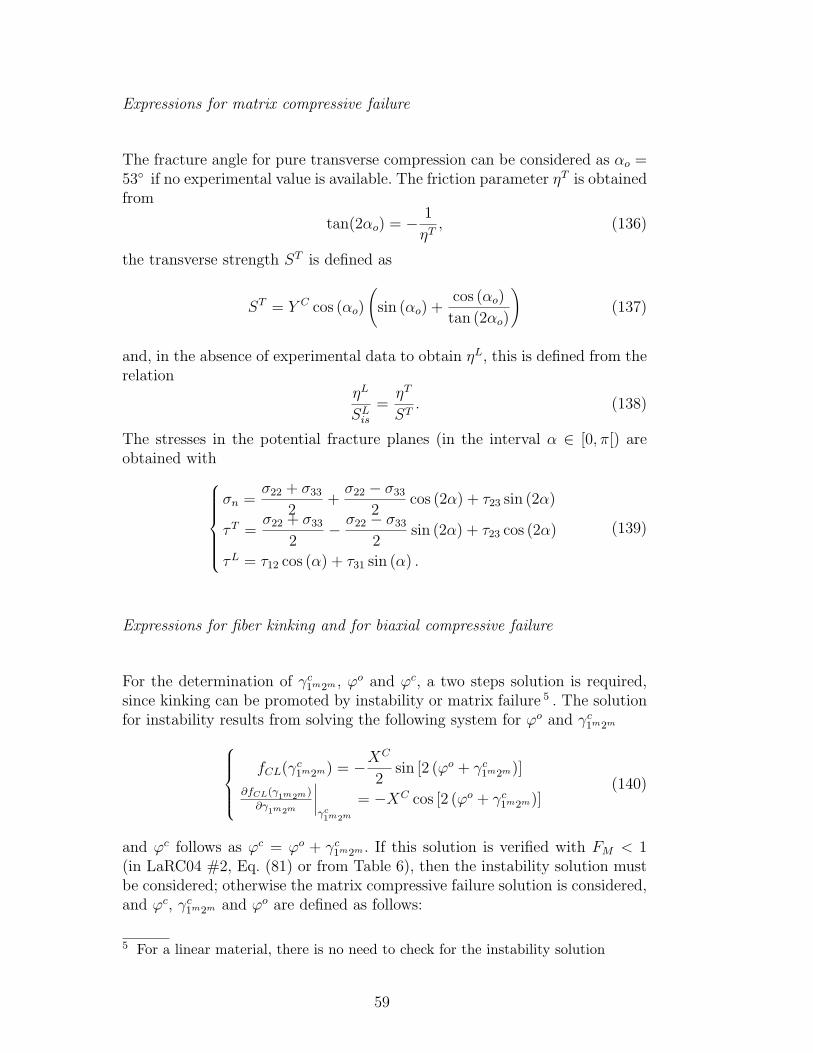
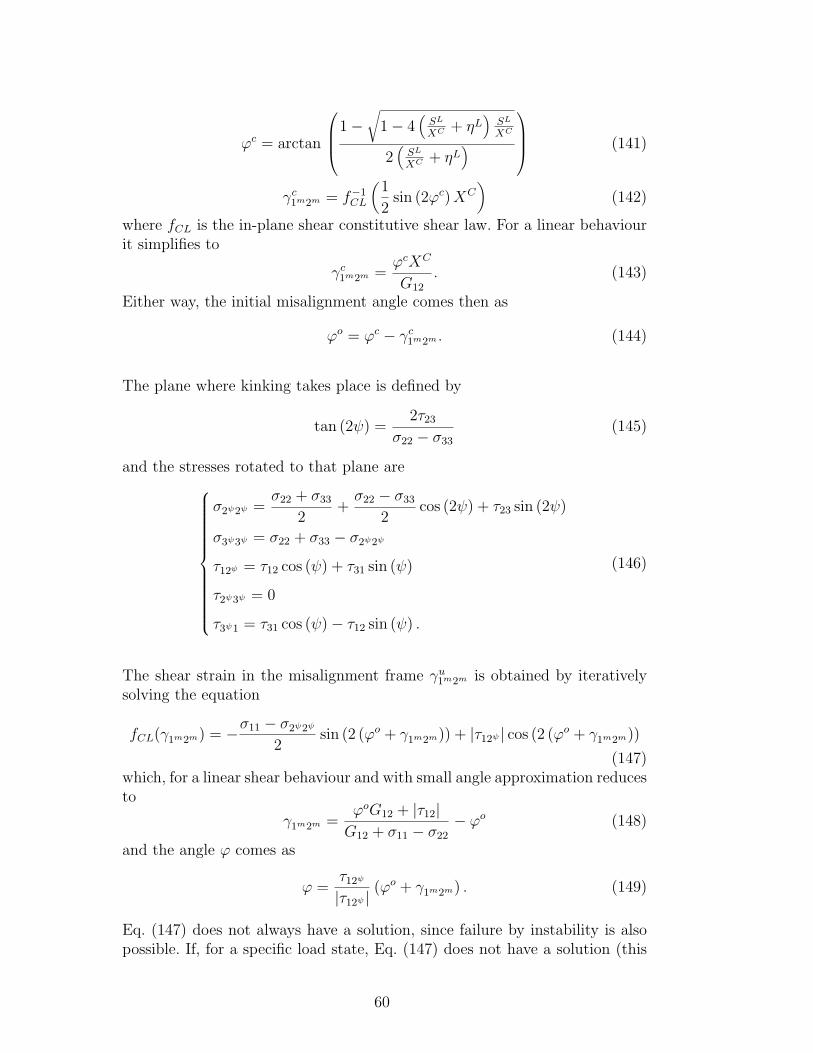
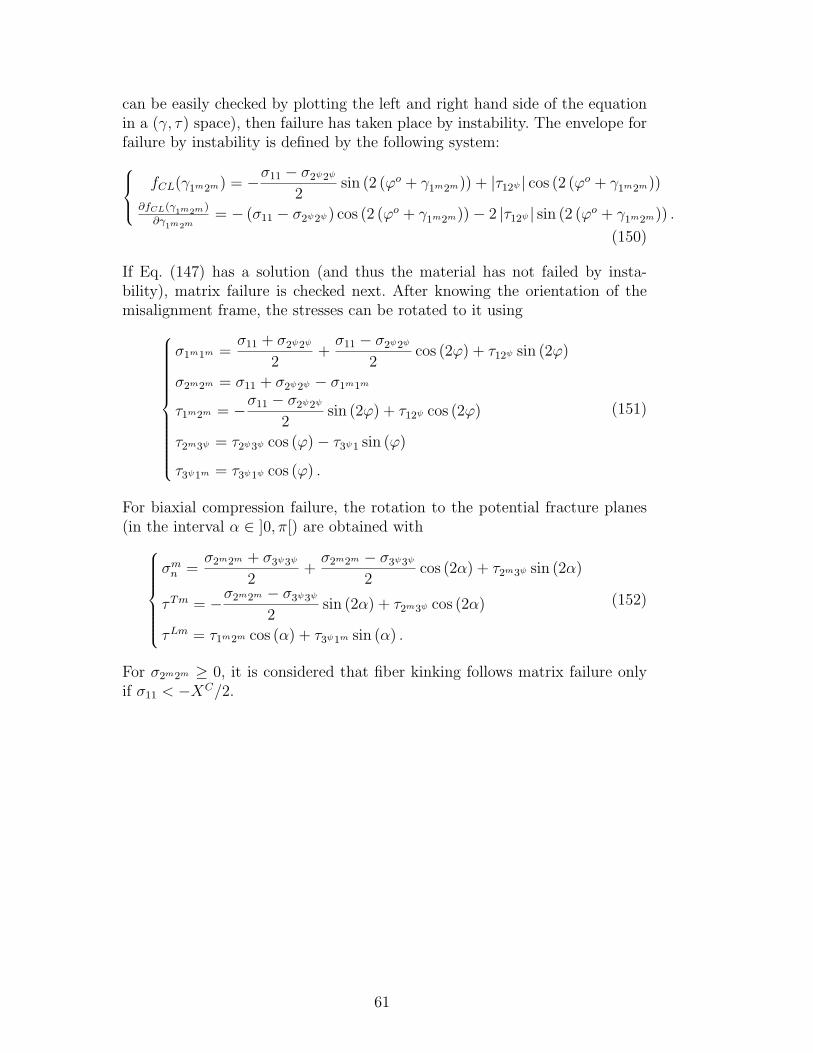
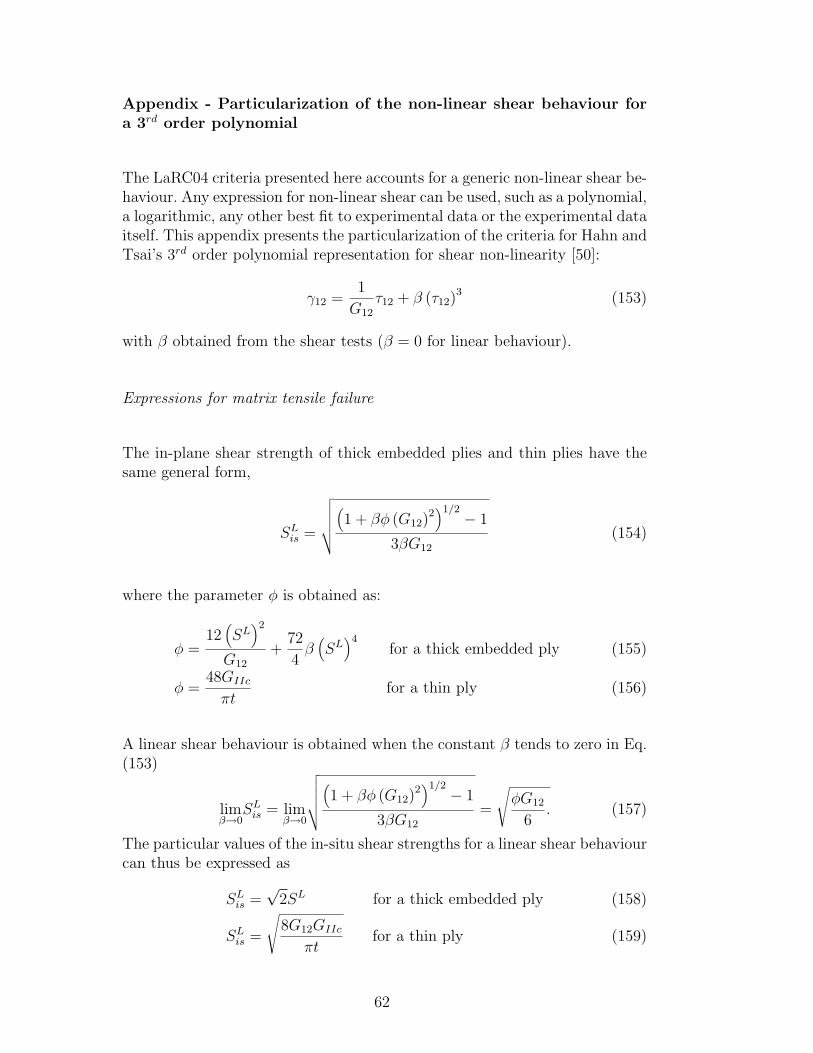


![ZZZ ]LDUDDW FRPislamicblessings.com/upload/KhakeKarbala.pdf · 3uhvhqwhge\zzz ]lduddw frp. 3uhvhqwhge\zzz ]lduddw frp. 3uhvhqwhge\zzz ]lduddw frp](https://static.documents.pub/doc/80x56/600c68f6f68b6b152e28533b/zzz-lduddw-3uhvhqwhgezzz-lduddw-frp-3uhvhqwhgezzz-lduddw-frp-3uhvhqwhgezzz.jpg)
