33
Fairchild Semiconductor International, Inc. October 2005 Investor Presentation

Fairchild SemiconductorInternational, Inc.
October 2005 Investor Presentation

2
Notes on Forward Looking Statements and Non-GAAP Measures
• Comments in this presentation other than statements of historical fact may constitute forward looking statements.
• Forward looking statements are based on Fairchild management’s estimates and projections and are subject to various risks and uncertainties.
• These risks and uncertainties are described in the Company’s periodic reports and other filings with the Securities and Exchange Commission (see the Business Risks section) and are available at http://www.sec.gov and investor.fairchildsemi.com.
• Actual results may differ materially from those projected in the forward looking statements.
• Some data in this presentation may include non-GAAP measures that we believe provide useful information about the operating performance of our businesses that should be considered by investors in conjunction with GAAP measures that we also provide. You can find a reconciliation of non-GAAP to comparable GAAP measures at the Investor Relations section of our web site at http://investor.fairchildsemi.com
Recent additions to our website at http://investor.fairchildsemi.comUpdated Financials (through 2005 Q3, with segment revenue/gross margin breakouts)
• Quarterly Fact Sheet with 2005 Q3 highlights
• This investor presentation

3
Fairchild: A Solid Foundation
• Market share leader in the $15B TAM power semiconductor market
• World-class silicon and packaging processes and capabilities
• MOSFET
• Analog
• Multi-chip packaging
• Global supply chain
• Worldwide customer base with tier 1 customers
• The employee talent to succeed
• Healthy balance sheet
4
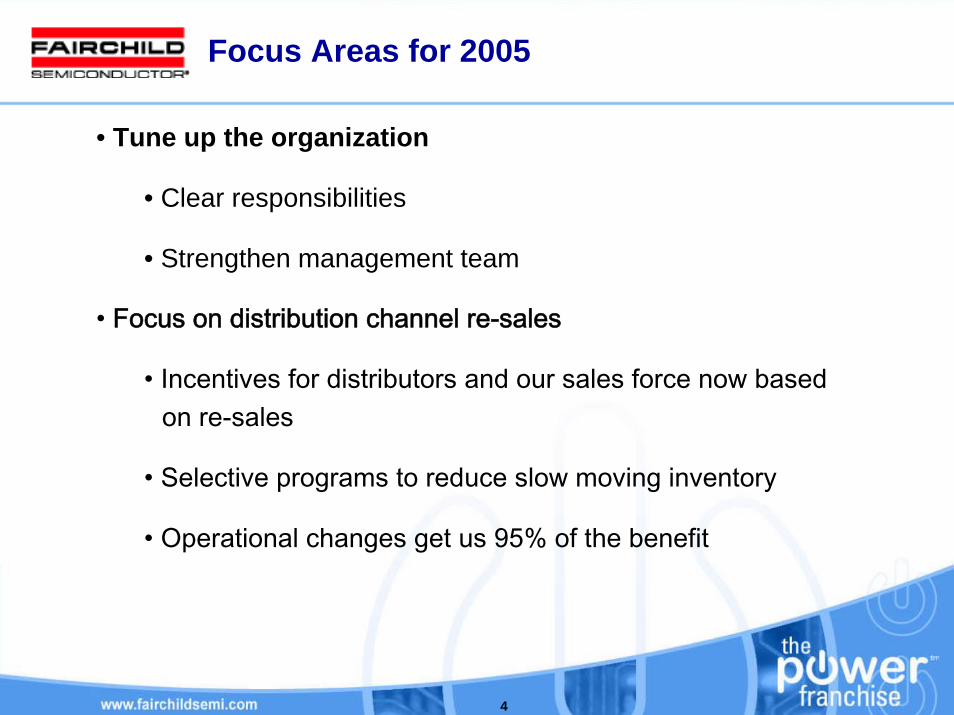
Focus Areas for 2005
• Tune up the organization
• Clear responsibilities
• Strengthen management team
• Focus on distribution channel re-sales
• Incentives for distributors and our sales force now based on re-sales
• Selective programs to reduce slow moving inventory
• Operational changes get us 95% of the benefit
5
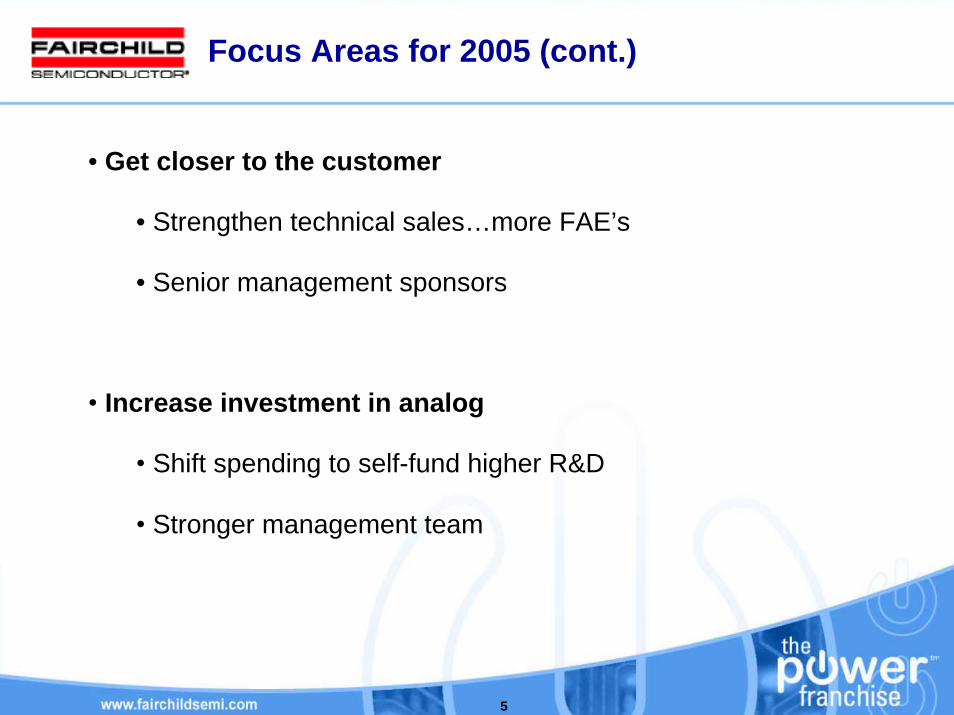
Focus Areas for 2005 (cont.)
• Get closer to the customer
• Strengthen technical sales…more FAE’s
• Senior management sponsors
• Increase investment in analog
• Shift spending to self-fund higher R&D
• Stronger management team

6
Focus Areas for 2005 (cont.)
• Focus on quality of business
• Rationalize product lines…identify products that do not meet our target gross margins
• Discontinue/divest low margin products as appropriate
• Plan for gradual phase out of low margin products as higher margin, new products ramp

www.fairchildsemi.com
Fairchild Overview

8
Colorado Springs, COAnalog Design
Mountaintop, PAWafer Fab
South Portland, MEHeadquarters, WaferFab, North AmericanSales Headquarters
Wootton Bassett, EnglandEurope Sales Headquarters
Penang, MalaysiaAssembly and Test
Bucheon, South KoreaWafer FabKorea Sales Headquarter
Suzhou, ChinaAssembly and Test
Irving, TXCustomer ServiceCenter
Salt Lake City, UTWafer Fab
San Jose, CAAnalog & Discrete Design
Hong KongAsia-Pacific SalesHeadquarters
Tokyo, JapanJapan Sales Headquarters
SingaporeAsia Ops MgmtWafer Fab
Cebu, PhilippinesAssembly and Test
Geographic Footprint Overview
Regional Sales Headquarters,Customer Service Centers
Product Group and Design Centers,Manufacturing Locations
- 2004 sales: $1.6 billion
- 9000 employees worldwide
- 8 production facilities and 5 customer service centers
- 36 direct sales offices in 17 countries

9
Fairchild Semiconductor Overview
Power Analog/Std Linear
Power Discrete
All Other
High Performance Multi-Market Products
Memory
Processing
ASIC/SystemOnChip $29.2B$68.2B
$47.3B
$67.7B
$212.4B Semi TAM 2004
Source: WSTS, January, 2005
Fairchild’s 2004Served Available Market ~ $29.2B
Fairchild Q3 2005 Product Mix
Standard Products
26%
Power Discrete
56%Power Analog
18%

10
Source: Fairchild internal estimates
24%
14%
14%5%
24%
5%14%
: Computing
Industrial:Other
Consumer
Industrial:Power Supplies,
Adaptors
Cellular Handsets, Base StationsCentral Office SwitchesWireless NetworkingRouters/Hubs CD/DVD Players
Game ConsolesTV’s, VCRs, Set Top Boxes
PDA’s, MP3’s, CamerasWhite Goods, Appliances
Flat Panel DisplaysMonitors, CRTs
Desktops NotebooksDisk DrivesPrinters, CopiersMemory Modules
Power SuppliesDC-DC Power Bricks
Power AdaptorsVoltage Regulator Modules
Ignition, Engine ManagementEntertainmentBody ElectronicsNavigation, Safety
Displays
Communications
Auto
Factory AutomationATE, InstrumentationLighting, MedicalMotor Control
2005 Q3 Sales by End Market Segment
11
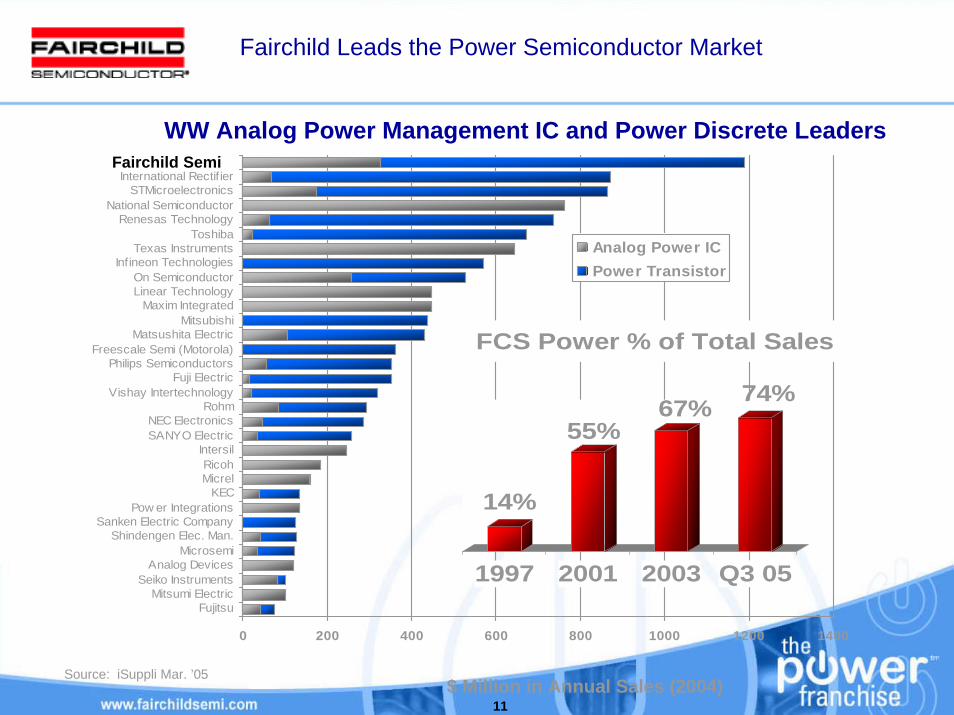
Fairchild Leads the Power Semiconductor Market
WW Analog Power Management IC and Power Discrete Leaders
0 200 400 600 800 1000 1200 1400
FujitsuMitsumi Electric
Seiko InstrumentsAnalog Devices
MicrosemiShindengen Elec. Man.
Sanken Electric CompanyPow er Integrations
KECMicrelRicoh
IntersilSANYO ElectricNEC Electronics
RohmVishay Intertechnology
Fuji ElectricPhilips Semiconductors
Freescale Semi (Motorola)Matsushita Electric
MitsubishiMaxim Integrated
Linear TechnologyOn Semiconductor
Infineon TechnologiesTexas Instruments
ToshibaRenesas Technology
National SemiconductorSTMicroelectronics
International Rectif ier
Analog Power ICPower Transistor
Source: iSuppli Mar. ’05$ Million in Annual Sales (2004)
14%
55%67% 74%
1997 2001 2003 Q3 05
FCS Power % of Total Sales
Fairchild Semi

www.fairchildsemi.com
Increasing the Quality of Business

13
Integrate power functions into single package solutions
Requires competencies in end market applications, power switch & analog control design, and advanced packaging
Degree of integration is also a function of the potential market size
Benefits to Our Customers• Shorter design-in cycle
• Lower system costs
• Less components – higher reliability
• Leverage our power systems expertise
Benefits to Fairchild• Shorter time to market
• Save silicon & packaging costs by optimized product design
• High barrier of entry
• Improves return on our R&D investment
Power Remains a Key Target MarketHigher Levels of Integration Drive Increased Margins

14
Increased Functionality in Power Solutions
Power Applications& System Knowledge
Control ICTechnology
Power DiscreteTechnology
PackagingTechnology
CustomerRelationships
Inputs OutputDecision MakingThought Process
System Partioning
Silicon Technology
Packaging Technology
Cost Tradeoff Analysis
Development Timing
Value Analysis
Application Size& Growth Rates
•Self Contained PowerBuilding BlockFunctions
•Extensible AcrossMarkets and Products
•High Customer Value
•Cost-Effective
•High Volume
Fairchild is One of a Few Power Semiconductor Companies,Worldwide, To Offer this Unique Mix of Capabilities Across
A Broad Range of Markets, Products, and Applications

15
Smart Power Modules (SPM™)
• Line-up : 600V / 1A, 2A, 3A, 5A, 10A, 15A, 20A, 30A • Low Thermal Resistance by Ceramic-based TMT Package• 2500V/1min Isolation and
1500V/1min Isolation • Built-in Thermistor (NTC)• For inverter high-side IGBTs
- Gate driving circuit (HVIC)- Control supply under-voltage
protection• For inverter low-side IGBTs
- Gate driving circuit- Short-circuit protection using sense-IGBTs
using external shunt - Control supply under-voltage protection
• Input interface: 5V/3.3V CMOS/LSTTL compatible • Vector control correspondence due to 3-N terminals
SPM : 60 x 31(mm)
SPM : 44 x 26.8(mm)
SPM : 29 x 12(mm)
Optimized for Motion Control

16
Application: Brushless DC Fan motor controllers for air conditioners and air cleaners
Features: • SPM + Control IC(ASIC) + Hall IC • Low Cost & High Performance, 180° Control • Motion sensors can be eliminated
SPM™ Success – Air Conditioning Fan Drivers
0.5 inch
From 3.5” to 2.5”Motor housing
PCB area reduced by 50% Motor enclosure size reduced by 20%

17
SPM™ Success - Switch Reluctance Motors (SRM) Vacuum Cleaner Drivers
Heat Sink Circuit Bd. SR Motor Built-in InverterSRM
Application: SRM vacuum cleaner controllers
Features: • SPM + micro-controllers• High reliability and high performance• High thermal characteristic, SC, UV protection functions
SRM delivers 50% more vacuum for the same space

18
SPM™ Success - White Goods
Assembling these parts might increase manufacturing time and cause low yields.
Protection circuit using analog components cause time delay and noise.
3-HVICs 1-LVICs
SPM’s built-in HVIC and LVIC with protection
circuit
SPM, which integrates all diverse components, enhances productivity while simplifying manufacturing
6-IGBTs
Fairchild’s SPM simplifies design through an integrated inverter-controlled variable speed driver for 3-phase induction motors, low power brushless dc (BLDC) motors, and switched reluctance motors.
Design Considerations
Manufacturing Impact
Integration of system components

19
Fairchild Green FPS
Green FPS Growth
0%
50%
100%
2003 2004
YoY
Gro
wth
(%)
• Integrated SenseFET and PWM IC Switches that meet low standby power regulations, simplify designs, reduce EMI emissions, and lowers costs

20
Fairchild is Also Committed to Developing Leadership Analog Signal Path Products
Source; iSupply, WSTS
Amplifiers $2.7B
Regulators $5.4B
Data Converters
$2.1B
Interface $2.0B
High Performance Analog $12.2B - 2004
Amplifiers $3.3B
Regulators $11.5B
Data Converters
$3.0B
Interface $2.8B
High Performance Analog $20.6B - 2009
14% CAGR

21
Fairchild Video Filters
• Video filters and drivers with superior integration enabling customers to reduce components count and bill of materials
Video Filter Growth
0%
35%
70%
2003 2004
YoY
Gro
wth
(%)

22
Fairchild Analog Switches
Analog Switch Growth
0%
25%
50%
2003 2004
YoY
Gro
wth
(%)
• Fairchild’s Analog Switches provide the best combination of low resistanceswitching and ultra-small packaging

23
Fairchild LED Drivers
• LED Drivers with high efficiency to maximize battery life in space efficient MLP packaging for ultra-portable applications

24
Fairchild uSerDesTM(micro serializers and deserializers)
• µSerDes™ is a proprietary serialization/ deserialization solution designed for use in portable products
Features:
uSerDes is 1/7 the size, 1/10 active power and 1/4000 standby power, and significantly less EMI than conventional SerDes solutions
Benefits:
uSerDes technology can enable reduction is system size, system cost, and faster Time to Market

www.fairchildsemi.com
Financials

26
Setting a New Direction for the Future Supporting Our Shift to Higher Value Products
• Adjust the business model to support our shift to more complex products
• Focus on internal metrics to measure progress…ROIC, distribution POS measures, margin optimization at the factory level
• Continue to generate strong cash flow to invest in the business, fund acquisitions and further de-lever

27
Gross Margin Improvement Plan
Drive ~30% gross margins at current sell-through revenue levels
• Increase utilization rate as inventories reach target…sell-in = sell-through…400 – 600 bps impact
• Lower capex and D&A expense…eventual 300 – 350 bps impact in Q1 05
Achieve mid-30’s gross margins on >50% fall-through in <24 months
• Reduce capex…lower D&A
• Aggressive margin/mix management
• Closer alignment of distribution sales in to sales out
• Cut infrastructure costs (Operations, IT)
• Sharpen focus on R&D spending
• Increase % of sales from new products
• Increase analog and power % of sales
• Possible divest/exit low margin products

28
Adjusting the Capital Expenditure Model
Leverage last 5 years of investments to reduce capex and D&A for at least the next few years
Capex % of Sales
0.00%
10.00%
20.00%
2000 2001 2002 2003 2004 2005+
6 – 8%

29
Sales Grow at or above the power market
Gross Margin Improving steadily to the mid-30’s & beyond
R&D Shift more spending to analog…gradual increase as percentage of sales
SG&A Shift spending from G&A to Selling...more technical support (FAE’s, design centers, etc.)
Capex Reduce capex to 6 - 8% of sales or lower
Utilization & Lead Times Maintain stable, shorter lead times on higher value focus products
Increasing Product ValueImplications to the Business Model

30
Q3 2005: Turning the Corner
• Demand was seasonally stronger…bookings up, sales flat QoQ…building backlog again
• Significant reduction in inventories again in Q3
• Distributors’ inventories reduced more than 1 week on higher re-sales
• Reduced internal inventories more than 11% from the prior quarter
• Pro forma gross margins were 21%, up 110 bps QoQ due primarily to lower depreciation expenses
• Utilization increased slightly to low-80%...lead times were up about a week to 6 – 8 weeks on average
• Bookings were strongest for products serving the computing and consumer end markets…especially for notebook, TV and DVD applications
• Record analog switch sales and bookings…sales up >40% QoQ

31
Strong Balance Sheet ManagementNet Debt <$150M…Lowest in our history
($ in millions) 9/25/2005 12/30/2001
Cash, marketable investments $504.6 $504.4
Total debt: $180M Revolver 0.0 0.0 $450M Term B Loan 447.7 0.0
10 1/8% notes due 3/07 0.0 285.010 3/8% notes due 10/07 0.0 300.010 1/2% notes due 2/09 0.0 350.05% Converts due 11/08 200.0 200.0Other 0.0 3.6Total debt $647.7 $1,138.6
Shareholders' equity $1,008.7 $808.0Debt / Equity 0.6x 1.4x

32
Forward Guidance
• We expect revenues to increase about 5% sequentially
• Gross margins forecast to increase 200 –300 bps sequentially

33
Fairchild: Setting a New Direction
• Build on our strengths…silicon and packaging processes, operations, worldwide customer base…
• New product execution…customer and application focus
• Adjust the business model to support a higher value business
• Continue reducing debt and lowering interest expense…strong cash flow


