12
FAIRMODE WG4 - Planning » Alain Clappier, Philippe Thunis & Julio Lumbreras 1

FAIRMODE WG4 - Planning » Alain Clappier, Philippe Thunis & Julio Lumbreras
1

What do we intend by planning in WG4 ?
WG1: assessment Base case model validation WG4: planning Scenario model validation
- Simplicity - Comparability - Overview.
.
Objective: Quantify the model accuracy when run in scenario mode via a common template with the following characteristics:
2

Why do we need something?
APPRAISAL FP7 project has shown that the base case simulations are validated in only 40% of the reported cases,
in addition, scenarios are never validated. Indeed, Air Quality Models are used, for a large part, in scenario mode to produce results in order to design abatement strategies.
3

What is currently done?
Trend analysis:
1990 2001 2010
∆Cmodel/∆t ∆Cobservation/∆t
Courtesy: K. Cuvelier
e. g. Eurodelta exercise
4

What is currently done? Segregation periods
∆Cobservation=(Cweek – Cweek-end) ∆Cmodel=(Cweek – Cweek-end)
Example: Eweek Cweek Eweek-end Cweek-end
5

What is currently done?
Model inter-comparison exercise
% reduction ∆PM / PM over North Italy
∆E/E = 100%
∆C/C
over Lombardia
over different North Italian regions
ref: POMI exercise
e.g: Citydelta, Eurodelta, POMI, etc…
6

Potency concept
∆= −
∆C CpE E
∆=
CpCα
α is the % emission reduction over a given area, then:
We proposed simple indicators to quantify the model responses to emission reduction and facilitate model inter-comparison.
What did we propose so far?
-1 0
ΔE/E=100% ΔC/C=100% ΔE/E= 50% ΔC/C= 50%
Full emission reduction reduces all concentrations
-0.5
ΔE/E=100% ΔC/C=50% ΔE/E= 50% ΔC/C=25%
ΔE/E=100% ΔC/C=0% ΔE/E= 50% ΔC/C=0% Emission reduction has no effects on concentrations
ΔE/E < 0 ΔC/C > 0 ΔE/E < 0 ΔC/C < 0
7

What did we propose so far?
Potency concept only the cells containing concentrations greater than the 95% percentile
≈p 0.5 ∆ =E E 100% ∆ =C C 50%
Yearly averaged PM
8
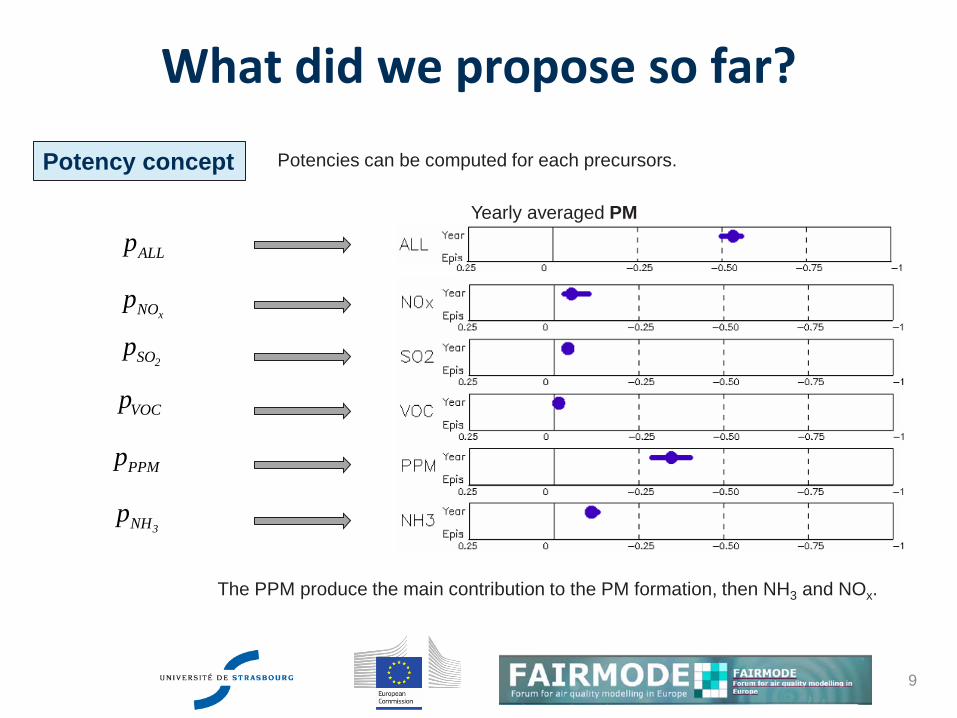
What did we propose so far?
Potency concept
The PPM produce the main contribution to the PM formation, then NH3 and NOx.
xNOp
VOCp2SOp
PPMp
3NHp
ALLpYearly averaged PM
Potencies can be computed for each precursors.
9

What did we propose so far?
Potency concept
x
50%NOp
50%VOCp
2
50%SOp
50%PPMp
3
50%NHp
50%ALLp
Yearly averaged PM
x
30%NOp
30%VOCp
2
30%SOp
30%PPMp
3
30%NHp
30%ALLp
= + + + + +x 2 3ALL NO SO VOC PPM NH intp p p p p p p
50%intp 30%
intp
10

What do we propose?
Need of further brainstorming
Group volunteers (around 5)
Preliminary Guidance
We could not identify a fully satisfying approach to validate a model used in scenario mode. The potency approach developed in the framework of FAIRMODE-WG4 can certainly help for results interpretation but it is still not a real validation methodology (no comparison with observations).
TC 264
11
Thank you for your attention
12


