18
1 Fairview Park, Ohio: Hometown Crime Report Analyst: Katie McCafferty Class: RIAP 276 Date: 7 March 2014 Classification: UNCLASSIFIED
| Date post: | 15-Aug-2015 |
| Category: |
Documents |
| Upload: | katie-mccafferty |
| View: | 32 times |
| Download: | 0 times |

1
Fairview Park, Ohio:
Hometown Crime Report
Analyst: Katie McCafferty
Class: RIAP 276
Date: 7 March 2014
Classification: UNCLASSIFIED

ContentsPART I: Cleveland, Ohio Crime Statistics......................................................................................3
PART II: Larceny-Thefts: Fairview Park’s Biggest Crime Problem..............................................5
Annex I: Cleveland, Ohio Image Location......................................................................................7
Annex II: Cleveland, Ohio Crime Map...........................................................................................8
Annex III: 2008-2009 Part 1 Crime Chart.......................................................................................9
Annex IV: Larceny Risk Cleveland, Ohio.....................................................................................10
Annex V: Fairview Park, Ohio Image Location and Map.............................................................11
Annex VI: Fairview Park 2013 Part 1 Crime Report....................................................................12
Annex VII: Analyst Contact Information......................................................................................13
Annex VIII: Endnotes....................................................................................................................14
Sourcing for Cover Graphics:http://media.cleveland.com/fairview-park/photo/fairview-park-city-hall-side-looking-towards-fire-dept-ed08ebab886bbccd.jpghttp://mi-cache.legacy.com/legacy/images/FHPic/2705fhpic.gif
2

http://townmapsusa.com/images/maps/map_of_fairview_park_oh.jpghttp://jresgroup.com/wp-content/uploads/2012/11/westgate_slider2.jpg
3

PART I: Cleveland, Ohio Crime Statistics
Executive Summary:
The chart, as seen below, shows the Part 1 crimes in Cleveland, Ohio between 2008 and 2012.
The chart shows an overall decrease in crime between 2008 and 2012, with the exceptions of
burglary and larceny-thefts, including an overall decrease in crimes in 2012 (-1,008). In 2012,
murder, rape, robbery, and larceny-theft increased while aggravated assault, burglary, motor
vehicle theft, and arson all decreased. Over the 5 year period, larceny was Cleveland’s most
prevalent crime, with the exception of burglaries in 2011. Cleveland remained around 30,000
total crimes per year for all five years. Finally, Cleveland crime statistics rank much higher than
Ohio’s average and it does not follow the national average.
Discussion:
Cleveland Crimes
2008 2009 2010 2011 20121 Yr
Difference 2011-2012
% change 2011-2012
5 Yr Difference 2008-2012
% change 2008-2012
Average
Murder 102 86 81 74 84 10 13.5% -18 -17.6% 85
Forcible Rape 423 373 341 354 363 9 2.5% -60 -14.2% 371
Robbery 3,804 3,555 3,181 3,156 3,252 96 3.0% -552 -14.5% 3390
Agg. Assault 1,864 1,976 1,922 1,842 1,750 -92 -5.0% -114 6.1% 1871
Burglary 9,102 9,226 9,854 10,706 9,740 -966 -9.0% 638 7.0% 9726
Larceny-Theft 10,686 10,871 10,079 10,524 10,808 284 2.7% 122 1.1% 10594
Auto Theft 5,283 4,031 3,503 4,093 3,761 -332 -8.1% -1,522 -28.8% 4134
Arson 532 401 378 319 302 -17 5.3% -230 -43.2% 386
Total 31,796 30,519 29,339 31,068 30,060 -1,008 -3.2% -1,736 -5.5% 30556
Cleveland is located in Northeast Ohio
on the coast of Lake Erie (see Annex I
for image), with a recorded population of
393,781 in 20121 by the FBI’s Uniform
Crime Report (UCR). Looking at the
2008-2012 Cleveland crime statistics,
crime has seen an overall drop in crime
4

in each Part 1 crime section, with the exceptions of burglary and larceny. The total crime
numbers in Cleveland remained around 30,000 crimes per year. Total crime numbers between
2008-2010 dropped from 31,796 (2008) to 30519 (2009) to 29,339 (2010), this was then
followed by a small spike in crime during 2011 which rose to 31,068, followed by another small
drop in 2012 with 30,060. 4 of the 8 Part 1 crimes increased between 2011 and 2012, those
being murder, rape, robbery, and larceny, while the other 4 dropped, those being aggravated
assault, burglary, automobile theft, and arson. This division resulted in a 3.2% drop in crime
between 2011 and 2012.
Throughout most of 2008-2012, larceny was the most
popular occurring crime in Cleveland, with the exception
of burglary in 2011. While there were 10,706
documented burglaries in 2011, larceny was only behind
by 182 with 10,524 documented crimes. Mapping these
crimes is an effective way to visualize the expanse as well
as any possible hot spots for crime (see Annex II for
image)2.
The peak year for crime in Cleveland over the 5 year period was 2008 with a total of 31,796
crimes, followed by a 1,277 crime drop in 2009. Aggravated assault, burglary, and larceny
increased between 2008 and 2009 while all other Part 1 crimes dropped, in total, creating a 4%
drop in overall crime in Cleveland.
Overall, Cleveland does not only have a higher
crime rate than Ohio and the national average, but it
is even one of the highest ranked communities for
its crime rate and being in the top 100 most
dangerous cities in the U.S.A. It still has a very
high crime rate compared to cities of similar
population size3 (see Annex IV).
Comments:
See Annex III for a Microsoft Excel chart showing the change in crime statistics from 2008-2009
5
10,686
10,871
10,079
10,524
10,808
Larceny20082009201020112012

A Fairview Park home, showing the area is of higher-income. Source: http://photos1.zillow.com/p_d/IS-39vqtfyayqn1.jpg
PART II: Larceny-Thefts: Fairview Park’s Biggest Crime Problem
Executive Summary:
A personal email interview with Fairview Park’s Police Chief, Erich Upperman, showed that
Fairview Park’s greatest crime problem is larceny-theft offenses. The majority of these crimes
are shoplifting cases from businesses at the Westgate Shopping Center and other property thefts
are taken from locked and unlocked vehicles. Chief Upperman estimated around 50-75% of the
theft suspects are heroin or methamphetamine users from a wide variety of demographics.
Overall, Fairview Park is below the national and state averages for crime rate.
Discussion:
Fairview Park is a small suburb located about 20-30 minutes, southwest of Cleveland.
According to Chief Erich Upperman, who has lived in Fairview Park since 1986 and served on
the police force for 29 years4, the largest current problem in Fairview Park are larceny-theft
cases. These crimes are mainly shoplifting cases
from businesses at the Westgate Shopping Center
in northern Fairview Park with suspects often being
juveniles. Along with shoplifting are thefts from
locked and unlocked vehicles. Chief Upperman
says anywhere from 50-75% of these crimes are
committed by heroin or methamphetamine users
that steal to feed their habit, in other words, they
sell the stolen property to obtain money for more
drugs. There are slightly more males than females
involved, but other than that, there is no other
suspect commonality. The suspects come in all age groups, from juveniles to people in the 50’s
and even 60’s, and a variety of demographics are seen with suspects being white, black,
Hispanic, etc.
6

A recent example of the thefts occurring in the Fairview Park area is the end of a 2 month
investigation stemming from a rash of thefts from cars over a three month period. The story was
reported in February 21, 2014 as “numerous items had been taken from unlocked vehicles and
open garages with the suspects using any stolen credit cards at area retail establishments” to buy
electronics. A large quantity of the suspected stolen items were recovered – including 19
suspected stolen bikes – with a Cleveland man and woman being arrested. The man was arrested
on the theft warrant and both were arrested for drug violations. The suspected ringleader, a 38
year old man from the nearby suburb of North Olmsted, was
already in custody on the day the warrants were served. The
group of suspects is responsible for numerous thefts not only in
Fairview Park, but in nearby North Olmsted, Rocky River,
Westlake, and other local towns5.
The crime rate in Fairview Park is below the national average.
The larceny-thefts impact the community in several ways. The
merchandise prices are raised due to the shoplifting crimes and
suspects are a drain on taxpayer money when arrested. Taxes
cover the cost of the provided lawyer, the housing jail, as well as
rehab programs, medical prescriptions when in custody, etc.
The police respond to these crimes in a variety of ways. When they receive a rash of specific
crimes, they try to target the areas where the crime is most often occurring.The Fairview Park
Police work with other agencies that many also be getting targeted and share information about
suspects, types of crimes, etc. The force tries to remain highly visible in the community through
patrol and traffic enforcement. Chief Upperman believes criminals coming into the city see the
flashing lights of the officers stopping people during traffic enforcements or the cruising officers
on patrol and potential criminals are deterred from sticking around the city.
Comments:
The analyst called Chief Erich Upperman on 28 February 2014 and was instructed to email him.
An email was sent later that same day, receiving a response the following day. Chief Upperman
was very helpful and willing to thoroughly answer any and all questions while also attaching the
7
Fairview Park 2013 Part 1 Crime Rates
RobberyAgg. AssaultsBurglaryLarcenyAuto Theft
2013 Part 1 crime statistics for Fairview Park to his email (see Annex VI for Fairview Park
maps).
Annex I: Cleveland, Ohio Image Location
8

Annex II: Cleveland, Ohio Crime Map
Overview of Cleveland crime mapping. Larceny and burglary being most prevalent.
9

Annex III: 2008-2009 Part 1 Crime Chart
10
Cleveland1 Yr
Difference 2008-2009
% change 2008-2009
Murder -16 -15.7%Forcible Rape -50 -11.8%
Robbery -249 -6.5%Agg. Assault 112 6.0%
Burglary 124 1.4%Larceny-Theft 185 1.7%
Auto Theft -1,252 -23.7%Arson -131 -24.6%Total -1,277 -4.0%

Annex IV: Larceny Risk Cleveland, Ohio
11

The above graphs show the Part 1 crime rates of Cleveland vs. Ohio vs. National rates. Cleveland has much higher rates of violent and property crimes than the nation as a whole or Ohio.
The below graph further breaks down the Part 1 crimes to show larceny-theft as the most prevalent crime with 10,079 documented cases.
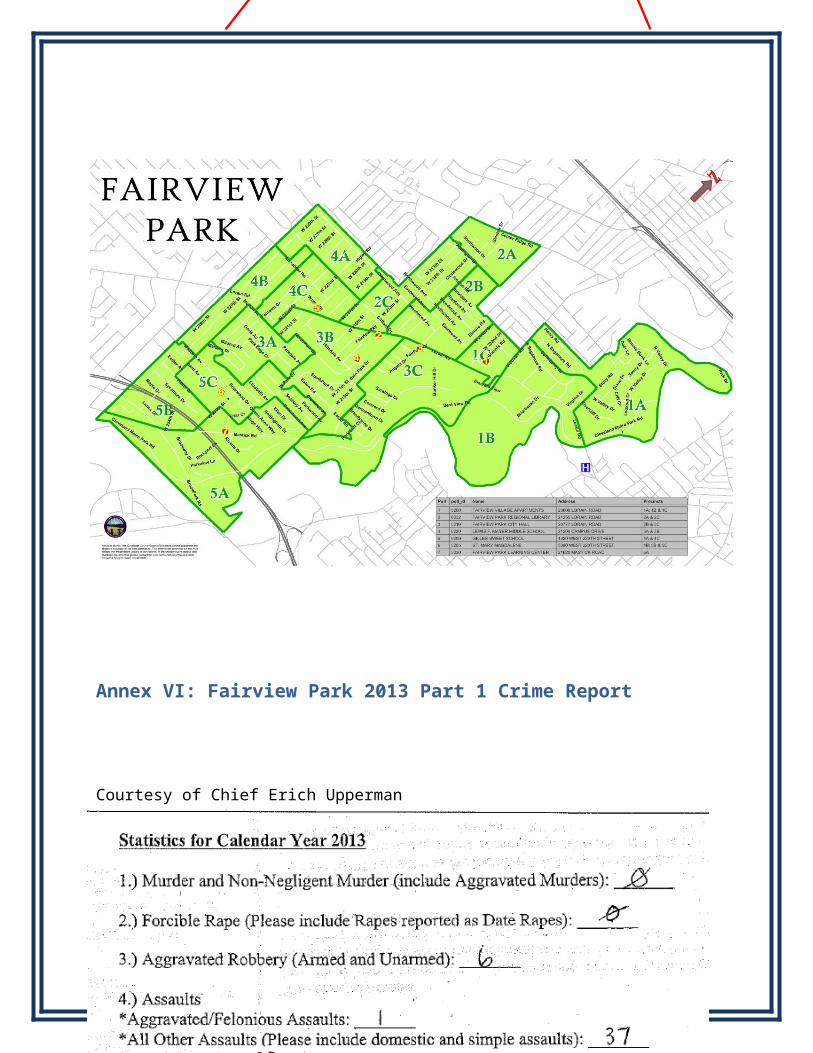
Annex V: Fairview Park, Ohio Image Location and Map
To the right is the location of Fairview Park, Ohio
Below is a map of Fairview Park, with points of interest marked.
12

Annex VI: Fairview Park 2013 Part 1 Crime Report
Courtesy of Chief Erich Upperman
13
Police Department Westgate Shopping Center

Annex VII: Analyst Contact Information
14
Katie McCafferty
Phone: (440)-779-3999
Email: [email protected]
Address: Mercyhurst University 501 E 38th St.
Erie PA, 16546
P.O. Box #204
Annex VIII: Endnotes
Part I Crime Statistics Source: http://www.fbi.gov/about-us/cjis/ucr/ucr
1http://www.fbi.gov/about-us/cjis/ucr/crime-in-the-u.s/2012/crime-in-the-u.s.-2012/tables/8tabledatadecpdf/table-8-state-cuts/table_8_offenses_known_to_law_enforcement_by_ohio_by_city_2012.xls
2http://spotcrime.com/oh/cleveland
3http://www.neighborhoodscout.com/oh/cleveland/crime/#description
4http://www.cleveland.com/fairview-park/index.ssf/2013/09/fairview_park_police_lt_erich.html
5http://www.cleveland.com/fairview-park/index.ssf/2014/02/two-month_theft_investigation.html
Annex I Source: http://www.hschange.org/CONTENT/1154/Cleveland-Map.jpg
Annex II Source: http://spotcrime.com/oh/cleveland
Annex III Source: Excel Spreadsheet, data from http://www.fbi.gov/about-us/cjis/ucr/ucr
Annex IV Source:http://www.cityrating.com/crime-statistics/ohio/cleveland.html.UxkZQvk7uSo
Annex V Source: http://www.fairviewparkdems.org/wp-content/uploads/2011/02/fairview-park-precinct-map-0011.jpg
Annex VI Source: 2013 Fairview Park Statistics from Chief Erich Upperman
15


