Page 1
International Student Enrollment Fall 2014
Berkeley International Office2299 Piedmont AvenueBerkeley, CA 94720-2321510.642.2818
http://internationaloffice.berkeley.edu [email protected]
Prepared by Berkeley International Office
Page 2
Rank Country Fall 2013
Fall 2014
Fall 2014%Total
%Change from 2013
1 China 1568 1802 31.92% +14.92%
2 Korea, South 840 764 13.53% -9.05%
3 India 487 505 8.95% +3.70%
4 Canada 362 360 6.38% -0.55%
5 Hong Kong 180 167 2.96% -7.22%
6 Taiwan 195 165 2.92% -15.38%
7 United Kingdom 146 156 2.76% +6.85%
8 Indonesia 133 155 2.75% +16.54%
9 France 125 124 2.20% -0.80%
10 Japan 105 110 1.95% +4.76%
11 Singapore 114 99 1.75% -13.16%
12 Germany 87 85 1.51% -2.30%
13 Thailand 79 81 1.43% 2.53%
14 Australia 65 79 1.40% 21.54%
15 Brazil 69 73 1.29% 5.80%
16 Chile 55 63 1.12% 14.55%
17 Turkey 52 60 1.06% 15.38%
18 Mexico 63 58 1.03% -7.94%
19 Italy 58 50 0.89% -13.79%
20 Malaysia 43 49 0.87% 13.95%
Berkeley International
OfficeFall 2014 International Student Enrollment
Applied Admitted Intend to Register
Freshmen 13,260 1,356 662
Transfer 3,077 579 428
Graduate 17,797 2,127 908
This data was retrieved from Cal Answers at http://calanswers.berkeley.edu and provided by the Graduate Division.
Admission & Enrollment of New, Degree-Seeking Int’l Students
Top 20 Countries of Origin
Female Male Total %Change from 2013
Undergraduate 1592 1741 3333 +5.80%
Graduate 794 1510 2304 +6%
EAP (UG + Grad) 142 134 276 -15.60%
Total 5913 +4.75
Total Enrollment of International Students
Additional International Student Populations*
Female Male Total %Change from 2013
OPT & AT 518 745 1263 +33.79%
Masters Law (LLM) Summer Program 92 97 189 +48.82%
Summer Sessions 1565 1295 2860 +18.43%
Total 4312*This data is not included in the ‘Total Enrollment’ table shown above, but are populations served by Berkeley International Office and the University.
Page | 1
Page 3
Total Graduate Enrollment: 10 Years
Total International Student Enrollment: 10 Years
Total Undergraduate Enrollment: 10 Years
Region of Origin
Page | 2
Berkeley International
OfficeFall 2014 International Student Enrollment
Page 4
Educational Levels2014 Breakdown
Educational Levels Comparison 2013 vs. 2014College or School Total
College of Engineering 747
College of Letters and Science 464
Walter A. Haas School of Business 385
Boalt School of Law 204
College of Environmental Design 122
College of Chemistry 110
College of Natural Resources 97
School of Information 38
School of Public Health 34
Goldman Graduate School of Public Policy 34
Graduate School of Education 32
School of Journalism 19
School of Optometry 12
School of Social Welfare 6
College Total
College of Letters and Science 2413
College of Engineering 419
College of Natural Resources 165
College of Chemistry 153
College of Environmental Design 104
Walter A. Haas School of Business 79
Degree-Seeking Graduates by College/School
Degree-Seeking Undergraduates by College/School
Page | 3
Berkeley International
OfficeFall 2014 International Student Enrollment
Page 5
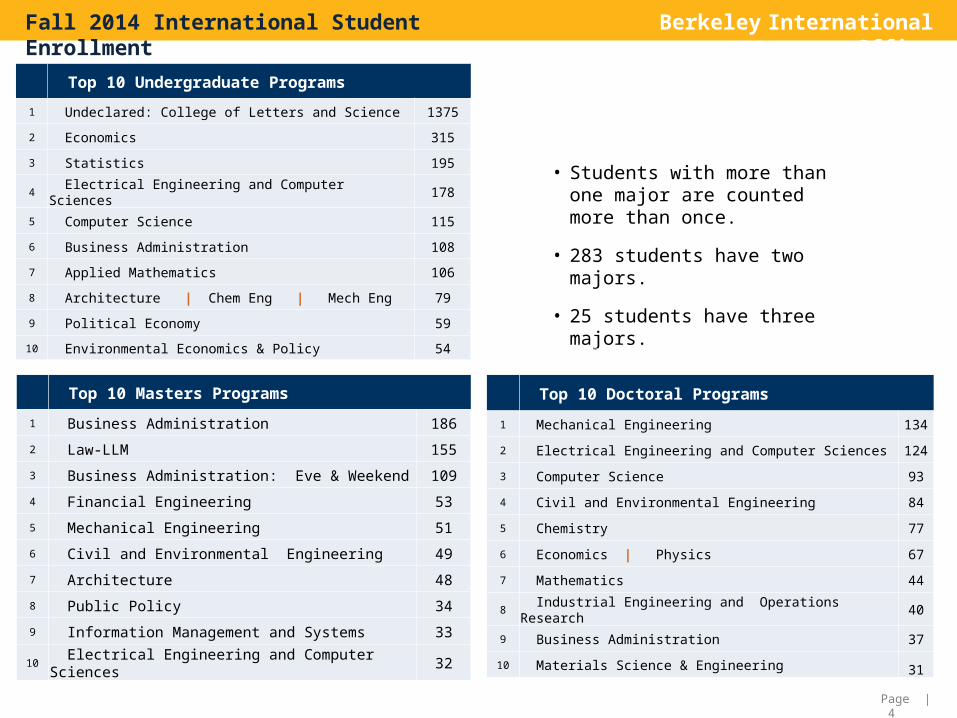
Top 10 Undergraduate Programs1 Undeclared: College of Letters and Science 1375
2 Economics 315
3 Statistics 195
4 Electrical Engineering and Computer Sciences 178
5 Computer Science 115
6 Business Administration 108
7 Applied Mathematics 106
8 Architecture | Chem Eng | Mech Eng 79
9 Political Economy 59
10 Environmental Economics & Policy 54
• Students with more than one major are counted more than once.
• 283 students have two majors.
• 25 students have three majors.
Top 10 Masters Programs1 Business Administration 186
2 Law-LLM 155
3 Business Administration: Eve & Weekend 109
4 Financial Engineering 53
5 Mechanical Engineering 51
6 Civil and Environmental Engineering 49
7 Architecture 48
8 Public Policy 34
9 Information Management and Systems 33
10 Electrical Engineering and Computer Sciences 32
Top 10 Doctoral Programs1 Mechanical Engineering 134
2 Electrical Engineering and Computer Sciences 124
3 Computer Science 93
4 Civil and Environmental Engineering 84
5 Chemistry 77
6 Economics | Physics 67
7 Mathematics 44
8 Industrial Engineering and Operations Research 40
9 Business Administration 37
10 Materials Science & Engineering 31
Page | 4
Berkeley International
OfficeFall 2014 International Student Enrollment
Page 6
Undergraduate Students Graduate StudentsTotal
Students Degree Exchange
Total Undergraduate
Masters Doctorate ExchangeTotal
Graduate Female Male Female Male Female Male Female Male Female Male
Boalt School of Law Jurisprudence and Social Policy 2 6 8 8 LLM 75 80 155 155 JD 17 11 28 28 JSD 6 8 14 14
Total 75 80 25 25 0 0 205 205 College of Chemistry Chemical Biology 16 14 30 0 30 Chemical Engineering 26 53 79 11 8 7 7 33 112 Chemistry 16 19 35 30 47 77 112 Joint Major in Materials Science & Engineering and Chemical Engineering 1 8 9 0 9
Non Degree 3 4 7 0 7Total 59 94 3 4 160 11 8 37 54 0 0 110 270
College of Engineering Applied Science & Technology 0 4 15 19 19 Bioengineering (Engineering) 7 10 17 3 3 8 13 27 44 Bioengineering (Graduate Division) 0 1 9 10 10 Civil & Environmental Engineering 0 16 33 21 63 133 133 Civil Engineering 13 25 38 0 38 Computer Science 0 1 2 10 83 96 96 Electrical Engineering & Computer Sciences 28 150 178 12 25 23 101 161 339 Energy Engineering 8 8 0 8 Engineering Mathematics & Statistics 1 4 5 0 5 Engineering Physics 3 5 8 0 8 Envrionmental Engineering Science 2 1 3 0 3 Industrial Engineering & Operations Research 17 29 46 14 14 13 27 68 114 Joint Major in Bioengineering and Materials Science & Engineering 3 1 4 0 4 Joint Major in Materials Science & Engineering and Electrical Engineering & Computer Sciences 1 4 5 0 5 Joint Major in Materials Science & Engineering and Mechanical Engineering 4 4 0 4 Joint Major in Nuclear Engineering and Mechanical Engineering 0 0 0
Materials Science & Engineering 6 12 18 3 7 24 34 52 Mechanical Engineering 9 70 79 9 42 27 107 185 264 Non-Degree 6 18 24 0 24 Nuclear Engineering 1 1 3 2 12 17 18 Translational Medicine 0 4 1 5 5 Undeclared 1 7 8 0 8
Total 91 331 6 18 446 59 126 116 454 0 0 755 1201
Enrollment by Major
Page | 5
Berkeley International
OfficeFall 2014 International Student Enrollment
Page 7
Undergraduate Students Graduate StudentsTotal
Students Degree Exchange
Total Undergraduate
Masters Doctorate ExchangeTotal
Graduate Female Male Female Male Female Male Female Male Female MaleCollege of Environmental Design
Architecture 47 33 1 2 83 29 19 10 5 63 146 City and Regional Planning 0 12 5 2 4 23 23 Landscape Architecture & Environmental Planning 0 5 3 8 8 Landscape Architecture 3 3 12 6 18 21 Non-Degree 1 1 0 1 Sustainable Environmental Design 2 3 5 0 5 Urban Design 0 5 6 11 11 Urban Studies 10 8 2 4 24 0 24
Total 62 44 4 6 116 58 36 17 12 0 0 123 239College of Natural Resources
Agricultural & Resource Economics 0 11 18 29 29 Comparative Biochemistry 0 5 4 9 9 Conservation & Resource Studies 1 5 6 0 6 Development Practice 0 8 8 16 16 Energy & Resources 0 4 1 2 6 13 13 Environmental Economics & Policy 34 22 56 0 56 Environmental Science, Policy, & Management 0 5 7 12 12 Environmental Sciences 15 15 30 0 30 Forestry & Natural Resource 1 1 0 1 Genetics & Plant Biology 3 3 0 3 Metabolic Biology 0 2 2 2 Microbial Biology 5 3 8 0 8 Microbiology 0 4 1 5 5 Molecular & Biochemical Nutrition 0 3 2 5 5 Molecular Environmental Biology 11 8 19 0 19 Molecular Toxicology 2 2 4 0 4 Non-Degree 1 1 2 0 2 Nutrition Science 10 10 0 10 Nutritional Science-Dietetics 7 7 0 7 Nutritional Sciences-Physiology & Metabolism 6 1 7 0 7 Plant Biology 0 2 4 6 6 Society & Environment 5 2 7 0 7 Undeclared 9 5 14 0 14
Total 109 63 1 1 174 12 9 34 42 0 0 97 271Goldman School of Public Policy
Public Policy 19 15 1 35 35Total 19 15 0 1 0 0 35 35
Enrollment by Major
Page | 6
Berkeley International
OfficeFall 2014 International Student Enrollment
Page 8
Undergraduate Students Graduate StudentsTotal
Students Degree Exchange
Total Undergraduate
Masters Doctorate ExchangeTotal
Graduate Female Male Female Male Female Male Female Male Female MaleGraduate School of Education
Education 1 16 11 28 28 Science and Mathematics Education 2 2 2 Special Education 2 2 2
Total 1 0 20 11 0 0 32 32School of Information
Information & Data Science 1 1 1 Information Management and Systems 11 22 2 2 37 37
Total 11 23 2 2 0 0 38 38School of Journalism
Journalism 11 8 19 19Total 11 8 0 0 0 0 19 19
School of Optometry Optometry 6 1 7 7 Optometry Certificate 0 0 Vision Science 3 2 5 5
Total 6 1 3 2 0 0 12 12School of Public Health
Biostatistics 1 1 1 3 3Environmental Health Sciences 1 2 1 4 4Epidemiology 1 1 2 2Health Services & Policy Analysis 3 3 3Infectious Diseases & Immunity 2 2 2Public Health 16 10 1 27 27
Total 17 12 9 3 0 0 41 41School of Social Welfare
Social Welfare 2 1 3 6 6Total 2 1 3 0 0 0 6 6
Walter A. Haas School of Business Business Administration 62 46 108 53 133 13 24 223 331 Business Administration-Columbia Joint Degree 0 6 9 15 15 Business Administration-EWMBA 0 25 84 3 112 112 Business Administration-Executive 0 0 0 Businesss Administration-Financial Engineering 0 10 43 53 53 Non-Degree 13 12 25 0 25
Total 62 46 13 12 133 88 260 13 24 6 12 403 536
Enrollment by Major
Page | 7
Berkeley International
OfficeFall 2014 International Student Enrollment
Page 9
Degree-Seeking Exchange Total Undergrad Students
Female Male Female Male
College of Letters and Science Undergraduate DivisionAnthropology 2 1 3
Applied Mathematics 30 76 106
Art 5 1 6
Asian Studies - Area 1: China 2 2 4
Asian Studies - Area 2: Japan 0
Asian Studies 2 2
Astrophysics 2 2
Chemistry 2 2 4
Classical Civilization 1 1
Cognitive Science 10 3 13
Compartive Literature 1 1 2
Computer Science 31 84 115
Dance & Performance Studies 0
Development Studies 9 4 13
Economics 158 157 315
English 7 2 9
Environmental Economics and Policy 1 5 6
Film 5 4 9
French 1 1 2
Geography 2 3 5
Geology 3 1 4
Geophysics 1 2 3
German 1 1 2
History 6 7 13
History of Art 3 2 5
Integrative Biology 8 6 14
Interdisciplinary Studies 9 12 21
Italian Studies 0
Japanese Language 1 1 2
Enrollment by Major
Page | 8
Berkeley International
OfficeFall 2014 International Student Enrollment
Page 10
Degree-Seeking Exchange Total Undergraduate
Students
Female Male Female Male
College of Letters and Science Undergraduate Division (continued) Legal Studies 10 4 14 Linguistics 1 3 4 Marine Science 1 1 Mathematics 10 22 32 Molecular and Cell Biology, Plan I, Emphasis 1: Biochemistry and Molecular Biology 4 2 6
Molecular and Cell Biology, Plan I, Emphasis 2: Genetics 4 1 5
Molecular and Cell Biology, Plan I, Emphasis 3: Immunology 5 2 7
Molecular and Cell Biology, Plan II, Emphasis 2: Cell and Developmental Biology 7 3 10
Molecular and Cell Biology, Plan II, Emphasis 3: Neurobiology 8 4 12
Media Studies 24 7 31 Music 4 3 7 Near Eastern Civilizations 1 1 Non-Degree 109 81 190 Operations Research & Management Science 2 3 5 Peace & Conflict Studies 5 1 6 Philosophy 2 8 10 Physics 4 25 29 Planetary Science 1 1 Political Economy 33 26 59 Political Science 20 17 37 Psychology 46 9 55 Public Health 4 1 5Religious Studies 1 1Rhetoric 3 3
Social Welfare 6 3 9 Sociology 32 14 46 South & Southeast Asian Studies 1 1 Spanish, Option A, Spanish Language & Literature 1 1 Statistics 82 113 195 Theater and Performance Studies 4 1 5 Undeclared 713 662 1375
Enrollment by Major
Page | 9
Berkeley International
OfficeFall 2014 International Student Enrollment
Page 11
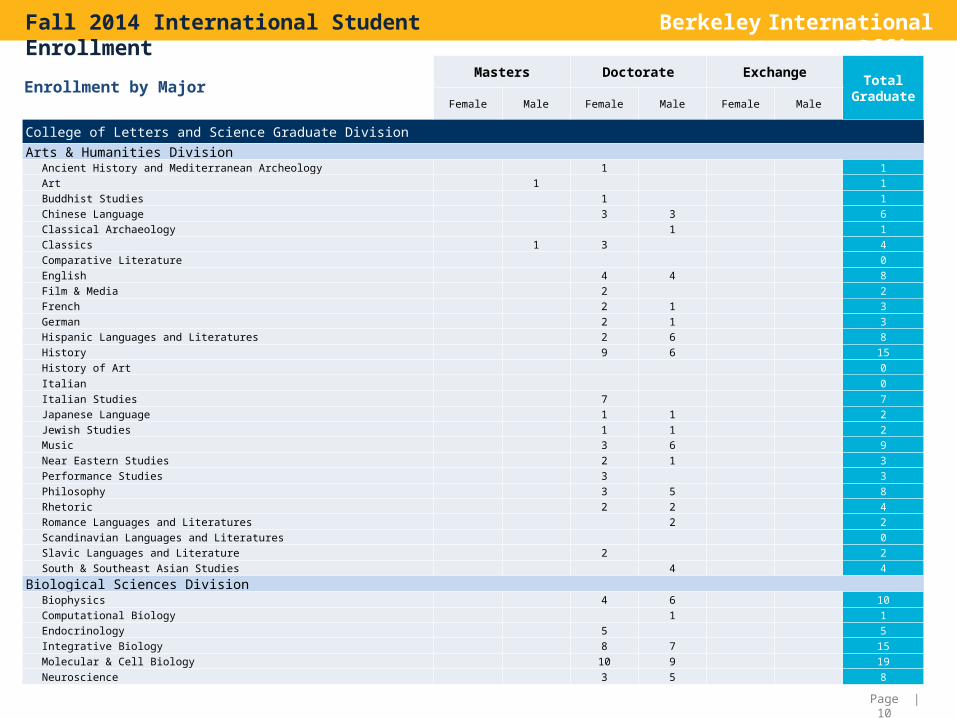
Masters Doctorate Exchange Total
Graduate
Female Male Female Male Female Male
College of Letters and Science Graduate Division Arts & Humanities Division Ancient History and Mediterranean Archeology 1 1 Art 1 1 Buddhist Studies 1 1 Chinese Language 3 3 6 Classical Archaeology 1 1 Classics 1 3 4 Comparative Literature 0 English 4 4 8 Film & Media 2 2 French 2 1 3 German 2 1 3 Hispanic Languages and Literatures 2 6 8 History 9 6 15 History of Art 0 Italian 0 Italian Studies 7 7 Japanese Language 1 1 2 Jewish Studies 1 1 2 Music 3 6 9 Near Eastern Studies 2 1 3 Performance Studies 3 3 Philosophy 3 5 8 Rhetoric 2 2 4 Romance Languages and Literatures 2 2 Scandinavian Languages and Literatures 0 Slavic Languages and Literature 2 2 South & Southeast Asian Studies 4 4
Biological Sciences Division Biophysics 4 6 10 Computational Biology 1 1 Endocrinology 5 5 Integrative Biology 8 7 15 Molecular & Cell Biology 10 9 19 Neuroscience 3 5 8
Enrollment by Major
Page | 10
Berkeley International
OfficeFall 2014 International Student Enrollment
Page 12
Masters Doctorate Exchange Total Graduate
Female Male Female Male Female Male
College of Letters and Science Graduate Division (continued) Mathematical & Physical Sciences Division
Applied Mathematics 6 6
Astrophysics 1 2 3
Earth and Planetary Sciences 4 10 14
Logic & the Methodology of Science 3 3
Mathematics 1 1 7 37 46
Physics 4 63 67
Statistics 8 10 6 14 38
Social Sciences DivisionAfrican American Studies 1 1
Anthropology 4 5 9
Asian Studies 1 1
Demography 1 2 3
Economics 1 2 15 52 70
Ethnic Studies 1 1 2
Geography 3 3 6
International & Area Studies 1 1
Latin American Studies 1 1
Linguistics 5 3 8
Medical Anthropology 2 2
Political Science 8 8 16
Psychology 3 3 6
Sociology 3 8 11 Sociology & Demography 1 1
Enrollment by Major
College of Letters and Science Undergraduate & Graduate Totals
Undergraduate Students Graduate StudentsTotal
StudentsDegree Exchange
Total Undergrad
Masters Doctorate ExchangeTotal
GraduateFemale Male Female Male Female Male Female Male Female Male
1338 1316 109 81 2844 11 17 149 295 0 0 472 3316
Page | 11
Berkeley International
OfficeFall 2014 International Student Enrollment
Page 13
Total Fall 2014 Enrollment
Undergraduate Degree
Undergraduate Exchange Total
Undergrad Students
Graduate Degree
Graduate Exchange Total
Graduate StudentsFemale Male Female Male Female Male Female Male
Africa 78 17 25 1 43 10 25 35
East Asia & the Pacific 3612 1217 1269 48 39 2573 382 652 3 2 1039
Europe & Eurasia 818 106 121 79 74 380 137 289 3 9 438
Near East 163 17 21 38 40 84 1 125
South & Central Asia 576 88 169 257 99 220 319
Western Hemisphere 666 147 136 8 9 300 126 240 366
Total 5913 1592 1741 136 122 3591 794 1510 6 12 2322
Enrollment by Region:Summary
Undergraduates by Region
Graduates by Region
Page | 12
Berkeley International
OfficeFall 2014 International Student Enrollment
Page 14
Total Enrollment Undergraduate Degree Undergraduate Exchange Total UndergradStudents
Graduate Degree Graduate Exchange Total Graduate StudentsFall 2013 Fall 2014 Female Male Female Male Female Male Female Male
Botswana 1 1 0 1 1
Burkina Faso 1 1 0 1 1
Cameroon 1 1 1 1 0
Cote D Ivoire 5 0 0 0
Ethiopia 0 3 2 2 1 1
Ghana 3 4 2 2 2 2
Kenya 12 14 5 5 10 3 1 4
Madagascar 1 1 0 1 1
Malawi 1 1 1 1 0
Mozambique 0 1 0 1 1
Namibia 1 1 0 1 1
Nigeria 14 17 2 8 10 7 7
Rwanda 1 1 0 1 1
Senegal 0 2 1 1 2 0
South Africa 13 10 1 1 1 3 1 6 7
Sudan 0 1 0 1 1
Swaziland 1 1 0 1 1
Tanzania 2 3 1 1 2 1 1
Uganda 4 3 0 3 3
Zambia 0 2 1 1 2 0
Zimbabwe 5 10 4 4 8 2 2
Total 66 78 17 25 1 0 43 10 25 0 0 35
Enrollment by Region:Africa
Page | 13
Berkeley International
OfficeFall 2014 International Student Enrollment
Page 15
Total Enrollment Undergraduate Degree Undergraduate Exchange Total UndergradStudents
Graduate Degree Graduate ExchangeTotal Grad StudentsFall 2013 Fall 2014 Female Male Female Male Female Male Female Male
Australia 65 79 12 22 4 10 48 11 17 1 2 31
Brunei 2 3 3 3 0
Burma (Myanmar) 5 7 5 2 7 0
Cambodia 3 3 2 2 1 1
China 1568 1802 652 564 10 11 1237 217 347 1 565
Fiji 1 0 0 0
Hong Kong 180 167 61 85 1 5 152 3 12 15
Indonesia 133 155 69 71 1 141 5 9 14
Japan 105 110 28 21 4 2 55 15 40 55
Korea, South 840 764 229 351 20 3 603 54 107 161
Macau 16 18 11 5 1 17 1 1
Malaysia 43 49 20 24 44 5 5
Mongolia 3 3 3 3 0
New Zealand 33 38 13 11 2 4 30 3 5 8
Philippines 17 19 8 6 14 4 1 5
Singapore 114 99 25 34 1 2 62 12 24 1 37
Taiwan 195 165 40 33 1 74 37 54 91
Thailand 79 81 18 19 3 2 42 18 21 39
Vietnam 53 49 22 16 38 3 8 11
Unknown 0 1 1 1 0
Total 3455 3612 1217 1269 48 39 2573 382 652 3 2 1039
Enrollment by Region:East Asia & The Pacific
Page | 14
Berkeley International
OfficeFall 2014 International Student Enrollment
Page 16
Total Enrollment Undergraduate Degree Undergraduate Exchange Total Undergrad Students
Graduate Degree Graduate Exchange Total Grad StudentsFall 2013 Fall 2014 Female Male Female Male Female Male Female Male
Albania 3 4 1 1 1 3 1 1Armenia 4 4 1 2 3 1 1Austria 8 6 2 2 1 3 4Azerbaijan 1 2 1 1 1 1Belarus 2 4 2 1 3 1 1Belgium 12 9 1 1 1 3 1 5 6Bosnia and Herzegovina 1 1 0 1 1Bulgaria 7 6 2 1 3 2 1 3Croatia 0 1 1 1 Cyprus 4 5 1 1 1 3 2 2Czech Republic 1 4 1 1 2 1 1 2Denmark 16 12 1 2 4 3 10 1 1 2Estonia 3 2 1 1 1 1Finland 3 5 1 1 2 1 2 3France 125 124 9 11 15 10 45 27 52 79Georgia 0 1 0 1 1Germany 87 85 6 3 10 8 27 19 38 1 58Greece 24 30 4 5 9 7 14 21Hungary 12 14 3 1 4 2 8 10Iceland 8 1 1 1 0Ireland 3 11 4 4 8 3 3Italy 58 50 4 5 4 6 19 14 16 1 31Lichtenstein 1 0 0 0Lithuania 1 2 1 1 1 1Luxembourg 2 0 0 0Macedonia 0 2 1 1 2 Moldova 1 1 0 1 1Montenegro 1 2 2 2 0Netherlands 25 32 3 5 7 2 17 5 9 1 15Norway 10 14 7 1 8 2 4 6Poland 9 7 2 1 3 4 4Portugal 14 11 3 3 3 5 8Romania 10 12 2 1 3 4 5 9Russia 31 27 3 4 7 9 10 1 20Serbia 13 11 1 8 9 1 1 2Serbia and Montenegro 1 1 0 1 1Slovakia 1 0 0 0Slovenia 4 4 1 1 1 2 3Spain 47 48 3 5 6 10 24 7 15 2 24Sweden 29 25 5 4 5 7 21 2 2 4Switzerland 16 13 1 1 4 8 12Turkey 52 60 12 7 2 21 9 30 39Ukraine 7 9 1 1 1 7 8United Kingdom 146 156 24 41 22 19 106 10 35 3 2 50
Total 803 818 106 121 79 74 380 137 289 3 9 438
Enrollment by Region:Europe & Eurasia
Page | 15
Berkeley International
OfficeFall 2014 International Student Enrollment
Page 17
Total Enrollment Undergraduate Degree Undergraduate Exchange Total
Undergrad Students
Graduate Degree Graduate ExchangeTotal Grad Students
Fall 2013 Fall 2014 Female Male Female Male Female Male Female Male
Algeria 0 11
1 0
Bahrain 2 53 2
5 0
Egypt 11 111 4
51 5
6
Iran 42 463 1
411 31
42
Iraq 1 11
1 0
Israel 38 441 1
214 28
42
Jordan 3 42 1
31
1
Kuwait 3 31
11 1
2
Lebanon 8 161
16 9
15
Morocco 3 51
13 1
4
Oman 1 1 01
1
Saudi Arabia 12 165 7
121 3
4
Syria 0 31
12
2
Tunisia 3 41
12 1
3
United Arab Emirates 1 1 01
1
West Bank 1 2 01 1
2
Total 129 163 17 21 0 0 38 40 84 0 1 125
Enrollment by Region:Near East
Page | 16
Berkeley International
OfficeFall 2014 International Student Enrollment
Page 18
Total Enrollment Undergraduate Degree Undergraduate ExchangeTotal Undergrad
Students
Graduate Degree Graduate ExchangeTotal Grad Students
Fall 2013 Fall 2014 Female Male Female Male Female Male Female Male
Bangladesh 11 151 1 2 3 10
13
India 487 50570 141 211 94 200
294
Kazakhstan 12 143 8 11 1 2
3
Kyrgyzstan 2 11 1
0
Nepal 1 22 2
0
Pakistan 26 2911 12 23 1 5
6
Sri Lanka 7 92 5 7 2
2
Turkmenistan 2 10 1
1
Total 548 576 88 169 0 0 257 99 220 0 0 319
Enrollment by Region:South Central Asia
Page | 17
Berkeley International
OfficeFall 2014 International Student Enrollment
Page 19
Total Enrollment Undergraduate Degree Undergraduate Exchange Total UndergradStudents
Graduate Degree Graduate Exchange Total Grad StudentsFall 2013 Fall 2014 Female Male Female Male Female Male Female Male
Argentina 14 14 1 1 4 9 13
Bahamas, The 1 1 1 1 0
Belize 0 0 0 0
Bermuda 2 2 2 2 0
Bolivia 0 0 0 0
Brazil 69 73 13 9 1 2 25 14 34 48
Canada 362 360 113 101 1 1 216 60 84 144
Chile 55 63 1 4 4 9 11 43 54
Colombia 23 28 1 1 2 8 18 26
Costa Rica 6 6 2 1 3 3 3
Dominican Republic 2 2 1 1 1 1
Ecuador 7 11 2 2 4 3 4 7
El Salvador 5 1 1 1 0
Guatemala 3 3 1 1 2 1 1
Guyana 1 1 1 1 0
Honduras 2 2 0 2 2
Jamaica 1 1 1 1 0
Mexico 63 58 3 12 2 1 18 15 25 40
Panama 0 0 0 0
Paraguay 2 4 2 2 4 0
Peru 12 20 1 1 2 6 12 18
Saint Kitts and Nevis 0 1 1 1 0
Suriname 1 0 0 0
Trinidad and Tabago 1 0 0 0
Uruguay 2 4 0 1 3 4
Venezuela 10 11 3 3 6 2 3 5
Total 644 666 147 136 8 9 300 126 240 0 0 366
Enrollment by Region:Western Hemisphere
Page | 18
Berkeley International
OfficeFall 2014 International Student Enrollment