Table of Contents Total University (Excluding Temple Japan 1,2 ) Art, Tyler School of Business & Management, Fox School of Theater, Film, and Media Arts, Division of Dentistry, Kornberg School of Education, College of Engineering, College of Environmental Design, School of Health Professions and Social Work, College of Law, Beasley School of Liberal Arts, College of Media and Communication, School of Medicine, School of Music and Dance, Boyer College of Pharmacy, School of Podiatric Medicine, School of Science and Technology, College of Social Work, School of Tourism and Hospitality Management, School of University College University Studies 1. Enrollment from Temple Japan only included on page 1, Total University Enrollment count. 2. Programs offered and degrees awarded also include Temple Japan. Note: Temple University Japan excluded from this report, except where indicated. Fall 2014 Student Profile Temple University Institutional Research & Assessment 14 17 Page 2 8 11 5 20 23 26 62 29 32 35 38 41 44 56 47 50 53 59 Page 1 of 64
Transcript
Table of Contents
Total University (Excluding Temple Japan1,2
)
Art, Tyler School of
Business & Management, Fox School of
Theater, Film, and Media Arts, Division of
Dentistry, Kornberg School of
Education, College of
Engineering, College of
Environmental Design, School of
Health Professions and Social Work, College of
Law, Beasley School of
Liberal Arts, College of
Media and Communication, School of
Medicine, School of
Music and Dance, Boyer College of
Pharmacy, School of
Podiatric Medicine, School of
Science and Technology, College of
Social Work, School of
Tourism and Hospitality Management, School of
University College
University Studies
1. Enrollment from Temple Japan only included on page 1, Total University Enrollment count.
2. Programs offered and degrees awarded also include Temple Japan.
Note: Temple University Japan excluded from this report, except where indicated.
Fall 2014 Student Profile
Temple UniversityInstitutional Research & Assessment
14
17
Page
2
8
11
5
20
23
26
62
29
32
35
38
41
44
56
47
50
53
59
Page 1 of 64
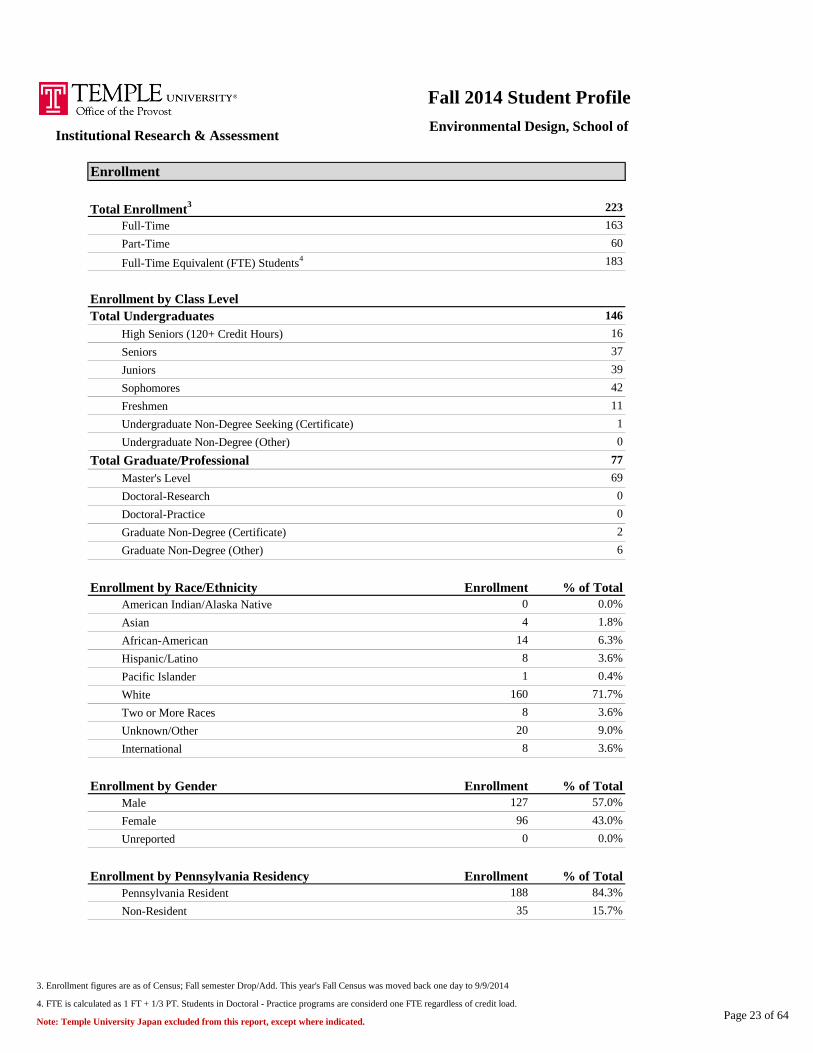
Enrollment
Total Enrollment Including Temple University Japan
Total Enrollment3
Full-Time
Part-Time
Full-Time Equivalent (FTE) Students
Enrollment by Class Level
Total Undergraduates
High Seniors (120+ Credit Hours)
Seniors
Juniors
Sophomores
Freshmen
Undergraduate Non-Degree Seeking (Certificate)
Undergraduate Non-Degree (Other)
Total Graduate/Professional
Master's Level
Doctoral-Research
Doctoral-Practice
Graduate Non-Degree (Certificate)
Graduate Non-Degree (Other)
Enrollment by Race/Ethnicity
American Indian/Alaska Native
Asian
African-American
Hispanic/Latino
Pacific Islander
White
Two or More Races
Unknown/Other
International
Enrollment by Gender
Male
Female
Unreported
Enrollment by Pennsylvania Residency
Pennsylvania Resident
Non-Resident
3. Enrollment figures are as of Census; Fall semester Drop/Add. This year's Fall Census was moved back one day to 9/9/2014
4. FTE is calculated as 1 FT + 1/3 PT. Students in Doctoral - Practice programs are considerd one FTE regardless of credit load.
Note: Temple University Japan excluded from this report, except where indicated.
31,928
5,860
33,955
28,408
1,793
Fall 2014 Student Profile
Temple UniversityInstitutional Research & Assessment
38,857
37,788
9,380
3,409
1,636
3,466
219
650
6,448
6,883
6,230
6,288
105
661
2,896 932 3,828
3,701 770 4,471
Undergraduate
Graduate/
Professional
Total
Enrollment
46 16 62
16,288 4,472 20,760
745 108 853
1,624 372 1,996
34 6 40
13,944 4,208 18,152
14,439 5,144 19,583
1,444 1,577 3,021
1,630 1,127 2,757
6,347 3,997 10,344
25 28 53
22,061 5,383 27,444
Page 2 of 64
Fall 2014 Student Profile
Temple UniversityInstitutional Research & Assessment
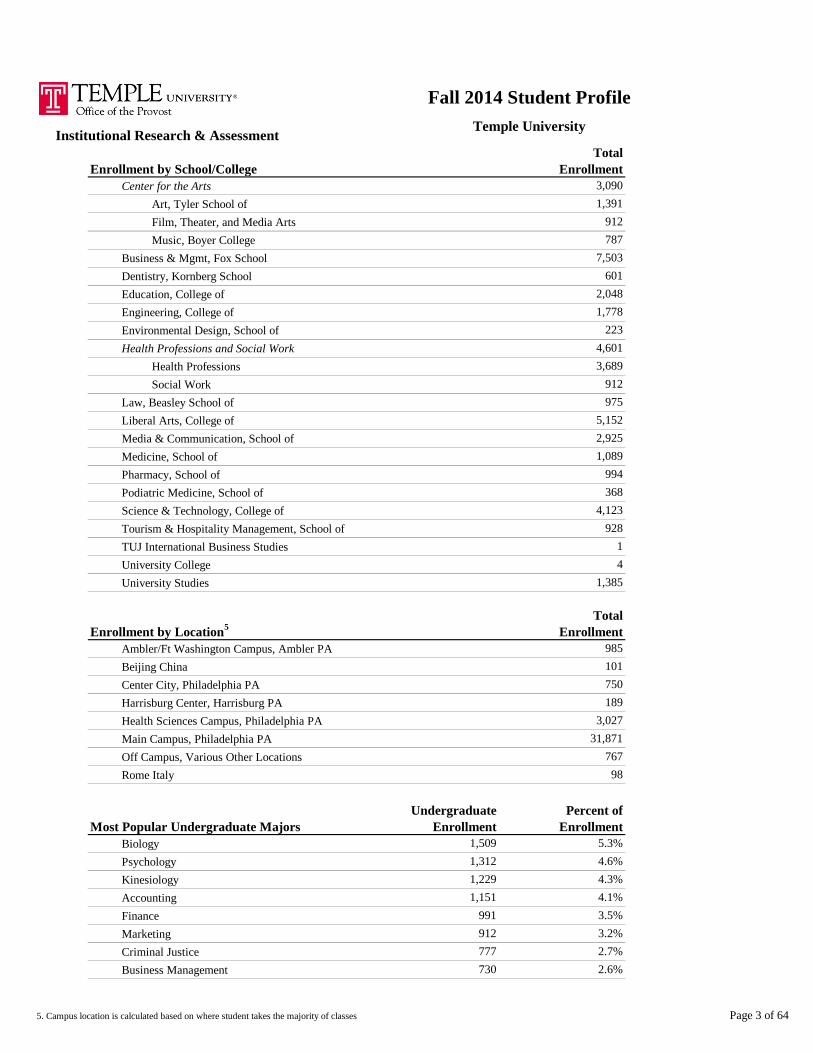
Enrollment by School/College
Center for the Arts
Art, Tyler School of
Film, Theater, and Media Arts
Music, Boyer College
Business & Mgmt, Fox School
Dentistry, Kornberg School
Education, College of
Engineering, College of
Environmental Design, School of
Health Professions and Social Work
Health Professions
Social Work
Law, Beasley School of
Liberal Arts, College of
Media & Communication, School of
Medicine, School of
Pharmacy, School of
Podiatric Medicine, School of
Science & Technology, College of
Tourism & Hospitality Management, School of
TUJ International Business Studies
University College
University Studies
Enrollment by Location5
Ambler/Ft Washington Campus, Ambler PA
Beijing China
Center City, Philadelphia PA
Harrisburg Center, Harrisburg PA
Health Sciences Campus, Philadelphia PA
Main Campus, Philadelphia PA
Off Campus, Various Other Locations
Rome Italy
Most Popular Undergraduate Majors
Biology
Psychology
Kinesiology
Accounting
Finance
Marketing
Criminal Justice
Business Management
5. Campus location is calculated based on where student takes the majority of classes
Total
Enrollment
3,090
1,778
223
4,601
3,689
912
975
1,391
912
787
7,503
601
2,048
928
1
4
1,385
Total
Enrollment
985
5,152
2,925
1,089
994
368
4,123
98
Undergraduate
Enrollment
Percent of
Enrollment
1,509 5.3%
1,312 4.6%
101
750
189
3,027
31,871
767
912 3.2%
777 2.7%
730 2.6%
1,229 4.3%
1,151 4.1%
991 3.5%
Page 3 of 64
Fall 2014 Student Profile
Temple UniversityInstitutional Research & Assessment
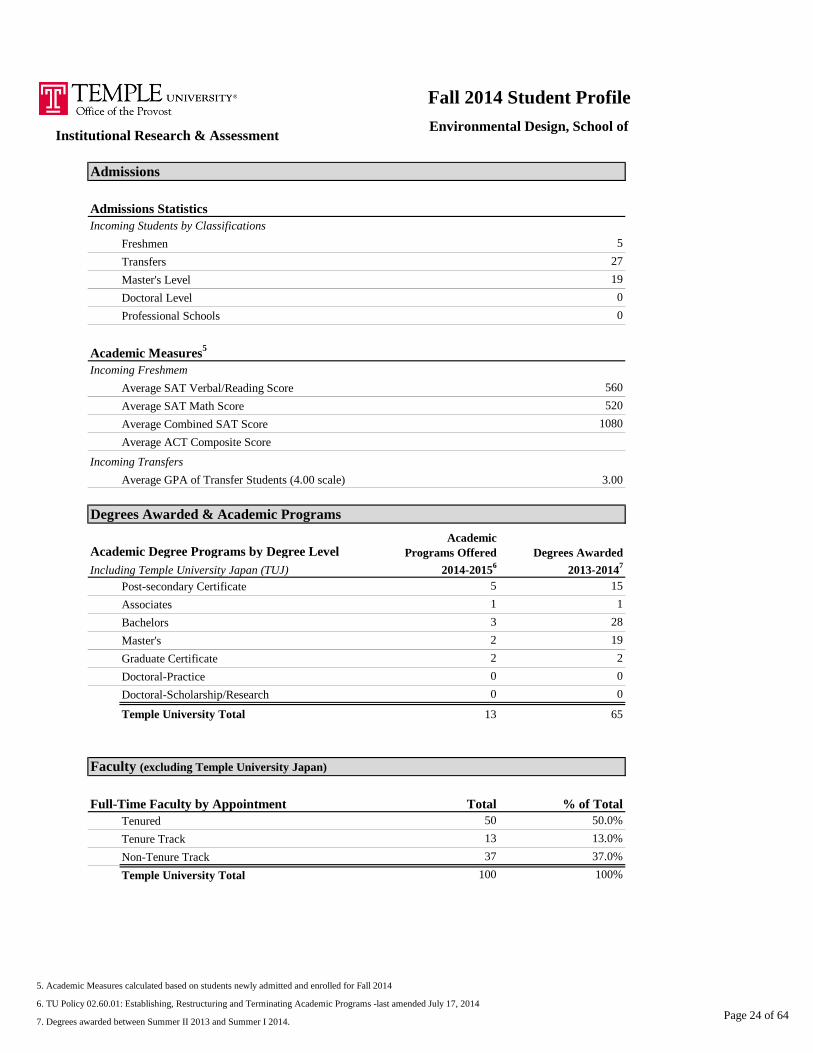
Admissions
Admissions Statistics
Incoming Students by Classifications
Freshmen
Transfers
Master's Level
Doctoral Level
Professional Schools
Academic Measures6
Incoming Freshmem
Average SAT Verbal/Reading Score
Average SAT Math Score
Average Combined SAT Score
Average ACT Composite Score
Incoming Transfers
Average GPA of Transfer Students (4.00 scale)
Degrees Awarded & Academic Programs
Academic Degree Programs by Degree Level
Including Temple University Japan (TUJ)
Post-secondary Certificate
Associates
Bachelors
Master's
Graduate Certificate
Doctoral-Practice
Doctoral-Scholarship/Research
Temple University Total
Faculty (excluding Temple University Japan)
Full-Time Faculty by Appointment
Tenured
Tenure Track
Non-Tenure Track
Temple University Total
6. Academic Measures calculated based on students newly admitted and enrolled for Fall 2014
7. TU Policy 02.60.01: Establishing, Restructuring and Terminating Academic Programs -last amended July 17, 2014
8. Degrees awarded between July 1, 2013-June 30, 2014
568
1124
25
3.09
Academic
Programs Offered
2014-20157
Degrees Awarded
2013-20148
4,485
2,533
1,073
349
840
556
132 1,628
68 86
14 918
18 168
2 5
143 6,154
2,093 100%
737 35.2%
235 11.2%
1,121 53.6%
44 243
421 9,202
Total % of Total
Page 4 of 64
Enrollment
Total Enrollment3
Full-Time
Part-Time
Full-Time Equivalent (FTE) Students4
Enrollment by Class Level
Total Undergraduates
High Seniors (120+ Credit Hours)
Seniors
Juniors
Sophomores
Freshmen
Undergraduate Non-Degree Seeking (Certificate)
Undergraduate Non-Degree (Other)
Total Graduate/Professional
Master's Level
Doctoral-Research
Doctoral-Practice
Graduate Non-Degree (Certificate)
Graduate Non-Degree (Other)
Enrollment by Race/Ethnicity
American Indian/Alaska Native
Asian
African-American
Hispanic/Latino
Pacific Islander
White
Two or More Races
Unknown/Other
International
Enrollment by Gender
Male
Female
Unreported
Enrollment by Pennsylvania Residency
Pennsylvania Resident
Non-Resident
3. Enrollment figures are as of Census; Fall semester Drop/Add. This year's Fall Census was moved back one day to 9/9/2014
4. FTE is calculated as 1 FT + 1/3 PT. Students in Doctoral - Practice programs are considerd one FTE regardless of credit load.
Note: Temple University Japan excluded from this report, except where indicated.
1,332
1,231
85
283
281
301
Fall 2014 Student Profile
Art, Tyler School ofInstitutional Research & Assessment
1,391
1,303
88
0
0
8
Enrollment % of Total
0 0.0%
281
0
0
160
116
36
101 7.3%
1 0.1%
69 5.0%
61 4.4%
66 4.7%
66 4.7%
996 71.6%
31 2.2%
0 0.0%
Enrollment % of Total
987 71.0%
Enrollment % of Total
444 31.9%
947 68.1%
404 29.0%
Page 5 of 64
Fall 2014 Student Profile
Art, Tyler School ofInstitutional Research & Assessment
Admissions
Admissions Statistics
Incoming Students by Classifications
Freshmen
Transfers
Master's Level
Doctoral Level
Professional Schools
Academic Measures5
Incoming Freshmem
Average SAT Verbal/Reading Score
Average SAT Math Score
Average Combined SAT Score
Average ACT Composite Score
Incoming Transfers
Average GPA of Transfer Students (4.00 scale)
Degrees Awarded & Academic Programs
Academic Degree Programs by Degree Level
Including Temple University Japan (TUJ)
Post-secondary Certificate
Associates
Bachelors
Master's
Graduate Certificate
Doctoral-Practice
Doctoral-Scholarship/Research
Temple University Total
Faculty (excluding Temple University Japan)
Full-Time Faculty by Appointment
Tenured
Tenure Track
Non-Tenure Track
Temple University Total
5. Academic Measures calculated based on students newly admitted and enrolled for Fall 2014
6. TU Policy 02.60.01: Establishing, Restructuring and Terminating Academic Programs -last amended July 17, 2014
7. Degrees awarded between Summer II 2013 and Summer I 2014.
55
4
0
558
545
1103
238
103
0 0
14 325
11 38
24
3.25
Academic
Programs Offered
2014-20156
Degrees Awarded
2013-20147
1 5
28 373
Total % of Total
40 58.8%
1 0
0 0
1 5
12 17.6%
16 23.5%
68 100%
Page 6 of 64
Fall 2014 Student Profile
Art, Tyler School ofInstitutional Research & Assessment
Academic Program Enrollment
Academic Program
Architectural Preservation
Architecture
Architecture Undeclared
Art
Art Education
Art History
Ceramics-Glass
Facilities Management
Fibers and Materials Studies
Graphic and Interactive Design
Metals, Jewelry, CAD-CAM
Painting
Photography
Printmaking
Sculpture
Undeclared
Undeclared-Tyler School of Art
Visual Studies
8. Professional refers to those programs in the professional schools
Undergraduate Graduate Professional8
Total
14 0 0 14
5 0 0 5
66 14 0 80
87 23 0 110
121 0 0 121
37 0 0 37
20 4 0 24
49 57 0 106
35 8 0 43
52 13 0 65
21 6 0 27
105 7 0 112
49 5 0 54
0 7 0 7
418 1 0 419
21 6 0 27
33 9 0 42
0 0 0 0
0 0 0 0
98 0 0 98
0 0 0 0
0 0 0 0
0 0 0 0
0 0 0 0
0 0 0 0
0 0 0 0
0 0 0 0
0 0 0 0
0 0 0 0
0 0 0 0
0 0 0 0
0 0 0 0
0 0 0 0
0 0 0 0
0 0 0 0
0 0 0 0
0 0 0 0
0 0 0 0
0 0 0 0
0 0 0 0
0 0 0 0
Page 7 of 64
Enrollment
Total Enrollment3
Full-Time
Part-Time
Full-Time Equivalent (FTE) Students4
Enrollment by Class Level
Total Undergraduates
High Seniors (120+ Credit Hours)
Seniors
Juniors
Sophomores
Freshmen
Undergraduate Non-Degree Seeking (Certificate)
Undergraduate Non-Degree (Other)
Total Graduate/Professional
Master's Level
Doctoral-Research
Doctoral-Practice
Graduate Non-Degree (Certificate)
Graduate Non-Degree (Other)
Enrollment by Race/Ethnicity
American Indian/Alaska Native
Asian
African-American
Hispanic/Latino
Pacific Islander
White
Two or More Races
Unknown/Other
International
Enrollment by Gender
Male
Female
Unreported
Enrollment by Pennsylvania Residency
Pennsylvania Resident
Non-Resident
3. Enrollment figures are as of Census; Fall semester Drop/Add. This year's Fall Census was moved back one day to 9/9/2014
4. FTE is calculated as 1 FT + 1/3 PT. Students in Doctoral - Practice programs are considerd one FTE regardless of credit load.
Note: Temple University Japan excluded from this report, except where indicated.
6,651
6,455
469
1,548
1,748
1,489
Fall 2014 Student Profile
Business & Management, Fox School ofInstitutional Research & Assessment
7,503
6,225
1,278
29
21
25
Enrollment % of Total
23 0.3%
1,201
0
0
1,048
844
129
321 4.3%
10 0.1%
768 10.2%
726 9.7%
703 9.4%
948 12.6%
3,874 51.6%
130 1.7%
5 0.1%
Enrollment % of Total
5,484 73.1%
Enrollment % of Total
4,688 62.5%
2,810 37.5%
2,019 26.9%
Page 8 of 64
Fall 2014 Student Profile
Business & Management, Fox School ofInstitutional Research & Assessment
Admissions
Admissions Statistics
Incoming Students by Classifications
Freshmen
Transfers
Master's Level
Doctoral Level
Professional Schools
Academic Measures5
Incoming Freshmem
Average SAT Verbal/Reading Score
Average SAT Math Score
Average Combined SAT Score
Average ACT Composite Score
Incoming Transfers
Average GPA of Transfer Students (4.00 scale)
Degrees Awarded & Academic Programs
Academic Degree Programs by Degree Level
Including Temple University Japan (TUJ)
Post-secondary Certificate
Associates
Bachelors
Master's
Graduate Certificate
Doctoral-Practice
Doctoral-Scholarship/Research
Temple University Total
Faculty (excluding Temple University Japan)
Full-Time Faculty by Appointment
Tenured
Tenure Track
Non-Tenure Track
Temple University Total
5. Academic Measures calculated based on students newly admitted and enrolled for Fall 2014
6. TU Policy 02.60.01: Establishing, Restructuring and Terminating Academic Programs -last amended July 17, 2014
7. Degrees awarded between Summer II 2013 and Summer I 2014.
308
56
0
558
593
1151
828
666
0 0
13 1,332
22 410
25
3.08
Academic
Programs Offered
2014-20156
Degrees Awarded
2013-20147
3 11
61 1,781
Total % of Total
68 36.6%
20 1
1 0
2 27
33 17.7%
85 45.7%
186 100%
Page 9 of 64
Fall 2014 Student Profile
Business & Management, Fox School ofInstitutional Research & Assessment
Academic Program Enrollment
Academic Program
Accountancy
Accounting
Accounting + Financial Mgt
Actuarial Science
African American Studies
Business Administration
Business Management
Economics
Entrepreneurship
Entrprnrship & Innovation Mgt
Executive Program
Finance
Financial Analysis & Risk Mgmt
Financial Engineering
Human Resource Management
IT Auditing & Cyber Security
Innovation Mgt & Entreprnrship
International Business
Investment Management
Legal Studies
Management Information Systems
Marketing
Real Estate
Risk Management and Insurance
Statistics
Undeclared-Business & Mngt
8. Professional refers to those programs in the professional schools
Undergraduate Graduate Professional8
Total
0 32 0 32
317 32 0 349
1 0 0 1
1151 0 0 1151
0 1 0 1
166 0 0 166
181 0 0 181
0 587 0 587
730 0 0 730
991 0 0 991
0 39 0 39
7 0 0 7
0 110 0 110
0 42 0 42
0 17 0 17
0 12 0 12
240 36 0 276
189 0 0 189
312 1 0 313
463 0 0 463
0 37 0 37
322 0 0 322
0 59 0 59
912 18 0 930
23 0 0 23
0 0 0 0
0 0 0 0
450 25 0 475
0 0 0 0
0 0 0 0
0 0 0 0
0 0 0 0
0 0 0 0
0 0 0 0
0 0 0 0
0 0 0 0
0 0 0 0
0 0 0 0
0 0 0 0
0 0 0 0
0 0 0 0
Page 10 of 64
Enrollment
Total Enrollment3
Full-Time
Part-Time
Full-Time Equivalent (FTE) Students4
Enrollment by Class Level
Total Undergraduates
High Seniors (120+ Credit Hours)
Seniors
Juniors
Sophomores
Freshmen
Undergraduate Non-Degree Seeking (Certificate)
Undergraduate Non-Degree (Other)
Total Graduate/Professional
Master's Level
Doctoral-Research
Doctoral-Practice
Graduate Non-Degree (Certificate)
Graduate Non-Degree (Other)
Enrollment by Race/Ethnicity
American Indian/Alaska Native
Asian
African-American
Hispanic/Latino
Pacific Islander
White
Two or More Races
Unknown/Other
International
Enrollment by Gender
Male
Female
Unreported
Enrollment by Pennsylvania Residency
Pennsylvania Resident
Non-Resident
3. Enrollment figures are as of Census; Fall semester Drop/Add. This year's Fall Census was moved back one day to 9/9/2014
4. FTE is calculated as 1 FT + 1/3 PT. Students in Doctoral - Practice programs are considerd one FTE regardless of credit load.
Note: Temple University Japan excluded from this report, except where indicated.
863
848
28
221
227
188
Fall 2014 Student Profile
Theater, Film, and Media Arts, Division ofInstitutional Research & Assessment
912
839
73
0
0
1
Enrollment % of Total
1 0.1%
184
0
0
64
63
0
60 6.6%
0 0.0%
27 3.0%
97 10.6%
41 4.5%
58 6.4%
599 65.7%
29 3.2%
0 0.0%
Enrollment % of Total
614 67.3%
Enrollment % of Total
545 59.8%
367 40.2%
298 32.7%
Page 11 of 64
Fall 2014 Student Profile
Theater, Film, and Media Arts, Division ofInstitutional Research & Assessment
Admissions
Admissions Statistics
Incoming Students by Classifications
Freshmen
Transfers
Master's Level
Doctoral Level
Professional Schools
Academic Measures5
Incoming Freshmem
Average SAT Verbal/Reading Score
Average SAT Math Score
Average Combined SAT Score
Average ACT Composite Score
Incoming Transfers
Average GPA of Transfer Students (4.00 scale)
Degrees Awarded & Academic Programs
Academic Degree Programs by Degree Level
Including Temple University Japan (TUJ)
Post-secondary Certificate
Associates
Bachelors
Master's
Graduate Certificate
Doctoral-Practice
Doctoral-Scholarship/Research
Temple University Total
Faculty (excluding Temple University Japan)
Full-Time Faculty by Appointment
Tenured
Tenure Track
Non-Tenure Track
Temple University Total
5. Academic Measures calculated based on students newly admitted and enrolled for Fall 2014
6. TU Policy 02.60.01: Establishing, Restructuring and Terminating Academic Programs -last amended July 17, 2014
7. Degrees awarded between Summer II 2013 and Summer I 2014.
14
0
0
578
558
1136
127
73
0 0
2 210
5 14
27
3.20
Academic
Programs Offered
2014-20156
Degrees Awarded
2013-20147
0 0
8 224
Total % of Total
18 48.6%
1 0
0 0
0 0
7 18.9%
12 32.4%
37 100%
Page 12 of 64
Fall 2014 Student Profile
Theater, Film, and Media Arts, Division ofInstitutional Research & Assessment
Academic Program Enrollment
Academic Program
Film and Media Arts
Theater
Theater-Acting
Theater-Design
Theater-Directing
Theater-Playwriting
Undeclared-Center for the Arts
8. Professional refers to those programs in the professional schools
Undergraduate Graduate Professional8
Total
580 40 0 620
0 9 0 9
0 2 0 2
268 0 0 268
0 6 0 6
0 0 0 0
0 0 0 0
0 6 0 6
0 1 0 1
0 0 0 0
0 0 0 0
0 0 0 0
0 0 0 0
0 0 0 0
0 0 0 0
0 0 0 0
0 0 0 0
0 0 0 0
0 0 0 0
0 0 0 0
0 0 0 0
0 0 0 0
0 0 0 0
0 0 0 0
0 0 0 0
0 0 0 0
0 0 0 0
0 0 0 0
0 0 0 0
0 0 0 0
0 0 0 0
0 0 0 0
0 0 0 0
0 0 0 0
0 0 0 0
0 0 0 0
0 0 0 0
0 0 0 0
0 0 0 0
0 0 0 0
0 0 0 0
Page 13 of 64
Enrollment
Total Enrollment3
Full-Time
Part-Time
Full-Time Equivalent (FTE) Students4
Enrollment by Class Level
Total Undergraduates
High Seniors (120+ Credit Hours)
Seniors
Juniors
Sophomores
Freshmen
Undergraduate Non-Degree Seeking (Certificate)
Undergraduate Non-Degree (Other)
Total Graduate/Professional
Master's Level
Doctoral-Research
Doctoral-Practice
Graduate Non-Degree (Certificate)
Graduate Non-Degree (Other)
Enrollment by Race/Ethnicity
American Indian/Alaska Native
Asian
African-American
Hispanic/Latino
Pacific Islander
White
Two or More Races
Unknown/Other
International
Enrollment by Gender
Male
Female
Unreported
Enrollment by Pennsylvania Residency
Pennsylvania Resident
Non-Resident
3. Enrollment figures are as of Census; Fall semester Drop/Add. This year's Fall Census was moved back one day to 9/9/2014
4. FTE is calculated as 1 FT + 1/3 PT. Students in Doctoral - Practice programs are considerd one FTE regardless of credit load.
Note: Temple University Japan excluded from this report, except where indicated.
600
N/A
0
0
0
0
Fall 2014 Student Profile
Dentistry, Kornberg School ofInstitutional Research & Assessment
601
599
2
557
37
1
Enrollment % of Total
1 0.2%
0
0
0
601
6
0
8 1.3%
0 0.0%
112 18.6%
11 1.8%
229 38.1%
39 6.5%
201 33.4%
0 0.0%
2 0.3%
Enrollment % of Total
264 43.9%
Enrollment % of Total
327 54.4%
272 45.3%
337 56.1%
Page 14 of 64
Fall 2014 Student Profile
Dentistry, Kornberg School ofInstitutional Research & Assessment
Admissions
Admissions Statistics
Incoming Students by Classifications
Freshmen
Transfers
Master's Level
Doctoral Level
Professional Schools
Academic Measures5
Incoming Freshmem
Average SAT Verbal/Reading Score
Average SAT Math Score
Average Combined SAT Score
Average ACT Composite Score
Incoming Transfers
Average GPA of Transfer Students (4.00 scale)
Degrees Awarded & Academic Programs
Academic Degree Programs by Degree Level
Including Temple University Japan (TUJ)
Post-secondary Certificate
Associates
Bachelors
Master's
Graduate Certificate
Doctoral-Practice
Doctoral-Scholarship/Research
Temple University Total
Faculty (excluding Temple University Japan)
Full-Time Faculty by Appointment
Tenured
Tenure Track
Non-Tenure Track
Temple University Total
5. Academic Measures calculated based on students newly admitted and enrolled for Fall 2014
6. TU Policy 02.60.01: Establishing, Restructuring and Terminating Academic Programs -last amended July 17, 2014
7. Degrees awarded between Summer II 2013 and Summer I 2014.
12
0
139
0
0
0
0
0
0 0
0 0
1 7
0
0.00
Academic
Programs Offered
2014-20156
Degrees Awarded
2013-20147
0 0
9 147
Total % of Total
21 33.9%
5 13
3 127
0 0
3 4.8%
38 61.3%
62 100%
Page 15 of 64
Fall 2014 Student Profile
Dentistry, Kornberg School ofInstitutional Research & Assessment
Academic Program Enrollment
Academic Program
Adv Educ Gen Dentistry
Dental Public Health
Dentistry
Dentistry-Adv Faculty Program
Dentistry-Advanced Standing
Endodontics
Oral Biology
Orthodontics
Periodontics
Undeclared-Dentistry
8. Professional refers to those programs in the professional schools
Undergraduate Graduate Professional8
Total
0 2 0 2
0 0 1 1
0 0 37 37
0 1 0 1
0 0 519 519
0 12 0 12
0 12 0 12
0 10 0 10
0 6 0 6
0 0 0 0
0 0 0 0
0 1 0 1
0 0 0 0
0 0 0 0
0 0 0 0
0 0 0 0
0 0 0 0
0 0 0 0
0 0 0 0
0 0 0 0
0 0 0 0
0 0 0 0
0 0 0 0
0 0 0 0
0 0 0 0
0 0 0 0
0 0 0 0
0 0 0 0
0 0 0 0
0 0 0 0
0 0 0 0
0 0 0 0
0 0 0 0
0 0 0 0
0 0 0 0
0 0 0 0
0 0 0 0
0 0 0 0
0 0 0 0
0 0 0 0
0 0 0 0
Page 16 of 64
Enrollment
Total Enrollment3
Full-Time
Part-Time
Full-Time Equivalent (FTE) Students4
Enrollment by Class Level
Total Undergraduates
High Seniors (120+ Credit Hours)
Seniors
Juniors
Sophomores
Freshmen
Undergraduate Non-Degree Seeking (Certificate)
Undergraduate Non-Degree (Other)
Total Graduate/Professional
Master's Level
Doctoral-Research
Doctoral-Practice
Graduate Non-Degree (Certificate)
Graduate Non-Degree (Other)
Enrollment by Race/Ethnicity
American Indian/Alaska Native
Asian
African-American
Hispanic/Latino
Pacific Islander
White
Two or More Races
Unknown/Other
International
Enrollment by Gender
Male
Female
Unreported
Enrollment by Pennsylvania Residency
Pennsylvania Resident
Non-Resident
3. Enrollment figures are as of Census; Fall semester Drop/Add. This year's Fall Census was moved back one day to 9/9/2014
4. FTE is calculated as 1 FT + 1/3 PT. Students in Doctoral - Practice programs are considerd one FTE regardless of credit load.
Note: Temple University Japan excluded from this report, except where indicated.
1,501
1,167
166
325
290
175
Fall 2014 Student Profile
Education, College ofInstitutional Research & Assessment
2,048
1,227
821
0
101
169
Enrollment % of Total
4 0.2%
114
97
0
881
369
242
90 4.4%
2 0.1%
72 3.5%
293 14.3%
279 13.6%
21 1.0%
1,241 60.6%
46 2.2%
11 0.5%
Enrollment % of Total
1,767 86.3%
Enrollment % of Total
651 31.8%
1,386 67.7%
281 13.7%
Page 17 of 64
Fall 2014 Student Profile
Education, College ofInstitutional Research & Assessment
Admissions
Admissions Statistics
Incoming Students by Classifications
Freshmen
Transfers
Master's Level
Doctoral Level
Professional Schools
Academic Measures5
Incoming Freshmem
Average SAT Verbal/Reading Score
Average SAT Math Score
Average Combined SAT Score
Average ACT Composite Score
Incoming Transfers
Average GPA of Transfer Students (4.00 scale)
Degrees Awarded & Academic Programs
Academic Degree Programs by Degree Level
Including Temple University Japan (TUJ)
Post-secondary Certificate
Associates
Bachelors
Master's
Graduate Certificate
Doctoral-Practice
Doctoral-Scholarship/Research
Temple University Total
Faculty (excluding Temple University Japan)
Full-Time Faculty by Appointment
Tenured
Tenure Track
Non-Tenure Track
Temple University Total
5. Academic Measures calculated based on students newly admitted and enrolled for Fall 2014
6. TU Policy 02.60.01: Establishing, Restructuring and Terminating Academic Programs -last amended July 17, 2014
7. Degrees awarded between Summer II 2013 and Summer I 2014.
144
44
0
555
529
1084
73
104
0 0
10 344
13 212
23
3.09
Academic
Programs Offered
2014-20156
Degrees Awarded
2013-20147
1 0
37 628
Total % of Total
30 50.8%
9 35
0 0
4 37
7 11.9%
22 37.3%
59 100%
Page 18 of 64
Fall 2014 Student Profile
Education, College ofInstitutional Research & Assessment
Academic Program Enrollment
Academic Program
Adult & Organizational Develop
Applied Behavioral Analysis
Applied Communications
Career and Technical Education
Counseling Psychology
Curr, Instruct and Tech in Edu
Early Childhood Education
Education
Educational Administration
Educational Leadership
Educational Psychology
Elementary Education
English as a Second Language
Human Develop Commnty Engagemn
Instructional Learning Technlg
Leading & Learning Urban Schls
Middle Grades Education
School Psychology
Sec Ed-English Ed
Sec Ed-Math Ed
Sec Ed-Science Ed
Sec Ed-Social Studies
Sec Ed-World Langs Ed
Secondary Education
Special Education
Training & Organizl Developmt
Undeclared
Undeclared-Education
Urban Education
8. Professional refers to those programs in the professional schools
Undergraduate Graduate Professional8
Total
139 27 0 166
111 84 0 195
0 49 0 49
0 4 0 4
3 0 0 3
0 131 0 131
0 40 0 40
0 16 0 16
496 0 0 496
1 0 0 1
0 16 0 16
0 107 0 107
0 46 0 46
0 1 0 1
55 9 0 64
9 0 0 9
0 9 0 9
30 0 0 30
3 0 0 3
0 51 0 51
139 0 0 139
0 50 0 50
0 29 0 29
147 0 0 147
34 0 0 34
0 157 0 157
0 42 0 42
0 1 0 1
0 12 0 12
0 0 0 0
0 0 0 0
0 0 0 0
0 0 0 0
0 0 0 0
0 0 0 0
0 0 0 0
0 0 0 0
0 0 0 0
0 0 0 0
0 0 0 0
0 0 0 0
Page 19 of 64
Enrollment
Total Enrollment3
Full-Time
Part-Time
Full-Time Equivalent (FTE) Students4
Enrollment by Class Level
Total Undergraduates
High Seniors (120+ Credit Hours)
Seniors
Juniors
Sophomores
Freshmen
Undergraduate Non-Degree Seeking (Certificate)
Undergraduate Non-Degree (Other)
Total Graduate/Professional
Master's Level
Doctoral-Research
Doctoral-Practice
Graduate Non-Degree (Certificate)
Graduate Non-Degree (Other)
Enrollment by Race/Ethnicity
American Indian/Alaska Native
Asian
African-American
Hispanic/Latino
Pacific Islander
White
Two or More Races
Unknown/Other
International
Enrollment by Gender
Male
Female
Unreported
Enrollment by Pennsylvania Residency
Pennsylvania Resident
Non-Resident
3. Enrollment figures are as of Census; Fall semester Drop/Add. This year's Fall Census was moved back one day to 9/9/2014
4. FTE is calculated as 1 FT + 1/3 PT. Students in Doctoral - Practice programs are considerd one FTE regardless of credit load.
Note: Temple University Japan excluded from this report, except where indicated.
1,620
1,605
162
298
363
315
Fall 2014 Student Profile
Engineering, College ofInstitutional Research & Assessment
1,778
1,541
237
0
0
9
Enrollment % of Total
1 0.1%
467
0
0
173
92
72
91 5.1%
3 0.2%
204 11.5%
181 10.2%
97 5.5%
256 14.4%
911 51.2%
34 1.9%
3 0.2%
Enrollment % of Total
1,280 72.0%
Enrollment % of Total
1,471 82.7%
304 17.1%
498 28.0%
Page 20 of 64
Fall 2014 Student Profile
Engineering, College ofInstitutional Research & Assessment
Admissions
Admissions Statistics
Incoming Students by Classifications
Freshmen
Transfers
Master's Level
Doctoral Level
Professional Schools
Academic Measures5
Incoming Freshmem
Average SAT Verbal/Reading Score
Average SAT Math Score
Average Combined SAT Score
Average ACT Composite Score
Incoming Transfers
Average GPA of Transfer Students (4.00 scale)
Degrees Awarded & Academic Programs
Academic Degree Programs by Degree Level
Including Temple University Japan (TUJ)
Post-secondary Certificate
Associates
Bachelors
Master's
Graduate Certificate
Doctoral-Practice
Doctoral-Scholarship/Research
Temple University Total
Faculty (excluding Temple University Japan)
Full-Time Faculty by Appointment
Tenured
Tenure Track
Non-Tenure Track
Temple University Total
5. Academic Measures calculated based on students newly admitted and enrolled for Fall 2014
6. TU Policy 02.60.01: Establishing, Restructuring and Terminating Academic Programs -last amended July 17, 2014
7. Degrees awarded between Summer II 2013 and Summer I 2014.
37
16
0
560
605
1166
340
149
0 0
7 217
6 31
26
3.05
Academic
Programs Offered
2014-20156
Degrees Awarded
2013-20147
0 0
16 259
Total % of Total
23 40.4%
2 1
0 0
1 10
13 22.8%
21 36.8%
57 100%
Page 21 of 64
Fall 2014 Student Profile
Engineering, College ofInstitutional Research & Assessment
Academic Program Enrollment
Academic Program
Bioengineering
Civil Engineering
Construction Mgt Tech
Electrical Engineering
Engineering
Engineering Mangement
Engineering Technology
Environmental Enginrng
Mechanical Engineering
Undeclared
Undeclared-Engineering
8. Professional refers to those programs in the professional schools
Undergraduate Graduate Professional8
Total
141 19 0 160
280 31 0 311
124 72 0 196
311 11 0 322
103 0 0 103
0 13 0 13
498 12 0 510
0 6 0 6
84 0 0 84
0 0 0 0
0 0 0 0
0 1 0 1
64 8 0 72
0 0 0 0
0 0 0 0
0 0 0 0
0 0 0 0
0 0 0 0
0 0 0 0
0 0 0 0
0 0 0 0
0 0 0 0
0 0 0 0
0 0 0 0
0 0 0 0
0 0 0 0
0 0 0 0
0 0 0 0
0 0 0 0
0 0 0 0
0 0 0 0
0 0 0 0
0 0 0 0
0 0 0 0
0 0 0 0
0 0 0 0
0 0 0 0
0 0 0 0
0 0 0 0
0 0 0 0
0 0 0 0
Page 22 of 64
Enrollment
Total Enrollment3
Full-Time
Part-Time
Full-Time Equivalent (FTE) Students4
Enrollment by Class Level
Total Undergraduates
High Seniors (120+ Credit Hours)
Seniors
Juniors
Sophomores
Freshmen
Undergraduate Non-Degree Seeking (Certificate)
Undergraduate Non-Degree (Other)
Total Graduate/Professional
Master's Level
Doctoral-Research
Doctoral-Practice
Graduate Non-Degree (Certificate)
Graduate Non-Degree (Other)
Enrollment by Race/Ethnicity
American Indian/Alaska Native
Asian
African-American
Hispanic/Latino
Pacific Islander
White
Two or More Races
Unknown/Other
International
Enrollment by Gender
Male
Female
Unreported
Enrollment by Pennsylvania Residency
Pennsylvania Resident
Non-Resident
3. Enrollment figures are as of Census; Fall semester Drop/Add. This year's Fall Census was moved back one day to 9/9/2014
4. FTE is calculated as 1 FT + 1/3 PT. Students in Doctoral - Practice programs are considerd one FTE regardless of credit load.
Note: Temple University Japan excluded from this report, except where indicated.
183
146
16
37
39
42
Fall 2014 Student Profile
Environmental Design, School ofInstitutional Research & Assessment
223
163
60
0
2
6
Enrollment % of Total
0 0.0%
11
1
0
77
69
0
8 3.6%
1 0.4%
4 1.8%
14 6.3%
20 9.0%
8 3.6%
160 71.7%
8 3.6%
0 0.0%
Enrollment % of Total
188 84.3%
Enrollment % of Total
127 57.0%
96 43.0%
35 15.7%
Page 23 of 64
Fall 2014 Student Profile
Environmental Design, School ofInstitutional Research & Assessment
Admissions
Admissions Statistics
Incoming Students by Classifications
Freshmen
Transfers
Master's Level
Doctoral Level
Professional Schools
Academic Measures5
Incoming Freshmem
Average SAT Verbal/Reading Score
Average SAT Math Score
Average Combined SAT Score
Average ACT Composite Score
Incoming Transfers
Average GPA of Transfer Students (4.00 scale)
Degrees Awarded & Academic Programs
Academic Degree Programs by Degree Level
Including Temple University Japan (TUJ)
Post-secondary Certificate
Associates
Bachelors
Master's
Graduate Certificate
Doctoral-Practice
Doctoral-Scholarship/Research
Temple University Total
Faculty (excluding Temple University Japan)
Full-Time Faculty by Appointment
Tenured
Tenure Track
Non-Tenure Track
Temple University Total
5. Academic Measures calculated based on students newly admitted and enrolled for Fall 2014
6. TU Policy 02.60.01: Establishing, Restructuring and Terminating Academic Programs -last amended July 17, 2014
7. Degrees awarded between Summer II 2013 and Summer I 2014.
19
0
0
560
520
1080
5
27
1 1
3 28
2 19
0
3.00
Academic
Programs Offered
2014-20156
Degrees Awarded
2013-20147
5 15
13 65
Total % of Total
50 50.0%
2 2
0 0
0 0
13 13.0%
37 37.0%
100 100%
Page 24 of 64
Fall 2014 Student Profile
Environmental Design, School ofInstitutional Research & Assessment
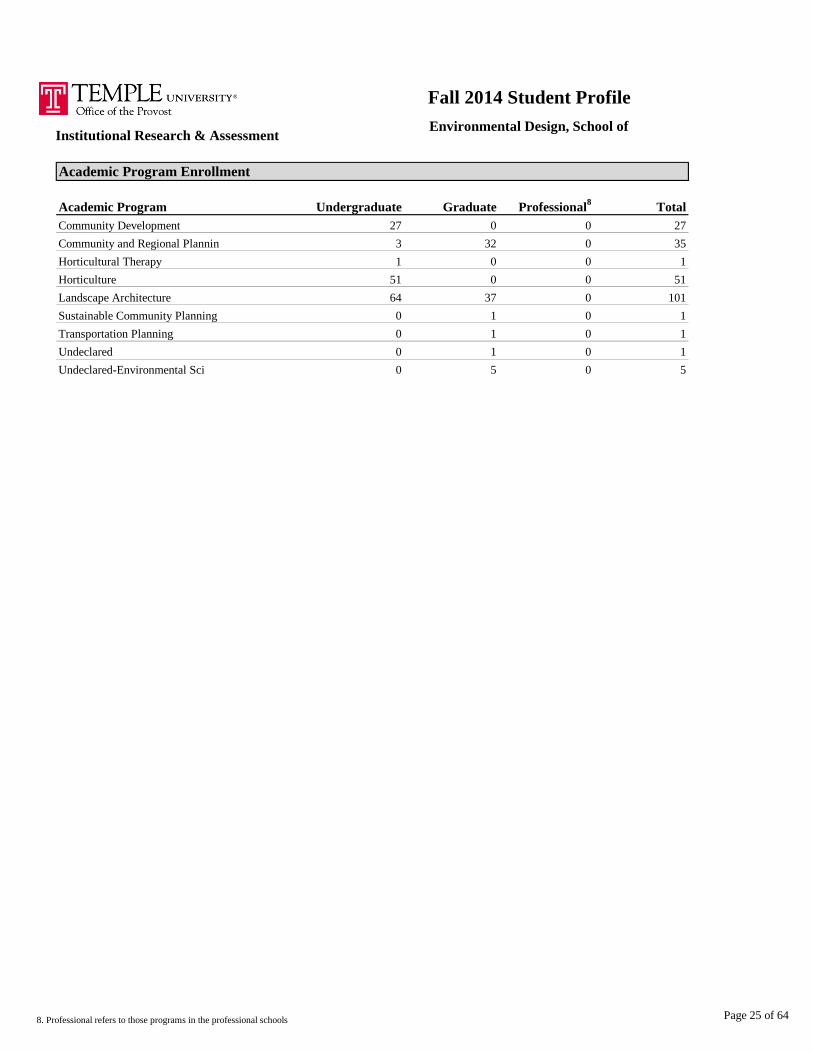
Academic Program Enrollment
Academic Program
Community Development
Community and Regional Plannin
Horticultural Therapy
Horticulture
Landscape Architecture
Sustainable Community Planning
Transportation Planning
Undeclared
Undeclared-Environmental Sci
8. Professional refers to those programs in the professional schools
Undergraduate Graduate Professional8
Total
27 0 0 27
51 0 0 51
64 37 0 101
3 32 0 35
1 0 0 1
0 1 0 1
0 5 0 5
0 1 0 1
0 1 0 1
0 0 0 0
0 0 0 0
0 0 0 0
0 0 0 0
0 0 0 0
0 0 0 0
0 0 0 0
0 0 0 0
0 0 0 0
0 0 0 0
0 0 0 0
0 0 0 0
0 0 0 0
0 0 0 0
0 0 0 0
0 0 0 0
0 0 0 0
0 0 0 0
0 0 0 0
0 0 0 0
0 0 0 0
0 0 0 0
0 0 0 0
0 0 0 0
0 0 0 0
0 0 0 0
0 0 0 0
0 0 0 0
0 0 0 0
0 0 0 0
0 0 0 0
0 0 0 0
Page 25 of 64
Enrollment
Total Enrollment3
Full-Time
Part-Time
Full-Time Equivalent (FTE) Students4
Enrollment by Class Level
Total Undergraduates
High Seniors (120+ Credit Hours)
Seniors
Juniors
Sophomores
Freshmen
Undergraduate Non-Degree Seeking (Certificate)
Undergraduate Non-Degree (Other)
Total Graduate/Professional
Master's Level
Doctoral-Research
Doctoral-Practice
Graduate Non-Degree (Certificate)
Graduate Non-Degree (Other)
Enrollment by Race/Ethnicity
American Indian/Alaska Native
Asian
African-American
Hispanic/Latino
Pacific Islander
White
Two or More Races
Unknown/Other
International
Enrollment by Gender
Male
Female
Unreported
Enrollment by Pennsylvania Residency
Pennsylvania Resident
Non-Resident
3. Enrollment figures are as of Census; Fall semester Drop/Add. This year's Fall Census was moved back one day to 9/9/2014
4. FTE is calculated as 1 FT + 1/3 PT. Students in Doctoral - Practice programs are considerd one FTE regardless of credit load.
Note: Temple University Japan excluded from this report, except where indicated.
3,306
2,933
206
710
715
690
Fall 2014 Student Profile
Public Health, College ofInstitutional Research & Assessment
3,689
3,114
575
284
3
79
Enrollment % of Total
7 0.2%
612
0
0
756
341
49
196 5.3%
4 0.1%
437 11.8%
524 14.2%
213 5.8%
43 1.2%
2,177 59.0%
88 2.4%
2 0.1%
Enrollment % of Total
2,899 78.6%
Enrollment % of Total
1,000 27.1%
2,687 72.8%
790 21.4%
Page 26 of 64
Fall 2014 Student Profile
Public Health, College ofInstitutional Research & Assessment
Admissions
Admissions Statistics
Incoming Students by Classifications
Freshmen
Transfers
Master's Level
Doctoral Level
Professional Schools
Academic Measures5
Incoming Freshmem
Average SAT Verbal/Reading Score
Average SAT Math Score
Average Combined SAT Score
Average ACT Composite Score
Incoming Transfers
Average GPA of Transfer Students (4.00 scale)
Degrees Awarded & Academic Programs
Academic Degree Programs by Degree Level
Including Temple University Japan (TUJ)
Post-secondary Certificate
Associates
Bachelors
Master's
Graduate Certificate
Doctoral-Practice
Doctoral-Scholarship/Research
Temple University Total
Faculty (excluding Temple University Japan)
Full-Time Faculty by Appointment
Tenured
Tenure Track
Non-Tenure Track
Temple University Total
5. Academic Measures calculated based on students newly admitted and enrolled for Fall 2014
6. TU Policy 02.60.01: Establishing, Restructuring and Terminating Academic Programs -last amended July 17, 2014
7. Degrees awarded between Summer II 2013 and Summer I 2014.
94
39
0
538
549
1087
463
207
0 0
8 539
13 168
23
3.13
Academic
Programs Offered
2014-20156
Degrees Awarded
2013-20147
1 0
39 843
Total % of Total
28 23.7%
6 6
5 119
6 11
9 7.6%
81 68.6%
118 100%
Page 27 of 64
Fall 2014 Student Profile
Public Health, College ofInstitutional Research & Assessment
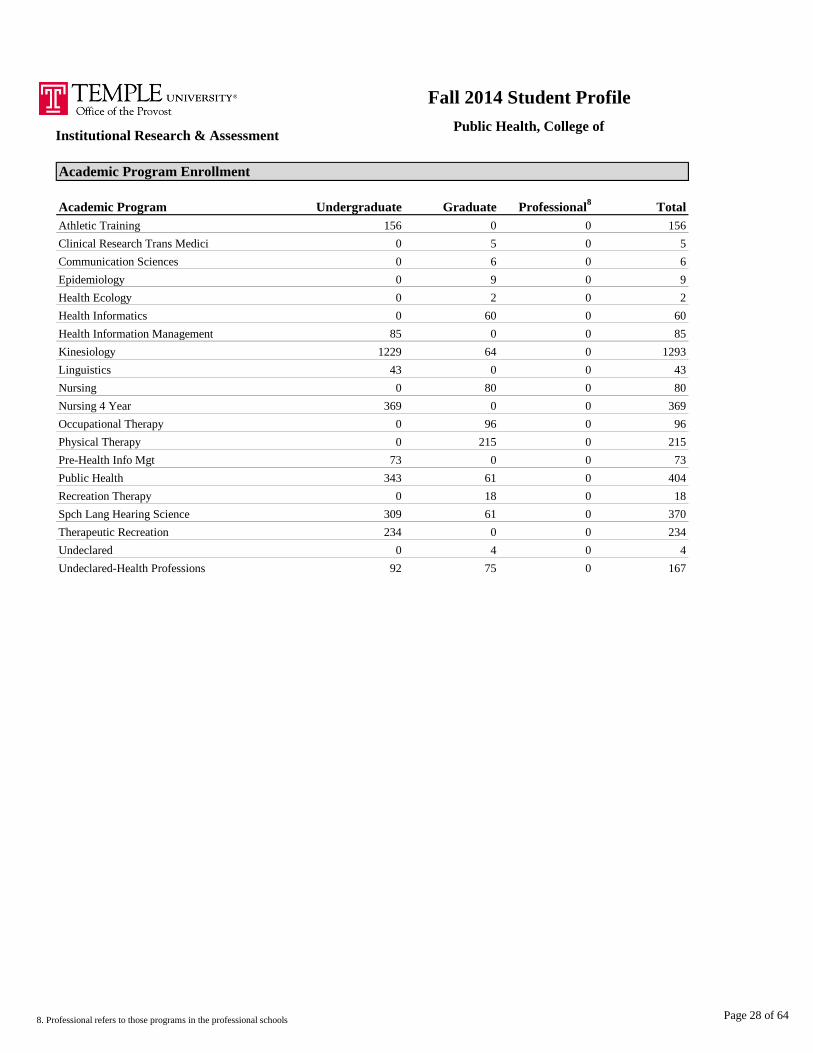
Academic Program Enrollment
Academic Program
Athletic Training
Clinical Research Trans Medici
Communication Sciences
Epidemiology
Health Ecology
Health Informatics
Health Information Management
Kinesiology
Linguistics
Nursing
Nursing 4 Year
Occupational Therapy
Physical Therapy
Pre-Health Info Mgt
Public Health
Recreation Therapy
Spch Lang Hearing Science
Therapeutic Recreation
Undeclared
Undeclared-Health Professions
8. Professional refers to those programs in the professional schools
Undergraduate Graduate Professional8
Total
156 0 0 156
0 9 0 9
0 2 0 2
0 5 0 5
0 6 0 6
1229 64 0 1293
43 0 0 43
0 60 0 60
85 0 0 85
0 96 0 96
0 215 0 215
0 80 0 80
369 0 0 369
0 18 0 18
309 61 0 370
73 0 0 73
343 61 0 404
92 75 0 167
0 0 0 0
234 0 0 234
0 4 0 4
0 0 0 0
0 0 0 0
0 0 0 0
0 0 0 0
0 0 0 0
0 0 0 0
0 0 0 0
0 0 0 0
0 0 0 0
0 0 0 0
0 0 0 0
0 0 0 0
0 0 0 0
0 0 0 0
0 0 0 0
0 0 0 0
0 0 0 0
0 0 0 0
0 0 0 0
0 0 0 0
Page 28 of 64
Enrollment
Total Enrollment3
Full-Time
Part-Time
Full-Time Equivalent (FTE) Students4
Enrollment by Class Level
Total Undergraduates
High Seniors (120+ Credit Hours)
Seniors
Juniors
Sophomores
Freshmen
Undergraduate Non-Degree Seeking (Certificate)
Undergraduate Non-Degree (Other)
Total Graduate/Professional
Master's Level
Doctoral-Research
Doctoral-Practice
Graduate Non-Degree (Certificate)
Graduate Non-Degree (Other)
Enrollment by Race/Ethnicity
American Indian/Alaska Native
Asian
African-American
Hispanic/Latino
Pacific Islander
White
Two or More Races
Unknown/Other
International
Enrollment by Gender
Male
Female
Unreported
Enrollment by Pennsylvania Residency
Pennsylvania Resident
Non-Resident
3. Enrollment figures are as of Census; Fall semester Drop/Add. This year's Fall Census was moved back one day to 9/9/2014
4. FTE is calculated as 1 FT + 1/3 PT. Students in Doctoral - Practice programs are considerd one FTE regardless of credit load.
Note: Temple University Japan excluded from this report, except where indicated.
919
N/A
0
0
0
0
Fall 2014 Student Profile
Law, Beasley School ofInstitutional Research & Assessment
975
836
139
723
2
35
Enrollment % of Total
3 0.3%
0
0
0
975
206
9
53 5.4%
0 0.0%
74 7.6%
82 8.4%
7 0.7%
158 16.2%
594 60.9%
4 0.4%
2 0.2%
Enrollment % of Total
623 63.9%
Enrollment % of Total
518 53.1%
455 46.7%
352 36.1%
Page 29 of 64
Fall 2014 Student Profile
Law, Beasley School ofInstitutional Research & Assessment
Admissions
Admissions Statistics
Incoming Students by Classifications
Freshmen
Transfers
Master's Level
Doctoral Level
Professional Schools
Academic Measures5
Incoming Freshmem
Average SAT Verbal/Reading Score
Average SAT Math Score
Average Combined SAT Score
Average ACT Composite Score
Incoming Transfers
Average GPA of Transfer Students (4.00 scale)
Degrees Awarded & Academic Programs
Academic Degree Programs by Degree Level
Including Temple University Japan (TUJ)
Post-secondary Certificate
Associates
Bachelors
Master's
Graduate Certificate
Doctoral-Practice
Doctoral-Scholarship/Research
Temple University Total
Faculty (excluding Temple University Japan)
Full-Time Faculty by Appointment
Tenured
Tenure Track
Non-Tenure Track
Temple University Total
5. Academic Measures calculated based on students newly admitted and enrolled for Fall 2014
6. TU Policy 02.60.01: Establishing, Restructuring and Terminating Academic Programs -last amended July 17, 2014
7. Degrees awarded between Summer II 2013 and Summer I 2014.
0
0
215
0
0
0
0
0
0 0
0 0
7 110
0
0.00
Academic
Programs Offered
2014-20156
Degrees Awarded
2013-20147
0 0
15 368
Total % of Total
38 65.5%
6 0
1 258
1 0
3 5.2%
17 29.3%
58 100%
Page 30 of 64
Fall 2014 Student Profile
Law, Beasley School ofInstitutional Research & Assessment
Academic Program Enrollment
Academic Program
American-Internl Law--China
American-Internl law
American-Intl Law--Transnation
Employee Benefits Law
Estate Planning
Graduate Tax
Law
Law--Cross Registration
Law--Full Time
Law--Part Time
Master of Laws Legal Education
Trial Advocacy
8. Professional refers to those programs in the professional schools
Undergraduate Graduate Professional8
Total
0 101 0 101
0 1 0 1
0 3 0 3
0 45 0 45
0 3 0 3
0 22 3 25
0 0 539 539
0 46 0 46
0 10 51 61
0 16 0 16
0 0 0 0
0 0 134 134
0 1 0 1
0 0 0 0
0 0 0 0
0 0 0 0
0 0 0 0
0 0 0 0
0 0 0 0
0 0 0 0
0 0 0 0
0 0 0 0
0 0 0 0
0 0 0 0
0 0 0 0
0 0 0 0
0 0 0 0
0 0 0 0
0 0 0 0
0 0 0 0
0 0 0 0
0 0 0 0
0 0 0 0
0 0 0 0
0 0 0 0
0 0 0 0
0 0 0 0
0 0 0 0
0 0 0 0
0 0 0 0
0 0 0 0
Page 31 of 64
Enrollment
Total Enrollment3
Full-Time
Part-Time
Full-Time Equivalent (FTE) Students4
Enrollment by Class Level
Total Undergraduates
High Seniors (120+ Credit Hours)
Seniors
Juniors
Sophomores
Freshmen
Undergraduate Non-Degree Seeking (Certificate)
Undergraduate Non-Degree (Other)
Total Graduate/Professional
Master's Level
Doctoral-Research
Doctoral-Practice
Graduate Non-Degree (Certificate)
Graduate Non-Degree (Other)
Enrollment by Race/Ethnicity
American Indian/Alaska Native
Asian
African-American
Hispanic/Latino
Pacific Islander
White
Two or More Races
Unknown/Other
International
Enrollment by Gender
Male
Female
Unreported
Enrollment by Pennsylvania Residency
Pennsylvania Resident
Non-Resident
3. Enrollment figures are as of Census; Fall semester Drop/Add. This year's Fall Census was moved back one day to 9/9/2014
4. FTE is calculated as 1 FT + 1/3 PT. Students in Doctoral - Practice programs are considerd one FTE regardless of credit load.
Note: Temple University Japan excluded from this report, except where indicated.
4,785
4,424
206
1,223
1,182
953
Fall 2014 Student Profile
Liberal Arts, College ofInstitutional Research & Assessment
5,152
4,601
551
0
0
18
Enrollment % of Total
7 0.1%
859
1
0
728
129
581
379 7.4%
6 0.1%
290 5.6%
823 16.0%
249 4.8%
130 2.5%
3,093 60.0%
175 3.4%
5 0.1%
Enrollment % of Total
3,915 76.0%
Enrollment % of Total
2,187 42.4%
2,960 57.5%
1,237 24.0%
Page 32 of 64
Fall 2014 Student Profile
Liberal Arts, College ofInstitutional Research & Assessment
Admissions
Admissions Statistics
Incoming Students by Classifications
Freshmen
Transfers
Master's Level
Doctoral Level
Professional Schools
Academic Measures5
Incoming Freshmem
Average SAT Verbal/Reading Score
Average SAT Math Score
Average Combined SAT Score
Average ACT Composite Score
Incoming Transfers
Average GPA of Transfer Students (4.00 scale)
Degrees Awarded & Academic Programs
Academic Degree Programs by Degree Level
Including Temple University Japan (TUJ)
Post-secondary Certificate
Associates
Bachelors
Master's
Graduate Certificate
Doctoral-Practice
Doctoral-Scholarship/Research
Temple University Total
Faculty (excluding Temple University Japan)
Full-Time Faculty by Appointment
Tenured
Tenure Track
Non-Tenure Track
Temple University Total
5. Academic Measures calculated based on students newly admitted and enrolled for Fall 2014
6. TU Policy 02.60.01: Establishing, Restructuring and Terminating Academic Programs -last amended July 17, 2014
7. Degrees awarded between Summer II 2013 and Summer I 2014.
53
92
0
572
559
1131
616
467
1 4
32 1,461
15 92
25
3.07
Academic
Programs Offered
2014-20156
Degrees Awarded
2013-20147
3 125
67 1,761
Total % of Total
144 45.7%
2 4
0 0
14 75
39 12.4%
132 41.9%
315 100%
Page 33 of 64
Fall 2014 Student Profile
Liberal Arts, College ofInstitutional Research & Assessment
Academic Program Enrollment
Academic Program
African American Studies
American Studies
Anthropology
Asian Studies
Classics
Creative Writing
Criminal Justice
Economics
English
Environmental Studies
French
General Program
Geography/Urban Studies
German
Greek and Roman Classics
History
Interdisplinary--CLA
International Affairs
Intrnl Bus - TUJ
Italian
Jewish Studies
Latin American Studies
Liberal Arts
Mathematical Economics
Neuroscience
Neuroscience:Cell & Molecular
Philosophy
Political Science
Psychological Studies
Psychology
Psychology Neuroscience
Religion
Russian
Sociology
Span & Lat Stds-Hlth & Hum Svc
Spanish
Undeclared-Liberal Arts
Urban Studies
Womens Studies
8. Professional refers to those programs in the professional schools
Undergraduate Graduate Professional8
Total
33 33 0 66
30 0 0 30
16 0 0 16
5 0 0 5
158 42 0 200
115 55 0 170
349 60 0 409
0 24 0 24
777 34 0 811
2 0 0 2
71 27 0 98
104 0 0 104
18 0 0 18
197 91 0 288
1 0 0 1
10 0 0 10
1 0 0 1
6 0 0 6
4 0 0 4
1 0 0 1
1 0 0 1
10 0 0 10
236 0 0 236
7 0 0 7
0 23 0 23
394 47 0 441
1 0 0 1
1 0 0 1
71 42 0 113
21 60 0 81
2 0 0 2
1312 95 0 1407
0 2 0 2
70 31 0 101
239 17 0 256
137 44 0 181
1 0 0 1
0 0 0 0
0 0 0 0
0 1 0 1
23 0 0 23
Page 34 of 64
Enrollment
Total Enrollment3
Full-Time
Part-Time
Full-Time Equivalent (FTE) Students4
Enrollment by Class Level
Total Undergraduates
High Seniors (120+ Credit Hours)
Seniors
Juniors
Sophomores
Freshmen
Undergraduate Non-Degree Seeking (Certificate)
Undergraduate Non-Degree (Other)
Total Graduate/Professional
Master's Level
Doctoral-Research
Doctoral-Practice
Graduate Non-Degree (Certificate)
Graduate Non-Degree (Other)
Enrollment by Race/Ethnicity
American Indian/Alaska Native
Asian
African-American
Hispanic/Latino
Pacific Islander
White
Two or More Races
Unknown/Other
International
Enrollment by Gender
Male
Female
Unreported
Enrollment by Pennsylvania Residency
Pennsylvania Resident
Non-Resident
3. Enrollment figures are as of Census; Fall semester Drop/Add. This year's Fall Census was moved back one day to 9/9/2014
4. FTE is calculated as 1 FT + 1/3 PT. Students in Doctoral - Practice programs are considerd one FTE regardless of credit load.
Note: Temple University Japan excluded from this report, except where indicated.
2,766
2,787
99
776
807
630
Fall 2014 Student Profile
Media and Communication, School ofInstitutional Research & Assessment
2,925
2,686
239
0
0
15
Enrollment % of Total
1 0.0%
470
0
5
138
68
55
176 6.0%
2 0.1%
95 3.2%
471 16.1%
144 4.9%
93 3.2%
1,860 63.6%
83 2.8%
0 0.0%
Enrollment % of Total
2,162 73.9%
Enrollment % of Total
1,149 39.3%
1,776 60.7%
763 26.1%
Page 35 of 64
Fall 2014 Student Profile
Media and Communication, School ofInstitutional Research & Assessment
Admissions
Admissions Statistics
Incoming Students by Classifications
Freshmen
Transfers
Master's Level
Doctoral Level
Professional Schools
Academic Measures5
Incoming Freshmem
Average SAT Verbal/Reading Score
Average SAT Math Score
Average Combined SAT Score
Average ACT Composite Score
Incoming Transfers
Average GPA of Transfer Students (4.00 scale)
Degrees Awarded & Academic Programs
Academic Degree Programs by Degree Level
Including Temple University Japan (TUJ)
Post-secondary Certificate
Associates
Bachelors
Master's
Graduate Certificate
Doctoral-Practice
Doctoral-Scholarship/Research
Temple University Total
Faculty (excluding Temple University Japan)
Full-Time Faculty by Appointment
Tenured
Tenure Track
Non-Tenure Track
Temple University Total
5. Academic Measures calculated based on students newly admitted and enrolled for Fall 2014
6. TU Policy 02.60.01: Establishing, Restructuring and Terminating Academic Programs -last amended July 17, 2014
7. Degrees awarded between Summer II 2013 and Summer I 2014.
27
10
0
564
545
1109
339
222
0 0
6 828
4 33
24
2.99
Academic
Programs Offered
2014-20156
Degrees Awarded
2013-20147
0 0
12 870
Total % of Total
17 28.3%
1 0
0 0
1 9
12 20.0%
31 51.7%
60 100%
Page 36 of 64
Fall 2014 Student Profile
Media and Communication, School ofInstitutional Research & Assessment
Academic Program Enrollment
Academic Program
Advertising
Broadcasting/Telecom/Mass Medi
Communication Management
Communication Studies
Communications
Globaliztn & Dev Communication
Journalism
Mass Media and Communication
Media & Communication
Media Studies and Production
Strategic Communication
Strategic-Organizational Comm
Undeclared
Undeclared-Media and Comm
8. Professional refers to those programs in the professional schools
Undergraduate Graduate Professional8
Total
499 0 0 499
285 0 0 285
6 0 0 6
227 5 0 232
0 25 0 25
0 45 0 45
0 10 0 10
0 5 0 5
597 17 0 614
14 0 0 14
0 14 0 14
645 16 0 661
469 0 0 469
0 0 0 0
0 0 0 0
45 1 0 46
0 0 0 0
0 0 0 0
0 0 0 0
0 0 0 0
0 0 0 0
0 0 0 0
0 0 0 0
0 0 0 0
0 0 0 0
0 0 0 0
0 0 0 0
0 0 0 0
0 0 0 0
0 0 0 0
0 0 0 0
0 0 0 0
0 0 0 0
0 0 0 0
0 0 0 0
0 0 0 0
0 0 0 0
0 0 0 0
0 0 0 0
0 0 0 0
0 0 0 0
Page 37 of 64
Enrollment
Total Enrollment3
Full-Time
Part-Time
Full-Time Equivalent (FTE) Students4
Enrollment by Class Level
Total Undergraduates
High Seniors (120+ Credit Hours)
Seniors
Juniors
Sophomores
Freshmen
Undergraduate Non-Degree Seeking (Certificate)
Undergraduate Non-Degree (Other)
Total Graduate/Professional
Master's Level
Doctoral-Research
Doctoral-Practice
Graduate Non-Degree (Certificate)
Graduate Non-Degree (Other)
Enrollment by Race/Ethnicity
American Indian/Alaska Native
Asian
African-American
Hispanic/Latino
Pacific Islander
White
Two or More Races
Unknown/Other
International
Enrollment by Gender
Male
Female
Unreported
Enrollment by Pennsylvania Residency
Pennsylvania Resident
Non-Resident
3. Enrollment figures are as of Census; Fall semester Drop/Add. This year's Fall Census was moved back one day to 9/9/2014
4. FTE is calculated as 1 FT + 1/3 PT. Students in Doctoral - Practice programs are considerd one FTE regardless of credit load.
Note: Temple University Japan excluded from this report, except where indicated.
1,076
N/A
0
0
0
0
Fall 2014 Student Profile
Medicine, School ofInstitutional Research & Assessment
1,089
1,069
20
878
17
53
Enrollment % of Total
0 0.0%
0
0
0
1,089
18
123
76 7.0%
2 0.2%
191 17.5%
57 5.2%
67 6.2%
40 3.7%
630 57.9%
26 2.4%
3 0.3%
Enrollment % of Total
603 55.4%
Enrollment % of Total
569 52.2%
517 47.5%
486 44.6%
Page 38 of 64
Fall 2014 Student Profile
Medicine, School ofInstitutional Research & Assessment
Admissions
Admissions Statistics
Incoming Students by Classifications
Freshmen
Transfers
Master's Level
Doctoral Level
Professional Schools
Academic Measures5
Incoming Freshmem
Average SAT Verbal/Reading Score
Average SAT Math Score
Average Combined SAT Score
Average ACT Composite Score
Incoming Transfers
Average GPA of Transfer Students (4.00 scale)
Degrees Awarded & Academic Programs
Academic Degree Programs by Degree Level
Including Temple University Japan (TUJ)
Post-secondary Certificate
Associates
Bachelors
Master's
Graduate Certificate
Doctoral-Practice
Doctoral-Scholarship/Research
Temple University Total
Faculty (excluding Temple University Japan)
Full-Time Faculty by Appointment
Tenured
Tenure Track
Non-Tenure Track
Temple University Total
5. Academic Measures calculated based on students newly admitted and enrolled for Fall 2014
6. TU Policy 02.60.01: Establishing, Restructuring and Terminating Academic Programs -last amended July 17, 2014
7. Degrees awarded between Summer II 2013 and Summer I 2014.
18
20
232
0
0
0
0
0
0 0
0 0
3 13
0
0.00
Academic
Programs Offered
2014-20156
Degrees Awarded
2013-20147
0 0
7 209
Total % of Total
109 18.9%
1 0
1 172
2 24
34 5.9%
433 75.2%
576 100%
Page 39 of 64
Fall 2014 Student Profile
Medicine, School ofInstitutional Research & Assessment
Academic Program Enrollment
Academic Program
Advanced Core Medical Science
Basic Core Medical Science
Biochemistry
Biomedical Neuroscience
Biomedical Sciences
Cell Biology
Medicine
Medicine Combination
Microbiology-Immunology
Molecular Biology-Genetics
Molecular and Cellular Phys
Pathology
Pharmacology
Urban Bioethics
8. Professional refers to those programs in the professional schools
Undergraduate Graduate Professional8
Total
0 34 0 34
0 4 0 4
0 84 0 84
0 19 0 19
0 7 0 7
0 0 11 11
0 12 0 12
0 6 0 6
0 0 867 867
0 3 0 3
0 8 0 8
0 8 0 8
0 5 0 5
0 0 0 0
0 0 0 0
0 21 0 21
0 0 0 0
0 0 0 0
0 0 0 0
0 0 0 0
0 0 0 0
0 0 0 0
0 0 0 0
0 0 0 0
0 0 0 0
0 0 0 0
0 0 0 0
0 0 0 0
0 0 0 0
0 0 0 0
0 0 0 0
0 0 0 0
0 0 0 0
0 0 0 0
0 0 0 0
0 0 0 0
0 0 0 0
0 0 0 0
0 0 0 0
0 0 0 0
0 0 0 0
Page 40 of 64
Enrollment
Total Enrollment3
Full-Time
Part-Time
Full-Time Equivalent (FTE) Students4
Enrollment by Class Level
Total Undergraduates
High Seniors (120+ Credit Hours)
Seniors
Juniors
Sophomores
Freshmen
Undergraduate Non-Degree Seeking (Certificate)
Undergraduate Non-Degree (Other)
Total Graduate/Professional
Master's Level
Doctoral-Research
Doctoral-Practice
Graduate Non-Degree (Certificate)
Graduate Non-Degree (Other)
Enrollment by Race/Ethnicity
American Indian/Alaska Native
Asian
African-American
Hispanic/Latino
Pacific Islander
White
Two or More Races
Unknown/Other
International
Enrollment by Gender
Male
Female
Unreported
Enrollment by Pennsylvania Residency
Pennsylvania Resident
Non-Resident
3. Enrollment figures are as of Census; Fall semester Drop/Add. This year's Fall Census was moved back one day to 9/9/2014
4. FTE is calculated as 1 FT + 1/3 PT. Students in Doctoral - Practice programs are considerd one FTE regardless of credit load.
Note: Temple University Japan excluded from this report, except where indicated.
738
523
55
89
105
121
Fall 2014 Student Profile
Music and Dance, Boyer College ofInstitutional Research & Assessment
787
713
74
32
0
6
Enrollment % of Total
0 0.0%
145
6
2
264
186
40
47 6.0%
0 0.0%
46 5.8%
48 6.1%
45 5.7%
99 12.6%
474 60.2%
28 3.6%
2 0.3%
Enrollment % of Total
399 50.7%
Enrollment % of Total
341 43.3%
444 56.4%
388 49.3%
Page 41 of 64
Fall 2014 Student Profile
Music and Dance, Boyer College ofInstitutional Research & Assessment
Admissions
Admissions Statistics
Incoming Students by Classifications
Freshmen
Transfers
Master's Level
Doctoral Level
Professional Schools
Academic Measures5
Incoming Freshmem
Average SAT Verbal/Reading Score
Average SAT Math Score
Average Combined SAT Score
Average ACT Composite Score
Incoming Transfers
Average GPA of Transfer Students (4.00 scale)
Degrees Awarded & Academic Programs
Academic Degree Programs by Degree Level
Including Temple University Japan (TUJ)
Post-secondary Certificate
Associates
Bachelors
Master's
Graduate Certificate
Doctoral-Practice
Doctoral-Scholarship/Research
Temple University Total
Faculty (excluding Temple University Japan)
Full-Time Faculty by Appointment
Tenured
Tenure Track
Non-Tenure Track
Temple University Total
5. Academic Measures calculated based on students newly admitted and enrolled for Fall 2014
6. TU Policy 02.60.01: Establishing, Restructuring and Terminating Academic Programs -last amended July 17, 2014
7. Degrees awarded between Summer II 2013 and Summer I 2014.
72
19
0
589
596
1185
130
23
0 0
13 106
15 64
27
3.24
Academic
Programs Offered
2014-20156
Degrees Awarded
2013-20147
1 0
35 181
Total % of Total
33 62.3%
1 0
1 4
4 7
10 18.9%
10 18.9%
53 100%
Page 42 of 64
Fall 2014 Student Profile
Music and Dance, Boyer College ofInstitutional Research & Assessment
Academic Program Enrollment
Academic Program
Choral Conducting
Composition-Music
Dance
Instrument Condctng Wind Band
Jazz Studies Composition
Jazz Studies Performance
Music
Music Education
Music Education Jazz
Music History
Music Theory
Music Therapy
Music Therapy Jazz
Opera
Performance
Piano Accp-Chmbr Music
Piano Accp-Opera Coach
Piano Pedagogy
String Pedagogy
Theory
Undeclared
Undeclared-Boyer College
8. Professional refers to those programs in the professional schools
Undergraduate Graduate Professional8
Total
0 6 0 6
0 1 0 1
5 0 0 5
8 6 0 14
65 40 0 105
116 29 0 145
24 0 0 24
75 0 0 75
25 3 0 28
68 35 0 103
4 0 0 4
1 4 0 5
0 2 0 2
0 2 0 2
0 1 0 1
0 2 0 2
116 121 0 237
15 0 0 15
0 3 0 3
0 2 0 2
0 4 0 4
0 0 0 0
0 0 0 0
1 3 0 4
0 0 0 0
0 0 0 0
0 0 0 0
0 0 0 0
0 0 0 0
0 0 0 0
0 0 0 0
0 0 0 0
0 0 0 0
0 0 0 0
0 0 0 0
0 0 0 0
0 0 0 0
0 0 0 0
0 0 0 0
0 0 0 0
0 0 0 0
Page 43 of 64
Enrollment
Total Enrollment3
Full-Time
Part-Time
Full-Time Equivalent (FTE) Students4
Enrollment by Class Level
Total Undergraduates
High Seniors (120+ Credit Hours)
Seniors
Juniors
Sophomores
Freshmen
Undergraduate Non-Degree Seeking (Certificate)
Undergraduate Non-Degree (Other)
Total Graduate/Professional
Master's Level
Doctoral-Research
Doctoral-Practice
Graduate Non-Degree (Certificate)
Graduate Non-Degree (Other)
Enrollment by Race/Ethnicity
American Indian/Alaska Native
Asian
African-American
Hispanic/Latino
Pacific Islander
White
Two or More Races
Unknown/Other
International
Enrollment by Gender
Male
Female
Unreported
Enrollment by Pennsylvania Residency
Pennsylvania Resident
Non-Resident
3. Enrollment figures are as of Census; Fall semester Drop/Add. This year's Fall Census was moved back one day to 9/9/2014
4. FTE is calculated as 1 FT + 1/3 PT. Students in Doctoral - Practice programs are considerd one FTE regardless of credit load.
Note: Temple University Japan excluded from this report, except where indicated.
762
N/A
0
0
0
0
Fall 2014 Student Profile
Pharmacy, School ofInstitutional Research & Assessment
994
646
348
595
36
120
Enrollment % of Total
3 0.3%
0
0
0
994
215
28
14 1.4%
0 0.0%
205 20.6%
50 5.0%
349 35.1%
101 10.2%
262 26.4%
10 1.0%
6 0.6%
Enrollment % of Total
562 56.5%
Enrollment % of Total
401 40.3%
587 59.1%
432 43.5%
Page 44 of 64
Fall 2014 Student Profile
Pharmacy, School ofInstitutional Research & Assessment
Admissions
Admissions Statistics
Incoming Students by Classifications
Freshmen
Transfers
Master's Level
Doctoral Level
Professional Schools
Academic Measures5
Incoming Freshmem
Average SAT Verbal/Reading Score
Average SAT Math Score
Average Combined SAT Score
Average ACT Composite Score
Incoming Transfers
Average GPA of Transfer Students (4.00 scale)
Degrees Awarded & Academic Programs
Academic Degree Programs by Degree Level
Including Temple University Japan (TUJ)
Post-secondary Certificate
Associates
Bachelors
Master's
Graduate Certificate
Doctoral-Practice
Doctoral-Scholarship/Research
Temple University Total
Faculty (excluding Temple University Japan)
Full-Time Faculty by Appointment
Tenured
Tenure Track
Non-Tenure Track
Temple University Total
5. Academic Measures calculated based on students newly admitted and enrolled for Fall 2014
6. TU Policy 02.60.01: Establishing, Restructuring and Terminating Academic Programs -last amended July 17, 2014
7. Degrees awarded between Summer II 2013 and Summer I 2014.
45
7
154
0
0
0
0
0
0 0
0 0
2 79
0
0.00
Academic
Programs Offered
2014-20156
Degrees Awarded
2013-20147
0 0
11 242
Total % of Total
10 23.8%
7 19
1 138
1 6
4 9.5%
28 66.7%
42 100%
Page 45 of 64
Fall 2014 Student Profile
Pharmacy, School ofInstitutional Research & Assessment
Academic Program Enrollment
Academic Program
Pharmaceutical Science
Pharmaceutics
Pharmacy
Qual Assur / Reg Affrs
Undeclared-Pharmacy
8. Professional refers to those programs in the professional schools
Undergraduate Graduate Professional8
Total
0 48 0 48
0 235 0 235
0 115 0 115
0 1 0 1
0 0 595 595
0 0 0 0
0 0 0 0
0 0 0 0
0 0 0 0
0 0 0 0
0 0 0 0
0 0 0 0
0 0 0 0
0 0 0 0
0 0 0 0
0 0 0 0
0 0 0 0
0 0 0 0
0 0 0 0
0 0 0 0
0 0 0 0
0 0 0 0
0 0 0 0
0 0 0 0
0 0 0 0
0 0 0 0
0 0 0 0
0 0 0 0
0 0 0 0
0 0 0 0
0 0 0 0
0 0 0 0
0 0 0 0
0 0 0 0
0 0 0 0
0 0 0 0
0 0 0 0
0 0 0 0
0 0 0 0
0 0 0 0
0 0 0 0
Page 46 of 64
Enrollment
Total Enrollment3
Full-Time
Part-Time
Full-Time Equivalent (FTE) Students4
Enrollment by Class Level
Total Undergraduates
High Seniors (120+ Credit Hours)
Seniors
Juniors
Sophomores
Freshmen
Undergraduate Non-Degree Seeking (Certificate)
Undergraduate Non-Degree (Other)
Total Graduate/Professional
Master's Level
Doctoral-Research
Doctoral-Practice
Graduate Non-Degree (Certificate)
Graduate Non-Degree (Other)
Enrollment by Race/Ethnicity
American Indian/Alaska Native
Asian
African-American
Hispanic/Latino
Pacific Islander
White
Two or More Races
Unknown/Other
International
Enrollment by Gender
Male
Female
Unreported
Enrollment by Pennsylvania Residency
Pennsylvania Resident
Non-Resident
3. Enrollment figures are as of Census; Fall semester Drop/Add. This year's Fall Census was moved back one day to 9/9/2014
4. FTE is calculated as 1 FT + 1/3 PT. Students in Doctoral - Practice programs are considerd one FTE regardless of credit load.
Note: Temple University Japan excluded from this report, except where indicated.
368
N/A
0
0
0
0
Fall 2014 Student Profile
Podiatric Medicine, School ofInstitutional Research & Assessment
368
368
0
368
0
0
Enrollment % of Total
3 0.8%
0
0
0
368
0
0
1 0.3%
0 0.0%
95 25.8%
32 8.7%
35 9.5%
8 2.2%
194 52.7%
0 0.0%
1 0.3%
Enrollment % of Total
86 23.4%
Enrollment % of Total
207 56.3%
160 43.5%
282 76.6%
Page 47 of 64
Fall 2014 Student Profile
Podiatric Medicine, School ofInstitutional Research & Assessment
Admissions
Admissions Statistics
Incoming Students by Classifications
Freshmen
Transfers
Master's Level
Doctoral Level
Professional Schools
Academic Measures5
Incoming Freshmem
Average SAT Verbal/Reading Score
Average SAT Math Score
Average Combined SAT Score
Average ACT Composite Score
Incoming Transfers
Average GPA of Transfer Students (4.00 scale)
Degrees Awarded & Academic Programs
Academic Degree Programs by Degree Level
Including Temple University Japan (TUJ)
Post-secondary Certificate
Associates
Bachelors
Master's
Graduate Certificate
Doctoral-Practice
Doctoral-Scholarship/Research
Temple University Total
Faculty (excluding Temple University Japan)
Full-Time Faculty by Appointment
Tenured
Tenure Track
Non-Tenure Track
Temple University Total
5. Academic Measures calculated based on students newly admitted and enrolled for Fall 2014
6. TU Policy 02.60.01: Establishing, Restructuring and Terminating Academic Programs -last amended July 17, 2014
7. Degrees awarded between Summer II 2013 and Summer I 2014.
0
0
100
0
0
0
0
0
0 0
0 0
0 0
0
0.00
Academic
Programs Offered
2014-20156
Degrees Awarded
2013-20147
0 0
2 100
Total % of Total
0 0.0%
1 0
1 100
0 0
0 0.0%
21 100.0%
21 100%
Page 48 of 64
Fall 2014 Student Profile
Podiatric Medicine, School ofInstitutional Research & Assessment
Academic Program Enrollment
Academic Program
Podiatric Medicine
8. Professional refers to those programs in the professional schools
Undergraduate Graduate Professional8
Total
0 0 368 368
0 0 0 0
0 0 0 0
0 0 0 0
0 0 0 0
0 0 0 0
0 0 0 0
0 0 0 0
0 0 0 0
0 0 0 0
0 0 0 0
0 0 0 0
0 0 0 0
0 0 0 0
0 0 0 0
0 0 0 0
0 0 0 0
0 0 0 0
0 0 0 0
0 0 0 0
0 0 0 0
0 0 0 0
0 0 0 0
0 0 0 0
0 0 0 0
0 0 0 0
0 0 0 0
0 0 0 0
0 0 0 0
0 0 0 0
0 0 0 0
0 0 0 0
0 0 0 0
0 0 0 0
0 0 0 0
0 0 0 0
0 0 0 0
0 0 0 0
0 0 0 0
0 0 0 0
0 0 0 0
Page 49 of 64
Enrollment
Total Enrollment3
Full-Time
Part-Time
Full-Time Equivalent (FTE) Students4
Enrollment by Class Level
Total Undergraduates
High Seniors (120+ Credit Hours)
Seniors
Juniors
Sophomores
Freshmen
Undergraduate Non-Degree Seeking (Certificate)
Undergraduate Non-Degree (Other)
Total Graduate/Professional
Master's Level
Doctoral-Research
Doctoral-Practice
Graduate Non-Degree (Certificate)
Graduate Non-Degree (Other)
Enrollment by Race/Ethnicity
American Indian/Alaska Native
Asian
African-American
Hispanic/Latino
Pacific Islander
White
Two or More Races
Unknown/Other
International
Enrollment by Gender
Male
Female
Unreported
Enrollment by Pennsylvania Residency
Pennsylvania Resident
Non-Resident
3. Enrollment figures are as of Census; Fall semester Drop/Add. This year's Fall Census was moved back one day to 9/9/2014
4. FTE is calculated as 1 FT + 1/3 PT. Students in Doctoral - Practice programs are considerd one FTE regardless of credit load.
Note: Temple University Japan excluded from this report, except where indicated.
3,841
3,743
209
615
749
921
Fall 2014 Student Profile
Science and Technology, College ofInstitutional Research & Assessment
4,123
3,700
423
0
0
0
Enrollment % of Total
8 0.2%
1,248
0
1
380
108
272
206 5.0%
6 0.1%
977 23.7%
456 11.1%
200 4.9%
332 8.1%
1,846 44.8%
92 2.2%
1 0.0%
Enrollment % of Total
3,187 77.3%
Enrollment % of Total
2,229 54.1%
1,893 45.9%
936 22.7%
Page 50 of 64
Fall 2014 Student Profile
Science and Technology, College ofInstitutional Research & Assessment
Admissions
Admissions Statistics
Incoming Students by Classifications
Freshmen
Transfers
Master's Level
Doctoral Level
Professional Schools
Academic Measures5
Incoming Freshmem
Average SAT Verbal/Reading Score
Average SAT Math Score
Average Combined SAT Score
Average ACT Composite Score
Incoming Transfers
Average GPA of Transfer Students (4.00 scale)
Degrees Awarded & Academic Programs
Academic Degree Programs by Degree Level
Including Temple University Japan (TUJ)
Post-secondary Certificate
Associates
Bachelors
Master's
Graduate Certificate
Doctoral-Practice
Doctoral-Scholarship/Research
Temple University Total
Faculty (excluding Temple University Japan)
Full-Time Faculty by Appointment
Tenured
Tenure Track
Non-Tenure Track
Temple University Total
5. Academic Measures calculated based on students newly admitted and enrolled for Fall 2014
6. TU Policy 02.60.01: Establishing, Restructuring and Terminating Academic Programs -last amended July 17, 2014
7. Degrees awarded between Summer II 2013 and Summer I 2014.
46
42
0
548
578
1126
882
332
0 0
31 471
9 57
25
3.12
Academic
Programs Offered
2014-20156
Degrees Awarded
2013-20147
0 0
49 560
Total % of Total
91 39.6%
2 0
0 0
7 32
26 11.3%
113 49.1%
230 100%
Page 51 of 64
Fall 2014 Student Profile
Science and Technology, College ofInstitutional Research & Assessment
Academic Program Enrollment
Academic Program
Applied Mathematics
Biochemistry
Biology
Biology with Teaching
Biophysics
Biotechnology
Chemistry
Chemistry with Teaching
Computer & Information Science
Computer Science
Earth & Space Sci with Teachin
Environmental Science
General Science with Teaching
Geology
Information Science & Technolo
Mathematical Economics
Mathematics
Mathematics & Comp Sci w/Teach
Mathematics with Teaching
Mathematics/Computer Science
Mathematics/Physics
Natural Sciences
Neuroscience:Cell & Molecular
Physics
Physics with Teaching
Pre-Pharmacy
Undeclared-Science and Technol
8. Professional refers to those programs in the professional schools
Undergraduate Graduate Professional8
Total
7 0 0 7
35 0 0 35
18 0 0 18
276 0 0 276
1509 30 0 1539
14 0 0 14
4 60 0 64
0 17 0 17
325 112 0 437
87 0 0 87
18 0 0 18
423 34 0 457
5 0 0 5
15 0 0 15
84 36 0 120
59 13 0 72
249 22 0 271
24 0 0 24
8 0 0 8
3 0 0 3
25 0 0 25
57 56 0 113
5 0 0 5
36 0 0 36
121 0 0 121
0 0 0 0
0 0 0 0
220 0 0 220
116 0 0 116
0 0 0 0
0 0 0 0
0 0 0 0
0 0 0 0
0 0 0 0
0 0 0 0
0 0 0 0
0 0 0 0
0 0 0 0
0 0 0 0
0 0 0 0
0 0 0 0
Page 52 of 64
Enrollment
Total Enrollment3
Full-Time
Part-Time
Full-Time Equivalent (FTE) Students4
Enrollment by Class Level
Total Undergraduates
High Seniors (120+ Credit Hours)
Seniors
Juniors
Sophomores
Freshmen
Undergraduate Non-Degree Seeking (Certificate)
Undergraduate Non-Degree (Other)
Total Graduate/Professional
Master's Level
Doctoral-Research
Doctoral-Practice
Graduate Non-Degree (Certificate)
Graduate Non-Degree (Other)
Enrollment by Race/Ethnicity
American Indian/Alaska Native
Asian
African-American
Hispanic/Latino
Pacific Islander
White
Two or More Races
Unknown/Other
International
Enrollment by Gender
Male
Female
Unreported
Enrollment by Pennsylvania Residency
Pennsylvania Resident
Non-Resident
3. Enrollment figures are as of Census; Fall semester Drop/Add. This year's Fall Census was moved back one day to 9/9/2014
4. FTE is calculated as 1 FT + 1/3 PT. Students in Doctoral - Practice programs are considerd one FTE regardless of credit load.
Note: Temple University Japan excluded from this report, except where indicated.
743
368
30
113
129
64
Fall 2014 Student Profile
Social Work, School ofInstitutional Research & Assessment
912
659
253
0
0
40
Enrollment % of Total
0 0.0%
32
0
0
544
504
0
71 7.8%
2 0.2%
20 2.2%
276 30.3%
38 4.2%
8 0.9%
477 52.3%
20 2.2%
1 0.1%
Enrollment % of Total
801 87.8%
Enrollment % of Total
151 16.6%
760 83.3%
111 12.2%
Page 53 of 64
Fall 2014 Student Profile
Social Work, School ofInstitutional Research & Assessment
Admissions
Admissions Statistics
Incoming Students by Classifications
Freshmen
Transfers
Master's Level
Doctoral Level
Professional Schools
Academic Measures5
Incoming Freshmem
Average SAT Verbal/Reading Score
Average SAT Math Score
Average Combined SAT Score
Average ACT Composite Score
Incoming Transfers
Average GPA of Transfer Students (4.00 scale)
Degrees Awarded & Academic Programs
Academic Degree Programs by Degree Level
Including Temple University Japan (TUJ)
Post-secondary Certificate
Associates
Bachelors
Master's
Graduate Certificate
Doctoral-Practice
Doctoral-Scholarship/Research
Temple University Total
Faculty (excluding Temple University Japan)
Full-Time Faculty by Appointment
Tenured
Tenure Track
Non-Tenure Track
Temple University Total
5. Academic Measures calculated based on students newly admitted and enrolled for Fall 2014
6. TU Policy 02.60.01: Establishing, Restructuring and Terminating Academic Programs -last amended July 17, 2014
7. Degrees awarded between Summer II 2013 and Summer I 2014.
90
0
0
538
486
1024
22
60
0 0
1 98
1 241
24
3.03
Academic
Programs Offered
2014-20156
Degrees Awarded
2013-20147
0 0
3 344
Total % of Total
10 33.3%
1 5
0 0
0 0
3 10.0%
17 56.7%
30 100%
Page 54 of 64
Fall 2014 Student Profile
Social Work, School ofInstitutional Research & Assessment
Academic Program Enrollment
Academic Program
Social Work
Social Work - Graduate
Social Work - Undergraduate
Undeclared-Social Work
8. Professional refers to those programs in the professional schools
Undergraduate Graduate Professional8
Total
15 15 0 30
0 40 0 40
0 0 0 0
0 489 0 489
353 0 0 353
0 0 0 0
0 0 0 0
0 0 0 0
0 0 0 0
0 0 0 0
0 0 0 0
0 0 0 0
0 0 0 0
0 0 0 0
0 0 0 0
0 0 0 0
0 0 0 0
0 0 0 0
0 0 0 0
0 0 0 0
0 0 0 0
0 0 0 0
0 0 0 0
0 0 0 0
0 0 0 0
0 0 0 0
0 0 0 0
0 0 0 0
0 0 0 0
0 0 0 0
0 0 0 0
0 0 0 0
0 0 0 0
0 0 0 0
0 0 0 0
0 0 0 0
0 0 0 0
0 0 0 0
0 0 0 0
0 0 0 0
0 0 0 0
Page 55 of 64
Enrollment
Total Enrollment3
Full-Time
Part-Time
Full-Time Equivalent (FTE) Students4
Enrollment by Class Level
Total Undergraduates
High Seniors (120+ Credit Hours)
Seniors
Juniors
Sophomores
Freshmen
Undergraduate Non-Degree Seeking (Certificate)
Undergraduate Non-Degree (Other)
Total Graduate/Professional
Master's Level
Doctoral-Research
Doctoral-Practice
Graduate Non-Degree (Certificate)
Graduate Non-Degree (Other)
Enrollment by Race/Ethnicity
American Indian/Alaska Native
Asian
African-American
Hispanic/Latino
Pacific Islander
White
Two or More Races
Unknown/Other
International
Enrollment by Gender
Male
Female
Unreported
Enrollment by Pennsylvania Residency
Pennsylvania Resident
Non-Resident
3. Enrollment figures are as of Census; Fall semester Drop/Add. This year's Fall Census was moved back one day to 9/9/2014
4. FTE is calculated as 1 FT + 1/3 PT. Students in Doctoral - Practice programs are considerd one FTE regardless of credit load.
Note: Temple University Japan excluded from this report, except where indicated.
875
848
59
206
223
169
Fall 2014 Student Profile
Tourism and Hospitality Management, School ofInstitutional Research & Assessment
928
848
80
0
0
5
Enrollment % of Total
0 0.0%
191
0
0
80
75
0
54 5.8%
0 0.0%
41 4.4%
135 14.5%
26 2.8%
46 5.0%
607 65.4%
19 2.0%
0 0.0%
Enrollment % of Total
703 75.8%
Enrollment % of Total
499 53.8%
429 46.2%
225 24.2%
Page 56 of 64
Fall 2014 Student Profile
Tourism and Hospitality Management, School ofInstitutional Research & Assessment
Admissions
Admissions Statistics
Incoming Students by Classifications
Freshmen
Transfers
Master's Level
Doctoral Level
Professional Schools
Academic Measures5
Incoming Freshmem
Average SAT Verbal/Reading Score
Average SAT Math Score
Average Combined SAT Score
Average ACT Composite Score
Incoming Transfers
Average GPA of Transfer Students (4.00 scale)
Degrees Awarded & Academic Programs
Academic Degree Programs by Degree Level
Including Temple University Japan (TUJ)
Post-secondary Certificate
Associates
Bachelors
Master's
Graduate Certificate
Doctoral-Practice
Doctoral-Scholarship/Research
Temple University Total
Faculty (excluding Temple University Japan)
Full-Time Faculty by Appointment
Tenured
Tenure Track
Non-Tenure Track
Temple University Total
5. Academic Measures calculated based on students newly admitted and enrolled for Fall 2014
6. TU Policy 02.60.01: Establishing, Restructuring and Terminating Academic Programs -last amended July 17, 2014
7. Degrees awarded between Summer II 2013 and Summer I 2014.
39
0
0
520
544
1064
142
57
0 0
3 172
3 40
23
3.03
Academic
Programs Offered
2014-20156
Degrees Awarded
2013-20147
0 0
6 212
Total % of Total
6 30.0%
0 0
0 0
0 0
7 35.0%
7 35.0%
20 100%
Page 57 of 64
Fall 2014 Student Profile
Tourism and Hospitality Management, School ofInstitutional Research & Assessment
Academic Program Enrollment
Academic Program
Pre Business
Sport & Recreation Management
Sport Business
Tourism and Hospitality Mgmt
Undeclared-Tourism and Hospit
8. Professional refers to those programs in the professional schools
Undergraduate Graduate Professional8
Total
62 0 0 62
369 25 0 394
0 5 0 5
417 1 0 418
0 49 0 49
0 0 0 0
0 0 0 0
0 0 0 0
0 0 0 0
0 0 0 0
0 0 0 0
0 0 0 0
0 0 0 0
0 0 0 0
0 0 0 0
0 0 0 0
0 0 0 0
0 0 0 0
0 0 0 0
0 0 0 0
0 0 0 0
0 0 0 0
0 0 0 0
0 0 0 0
0 0 0 0
0 0 0 0
0 0 0 0
0 0 0 0
0 0 0 0
0 0 0 0
0 0 0 0
0 0 0 0
0 0 0 0
0 0 0 0
0 0 0 0
0 0 0 0
0 0 0 0
0 0 0 0
0 0 0 0
0 0 0 0
0 0 0 0
Page 58 of 64
Enrollment
Total Enrollment3
Full-Time
Part-Time
Full-Time Equivalent (FTE) Students4
Enrollment by Class Level
Total Undergraduates
High Seniors (120+ Credit Hours)
Seniors
Juniors
Sophomores
Freshmen
Undergraduate Non-Degree Seeking (Certificate)
Undergraduate Non-Degree (Other)
Total Graduate/Professional
Master's Level
Doctoral-Research
Doctoral-Practice
Graduate Non-Degree (Certificate)
Graduate Non-Degree (Other)
Enrollment by Race/Ethnicity
American Indian/Alaska Native
Asian
African-American
Hispanic/Latino
Pacific Islander
White
Two or More Races
Unknown/Other
International
Enrollment by Gender
Male
Female
Unreported
Enrollment by Pennsylvania Residency
Pennsylvania Resident
Non-Resident
3. Enrollment figures are as of Census; Fall semester Drop/Add. This year's Fall Census was moved back one day to 9/9/2014
4. FTE is calculated as 1 FT + 1/3 PT. Students in Doctoral - Practice programs are considerd one FTE regardless of credit load.
Note: Temple University Japan excluded from this report, except where indicated.
4
4
0
0
0
0
Fall 2014 Student Profile
University CollegeInstitutional Research & Assessment
4
4
0
0
0
0
Enrollment % of Total
0 0.0%
4
0
0
N/A
0
0
0 0.0%
0 0.0%
0 0.0%
0 0.0%
0 0.0%
0 0.0%
4 100.0%
0 0.0%
0 0.0%
Enrollment % of Total
4 100.0%
Enrollment % of Total
1 25.0%
3 75.0%
0 0.0%
Page 59 of 64
Fall 2014 Student Profile
University CollegeInstitutional Research & Assessment
Admissions
Admissions Statistics
Incoming Students by Classifications
Freshmen
Transfers
Master's Level
Doctoral Level
Professional Schools
Academic Measures5
Incoming Freshmem
Average SAT Verbal/Reading Score
Average SAT Math Score
Average Combined SAT Score
Average ACT Composite Score
Incoming Transfers
Average GPA of Transfer Students (4.00 scale)
Degrees Awarded & Academic Programs
Academic Degree Programs by Degree Level
Including Temple University Japan (TUJ)
Post-secondary Certificate
Associates
Bachelors
Master's
Graduate Certificate
Doctoral-Practice
Doctoral-Scholarship/Research
Temple University Total
Faculty (excluding Temple University Japan)
Full-Time Faculty by Appointment
Tenured
Tenure Track
Non-Tenure Track
Temple University Total
5. Academic Measures calculated based on students newly admitted and enrolled for Fall 2014
6. TU Policy 02.60.01: Establishing, Restructuring and Terminating Academic Programs -last amended July 17, 2014
7. Degrees awarded between Summer II 2013 and Summer I 2014.
0
0
0
545
488
1033
4
0
0 0
0 0
0 0
20
0.00
Academic
Programs Offered
2014-20156
Degrees Awarded
2013-20147
3 12
3 12
Total % of Total
1 100.0%
0 0
0 0
0 0
0 0.0%
0 0.0%
1 100%
Page 60 of 64
Fall 2014 Student Profile
University CollegeInstitutional Research & Assessment
Academic Program Enrollment
Academic Program
Undeclared-University College
8. Professional refers to those programs in the professional schools
Undergraduate Graduate Professional8
Total
4 0 0 4
0 0 0 0
0 0 0 0
0 0 0 0
0 0 0 0
0 0 0 0
0 0 0 0
0 0 0 0
0 0 0 0
0 0 0 0
0 0 0 0
0 0 0 0
0 0 0 0
0 0 0 0
0 0 0 0
0 0 0 0
0 0 0 0
0 0 0 0
0 0 0 0
0 0 0 0
0 0 0 0
0 0 0 0
0 0 0 0
0 0 0 0
0 0 0 0
0 0 0 0
0 0 0 0
0 0 0 0
0 0 0 0
0 0 0 0
0 0 0 0
0 0 0 0
0 0 0 0
0 0 0 0
0 0 0 0
0 0 0 0
0 0 0 0
0 0 0 0
0 0 0 0
0 0 0 0
0 0 0 0
Page 61 of 64
Enrollment
Total Enrollment3
Full-Time
Part-Time
Full-Time Equivalent (FTE) Students4
Enrollment by Class Level
Total Undergraduates
High Seniors (120+ Credit Hours)
Seniors
Juniors
Sophomores
Freshmen
Undergraduate Non-Degree Seeking (Certificate)
Undergraduate Non-Degree (Other)
Total Graduate/Professional
Master's Level
Doctoral-Research
Doctoral-Practice
Graduate Non-Degree (Certificate)
Graduate Non-Degree (Other)
Enrollment by Race/Ethnicity
American Indian/Alaska Native
Asian
African-American
Hispanic/Latino
Pacific Islander
White
Two or More Races
Unknown/Other
International
Enrollment by Gender
Male
Female
Unreported
Enrollment by Pennsylvania Residency
Pennsylvania Resident
Non-Resident
3. Enrollment figures are as of Census; Fall semester Drop/Add. This year's Fall Census was moved back one day to 9/9/2014
4. FTE is calculated as 1 FT + 1/3 PT. Students in Doctoral - Practice programs are considerd one FTE regardless of credit load.
Note: Temple University Japan excluded from this report, except where indicated.
1,060
1,325
3
3
25
172
Fall 2014 Student Profile
University StudiesInstitutional Research & Assessment
1,385
897
488
0
0
60
Enrollment % of Total
0 0.0%
469
0
653
60
0
0
44 3.2%
1 0.1%
101 7.3%
134 9.7%
213 15.4%
302 21.8%
560 40.4%
30 2.2%
9 0.6%
Enrollment % of Total
916 66.1%
Enrollment % of Total
647 46.7%
729 52.6%
469 33.9%
Page 62 of 64
Fall 2014 Student Profile
University StudiesInstitutional Research & Assessment
Admissions
Admissions Statistics
Incoming Students by Classifications
Freshmen
Transfers
Master's Level
Doctoral Level
Professional Schools
Academic Measures5
Incoming Freshmem
Average SAT Verbal/Reading Score
Average SAT Math Score
Average Combined SAT Score
Average ACT Composite Score
Incoming Transfers
Average GPA of Transfer Students (4.00 scale)
Degrees Awarded & Academic Programs
Academic Degree Programs by Degree Level
Including Temple University Japan (TUJ)
Post-secondary Certificate
Associates
Bachelors
Master's
Graduate Certificate
Doctoral-Practice
Doctoral-Scholarship/Research
Temple University Total
Faculty (excluding Temple University Japan)
Full-Time Faculty by Appointment
Tenured
Tenure Track
Non-Tenure Track
Temple University Total
5. Academic Measures calculated based on students newly admitted and enrolled for Fall 2014
6. TU Policy 02.60.01: Establishing, Restructuring and Terminating Academic Programs -last amended July 17, 2014
7. Degrees awarded between Summer II 2013 and Summer I 2014.
0
0
0
549
550
1099
276
43
0 0
0 0
0 0
24
3.09
Academic
Programs Offered
2014-20156
Degrees Awarded
2013-20147
0 0
0 0
Total % of Total
0 0.0%
0 0
0 0
0 0
0 0.0%
0 0.0%
0 0%
Page 63 of 64
Fall 2014 Student Profile
University StudiesInstitutional Research & Assessment
Academic Program Enrollment
Academic Program
Access Temple (IELP)
Career and Technical Education
Incoming Exchange Program
Intensive English Language
Undeclared
Undeclared-Continuing Studies
Undeclared-University Studies
8. Professional refers to those programs in the professional schools