By Christopher Stone Public Service Research Director with Emma Cheyne, Matthew Wilkinson, Neha Kasbekar & Stephen Beverley June 2014 ISSN: 1835-0135 False Economies : Unpacking public service efficiency
Transcript
By Christopher StonePublic Service Research Director
with Emma Cheyne, Matthew Wilkinson, Neha Kasbekar & Stephen Beverley
June 2014
ISSN: 1835-0135
False Economies:Unpacking public service efficiency
False Economies
2
False Economies: ISSN 1835-0135This paper is the final in a series looking at the false economies that result from short-term thinking on Australia’s public services. It incorporates updated versions of the previous three reports in the series: ‘Decoding efficiency’, ‘Doing less with less’ and ‘Bang for our bucks’. Be part of our ongoing public sector discussion on Twitter by using #falseeconomies #ozpublicservice or #ozbigsociety.
About the AuthorChristopher Stone is the Research Director of the Centre for Policy Development’s Public Service Program. His interests focus on the use of social science concepts and findings to improve the effectiveness of regulation and governance. Christopher has previously worked in university research centres focusing on environmental law and policy. He has worked with a range of State Government departments and Local Governments in previous research projects. He has qualifications in law, psychology and philosophy.
Acknowledgements
This publication was funded by the Community and Public Sector Union (CPSU), the Becher Foundation and Slater & Gordon to contribute to the debate on public sector reform in Australia. Its conclusions do not necessarily reflect the views of its funders. CPD would like to thank the Public Service Program’s funders for making this publication possible.This paper was subject to an informal review process. Thanks to Greg Smith, Ian McAuley, Kathy MacDermott, Miriam Lyons, Travers McLeod, Kristin van Barneveld, Stilgherrian and Tim Roxburgh for their helpful feedback.
Research briefs that were incorporated into the final report were provided by Emma Cheyne, Matthew Wilkinson, Neha Kasbekar and Stephen Beverley. Research assistance was also provided by Deidre Math, Hollie Scott, Annabelle Strang, Lewis Hamilton, Nicola Rhind, Luke McCann, Luke Portelli, James Boubli and Adrian March. All conclusions and any errors that remain are the author’s own.
About CPDThe Centre for Policy Development is an independent and non-partisan public policy think tank dedicated to seeking out creative, viable ideas and rigorous research to inject into Australia’s policy debates. CPD gives a diverse, cross-disciplinary community of thinkers space to generate ideas for a fair, sustainable and prosperous future for all Australians. We develop and promote policy proposals to help Australia thrive and lead in a fast-changing global environment over the long-term, connecting ideas with policy makers, concerned stakeholders and the media. CPD is a non-profit organisation. Donations to our research fund are tax deductible. To join CPD’s supporters or hear about future CPD publications go to http://cpd.org.au.
About the Public Service Research ProgramCPD’s Public Service Research Program combines big-picture thinking on the role of government in the 21st Century with careful research on options for public sector reform. The public sector plays a vital role in Australian society – one highly valued by most Australians – yet the benefits of an agile, innovative and well-resourced public sector are often overlooked or dismissed. We need long-term, systemic renewal based on consistent principles and a clear understanding of future challenges, not short-term fixes. CPD provides independent research to investigate what is required from the public sector in order to meet the needs of a changing society over the long-term and maintain high-quality, cost-effective services for all Australians.
Creative Commons LicenceAll CPD papers are released under a Creative Commons licence. Extracts, summaries or the whole paper may be reproduced provided the author, the title and CPD are attributed, with a link to our website at http://cpd.org.au. For more details on the Creative Commons Attribution 3.0 Australia licence that applies to this paper, please visit http://creativecommons.org/licenses/by/3.0/au/.
Note: Boxes marked with an asterisk are updated text from the report ‘Doing less with less’
False Economies
5
Foreword
As this report makes clear, dogmatic belief in the relative efficiency or inefficiency of the public or
private sectors are poor substitutes for evidence and analysis. What matters is what works and the
evidence is that Australia’s system of public administration works reasonably well.
The cost of all three levels of Australian government, as a percentage of our national GDP, is
amongst the lowest in the developed world. It is also substantially lower than the countries we
traditionally measure ourselves against, including the US, UK, Canada and New Zealand. Public
sector employment, as percentage of total employment, has stayed relatively constant for the
last ten years, and has fallen since the 1980s. And the ‘products’ of the public sector in Australia,
including our education and health services, and our targeted social security system, have
produced some of the best outcomes in the world.
However none of this is to argue that we should be blind to the potential for improvements in
the way public administration functions. This report highlights a number of examples where the
implementation of one-dimensional ideas about efficiency have come at a very substantial cost.
But across all three definitions of ‘efficiency’, there is room for us to do better.
My experience at State and Commonwealth levels is that most public administrators are keenly
aware of this need to do better. In part, this is because they see the inefficiencies caused by the
‘programmatic confetti’ that has been sprinkled across core government functions by successive
waves of political leadership, often with little evidence or outcomes to show for it.
It is to CPD’s credit as a think-tank that this report also identifies ideas
about how improvements could be made, as opposed to just describing
the problems. The areas highlighted, including reducing risk aversion,
better performance management systems and improving the relationships
between Ministerial offices and senior public servants, all ring true in my
experience.
For example, we know that increased risk aversion leads to more complex
and prescriptive process and regulations. It is also clear that poor public
sector performance management systems end up rewarding relatively
unproductive work. There are also a number of examples where a
breakdown in the relationship between Minister’s offices and senior public
sector staff has resulted in costly public policy mistakes.
Much of this is the result of a complex interplay between political leaders,
the community and public administrators, with each group perceiving
their actions to be reasonable. If the community refuses to accept any risk, then politicians will
respond to those demands. If public sector performance management becomes overly engineered
dogmatic belief in the
relative efficiency or
inefficiency of the public
or private sectors are poor
substitutes for evidence and
analysis . What matters is
what works . . .
False Economies
6
and prescriptive, then public servants will focus on outputs and not outcomes. If Ministers
are encouraged to stop seeing their departments as a source of impartial advice, they will stop
listening to it.
Even a brief reflection will show there are not quick and easy solutions to these problems and it
will take change amongst all three groups to shift mindsets and expectations.
But it is also worth remembering that the results of strategic public sector reform can be vastly
more significant than a few input savings. Previous waves of strategic public sector reform in
Australia have increased national prosperity by significantly boosting GDP as well as by improving
the delivery of services.
The true policy sceptic is interested in rational analysis and evidence-based inquiry. This report
provides some of that analysis and evidence, as well as being a reminder that too much discussion
about the public sector remains based on ideology, partisan cant and misperception.
Terry Moran AC President, Institute of Public Administration Australia
The results of strategic
public sector reform can be
vastly more significant than
a few input savings . Previous
waves of strategic public
sector reform in Australia
have increased national
prosperity by significantly
boosting GDP . . .
False Economies
7
Main PointsEvery Australian needs to understand what politicians are talking about when they speak of the ‘efficiency’ of government. Why should we care? Because this is our money, being spent on us and the things that matter to us. This report explores the implications of taking the concept of efficient government seriously. It looks at what efficiency is, how efficient our government organisations are, and considers ways in which efficiency can genuinely be improved.
Chapter 1, an updated version of the Decoding efficiency report, translates the jargon used in economic debates about the efficiency of government.1 It sets out a clear definition of efficiency as including:
» Technical efficiency: doing the most work with the fewest resources
» Allocative efficiency: allocating your resources to the right place, doing the right job
» Dynamic efficiency: being able to use new technologies and adopt new ways of operating
The chapter then examines how misunderstanding efficiency in government can lead to two errors:
» Inappropriate cuts that end up costing much more than they save: Cuts are made even when the negative consequences of the cuts outweigh the savings. This is because the cuts to funding or staff are easily measured and receive strong media attention, but the resulting reduction in service quality or accessibility is more difficult to quantify and not as noticeable.
» Inappropriate privatisation or outsourcing: Market-driven solutions are sought even when there are conditions present that will prevent a market from delivering efficiency. Six reasons why markets can fail to deliver are described.
The main message of the first chapter is that a sound understanding of efficiency is needed in public debates on what services to fund, and whether their delivery should be outsourced or not, in order to ensure we are getting public value for public money.
Chapter 2, an updated version of the Bang for our bucks report, examines the evidence of the efficiency of Australia’s public sector.2 It compares the Australian public sector with those in similar countries and concludes that the Australian public sector’s efficiency is above average, amongst the very best in the Organisation for Economic Co-operation and Development (OECD). Our public sector turns small resources into big results, its efforts are well-targeted and it has adapted relatively well to sustain this performance over decades.
The chapter then compares Australian public sector performance with the private sector. There are significant difficulties involved in such a comparison, but the evidence available indicates that the two sectors have a similar level of efficiency. However, the relative efficiency of the two sectors in any particular case will vary depending on activities and organisations, since the limited data available points to the conclusion that each does different jobs better.
The first two chapters include vignettes, drawn and updated from the Doing less with less report, to illustrate the impacts of increasing or reducing the role of government.3 The first two are examples of government investment saving more than is spent (and thus show the potential losses from cuts). The next two highlight the impact of public sector advice, research and leadership. The final vignette compares private and public sector efficiency. In summary, these vignettes show that:
» In 2o11 Queensland invested $120 million into maintaining its public works skill capacity at a higher level than that of Victoria. Evidence suggests Queensland may have saved
False Economies
8
nearly three times this amount, around $350 million, by drawing on this expertise and capacity to ensure better management of public works.
» Sydney trains save car commuters millions of dollars each year by reducing congestion. The congestion reduction also avoids 1 million tonnes of carbon emissions and reduces community health costs from air pollution by millions of dollars. NSW invests $1,364 million a year in rail subsidies. Those subsidies help generate benefits to rail commuters, car commuters, and the wider community from trains totalling at least $2,071 million a year, even without taking into account less directly observable advantages.
» Without the fiscal stimulus package, designed by public servants and enacted during the Global Financial Crisis, Australia’s economic growth would probably have been negative for three consecutive quarters. The stimulus package prevented a recession and helped to ensure Australia’s economy did not shrink by some AUD$7 billion in 2010. Such shrinkage would have created significant waste through missed opportunities for productive use of existing capital and labour, meaning that the stimulus package greatly aided the efficiency of the economy as a whole.
» Leading the construction of the National Broadband Network (NBN), as all the major parties have accepted, is a job best done by government.
» Research undertaken by the Productivity Commission, a publicly funded research and advisory body for the Federal Government, has shown public and private hospitals are similarly efficient, but with strengths in different areas. In diagnostics and prosthetics the public sector outperforms the private sector in terms of efficiency, whereas the reverse is true in pharmaceuticals and general hospital charges.
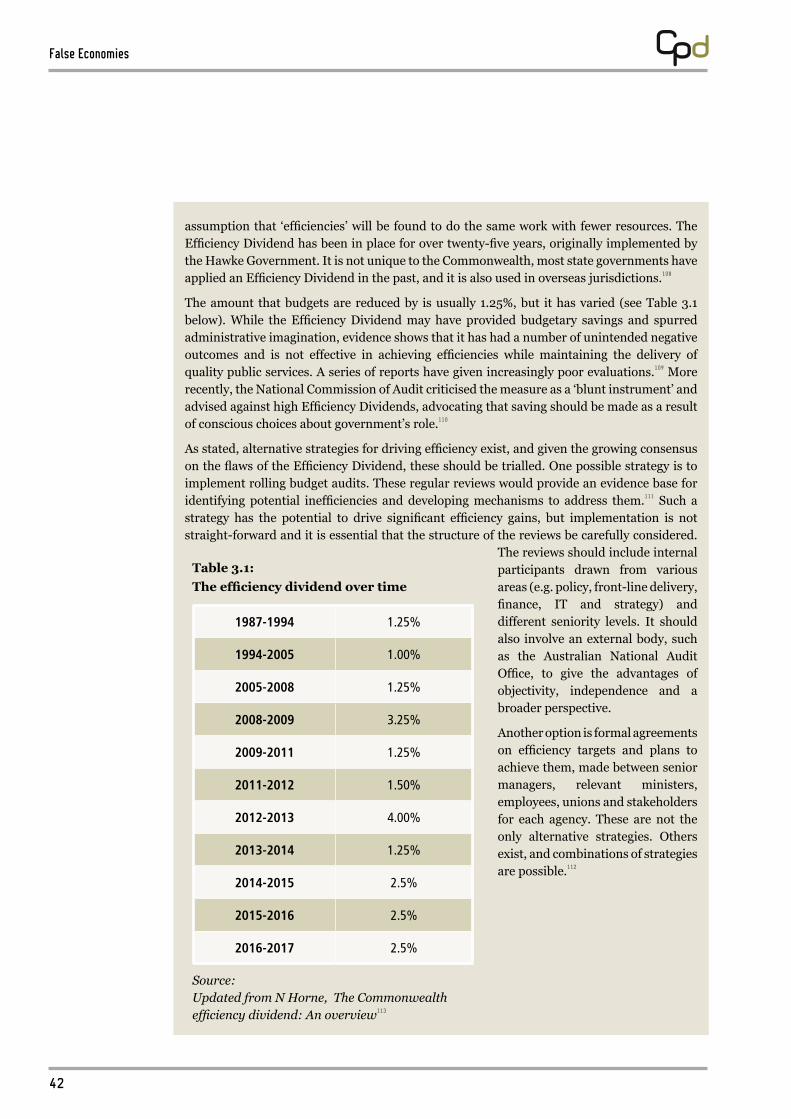
The third and final chapter, new material, makes clear that although Australia’s public sector is comparatively efficient, there is scope for improvement. Disappointingly, analysis of the National Commission of Audit and 2014-15 Federal Budget reveals that narrow approaches to questions of efficiency continue to block such opportunities. The ‘smaller and more rational government’ initiative has the benefit of identifying the public services that will be affected by cuts, but does not appear to be guided by any underlying rationale of what services government should be providing. The blunt Efficiency Dividend remains the predominant savings measure.
The heavy focus on cuts without sufficient consideration of the value of services means that other strategies for increasing efficiency are neglected. Attention is directed to two such possibilities for efficiency improvements in the Australian Public Service (APS): innovation and professional accountability structures.
Innovation is critical for efficiency in any organisation, since changes to adopt more efficient practises require some capacity to innovate. Innovations in public sector organisations are driven by different factors, and face different barriers, to private sector innovations. They most commonly originate from front-line and middle management, usually in response to internally identified problems. Though innovative practises are frequently bottom-up in nature, top-level support is very important. Two significant barriers to public sector innovation are an overly risk averse orientation within organisations, and a lack of resources invested in developing and implementing innovative ideas. Taking into account these driving and constraining factors suggests the following initiatives will encourage innovation in the APS:
» The creation of cross-agency teams to help drive innovative approaches to services
» Initiatives by agency heads to facilitate bottom-up innovations (such as temporarily
False Economies
9
implementing more permissive standards to create a window for experimentation with new techniques by front-line workers)
» Taking a low risk approach to pilot programs (such as running multiple simultaneous pilots to reduce the political risk of a pilot being seen as ‘failed’)
» Awards and other schemes to give due recognition to innovative public servants
» An innovation investment fund to provide a public sector equivalent to venture capital, combined with mechanisms to capture and share information on implementing innovations
Accountability, the process of monitoring organisational goals and ensuring they are met, is also a key area for efficiency. Such systems ensure resources are being used to generate the most results and in the desired areas (technical and allocative efficiency). The current method for managing performance in the APS often does not provide clear guidance to public servants on how they can work toward their organisation’s goals. Greater capacity for designing (and redesigning) accountability structures is required.
We recommend an alternative, experimentalist approach, which maintains a focus on outcome measures but authorises front-line discretion. Front-line staff should be given the opportunity to question the accountability structures employed and design new strategies and plans to modify the structure in their particular area. Discretion to design new strategies should become part of their role. The quid pro quo for this arrangement is that front-line staff provide detailed information on progress (against agreed metrics), and the discretion and monitoring functions are subject to peer review. This is advocated given that too much front-line discretion can be problematic in public sector organisations. Such an approach requires building capacity to operate in situations of greater uncertainty, which can be achieved by improving communication and organisational support. As well as being applied within the APS, this approach may also be beneficial for the relationship between ministers and the public servants they work with.
The following reforms are also recommended to improve overall accountability:
» An integrated national plan that broadly outlines the policies, government programs, and external partnerships needed to achieve its objectives, along with monitoring and evaluation mechanisms
» Further capacity in the APS for the process of goal specification and alignment with accountability systems, perhaps with the Australian Public Service Commission (APSC) playing a leading role
» Increased use of client directed systems, such as those implemented under co-production initiatives
» Greater efforts to build organisational trust by improving aspects of the public service workplace environment that have been associated in the literature with increased trust in management, such as communication and organisational support
False Economies
10
Strong views
I respect the professionalism of the public service. In the longer term, though, we have to rely less on bureaucrats and put more trust in the common sense of the Australian people. We need smaller, more efficient government.
Tony Abbott, Liberal Party of Australia4
One of the key commitments of the Abbott Government is to reduce the size of government and to ensure that government services are as efficient and well-targeted as possible.
Mathias Cormann, Liberal Party of Australia7
The efficiency dividend ... is now seriously impacting on the government’s ability to deliver services.
Christine Milne, Australian Greens Party6
It’s not ‘efficiency’ to default on your social obligations. It’s not ‘waste’ to treat your people with respect.
Kim Carr, Australian Labor Party8
[We are] committed to maintaining public service jobs at levels sufficient to ensure the efficient and effective maintenance of Government service delivery.
Bill Shorten, Australian Labor Party5
We want to find better efficiencies in the public sector staffing levels so that we can increase front-line services.
Scott Buchholz, Liberal Party of Australia9
False Economies
11
While the [Gillard] Government has a strong focus on achieving efficiencies, we are continuing to invest in front-line services.
Penny Wong, Australian Labor Party10
The reality is that government employees around the world are known not to be as efficient as the private sector. What the public sector can learn from the private sector is the need for a constant focus on efficiency.
Paul Fletcher, Liberal Party of Australia11
The efficiency of the public system is about half of that of the private system.
Peter Lindsay, Liberal Party of Australia15
Through the efficiency dividend, the Public Service is treated like no other agency or business in that they are continually required to pay between 1.25 per cent and three per cent of their annual running costs back to the government in the form of savings.
Stephen Jones, Australian Labor Party12
We have seen for some time, public services everywhere being subjected to higher levels of scrutiny and criticism, and greater expectations of efficiency, service and responsiveness to governments and the public at large.
Melissa Parke, Australian Labor Party16
...recognising the important role of the Australian Public Service in upholding and promoting our democracy and its key role in ensuring stable government and, secondly, commending the Australian Public Service on continuing to be one of the most effective and efficient public services in the world. These are both commendable motions, and I think that members of this House would largely agree with them. Jamie Briggs, Liberal Party of Australia13
A modern, contemporary employment framework ... will allow greater agility and responsiveness by the APS to the community and to the government. It will result in greater efficiency and more effective use of Commonwealth resources.
Gary Gray, Australian Labor Party18
It was public servants who did so much to get us through the Global Financial Crisis with a temporary, timely, targeted fiscal stimulus program that was recognised by international economic authorities, such as the IMF, as being a world-beating fiscal stimulus program because it was put into place quickly and efficiently.
Andrew Leigh, Australian Labor Party14
False Economies
12
1: Decoding efficiency
Your money spent on you
Through a combination of income tax, GST and various other taxes and duties, the Federal, State and Local Governments take a percentage of every Australian’s income. (The average household pays about a quarter of its income in taxes.19) With this money these governments:
» teach 65% of our children – and substantially co-fund the other 35%20
» co-fund nearly all Australian university students
» provide 67% of hospital beds – and co-fund the private beds21
» co-fund medical services and medications
» regulate to ensure the safety and/or reliability of:
• food and beverages
• medicines
• buildings
• road, rail, water and air transport
• workplaces
• the finance sector
» provide and police the justice system and the system of property rights
» undertake diplomatic and national security tasks, such as pursuing our interests in foreign relations, ensuring security through border controls and providing national defence
» provide infrastructure, such as the vast majority of roads
» supply essential community services, such as protecting vulnerable children, assisting those with disabilities and providing help when bushfires, floods, or other emergencies occur
» give financial assistance to those in need, for example, age and carers pensions
» run trusted information sources, such as the Bureau of Meteorology and the ABC
» run a myriad of other services that, directly or indirectly, affect every Australian everyday
Politicians make the major decisions on how the money is to be spent, but the big jobs of collecting the money and providing the services are done by the public sector; that is, public servants (teachers, police, health workers and their support staff, the defence force, case work officers, policy officers and many more) and the employees of government owned corporations like the ABC, the CSIRO, and water and energy providers.
So this is your money being spent on you. Every Australian, therefore, has the right to know that the money is not being wasted; that it is being spent as efficiently as reasonably possible.
False Economies
13
Getting ‘efficiency’ wrongPoliticians and other public figures who comment on public sector efficiency are well aware of the need for an efficient public sector, and parliamentary and public discussions feature strong opinions on the topic, as the introductory quotes to this chapter illustrate. Unfortunately, the word ‘efficiency’ is often misunderstood or misused, leading to decisions that cause waste. In our day-to-day lives, all of us have experienced similar ‘false economies’, decisions intended to save time or money that end up costing more than they save, buying a cheap car part that has to be replaced more frequently or taking a cheap flight with many more stopovers. In public services the two most common kinds of false economies are: inappropriate cuts or savings and inappropriate privatisation or outsourcing.
Inappropriate cuts or savings: Often debates on efficiency focus on reductions in resources. These cuts are usually either staff cuts, such as promises to reduce the number of public servants by a certain amount, or general budget cuts, such as the ‘efficiency dividend’ which requires most Federal Government departments to spend 1.25% less to meet the same responsibilities each year (in many recent years the percentage has been larger and the 2014-15 budget has increased it to 2.5%22). Cuts to the funding of an existing service or decisions not to fund a planned service are often referred to as ‘efficiencies’ or ‘savings’ when they are announced. However, cutting spending on activities that deliver more benefits than they cost, or failing to invest in projects that should be undertaken, can make government less efficient, not more. How this works is discussed below.
Inappropriate privatisation or outsourcing: A range of different terms have been used to describe these actions and there is no ‘correct’ definition, but it is important to be clear on the meanings of the terms as used in this report.23 Here ‘privatisation’ refers to the government selling a physical asset or an organisation and ‘outsourcing’ refers to paying a corporation or other organisation to undertake a service that was previously provided directly by the government. There are important differences between privatisation and outsourcing, but they are grouped together here because the same misunderstanding of efficiency is often used to justify their inappropriate use. Again, the way misunderstandings of efficiency lead to waste is discussed below.
Getting efficiency rightNote the use of the word ‘inappropriate’ in the descriptions above. To be clear, this is not an argument that outsourcing, privatisation, cutting spending or finding savings in the public sector are necessarily bad public policy. What is argued is that these measures can sometimes be detrimental to efficiency (and so a waste of taxpayer resources) and that a clear understanding of efficiency is necessary to avoid such problems.
In some cases cuts to government operations are the right decision, and in other cases they are the wrong decision. This statement might seem so obvious as to be not worth making, but too often the word ‘efficiency’ is used as though it means the same thing as ‘cuts’. This falsely implies that cuts are always the right decision.
Similarly, in some cases the outsourcing or privatisation of government operations is the right decision, and in other cases it is the wrong decision. Again, this statement might seem obvious,
To be clear, this is not an
argument that outsourcing,
privatisation, cutting spending
or finding savings in the
public sector are necessarily
bad public policy .
False Economies
14
but there is a widespread belief that the private sector is always more efficient than the public sector. This falsely implies that privatisation or outsourcing is always the right decision.
These two misunderstandings of efficiency not only bias some towards cuts and privatisation, they can also cause those who support the public provision of a service to argue against efficiency or argue it is not important. Rejecting efficiency offhand is just as significant a mistake as pursuing a biased perception of efficiency. Efficiency is a critical tool in achieving any aim, but only if the full meaning of efficiency is used.
Three kinds of efficiencyThe field of economics has developed a thorough understanding of the concept of efficiency. Unfortunately, this knowledge is generally expressed in the jargon of the field and has not tended to inform the public debate on efficiency of the public sector. This is a shame because the concepts are readily expressible in plain English.
One kind of efficiency is doing the work you are doing with the fewest possible resources, getting ‘more for less’ or ‘value for money’. This means producing each item and delivering each service with the least expenditure of time, money, materials, etc. Taking a quicker route to work, shopping at a supermarket that is cheaper and just as close, and printing documents double-sided, are all examples of increased technical efficiency.
Another kind of efficiency is about doing the right work, by allocating resources to produce and provide items and services of the highest total value. Value is often thought of as the amount of money someone is willing to pay, but this is not always reliable for all circumstances. Also important is best meeting needs in a wide range of circumstances, whether or not payment is involved. A print-out of a document that is read and used by many people can be more valuable than a print-out that is read by only a few, or no-one at all. Buying more nutritious and flavoursome
foods gives more value than buying unhealthy and unappetising food. Using paper on printing the most useful documents and getting the best food for the weekly budget are examples of increased allocative efficiency.
A third kind of efficiency involves ensuring future needs are met and finding new ways to fill them. This includes ensuring that new technologies, new ways of operating and new ways of thinking are able to be used. Saving time and petrol by working from home, or using electronic paper instead of printing, can be examples of increasing dynamic efficiency. This kind of efficiency is in many ways the least understood. While technical and allocative efficiency are well-grounded in economic definitions, dynamic efficiency is a more fluid concept.
To illustrate the differences with a public sector example:
» Technical efficiency: Building a road using the best mix of labour and capital. Using picks and shovels when machinery can do a lower-cost job is technically inefficient.
» Allocative efficiency: Building a road where it is most needed. Even if a road is built with the optimal labour-capital mix and no waste, if it is in the wrong place, or if a more heavily trafficked road is neglected, that is inefficient in an allocative sense. Those resources could have been used elsewhere with better outcomes.
» Dynamic efficiency: Attending to transport needs as opportunities or needs change over time. That may mean taking on new modes, such as high-speed rail.
Rejecting efficiency
offhand is just as
significant a mistake as
pursuing a biased perception
of efficiency .
False Economies
15
All three kinds of efficiency are important. But often the pursuit of one can get in the way of achieving the others. This is particularly important in complex and continuously changing areas, which is very often the case in public services. A simplistic approach to efficiency often fails to recognise that resources are necessarily devoted not only to produce current outputs, but also to make sure these generate the most value to citizens (for example, by tailoring them to different needs in different locations or to different groups), and also to make sure that the outputs change and improve over time as new technologies and needs emerge.
The blind pursuit of technical efficiency is quite often disastrous for companies if they do not recognise these issues in their own investment plans, because competitors soon destroy them as their products or methods become outdated. An example was Kodak continuing to release new film cameras that may have been technically more efficient, but failing to invest in dynamic efficiency by developing digital cameras. It is equally disastrous, and sometimes more so, if public services are not run with the same eye to all three types of efficiency. How damaging is it to overall efficiency if our defence equipment is the wrong type for changing needs, if our schools are using the wrong models of education, or if our payments system is using outdated technology? Misunderstandings of these three kinds of efficiencies and their interactions lead to the two errors listed above.
Inappropriate cuts and misunderstanding efficiencyMost of the discussions of public sector efficiency are concerned with technical efficiency. Phrases such as ‘doing more with less’ show this, since doing more work with fewer resources is an improvement in technical efficiency. Unfortunately, beyond this rhetoric there is often a misuse of the word ‘efficiency’. This misuse occurs because the proposed plans focus on the resources being used, while not sufficiently considering the outputs being produced, the value in different settings of the outcomes being sought or the possibility of developing future capacities that are just as important to invest in as existing outputs.
This means that promises are made that there will be cuts to the public sector, but that the services provided will not be affected. The cuts are usually measured in detail and get strong media attention, but the services are not so well-measured. Decreases in the quality or accessibility of the services are not as noticeable. Opportunities lost in the future are also unrecognised or undervalued, until we get there and wonder why our performance has slipped behind that of other countries, or why critical needs were not anticipated and met.
A large part of the reason for the focus on inputs is that they are relatively easy to measure. They can be expressed as dollars in a budget. Outcomes in the provision of public services are generally less easily measured. This is the case because, unlike many other markets in which a straightforward measure of profit can be applied, their value is based on a range of different factors, many of which are difficult to price directly. Public services often cannot be regarded as a simple discrete ‘product’ because their objectives are usually complex. For example, an aim of promoting local economic growth is complex because growth can be measured in a number of ways, each emphasising different values such as employment, wages, consumption, or investment. Other common public service aims, such as greater equality of income and wealth or the provision of public goods (like the justice system or the security provided by the military), are equally difficult to value. A recent Productivity Commission report on access to justice provides one example of such difficulties in its discussion of government-funded legal assistance and the problems of assessing its effects.24 There is clear evidence of the benefits of legal assistance – some international research finds governments can save over eight times the cost of legal assistance
False Economies
16
through avoided downstream use of other public services – but precise quantification of impacts is very difficult. With many public services the value is there, but we cannot readily measure it in a way that directly compares with input costs.
The resulting lack of attention to outputs means that the reduction in services may be greater than the cuts to the resources, meaning that cuts have led to reduced technical efficiency. For example,
technical inefficiency can be created by cutting staff while expecting the same services to be provided. Doing so will usually place a greater burden on the remaining staff. If this makes the work less attractive there may be difficulty in hiring sufficiently skilled staff and salaries may have to increase. There may also be increased turn-over and more resources ultimately devoted to training new staff whom have a lower level of skill and experience than the staff they have replaced. At the same time, the productivity of some staff might drop due to lowered morale and motivation, and possibly even stress-related illnesses. An immediate saving from an inappropriate staff cut can be gradually (or in some cases rapidly) exceeded by the costs of increased salaries and training time, as well as the lowered productivity from reduced experience and motivation. This would be clearly seen if done by companies producing standard goods and services, but often cannot be so readily seen in the reduced quality of many public services.
Lack of attention to outputs can also result in important areas being neglected, while resources are put towards lower priority issues. If local roads in marginal electorates receive funding and a major highway is neglected, there may be more road accidents than if the highway upgrade were funded. This is a failure of allocative efficiency in that the more important work is being ignored. It also has a negative effect on technical efficiency because the costs on the health and disability budget of road accidents will be greater; this is in addition to the costs borne by accident victims and their carers.
In some cases there may be a simple failure to allocate resources to important areas. One of the key roles of public services is to respond to emergencies. It looks more efficient when, in quiet times, capacity is cut in emergency services, health services, security services, or infrastructure services. This type of apparent efficiency has tragic consequences when problems arise, systems fail and responses are inadequate, and is a clear example of where the public sector must maintain reserve capacity that the private sector would find unprofitable.
Inappropriate cuts and savings can also significantly damage dynamic efficiency. The most obvious cases of reduction in dynamic efficiency are cuts to research and education. For example, from the early 1950s to the late 1970s Australia increased its investment in agricultural research, but increases since that time have been much smaller. There is evidence that this plateau in research funding has had a significant effect on agricultural productivity growth, which has decreased from 2.2% per year to 0.4%.25 Failing to invest in research means new techniques and technologies are not created. Insufficient investment in education means a reduced capacity to implement and adapt to new discoveries. Other examples of cuts or savings damaging dynamic efficiency include the loss of skills from staff cuts; this is discussed in Box 3.2 below.
Inappropriate cuts and savings can reduce efficiency due to a failure to acknowledge that efficiency involves results as well as resources (outputs as well as inputs). In a wide range of fields, we see the first things cut by blind efficiency measures can have serious consequences for technical, allocative and dynamic efficiency. The following case study provides a good example of a situation where cuts to public funds would cost more than they would save. It is interesting to note that many of those who would bear the costs might not know that they are benefiting from public funds.
lack of attention to
outputs means that the
reduction in services may
be greater than the cuts
to the resources
False Economies
17
Governments often ensure the availability of low-cost public transport by providing subsidies that reduce the prices of tickets. Whether the actual vehicles are run by the government or a private company, low-cost public transport is a public service ultimately resulting from government funds. It is not generally appreciated that substantial benefits accrue from these subsidised services; benefits not just to the public transport users, but to the wider community, and especially to those who commute by car. This example looks at some of the benefits from Sydney’s trains.
In looking at the benefits of Sydney’s rail public transport the intention is not to make the argument that the current fare and subsidy levels are necessarily ideal. There is a great deal of sensible discussion on issues such as cost recovery rates, fare increases, car use charges and levels of investment in transport infrastructure. The example given here simply demonstrates that there can be substantial economic benefits from low-cost public transport supported by subsidies.
The subsidies to public transport go towards both a general reduction in ticket prices and further reductions on tickets for particular groups, such as school student passes and pensioner tickets. It is probably well understood that the further reductions for specific groups are provided for social justice and equity reasons. What may be less well-known is that the general reduction in prices relates strongly to the external benefits of public transport – the benefits to non-public transport users and the wider community obtained from the operation of public transport.
A large part of these benefits go to those who commute by car. The former Treasurer, Wayne Swan, observed in his final budget speech: ‘Traffic congestion costs commuters time with their families and is estimated to cost our economy up to $20 billion a year by 2020 if not addressed.’26 A full bus takes around 30 cars off the road; a train removes its passengers from the road entirely. Both lead to less traffic congestion and a faster journey with reduced fuel use for those who commute by car. The reduced fuel use also results in significant reductions in emissions that benefit us all.While the logic of public transport reducing congestion and emissions is straightforward, it is more difficult to determine exactly how much benefit car users are deriving and by how much emissions are reduced. However, a report prepared for the Independent Pricing and Regulatory Tribunal (IPART) provides relevant information. This report was written to allow IPART to determine whether the correct level of subsidy was being given to CityRail.27 In its effort to determine optimum subsidies the report used a traffic model to compare traffic congestion under current train use with hypothetical scenarios including having no CityRail trains.
This procedure assumes that public transport affects traffic congestion because commuters shift to other forms of travel if their current mode of travel is unavailable. This assumption is not uncontroversial. It can be argued that over the long-term people adapt to their situation by changing where they live and work to avoid heavily congested roads or to take advantage of relatively clear routes. However, the extent to which adaptation occurs may be limited and occur very slowly, and such adaptations that might occur involve their own costs and benefits. Very few people can change jobs or homes quickly, and many will not go to the effort involved.
Box 1.1: Removing public transport subsidies can be a waste of time – for car commuters
False Economies
18
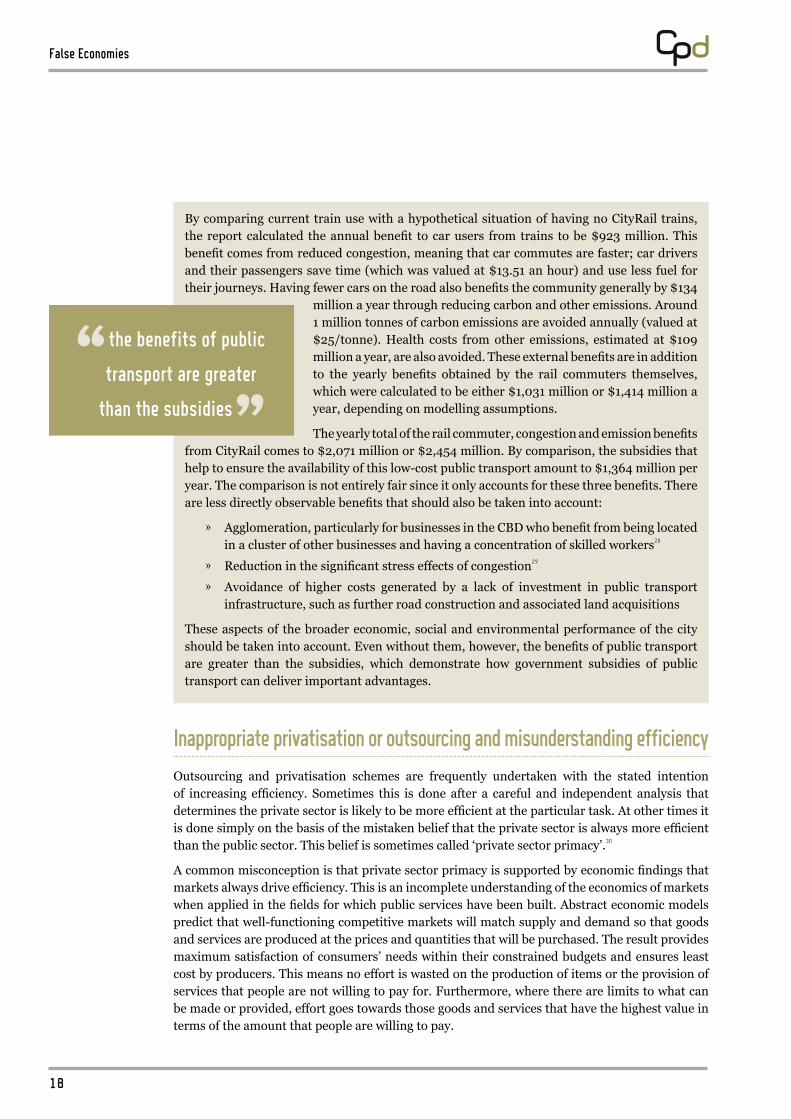
By comparing current train use with a hypothetical situation of having no CityRail trains, the report calculated the annual benefit to car users from trains to be $923 million. This benefit comes from reduced congestion, meaning that car commutes are faster; car drivers and their passengers save time (which was valued at $13.51 an hour) and use less fuel for their journeys. Having fewer cars on the road also benefits the community generally by $134
million a year through reducing carbon and other emissions. Around 1 million tonnes of carbon emissions are avoided annually (valued at $25/tonne). Health costs from other emissions, estimated at $109 million a year, are also avoided. These external benefits are in addition to the yearly benefits obtained by the rail commuters themselves, which were calculated to be either $1,031 million or $1,414 million a year, depending on modelling assumptions.
The yearly total of the rail commuter, congestion and emission benefits from CityRail comes to $2,071 million or $2,454 million. By comparison, the subsidies that help to ensure the availability of this low-cost public transport amount to $1,364 million per year. The comparison is not entirely fair since it only accounts for these three benefits. There are less directly observable benefits that should also be taken into account:
» Agglomeration, particularly for businesses in the CBD who benefit from being located in a cluster of other businesses and having a concentration of skilled workers28
» Reduction in the significant stress effects of congestion29
» Avoidance of higher costs generated by a lack of investment in public transport infrastructure, such as further road construction and associated land acquisitions
These aspects of the broader economic, social and environmental performance of the city should be taken into account. Even without them, however, the benefits of public transport are greater than the subsidies, which demonstrate how government subsidies of public transport can deliver important advantages.
the benefits of public
transport are greater
than the subsidies
Inappropriate privatisation or outsourcing and misunderstanding efficiencyOutsourcing and privatisation schemes are frequently undertaken with the stated intention of increasing efficiency. Sometimes this is done after a careful and independent analysis that determines the private sector is likely to be more efficient at the particular task. At other times it is done simply on the basis of the mistaken belief that the private sector is always more efficient than the public sector. This belief is sometimes called ‘private sector primacy’.30
A common misconception is that private sector primacy is supported by economic findings that markets always drive efficiency. This is an incomplete understanding of the economics of markets when applied in the fields for which public services have been built. Abstract economic models predict that well-functioning competitive markets will match supply and demand so that goods and services are produced at the prices and quantities that will be purchased. The result provides maximum satisfaction of consumers’ needs within their constrained budgets and ensures least cost by producers. This means no effort is wasted on the production of items or the provision of services that people are not willing to pay for. Furthermore, where there are limits to what can be made or provided, effort goes towards those goods and services that have the highest value in terms of the amount that people are willing to pay.
False Economies
19
The tough and invisible hand of the market, according to this model, ensures both allocative efficiency (markets provide only those things people want) and technical efficiency (high-cost producers go out of business). The model is limited, however, as the real world departs from the abstract model in many important ways. Sometimes the departures are minor, and the costs to bring about ideal outcomes would be greater than the cost of departures from the ideal. But in many cases the costs of ‘market failure’, to use the conventional economic term, are such that public intervention through government provision (e.g. roads), funding (e.g. health care) or regulation (e.g. the finance sector) is required. Markets have repeatedly been shown by economic analysis to fail to deliver efficiency in a range of circumstances. These are outlined below:
Non-competitive conditions
Public services are provided mainly in areas where standard competitive market conditions do not apply. Unlike services delivered through competitive markets, public services possess some unique characteristics: distributional outcomes are particularly important (for example in the tax-transfer and welfare support systems); services are thought best to follow need rather than willingness or capacity to pay (like justice or disability services); minimum service levels are desired even if they are high cost (like services to rural and remote communities, or to Australians travelling abroad); and certain collective goods are delivered that cannot be produced in a market (like defence and immigration). Public services often involve elements of regulation, or overwhelming commitment to the public rather than private interest (like parliamentary services, the military and police). Such services are not best provided in a framework where the primary motivation is profit.
Single buyer
In a public service outsourcing the government is often the only buyer, so this is not a genuine competitive market. The market power of the one buyer is often used to get very low prices from suppliers. This can be a benefit since the savings from these low prices allow more services to be provided to the community. However, this market power can be misused to drive prices so low that there are long-term costs. For example, many Australian charities and other not-for-profit bodies have been used to deliver low cost welfare services, but this has often been at the expense of program effectiveness or dynamic efficiency. Pricing is often too low to sustain adequate training, employ fully qualified staff, or to develop new service models. A range of service quality disasters have come to light over the years in areas like child care and nursing homes, requiring costly fixes, re-regulation and so on.
Alternative means of competing
As mentioned above, markets can drive technical efficiency in that they involve competition. Being able to produce the same quality of outputs at lowest cost is one way of out-competing alternative providers. However, there are numerous other ways to appear to be competitive, such as reducing quality in ways that are hard for customers to detect, spending more on marketing, greater access to capital, or maintaining superior access to buyers. This means that outsourcing to create a market will only improve efficiency to the extent that attempting to produce the same quality outputs at a lower cost is the dominant form of competition in the new market. Because of the complexity of measuring public service outputs it can be difficult for even a well-informed government buyer to ensure that lower bids for public service contracts do not simply result in lower quality services, rather than efficiency.
False Economies
20
Principal-agent problemThis problem occurs when an individual or organisation (an agent) is carrying out work on behalf of someone else (the principal). Where the interests of the agent and the principal are not exactly aligned, problems can easily arise. Because the agent is doing the actual work they will frequently have more knowledge about how the work should best be done (called information asymmetry) and it can be difficult for the principal to oversee the work effectively. The result is a tendency to produce outputs that are suited to the needs of the agent rather than the principal. A well-designed incentive system can ensure that the interests of principal and agent are aligned. However, as mentioned above, the objectives in public services are often complex and difficult to quantify. This makes designing effective incentive systems extremely difficult, and means that outsourcing works only for simply specified services; otherwise contractors tend to focus their attention on generating impressive performance according to indicators that may not relate well to the principal’s actual objectives.
De-skillingPublic service agencies as designers of programs and purchasers of services begin to de-skill as they have diminishing roles and experience of the front-line, and this exacerbates the principal-agent problem. Procurement and recruitment skill problems emerge, and several have been reported in recent years. Difficulties arise with designing and implementing new services, particularly when policies are crafted without proper consideration of practical constraints or with inadequate knowledge of innovations in delivery that open up policy options.31 Some departments have reached the point that they must turn to contractors even for the smallest tasks that ministers might give them. To a large extent, it is only because so many private contractors are former public servants that the necessary skill is available at all. As these public service trained workers start to age and retire there is a much thinner pool of replacements coming through, depending on how much capacity has been retained in the various areas of service.
Loss of economies of scaleMany fields of public activity involve networks and scale efficiencies. These often are most efficiently delivered as single public systems. An example may be the much lower administrative cost per dollar disbursed by Medicare (a nation-wide health insurance scheme) relative to the multitude of higher cost private health insurance schemes. Other examples arise in road networks, statistical collections, meteorology services and many others.
The private sector is not inherently more efficient than the public sector in the delivery of public services.32 Taking a full view of efficiency, there is no evidence that private schools are more efficient than public schools,33 that private health and hospital services are more efficient than public health and hospital services,34 or that private regulation and codes of practice work better or are better enforced than public regulation in many fields. In some situations privately provided
services may be more efficient, but in others they are less efficient. This means that decisions on whether or not to outsource or privatise need to be made only after independent, robust and comprehensive analysis of the likely impacts on efficiency and other key policy goals. Such analysis should try to identify all costs involved, including costs transferred to users of government services. The future must have as much weight as the present in the assessment. Making choices in this way is, of course, more difficult than a simple rule-based preference for a certain sector, but is likely to lead to better results. The following case study is a good example of where the presence of some of the above described factors (non-competitive conditions, alternative means of competing and loss of economies of scale) means the case for government involvement is clear.
The private sector
is not inherently more
efficient than the public
sector in the delivery
of public services .
False Economies
21
Box 1.2: A clear need for government leadership – the National Broadband Network (NBN)
The private sector is not well-suited to leading the construction of big networks. The best way to build a national network, regardless of whether it is communication or transport, is through the leadership of a national government. That does not mean that there cannot be substantial private involvement. A great deal of the work of rolling out the NBN is being done by private contractors. But for a number of reasons, three of which are outlined here (uncertainty over the timing of economic returns, need for consistency in roll-out and avoiding duplicated networks), public sector leadership is vital to settling key objectives and standards of delivery.
The most significant problem for private sector leadership in constructing an NBN is the uncertainty of the timing of economic returns. The value of a network does not increase in a predictable fashion. The first private telephones were a novelty, but not very useful. A hundred phones across an entire country are unlikely to connect you to many people you know. Perhaps even a thousand phones will not be useful, but at some point the network is of enough value that everyone wants to be part of it and the way we communicate is changed forever. At that point the network becomes economic to run, but the timing of that point is impossible to predict. This is a high risk for private sector investors, who generally cannot bear this timing uncertainty.
Another problem is with consistency and reliability. It would be extremely difficult to find a private company big enough to take on the entire task of rolling out a NBN (and even if that were possible, it would create a monopoly and remove any possible benefits of private sector competition). If a network is built by a variety of organisations there will be differences in the kind of network installed and the way it is set up in different areas. This will constrain the way in which the network can be used. For example, an organisation may wish to invest in high quality video conferencing because of the savings that can be made by having employees telecommute. However, if it is uncertain that all employees will be able to use the system successfully from home, depending on where they live, then the investment will likely not be made. The consistency involves a number of factors, not just the speed, but aspects such as its ‘jitter’ (tendency to have slow periods and bursts of speed) and ‘latency’ (delay in transmission). Inconsistencies in these respects can make communication much less intelligible and cause data losses. A government-driven national roll-out with a guarantee of certain minimum standards gives a consistency that broadens the potential applications of the network.
Inconsistency and unreliability are of particular concern for rural communities, since it is in these smaller markets where reduced incentives for private investment make these problems more likely. These problems are a disincentive for businesses to operate in rural areas. If a level of consistency is guaranteed, not only do rural areas benefit, but arguably strain on capital cities is reduced.
A further problem is the likelihood that competing networks may be built alongside each other. An example of this is the needless duplication involved in having separate Optus and
across the spectrum of
politics, regardless
of beliefs about big or small
government, there is broad
agreement that leadership
of the construction of
Australia’s next significant
network is best provided
by government .
False Economies
22
Telstra mobile phone tower networks. This leads to many areas having two towers when only one would be required for the number of mobile phones in the area, while other areas miss out. Not only is building duplicate networks a waste of resources, the costs of which are largely passed on to consumers through higher charges, but it can cause numerous other inefficiencies. For example, both Telstra and Optus offer ‘cable internet’ connections which operate through a hybrid fibre-coaxial cable (HFC) network. Because Telstra and Optus each have their own HFC network it is not possible to change providers remotely. Instead it involves a technician visiting the premises in order to run a second cable and install a second socket in the wall.
The case for Federal Government leadership in providing an NBN is so strong it has more-or-less been accepted by all major political parties. Most of the media debate on NBN policies during the 2013 Federal Election focused on whether there was a false economy in the Coalition’s NBN plan of rolling out fibre-optic cable to ‘nodes’ for most streets and connecting to the existing copper network from there, rather than connecting fibre directly to almost every house under Labor’s plan. Less commonly discussed is the Coalition’s acceptance that Australia should have an NBN and that the primary responsibility for providing it must lie with government.35 This position has been maintained since the election.
Although the Coalition has said that it will remove the regulations that currently prevent competing networks from being built, there is as yet no estimate of the extent to which the private sector is likely to take up this opportunity. The Coalition is holding the position put by Abbott prior to the election: ‘let a competitive market deliver the speeds that people need at an affordable price with government improving infrastructure in the areas where market competition won’t deliver it.’36 The National Commission of Audit report recommended that the NBN Co. only be privatised after roll-out was completed.37 This means that across the spectrum of politics, regardless of beliefs about big or small government, there is broad agreement that leadership of the construction of Australia’s next significant network is best provided by government.
Effectiveness and equityThere is another factor that applies to both of the errors discussed above (inappropriate cuts and inappropriate privatisations or outsourcing), and that is governments giving insufficient consideration to two concepts that are related to efficiency: effectiveness and equity. These two concepts reflect the expectation that the public sector serves the wider economy and society. Consideration of efficiency needs to take this into account.
A good definition of effectiveness is: the relationship between purpose and results. In other words, an action undertaken by the public service, or a public sector organisation, is effective if it achieves the objective that was intended.38 This means if a health department implements a vaccination program to reduce the occurrence of a disease, the program is effective if it does reduce the number of infections.
In relation to public services, equity most commonly refers to both the equal treatment of equals (where there are similar levels of need and the service is equally accessible to all) and the unequal but fair treatment of unequals (where services account for the special needs of particular groups in the community).39 Equity can involve equity of access, so all Australians are expected to have adequate access to services, and equity of outcome, whereby all Australians are expected to receive
False Economies
23
two concepts that are
related to efficiency:
effectiveness and equity…
reflect the expectation
that the public sector
serves the wider
economy and society
similar outcomes resulting from service use. For example, a vaccination might be made freely available to all (equity of access), or may be made available free to certain vulnerable groups, such as children or those with an underlying medical condition, so that those groups are as safe from the effects of the disease as the general non-vulnerable population (equity of outcomes). For many Australians, equity also has other dimensions. These can be important for many policies, and include spatial equity (particularly for those in remote and rural areas), intergenerational equity and social dimensions such as gender equity.
To make clear the relationship of these concepts with efficiency, consider the hypothetical example of a new vaccine (either newly developed or newly introduced into a country or region). The vaccine might be most effective at reducing the number of infections if it is delivered to everyone at around the same time. However, it might cost more to provide it in a burst than it does to spread out the provision over a longer time period, because many nurses have to be trained to administer the vaccine rather than just few who can travel around administering the vaccine over time. Providing the vaccinations all at once means that the cost of each vaccination is higher and this might seem inefficient. But a cost cutting measure to train only a few nurses, and have them travel to different communities and administer the vaccine, would reduce the effectiveness of the program (and potentially the equity since remote communities might be disadvantaged by getting the vaccine late). Even though providing the service in a burst means more resources used per vaccine, this may still be efficient if the additional effectiveness and equity are worth the increased cost.
In practice, it can be very difficult to establish the connections between inputs and outcomes because they tend to be influenced by a range of factors and there is often delay between the outputs being provided and their effects starting to show. However, wherever possible the effects of cuts or outsourcing on the public service’s broader role need to be assessed to ensure a narrow pursuit of efficiency does not damage effectiveness or equity.
The Federal Government’s stimulus package in response to the Global Financial Crisis (GFC) provides a good example of why the public service’s wider role needs to be taken into account when assessing its efficiency, as set out in Box 1.3.
Box 1.3: It’s not just the size of your stimulus package, it’s the way you use it
Australia was one of only three advanced economies that avoided recession during the GFC, which has ensured the Federal Government’s fiscal stimulus package has been widely acclaimed. ‘One of the best designed Keynesian stimulus packages of any country’ stated Joseph Stiglitz, former World Bank Chief Economist, Clinton administration economic advisor and recipient of the Nobel Memorial Prize in Economics. An open letter circulated in 2010 and signed by more than fifty professors and lecturers from Australia’s leading universities praised the Federal Government’s actions in stimulating the economy, avoiding a recession and preventing mass unemployment.40 The IMF also commended the ‘quick implementation of targeted and temporary fiscal stimulus’.41 It was considered to be ‘among the most effective in the OECD’.42
Joseph Stiglitz provides a cogent argument in support of the package and the efficiency with which relevant government agencies undertook delivery.
False Economies
24
If you hadn’t spent the money, there would have been waste. The waste would
have been the fact that the economy would have been weak, there would have
been a gap between what the economy could have produced and what it actually
produced – that’s waste. You would have had high unemployment, you would
have had capital assets not fully utilised – that’s waste. So your choice was one
form of waste verses another form of waste. And so it’s a judgment of what is the
way to minimise the waste. No perfection here. And what your government did
was exactly right.43
The calculations of the Commonwealth Treasury support Stiglitz’s analysis. Estimates indicate that growth would have been negative for three consecutive quarters without fiscal stimulus. Originally the fiscal stimulus was forecast to increase GDP growth by two percentage points in 2009 and to detract around one percentage point from growth in 2010; the estimates have changed only slightly since then.44 This suggests the effect of the stimulus package was to avoid the waste of our economy being $7 billion smaller, from factors such as unemployment and capital asset underutilisation.45
It is interesting to note that although Australia’s stimulus package was one of the largest as a percentage of GDP, a number of countries with large stimulus packages did not perform very well subsequently. The OECD has concluded that the effectiveness of the stimulus was due to both the size of the measures and the speed with which it was introduced. The targeting of the stimulus to households (particularly those on modest incomes) and to school buildings (which can be undertaken rapidly) also contributed to the speed of its effect.46 Design was critical, and required sufficient public service capacity to plan, cost, establish and monitor large projects against very tight time-frames.
Additional explanations have been suggested for Australia’s performance during the GFC. Some of these also point to the critical role of a high-quality public service, particularly in two respects:
» Banking regulation - None of our major banks failed, and Australia was one of only two advanced G20 countries that did not need to make a government injection of funds to the banking system (though, as in many countries, the government did issue guarantees for bond issuance and deposits). OECD analysis shows that our regulations were not stricter, but they were well implemented. Our banking system ‘benefited from years of rigid supervision by “better than world-class” financial regulators’.47
» The Reserve Bank - Appropriate actions by the Reserve Bank, and supporting government monetary policy, helped to maintain the stability of the financial system during the GFC, and was no doubt a key factor (though indications are that the full effect of monetary policy is usually delayed and was muted by the nature of the financial shock).48
Other explanations for Australia’s success have been offered that imply less of a role for government, such as population growth, structure of the economy and demand from our major trading partners, especially China. Indeed, China’s demand is the main reason usually given as an alternative explanation for why we did so well. The economist Steve Keen has argued this cannot be the case: if our current economic position had been the result of China’s strong economy (itself boosted by a substantial stimulus program) then export industries
False Economies
25
would have experienced employment growth first, followed by the rest of the economy. The reality is the growth was driven by industries benefiting most from the stimulus.49
The likelihood is that all these factors played complementary roles, with the non-government aspects being fed by, and feeding into, the effectiveness of government actions. It should be kept in mind that the ‘non-government’ aspects may have involved a significant government role in the long-term, for example, immigration policy affecting population growth and international trading relations facilitated by diplomacy.
There are some who continue to dismiss the efficacy of the government’s action during the GFC, criticise waste in the stimulus package, and argue against its overall size. These are worthy topics of discussion to ensure further improvement. Nevertheless, evidence suggests the timely government intervention in a slowing global economy was a necessary condition for the avoidance of recession, preventing mass unemployment, and safeguarding an economy that remains one of the strongest in the developed world.
ConclusionGiven the scale and significance of the work that the public sector undertakes, its overall efficiency is clearly important. However, permitting mistaken notions of efficiency to drive policy will result in ‘efficiency reforms’ that actually increase waste. To avoid these mistakes, policies on public sector efficiency must:
» Focus as much on results as on resources (outcomes as well as inputs) of public service programs; when cuts are announced, evidence should be provided that the same services can be maintained with fewer resources, or the likely reduction in services should be outlined at the same time
» Ensure that short-term efficiency gains will not result in larger long-term efficiency losses
» Conduct independent and thorough investigation into the advantages and disadvantages of in-house and outsourced service provision before any outsourcing decisions are made
» Conduct independent and thorough investigation into the advantages and disadvantages of public and private ownership of public service organisations or infrastructure before any privatisation decisions are made
» Consider society-wide costs, not just direct costs to government budgets, so that public service cuts do not impose costs on the population that are greater than the savings.
Our public sector suffers the plight of the anorexic. No matter how thin it gets there are voices saying it is too fat. The word ‘efficiency’ is often misused to mean ‘cuts’, and some cuts to public services can end up costing us much more than they save.
Our public services do a lot for us. They need to be efficient, effective and fair. This will not be achieved by endless cuts or by blind faith in market solutions. We need to consider results as much as resources, we need to think long-term, we need to consider carefully the benefits and disadvantages of outsourcing and privatisation, and we need to be aware of society-wide costs, not just direct costs to government budgets.
evidence suggests the
timely government
intervention . . . was a
necessary condition for the
avoidance of recession
False Economies
26
False Economies
27
2: Bang for our bucks
Efficient government?Australia’s public sector is among the most efficient in the world. Although it is difficult to measure efficiency precisely in the provision of public services, data from respected international organisations reveal that Australia performs very well compared to similar countries on all three kinds of efficiency discussed in Chapter 1. This should not be a surprise given the kinds of expectations Australians have of their governments (whether Federal, State or Local). Although comparisons are often made between Australia and the high-taxing countries of Northern Europe, particularly when considering the performance of our public sector in areas such as health and education, our taxation levels are actually far closer to low-taxing countries such as the USA and South Korea. Australians expect Northern European services on a USA budget, and largely this is what they receive.
As pointed out in the first chapter, government bureaucracies are often falsely assumed to be inefficient. This kind of thinking might interpret international comparisons as showing that Australia is the best of the worst. However, as was also discussed earlier, the assumption that the private sector is always necessarily more efficient than the public sector is not supported by theory or evidence. In what follows we also compare the efficiency of the two sectors. The limited evidence available in Australia shows little difference in overall efficiency.
The fact that the Australian public sector is highly efficient does not mean that there is no room to improve. Even the most efficient organisations may have areas of work, or aspects of activities,
False Economies
28
that could be improved. After setting out in more detail the evidence of efficiency just outlined, the final chapter of this report will concentrate on two aspects of the APS where there may be opportunities for increased efficiency. When reading these sections it is important to keep in mind the broader context. In general the APS runs efficiently and the potential reforms discussed here represent enhancements. While striving for improved performance is important, previous achievements should not be taken for granted, or worse, reversed.
International comparisonThe difficulties in measuring efficiency have previously been mentioned. Quantifying the inputs, or resources, is usually straightforward. It is the outcomes, the results, which are frequently difficult to measure. This remains the case when comparing across countries.
Technical efficiency: Resources and results
Comparing taxes internationally is complex because most countries, including Australia, have a combination of different taxes, and every country’s mix is different. However, the OECD provides comparative data on wage taxes and total taxation that supply a decent picture of our position. Despite common perceptions, Australia actually has a low level of taxation compared to countries with similarly structured economies.
While there are some complexities in comparing the amount of revenue different countries gain from taxation, it is possible to get a clear picture of Australia’s relative level of taxation. Contrary to some common perceptions, Australia is a low-tax country. Figure 2.1, below, shows Australia’s total taxation as a percentage of GDP (the data is from 2011 as this was the most recent year with complete information).50 In 2011 we were the fifth lowest taxing country out of thirty-four in the OECD.
Figure 2.1: Total taxation as proportion of GDP for OECD countries (2011)
The outcomes of the different governments are harder to quantify. A number of international organisations have created different measures of various aspects of government performance. Two of the most well-known are those produced by the World Economic Forum and the World Bank. The Basic Requirements Sub-index of the Global Competitiveness Index (GCI) produced by the World Economic Forum incorporates measures of the strength of public institutions, the level of infrastructure, the macroeconomic environment, health outcomes and primary education, and so is a good indicator of government effectiveness across a number of areas.51 The World Bank’s World Governance Indicators include a Government Effectiveness measure, which aggregates a range of other measures by organisations such as the Economist Intelligence Unit and the World Economic Forum.52 Because it is a broad ranging aggregate measure it will be used here as the measure of government effectiveness. In any case, there are strong similarities between the results given by different government effectiveness measures.53 Table 2.1 below gives the ranks within the OECD on the two measures just discussed. Of the thirty-four countries, nineteen of the rankings are within two places of each other, and only two countries have rankings with a difference of more than seven.
Table 2.1: OECD countries ranks in two measures of government effectiveness
WGI 2011: Government
Effectiveness
WEF-GCI: Basic
Requirements 2010-2011
Finland 1 3
Denmark 2 5
Sweden 3 2
New Zealand 4 10
Switzerland 5 1
Norway 6 13
Netherlands 7 6
Canada 8 8
Luxembourg 9 7
Australia 10 9
Belgium 11 15
Austria 12 11
Iceland 13 25
United Kingdom 14 14
Germany 15 4
United States 16 19
Japan 17 18
Ireland 18 21
France 19 12
Israel 20 24
WGI 2011: Government
Effectiveness
WEF-GCI: Basic
Requirements 2010-2011
South Korea 21 16
Chile 22 22
Estonia 23 17
Spain 24 23
Slovenia 25 20
Portugal 26 26
Czech Republic 27 27
Slovakia 28 29
Hungary 29 31
Poland 30 30
Greece 31 33
Italy 32 28
Turkey 33 34
Mexico 34 32
ncountries with ranks on the measures within two places of each other, countries
ncountries with differences in ranks of three to seven places
ncountries with a difference of eight or greater
False Economies
30
It should be noted that the World Governance Indicators also include indicators of ‘regulatory quality’, ‘rule of law’ and ‘control of corruption’. All could potentially be regarded as part of the outcomes of government and thus a measure of its effectiveness. However, we will focus on the indicator that specifically measures government effectiveness. This indicator ‘captures perceptions of the quality of public services, the quality of the civil service and the degree of its independence from political pressures, the quality of policy formulation and implementation, and the credibility of the government’s commitment to such policies’.54 Note that this measure does not attempt to determine the contributions of different levels of government. It is a measure of the effectiveness of the entire public sector of each country. Comparing Australia with the same set of OECD countries in 2011 (the same years as the tax revenue comparison) places us as the 10th most effective government, behind the Netherlands, Canada and Luxembourg but ahead of Belgium, Austria and Iceland.
Importantly, Australia is the only OECD country to be in the top ten most effective governments and the bottom five lowest taxing governments. This is strong evidence that we have a far more efficient government than most of our peer countries. The follow scatter diagram illustrates this by plotting rank in effectiveness against reverse rank in taxation. The countries plotted closest to the top right hand corner have the highest technical efficiency. Only Switzerland is closer to that corner than Australia, meaning that on this measure we have the second most efficient government in the OECD.
Figure 2.2 - OECD countries ranked by lowest taxing and highest effectiveness (2011)
AUSTRALIA
AUSTRIABELGIUM
CANADA
CHILE
CZECH REPUBLIC
DENMARK
ESTONIA
FINLAND
FRANCE
GERMANY
GREECEHUNGARY
ICELAND
IRELANDISRAEL
ITALY
JAPAN
KOREA
LUXEMBOURG
MEXICO
NETHERLANDS
NEW ZEALANDNORWAY
POLAND
PORTUGAL
SLOVAK REPUBLIC
SLOVENIASPAIN
SWEDEN
SWITZERLAND
TURKEY
UNITED KINGDOMUNITED STATES
POO
RLY
EFF
ECTI
VE
HIG
HLY
EF
FECT
IVE
HIGH TAX LOW TAX
Source: Adapted from OECD, Revenue Statistics 1965-2011: 2013 Edition, 2013; and World Bank, Worldwide Governance Indicators, 2013.
False Economies
31
The precise position of different countries on the graph can be debated, for several reasons. Some countries may prefer certain measures making up (or not included in) the government effectiveness indicator. There may be disputes over the particular methodologies used to calculate the measures making up the government effectiveness indicator, as well as the methodology of the World Bank’s aggregation. Notably, superannuation payments are not counted as a tax because they provide personal benefits to the contributor, and it could be argued this boosts Australia’s apparent efficiency in one area of public services. This means the above graph is merely indicative. The clear indication, however, is that Australia does well in technical efficiency terms, delivering high outcomes for low inputs.
A 2005 paper by Antonio Afonso, Ludger Schuknecht and Vito Tanzi came to similar conclusions when it examined the efficiency of the public sector in 23 OECD countries, including Australia.55 The paper used a variety of socio-economic measures as indicators of different aspects of government performance, including administrative, education, health and public infrastructure outcomes, as well as government achievements with regards to income distribution, economic stability and economic performance. These indicators, along with public expenditure were used to give an overall public sector efficiency score. Of the 23 countries, Australia ranked third.
Allocative efficiency: Doing the right workAssessing the allocative efficiency of Australia’s public sector is more difficult, but there are positive indications that the public service is efficient in allocating resources. Australia is well regarded by the OECD for having a well ‘targeted’ welfare system; this means that a greater proportion of government-provided benefits and subsidies go to those who are disadvantaged. For example, in 2005 Australia had the lowest level of government transfers (18.6%) going to the wealthiest half of the population. The OECD average was 45.4%.56 Of course, some of the countries that distribute more money to higher earners have deliberately chosen a universal approach, whereby benefits or subsidies are an entitlement attached to citizenship and participation, not disadvantage. This approach inflates the average OECD transfers to the wealthy. Regardless, Australia’s level of targeting is an indicator of its ability to direct its resources to where they are most needed.
The analysis by Afonso, Schuknecht and Tanzi on public performance also took into account allocative factors and found Australia was above average on this measure.
Dynamic efficiency: Adapting over timeThe extent to which the public sector takes advantage of new modes of operating, its dynamic efficiency, is particularly difficult to assess. However, if a public sector is maintaining or improving its technical efficiency relative to that of other countries, one might presume a corresponding increase in dynamic efficiency. Equally, if a public sector’s dynamic efficiency was poor compared to other countries, one would expect it to fall behind those countries on other measures of effectiveness and efficiency over time. Examining Australia’s taxation revenue and government effectiveness, we can observe its ranking has improved over time, which suggests that relative to other countries, the Australian public sector has been adapting well to change. There is perhaps an open question as to whether all governments have a substantial dynamic efficiency problem. Resolving this question will become more important given the pace of change and connectivity of modern governments.
we have a far
more efficient
government than
most of our
peer countries
False Economies
32
Figure 2.3 - Australia’s OECD Rank in effectiveness and low taxation over time
Source: Adapted from OECD, Revenue Statistics 1965-2010: 2011 Edition, 2011; and World Bank, Worldwide Governance Indicators, 2013.
Sector comparison Despite the difficulties of measurement there is sufficient data to make the case that Australia’s public sector compares well internationally to other public sectors. However, there is far less data available on the relative efficiency of Australian public and private sector organisations.
Limited Australian data
An obvious way to compare the public and private sectors is to look at situations where services provided by government are partially or completely privatised. This means private and public organisations performing a similar role could be compared. Although Australia has had a large number of government functions privatised,57 very few cases have sufficiently good data to compare government provision with private and community sector provision. Box 2.1 and Box 2.2 outline two brief examples of these difficulties:
2002 2003 2004 2005 2006 2007 2008 2009 2010
Effectiveness Rank Low Taxation Rank
2
4
6
8
10
12
14
16
18
20
22
24
26
28
30
32
34
False Economies
33
Box 2.1: Privatising Federal Government legal services
Over the past 15 years private providers have increasingly supplied the legal services required by Federal Government departments and agencies. For much of the 20th century, public sector legal demand was primarily supplied by the Attorney-General’s Department (AGD), in particular the Australian Government Solicitor (AGS).58 Following the recommendations of the 1996 Logan Review, which concluded that the role of government legal service providers should be confined to legal matters in the public interest, the AGS was transformed into an independent Government Business Enterprise operating as a private entity.59 The reforms also expanded use of a user-pays model, enabling government departments and public authorities to contract their litigation matters and legal advice to private law firms.
At the time, the privatisation of legal services was largely justified on the basis of cost-effectiveness.60 Evidence suggests that after these reforms the level of expenditure on legal services rose substantially.61 This might seem to indicate that privatisation has led to an increase in legal costs. However, other evidence points to a rise in private sector legal costs over the same period. In both cases the data is flawed. The private sector data come from a series of ABS surveys, and the report that collates them specifically warns that changes in methodology of the survey mean that comparisons between years are not reliable.62 In the public service the estimate comes from comparing four different sets of reports conducted at various times; it is acknowledged none are likely to be comprehensive.63 Also, there has been little research on the drivers of the increased demand for legal services. Therefore, it remains unclear whether the sectors can be compared at all, or whether their demand is responding largely to different drivers. It is impossible to tell from the limited evidence whether privatisation has partially restrained rising legal costs for the public service, or if it has added to them
Box 2.2: Public and private employment services
In May 1998, the Federal Government instituted a comprehensive overhaul of employment services in Australia. The public Commonwealth Employment Service (CES) was replaced by the Job Network (JN). In 2008 a restructure was announced and the JN became Job Services Australia (JSA). The JSA retained the same fundamental architecture. Both programs were composed of over 100 for-profit and non-profit organisations that tendered bids to offer employment services within Australia. The rationale for privatising the CES was fourfold. By increasing competition, it was thought that labour market assistance programs would: operate more flexibly; at lower cost; whilst delivering more personalised service; and, above all, produce more sustainable employment outcomes.64
The most visible sign of JN/JSA’s success has supposedly been the maintenance of a low headline unemployment rate, particularly during the Global Financial Crisis. Over the past decade, the headline unemployment rate has averaged 5.4%.65 By contrast, the mean unemployment rate between January 1990 and December 1997 was approximately 9%.66 However, difference in economic conditions certainly affected this, since the JN/JSA was introduced at a time when Australia was enjoying a sustained period of economic growth, with a corresponding inevitable decrease in unemployment.67 Moreover, the weight given to
False Economies
34
unemployment obscures the high rate of underemployment. The number of people identified as underemployed since 1994 has increased by 50%.68 Australia’s rate of underemployment, 7.2% of the work force, is the highest in the OECD.69 As Monash University researcher Veronica Sheen states, the effect of this is that ‘where hours of work are insufficient, even though the hourly minimum wage is relatively high, the financial situation of such job-seekers remains unaltered’.70
Research into the JN/JSA’s achievements has given mixed results. A 2008 study conducted on long-term outcomes for JSA participants by the Department of Education, Employment and Workplace Relations (DEEWR) found that 78% of program participants who had retained a job for three months went on to remain in work sixteen months later. On the other hand, DEEWR noted that at the end of sixteen months, only 50% of participants had been successful in obtaining full time work.71 Little research has been conducted on job placement outcomes in the long term; that is, how quickly the unemployed swing between employment and income support benefits.72 Within the JN/JSA system, job placement outcomes are measured on a time scale of three to six months following commencement of a role, which has limited utility as a measure of sustainable employment.73 An evaluation of the JN in 2006 found that there
had been a 10.1% impact by the labour market programs in assisting long-term unemployed individuals obtain employment over and above what might have occurred without assistance; in other words, individuals participating in the scheme had a 10.1% greater chance of finding employment than if there was no assistance at all.74 In 2011 an evaluation of the JSA showed it had overall employment outcomes of 30%-40%, but this is mostly short-term and casual work, and the evaluation does not compare against a baseline.75
Regardless of whether these achievements are taken to indicate the success of the JSA, there is no comparable data from CES operations. This means there is no way of determining whether the JSA has been more or less successful than the public sector entity it replaced.
In addition to the difficulties in obtaining data on the relative performance of public and private sector service delivery, these cases also reveal privatisation is often imposed without a suitable evaluative framework. When a change is implemented, there should be an evaluation procedure to answer the question: ‘how will we know if the change has succeeded?’ This should involve data-capture techniques to confirm or reject a hypothesis – the hypothesis in this case being that the private sector provider is cheaper or more effective.
Cost savings from structure not sector
Although Australian data is limited, looking at international studies of privatisation gives an answer to the question of how well public sectors generally compare to the private sector in terms of efficiency. Advocates for privatisation have made strong claims about its ability to generate efficiency, but such claims in many cases do not stand up to rigorous analysis. One study, which examined over a hundred case studies and reports on outsourcing, provides clear empirical evidence on the question of sector efficiency.76 It found there was, on average, a cost saving from contracting out. However, the saving was similar regardless of whether it was private contracting or in-house contracting by competing units in the public service. Earlier in this report it was pointed out that competition can, but does not necessarily, drive efficiency. In these cases it did, but it did so regardless of whether organisations were publicly or privately owned.
What this means is that the gains from complete privatisation can also be achieved by introducing
False Economies
35
contestability within the public sector or by only partial privatisation. (It should be kept in mind that the introduction of contestability can increase efficiency, but may not always do so.77) While the gains may be the same, there can be additional losses from failing to keep some level of public sector capacity in provision of services, as Box 2.3 illustrates:
Box 2.3: Public sector works are cheaper with public sector skills
The Building the Education Revolution (BER) program, implemented as part of the Rudd Government’s stimulus package, was the biggest single program of school building upgrades in Australia’s history. Some media outlets strongly argued that the value for money outcomes of the BER program demonstrated the merits of small government and that governments were not suited to delivering nation-building projects.78 The reality is the reverse: governments that have attempted to downsize too heavily have delivered projects with lower value for money.
Evidence for this assertion was set out in the Centre for Policy Development’s paper by Tim Roxburgh, ‘Public works need public sector skills: The lost lessons of the BER program’.79 One of the findings was that States with the lowest levels of public works related skills capacity (i.e. less public sector employees with skills related to public works) ended up paying more for the works undertaken. By extrapolating this finding to public works generally, we can see how maintaining public works capacity in government can lead to substantial savings well in excess of the costs.
The final report of the BER Implementation Taskforce provided comprehensive information on the value for money achieved by different States.80 It is instructive to compare Queensland, which maintained a relatively strong public works skills capacity, and Victoria, which had a very low capacity.81 Queensland public schools benefited from a dollar per square metre rate of $2,753, while Victoria paid $3,114 per square meter. Victoria spent an average of 13% more on each square metre of public works undertaken as part of the BER.
There are a number of potential reasons for this difference. However, looking across the five most populous States, the two States with the highest costs (Victoria and NSW) were those most reliant on external contractors.82 The BER Implementation Taskforce concluded that public works capacity was a critical factor, and its reduction represented a ‘false economy’.83 In other words, the savings made by having a reduced number of skilled public works employees are less than the costs incurred, because more money is spent for the work done.
It is possible to test this claim by approximating the savings and costs involved across all public works of different States in a year. These salary costs can then be compared with an estimate of the savings in public sector building in the same year, to assess whether public sector workers deliver more value for money.
The costs can be calculated by comparing an estimate of the skilled public works annual staff salary costs of a high capacity State like Queensland with the estimated salary costs of a low capacity State like Victoria, using census data from 2011 (the year after most of the BER program activities had finished). Calculating how much less Queensland would spend if it had the same staff costs per head of population as Victoria gives an approximation of the potential annual savings in staff salaries. Looking at the likely additional amount Queensland would have spent on its public works gives an idea of the potential annual increased costs in contracts.
This gives an inherently very conservative estimation of the extent of the false economy for two reasons. Firstly, the calculations assume that Queensland would have a proportional capacity by spending a similar amount per person as Victoria. In reality, Queensland’s population is
False Economies
36
more geographically dispersed than Victoria’s, which adds substantial expenses. It is likely Queensland would have to spend significantly more per person to achieve the same capacity as Victoria. Secondly, the calculations assume that the only value of increased public works skills capacity is reduced costs in public works contracts. In practice, many of the skilled employees will also be using their skills to undertake building work that would otherwise need to be outsourced at similar cost. This means the amount of savings from reduced salaries given below is almost certainly an overestimate.
The costs, as of August 2011, of Queensland maintaining its skills capacity can be estimated as $175 million a year from census data on the number and income level of public works related professionals (Carpenters and Joiners, Architects and Landscape Architects, Plumbers and
estimated cost of $67 million for Victoria. If we assume Queensland would require a smaller workforce proportional to its lower population, then Queensland could furnish itself with a similar level of capacity as Victoria by spending around $54 million. This means that the potential savings to be made by reducing Queensland’s greater public works capacity would be around $121 million a year.
Data from the ABS shows that the value of all public sector building in 2011 for Queensland was $2.7 billion.85 (This includes all construction of new buildings and alterations and additions to existing buildings, but excludes other engineering construction activities such as roads, bridges, railways, earthworks, etc.) It is difficult to say whether the same level of additional cost reported for the BER would apply to all public building, but if a 13% saving is typical, then Queensland would have had $350 million of additional costs in 2011 if it had had a skills capacity similar to Victoria.
This analysis suggests that while Queensland spent approximately $120 million more than Victoria on public servants with public works skills in 2011, this increased capacity may have generated savings as high as $350 million that year. It should be stressed these numbers are broad estimates only. However, the estimated savings from greater value for money in public works are nearly three times the estimated costs of maintaining public sector skills. If it were possible to account for the broader benefits, such as the quality of policy and planning advice derived from those skills, it is likely the value would be higher still.
Taking into account different jobs
Another factor complicating comparisons of public and private sectors is the different objectives that may be associated with undertaking the same service. Even where they may seem to be doing the same job, public sector providers of services are often expected to fulfil objectives beyond simply providing the core service. This means they are actually doing a harder job.
One example of this is found in an overseas study that compared a number of British nationalised industries with leading British private industries and similar foreign industries. For the first two decades nationalised industries did better than they had when under private ownership.86 However, a follow-up study ten years later found some of the nationalised industries were performing poorly.87 One of the reasons for this (apart from difficult economic conditions during this time) was the government imposition of ‘national interest’ policies on these enterprises. These made them serve the national interest, through activities such as keeping unprofitable operations open to prevent unemployment, at the cost of being less competitive and raising prices for consumers.
False Economies
37
A similar Australian example can be found in the Vocational Education and Training sector. Here the publicly owned TAFEs and private RTOs (registered training organisations) both provide vocational education. Superficially, TAFEs and RTOs are doing the same work. Below the surface, there are critical differences. In 2012, 7% of TAFE students nationally had a disability or long-term condition, compared with 4% for private providers, and 20% of TAFE students were living in rural and remote areas, as opposed to 14% of students at RTOs.88 TAFEs do more training to remedy skills in short supply; in Victoria, for example, in 2012, 29% of TAFE students were being trained to fill jobs in areas suffering from skill shortage, while less than 20% of students at RTOs were gaining skills that address industry shortages.89
These differences mean greater expenses for TAFEs. The areas where skills are in shortage (such as Mining; Information, Media and Telecommunications; Electricity, Gas, Water and Waste Services; and Construction) are likely to have more expensive training requirements due to the need for large-scale machinery, expensive IT equipment, specialised tools, or costly consumables such as lumber.90 Providing education in regional areas means smaller numbers of students and lower economies of scale. Ensuring adequate disability access and support for a greater number of students represents an additional cost. TAFEs are also more likely than RTOs to provide counselling, careers assistance, childcare and indigenous or multicultural assistance. Despite this clear evidence of the differences in what is being provided, and academic critiques of the underlying economic justification for privatisation in this area,91 expanded roles for the private sector are being recommended without clear justifying evidence of benefits.92
The likelihood that public sector organisations are undertaking additional work compared to their private sector equivalents means comparing the sectors requires a sophisticated approach. A good example is the Productivity Commission’s report on hospitals, summarised below in Box 2.4:
Box 2.4: Strengths in different areas – public & private hospitals
It might seem that Australia’s hospitals would provide an opportunity for a relatively clear-cut assessment of the claims of those who argue for ‘private sector primacy’ due to an assumption that the private sector is always more efficient than the public sector. Here we have both sectors operating similar institutions in the same industry. It should be straightforward to compare the two sectors’ performance. In 2009 the Productivity Commission attempted to do this, producing a detailed and comprehensive report comparing Australia’s public and private hospitals.93 A significant challenge for this report was factoring in the differences between private and public hospitals. Although the two sectors operate in the same industry, there are number of differences between the sectors and the jobs they do:
» Size: There are far more very big (201 beds or more) and very small (0-50 beds) public hospitals, whereas the 51-200 range is roughly evenly split between public and private.
» Location: There are slightly more private hospitals in the major cities, but outside these areas public hospitals dominate. There are no private hospitals in ‘Remote’ or ‘Very Remote’ areas.
» Activities:• Public and private hospitals focus on different kinds of care (private hospitals, for
example, undertake more rehabilitation, while public hospitals engage in more palliative care).
• Public hospitals tend to do more teaching.• Public hospitals do the vast majority of accident and emergency work.
False Economies
38
» Demographics: Children and young people comprise a larger share of the case load of public hospitals; in private hospitals the age group with the highest proportion of patients admitted is 50 to 64 years.
The Productivity Commission’s report attempted to account for these differences in its comparison. As part of this, a multivariate statistical analysis was run to allow a weighted score to be assigned to each hospital based on the in-hospital mortality rate.94 The averages of these scores were then calculated for various sizes of public and private hospitals. Comparing these scores revealed no significant difference for large hospitals, but it seems that small private hospitals do slightly better than small public hospitals. Importantly, much of this difference comes from the small private hospitals run by not-for-profit entities. A calculation of total technical efficiency shows similar results for public and private hospitals. The report acknowledged this measure is merely an indicator given the relevance of other criteria that should be taken into account, such as the number of hospital-acquired infections and re-admissions.
The report also calculated costs for each episode of care for an admitted patient. These costs were weighted based on case-mix to give comparable figures. The results were varied: public hospitals were shown to keep costs down on diagnostics and prosthetics, whereas private hospitals achieved lower costs on pharmaceuticals and general hospital charges.
The overall picture of this comparison of public and private hospitals is that the efficiency of each is very similar, with both having areas of strength compared to the other. The advantage of this situation is that both sectors can learn from each other to improve efficiency. This is a good example of the benefits of public and private sector participation in an industry. The example also demonstrates the error made by those who insist the private sector is always superior in efficiency.
ConclusionAustralia’s public sector, as a whole, is relatively efficient. It compares favourably to public sectors in similar countries. Although some interpretation of the data is possible, differences between countries make it difficult to establish precisely where Australian sits internationally. However, available evidence suggests the Australian public sector has at least above average efficiency, and may be one of the more efficient in the OECD.
This chapter has also shown that the public sector has, at least in some cases, a similar level of efficiency to the private sector. International literature affirms that the differences between the efficiency of the public and private sectors are not large and may be non-existent. Sufficiently sophisticated comparisons of similar public and private sector activities in Australia are rare, but one such investigation by the Productivity Commission has shown a similar level of overall efficiency between the sectors. It is likely that the efficiency of the two sectors relative to each other in a given case will depend on situational factors relating to the work being done and the organisations involved.
This positive assessment should not be taken to imply that no improvements to public sector efficiency are necessary. Any high-performing organisation should be aiming to improve its products or services, taking the advice of an old adage: making the good better and the better best.95 There are a number of areas where opportunities for significant efficiency gains exist. The final chapter outlines two such areas of opportunity.
False Economies
39
3: Good, better, best
Beyond the National Commission of Audit and Federal Budget
Improving our already highly efficient government will require consideration of all aspects of efficiency discussed in Chapter 1. This chapter narrows the focus by considering how efficiency in the Australian Public Service (APS) might be enhanced. It begins by offering brief observations on two sets of recent documents which deal substantially with the efficiency of the APS: the 2014-2015 Budget Papers, and the National Commission of Audit’s Reports and Terms of Reference. Examination of these documents reveals that many of the unhelpful generalisations about efficiency outlined in Chapter 1 are still being made. The chapter then moves beyond these documents to discuss reforms that would genuinely improve the long-term efficiency of the provision of public services. Two types of reform are outlined whereby significant efficiency gains are possible:
» Innovation – improving APS capacity to change, adapt and improve.
» Professional accountability – improving APS capacity to ensure, and demonstrate, that its goals are being achieved.
This chapter finds that APS innovation can be driven by strategies to combat overly risk averse approaches. These strategies include: cross-agency teams dedicated to driving innovation in particular service delivery areas, techniques agency heads can utilise to facilitate bottom-up
False Economies
40
innovations within their organisations, approaches to pilot programs that reduce political risks, and prestigious awards and other schemes to give recognition to innovative public servants. Also likely to encourage innovation is the establishment of an investment fund dedicated to APS innovation, to provide a public sector equivalent to venture capital.
Presented next are a number of initiatives to facilitate a new approach to accountability in the APS, one that is outcome-focussed, utilises front-line expertise and recognises the vital role of organisational trust to ensure that organisational goals are being met. The initiatives canvassed include: building further capacity in the APS for the process of goal specification and alignment with accountability systems, and setting up an integrated national plan or similar process for setting
long-term government objectives. They also cover increased engagement with service users, changing the role of front-line staff in giving input to accountability systems, and greater efforts to build organisational trust by improving aspects of the public service workplace environment. Finally, the applicability of some of the above recommendations to public service and ministerial office interactions is discussed.
These are, of course, not the only possible efficiency reforms. There are reforms in specific areas that may improve efficiency significantly. Defence procurement, and information and communications technology are two examples. The two overarching reforms, for innovation and professional accountability, are chosen as the focus of this chapter because they are vectors through which greater efficiency (among other objectives) can be pursued in any or all areas of government activity.
Federal Budget 2014-2015
Commentators across the political spectrum acknowledge Australia’s government finances have a structural deficit. Disagreement persists on whether this deficit is a ‘spending problem’96 or a ‘revenue problem’,97 and analysis concentrates on the relative extent to which government expenditures are increasing or tax revenues are decreasing. This debate partly misses the point by focussing too heavily on the past. What is needed is a debate about what we should do in the current circumstances. This debate must not be blind to historic and foreseeable trends, but should place the question about the role of government front and centre. Equally important, in this respect, are efficiency of government questions. Once government objectives are determined, consideration needs to be given as to how we can achieve these objectives with minimum resources. Budgets, and their associated papers and statements, should provide significant contributions to these efficiency questions.
A key theme of the 2014-2015 Federal Budget (hereafter ‘Budget’) was ‘smaller and more rational government’, with a large number of items throughout the Budget Papers explicitly related to it.98 Indeed, the Minister for Finance, Senator Mathias Cormann, released a Ministerial Paper on this very topic the night of the Budget to provide an overview of the initiatives under this theme.99 The Foreword to this paper makes it clear that increased efficiency is this initiative’s primary aim, yet it is obvious that only some aspects of efficiency were considered.100 Detail is given on the savings to be achieved and the unnecessary duplication of some existing arrangements, but on the whole there is minimal discussion on the value provided by those bodies abolished, consolidated, merged or transferred. No information is given on the priorities for the selection of particular bodies above others. No selection criteria are implied, apart from a stated desire for ‘leaner business-like ways of operating’ and a commitment to release ‘an Australian Government Governance Policy later in
Once government
objectives are determined,
consideration needs to be
given as to how we can
achieve these objectives with
minimum resources .
False Economies
41
2014’.101 In substance then, the decisions appear to emerge more from a largely unstated or hidden agenda about the role of government rather than an explicit analysis of the efficiency of government.
The Minister for Finance describes four principles, drawn from the National Commission of Audit’s recommendations as ‘significant principles that could be applied to both existing government bodies and proposals to establish new bodies’. These include: ‘whether a current or proposed body performs a public function properly belonging to the Commonwealth’; ‘whether a government body is necessary to provide the function’; ‘whether functions can be grouped more efficiently into a small number of government bodies’; and ‘whether government bodies have the appropriate type of legal structure to achieve their purpose in the most efficient and effective manner’.102 Sunset clauses for government bodies are also contemplated. Whatever the wisdom of these principles, they are not determinative of why certain bodies have been deemed surplus to requirements (such as the Clean Energy Finance Corporation and the COAG Reform Council) instead of others. The formulation of these principles, particularly the first relating to functions, merely raise questions rather than guide the answers.
The bodies impacted are drawn from a range of different portfolios. The two largest savings are in Foreign Affairs and Trade (efficiencies from the consolidation of AusAid within the Department of Foreign Affairs and Trade saving $397.2 million) and in Health (savings of $142 million from abolishing Health Workforce Australia and consolidating its functions into the Department of Health). These two items make up more than 80% of the savings. All of the other items produce relatively small savings (none over $23 million). Some are doubtless necessary. Nevertheless, the assumption appears to be that smaller government and larger multi-function agencies are necessarily more efficient; this does not appear to have been an examination of how best to achieve aims with minimum resources, but simply an attempt to minimise resources.
To the Federal Government’s credit, compared with non-specific measures such as the Efficiency Dividend (see Box 3.1 below) the cuts made as part of the ‘smaller and more rational government’ initiative do have the advantage of clearly specifying what government programs are to be affected. However, in a budget of over $400 billion they are not highly significant. For example, the total ‘smaller and more rational government’ savings achieved by cessations and mergers are $530 million.103 This is less than 20% of the savings produced by the Efficiency Dividend (some $2.8 billion),104 an across-the-board cut that affects services regardless of their utility. The Budget increases the Efficiency Dividend by 0.25% in the 2014-2015, 2015-2016 and 2016-2017 financial years. This is on top of a previous increase by Labor to 2.25%,105 resulting in a total efficiency dividend of 2.5% in those years (see Table 3.1 below). It specifies the savings are to be ‘targeted in areas such as reduced advertising, consultancy and travel costs and deregulation efficiencies’.106 Box 3.1 and 3.2 reveal how high (and uniform) Efficiency Dividends can lead to staff cuts that counteract efficiency.
Box 3.1: The Efficiency Dividend
A number of different strategies have been employed by various governments to promote efficiency within their public services. Unfortunately the data on which strategies have been most successful is relatively poor.107 The main mechanism used to drive efficiency improvements across the APS as a whole is the Efficiency Dividend.
The majority of Commonwealth public sector bodies are subject to an annual Efficiency Dividend that reduces administrative budgets by a certain percentage each year on the
False Economies
42
assumption that ‘efficiencies’ will be found to do the same work with fewer resources. The Efficiency Dividend has been in place for over twenty-five years, originally implemented by the Hawke Government. It is not unique to the Commonwealth, most state governments have applied an Efficiency Dividend in the past, and it is also used in overseas jurisdictions.108
The amount that budgets are reduced by is usually 1.25%, but it has varied (see Table 3.1 below). While the Efficiency Dividend may have provided budgetary savings and spurred administrative imagination, evidence shows that it has had a number of unintended negative outcomes and is not effective in achieving efficiencies while maintaining the delivery of quality public services. A series of reports have given increasingly poor evaluations.109 More recently, the National Commission of Audit criticised the measure as a ‘blunt instrument’ and advised against high Efficiency Dividends, advocating that saving should be made as a result of conscious choices about government’s role.110
As stated, alternative strategies for driving efficiency exist, and given the growing consensus on the flaws of the Efficiency Dividend, these should be trialled. One possible strategy is to implement rolling budget audits. These regular reviews would provide an evidence base for identifying potential inefficiencies and developing mechanisms to address them.111 Such a strategy has the potential to drive significant efficiency gains, but implementation is not straight-forward and it is essential that the structure of the reviews be carefully considered.
The reviews should include internal participants drawn from various areas (e.g. policy, front-line delivery, finance, IT and strategy) and different seniority levels. It should also involve an external body, such as the Australian National Audit Office, to give the advantages of objectivity, independence and a broader perspective.
Another option is formal agreements on efficiency targets and plans to achieve them, made between senior managers, relevant ministers, employees, unions and stakeholders for each agency. These are not the only alternative strategies. Others exist, and combinations of strategies are possible.112
Table 3.1: The efficiency dividend over time
1987-1994 1.25%
1994-2005 1.00%
2005-2008 1.25%
2008-2009 3.25%
2009-2011 1.25%
2011-2012 1.50%
2012-2013 4.00%
2013-2014 1.25%
2014-2015 2.5%
2015-2016 2.5%
2016-2017 2.5%
Source: Updated from N Horne, The Commonwealth efficiency dividend: An overview113
False Economies
43
Box 3.2: APS staff cuts - History repeats?
The Efficiency Dividend has operated alongside periodic and often considerable adjustments to APS staffing levels. The last period of significant cuts to the APS was under the Keating and Howard Governments. Between 1991 and 1999 the APS reduced staff levels by around 50,000, representing nearly a third of the APS workforce.114 The Howard Government, having made significant cuts, found that it had too little investment in public service capacity and the numbers of APS staff increased by 42,000 over the next 7 years.115 The result of the initial deep cuts was a considerable loss of dynamic efficiency as key skills were lost to the service and learning challenges were faced by the incoming staff.
It is interesting to note that in the two years after its first budget the Howard Government reduced the APS by just over 18,000 staff. The 2014-15 budget anticipates that over the next two years the APS will reduce by 16,500 staff. The Abbott Government came to power in September 2013 with an election promise to cut 12,000 public sector jobs.116 The forward estimates left by the previous Government already imposed deep and largely indiscriminate cuts to operating budgets and staffing. Advice received from the Department of Finance in November 2013 showed that funding and program cuts instigated prior to the election by the previous government would lead to an estimated loss of 14,473 public sector jobs.117 Decisions in the 2014-15 Budget mean that around 2,000 additional jobs will likely be lost by 2016-17.118
The impact of these cuts is already being felt. In June 2014 the Australian Bureau of Statistics (ABS) announced reductions to its work program as a result of the directive to reduce expenditure by $50 million over three years. Among the programs discontinued is the highly rated and much cited Measures of Australia’s Progress. Research, development and reporting of social conditions statistics will also be reduced. In announcing the changes, it was stated: ‘While the ABS has been able to implement efficiencies in its operations, these are insufficient to meet the expenditure target. As a result the statistical work program will be reduced from 2014-2015.’ The ABS is not alone, of course.
The effect of the increased Efficiency Dividend and significant staff reductions reveals an overriding imperative to improve the budget position. The danger is that the Federal Government is withdrawing from (or curtailing) a range of services at a time of accelerated structural change in the global economy and a step change in industries at home and abroad. Changes in the APS may be required, including downsizing in some areas. What is needed most of all, however, is a governing logic that moves beyond government being ‘bigger’ or ‘smaller’. The overall impression right now is that ‘the government is navigating an economic highway while dimming the lights’.119
If one averages the cuts and increases to the APS in the years since the start of the Howard Government, one finds a growth rate of 1.41% each year. Incidentally, this is slightly lower than Australia’s population growth over the same time period, which was 1.43%. Population growth, of course, is only an approximate indication of the need for growth in APS staffing levels. Many other factors play a part, such as levels of inequality and public expectations. However, using this rough guide, growth in the APS has nearly kept pace with the size of Australia’s population. Unfortunately, the process of keeping pace has not been linear. The deep cuts and rapid increases in staffing levels damage the efficiency of the APS. Such staffing fluctuations reduce the level of skills and experience in the APS, negate its ability to detect real opportunities for efficiency improvements, and limit its adaptability to changing circumstances.
False Economies
44
Table 3.2 left shows the fluctuations in APS staffing numbers, it also shows the growth and shrinkage each year once changes in coverage have been excluded. Simply looking at APS staff numbers reveals the broad trends, but for a more accurate idea of staffing level changes it must be kept in mind that organisations or parts of organisations are occasionally moved into or out of coverage under the Public Service Act (1999). In other words, some of the changes in staffing numbers are not due to cuts or growth in the APS, but simply the result of changes in what is formally deemed to be part of the APS. In most years these changes are small, but occasionally large numbers of staff are affected by coverage changes. Taking these into account shows how the APS staff capacity changed each year.
The continuing declared interest of politicians in pursuing efficient government was evidenced in the setting up of the National Commission of Audit (hereafter the ‘Commission’) by the Abbott Government. The Commission’s Terms of Reference state five goals. Three are concerned with increasing technical efficiency while the other two relate to reducing the scope of Federal Government activities (arguably based on allocative efficiency considerations).122
Unfortunately, the limited Terms of Reference led to the consideration of only some of the aspects of efficiency discussed in Chapter 1. The entire exercise was cast within the context of seeking to reduce overall government expenditures. Terminologies of technical efficiency predominated, such as ‘value-for-money’, ‘government living within its means’ and ‘achieve savings’. Only one side of the equation was considered, with all the focus on reducing government expenditure, and none on potential investments in developing more efficient or effective methods that could increase public sector and economy-wide efficiency.
The Terms of Reference similarly limited consideration of allocative efficiency. Despite saying ‘government should do for people what they cannot do, or cannot do efficiently, for themselves’ the Commission was only asked to contemplate whether some currently delivered services should not be undertaken. It was not asked to investigate whether there are services that the Federal Government should undertake that it is not currently delivering. Largely missing was the broader national perspective on efficiency that typically underpins decisions on public programs and policies in the first place. For example, the public sector roles in health, education, justice and regulation are often vital to the various forms of private sector (or whole of society) efficiency. Many specific functions of government are performed because inefficient market failures would otherwise be expected. Critically, there was also no explicit consideration of dynamic efficiency; no mention of sustaining efficiency improvements over the long-term; and no reflection on continuing to deliver efficiency in a rapidly changing global environment.
It is unsurprising, therefore, that the Commission’s two reports show a similar narrow focus. More than two-thirds of the Commission’s recommendations concern technical efficiency, or limiting the expenditure and role of the Commonwealth Government.123 Disappointingly, while the Commission felt able to go beyond its Terms of Reference in some areas, such as recommendations on reducing the minimum wage,124 it did not consider issues arguably much more closely related to its mandate, such as reducing tax concessions to balance increasing expenditures. Although the Commission acknowledged that the size of government depends on the role it takes,125 there was no discussion of increasing this role, only recommendations to decrease it through cuts and privatisation. Also disappointing was the lack of any recommendation to invest in efficiency to produce greater savings in the long run. Where the Commission comes close to dynamic efficiency issues, in recommendations on e-government and cloud computing, it proposes no investment in implementing these reforms, only to adopt ‘ambitious strategies’ and ‘mandatory policies’.126
The Commission’s Terms of Reference stated that a thorough review of government functions has not been undertaken in twenty years. It is unfortunate that the Commission was given only five months to undertake a once in two decades ‘thorough’ review. The expedited timing of the Commission no doubt limited the analysis it was able to undertake. Although the reports produced
More than two-thirds
of the Commission’s
recommendations
concern technical
efficiency, or limiting
the expenditure and role
of the Commonwealth
Government
False Economies
46
were lengthy (over 1,300 pages including appendices), the overwhelming majority of references are previous Commonwealth Government reports. There is little reference to academic sources or the reports of similar governments overseas.
Finding genuine efficiency improvements in the Commonwealth public sector is a complex and ongoing task, requiring a full consideration of the public interest rather than any one or two sectional interests. Although there are always areas where significant improvements can be made, correctly identifying them, overcoming barriers to efficiency and designing effective solutions will not be quick and simple. As shown in the previous chapter, our public sector is already very efficient in general – the ‘low hanging fruit’ efficiency improvements have mostly already been ‘picked’ meaning that further quick and straightforward improvements are unlikely to produce significant gains. For example, as part of its advice on rationalising the structure of government, the Commission recommended 163 government bodies be ceased, merged or consolidated.127 As with its other recommendations, the Commission did not provide estimates of the likely savings from this. However, as noted above, the savings from the ‘smaller more rational government’ initiative are $530 million, in a budget of over $350 billion.
The Commission’s analysis of public service efficiency suffers from the narrow focus on particular aspects of efficiency given to it by its Terms of Reference. Its inattention to dynamic efficiency, and focus on cuts as a means of achieving efficiency, prevents it from discussing innovation and ways of investing in achieving efficiency over the long-term. However, within this focus it should be applauded for not relying on uniform across-the-board cuts. The Commission explicitly rejected the strategy of high efficiency dividends. Instead, it stated that governments should make conscious choices about the functions to be delivered by the public sector, and that staffing levels should flow from these explicit decisions.128 Unfortunately, this approach does not appear to have been followed in the subsequent Budget, with the Government further increasing an already high Efficiency Dividend.
InnovationA significant factor in the efficiency of any organisation is its capacity for innovation. In the private sector, unless there is weak competition, a company that fails to innovate will eventually decline or fail, and be replaced by rivals with better new products or new methods. In the public sector the emphasis is on innovation within long-lasting entities, because most of the major fields of public sector activity are natural monopolies. While some elements of the supply chain may change over time, we can always expect to have, for example, one national defence system, one foreign service,
one immigration policy and one social service system. There will usually be one department and portfolio set up to advise and administer policy for each service area. Driving innovation within those agencies becomes essential for ongoing improvements to technical, allocative and dynamic efficiency in the public sector and the wider society that it serves.
Public sector innovation has different drivers and faces different constraints than innovation in private sector organisations. Both constraints and drivers need to be understood in order to maximise innovative capabilities in the APS. This section will describe the particular features of public sector innovation, explore what factors drive innovations and what factors are a barrier to it. A number of initiatives are then proposed to encourage innovation in the APS and in public sector organisations generally.
Public sector
innovation has different
drivers and faces
different constraints than
innovation in private sector
organisations .
False Economies
47
Innovation in public sector organisations
In its broadest sense innovation is simply ‘the application of new ideas to produce better outcomes’,129 so any change to adopt more efficient practices requires some capacity to innovate. Innovation can have a number of outcome goals (for example, improving efficiency, effectiveness, program coverage or equity of outcomes) but here we are focussing on innovation for increased efficiency. Innovations often arise out of collaborations and this means that it can be mistakenly assumed that public sector innovation entirely consist of utilising innovation expertise from the private sector through partnerships or outsourcing services. While collaboration with non-public sector bodies is important, it is also essential to drive innovation within the public sector. As such, this section looks at how to facilitate innovation within the public sector by public sector bodies.
To be able to encourage public sector innovation it is important to take note of the differences between public and private sector approaches. Most research on innovation is in private sector contexts, but there is a growing literature on public sector innovations.130 In particular, work by Sandford Borins using surveys of entrants for public sector innovation awards is useful because this method gathers large samples, rather than the case study approach of most research.131 The research data comes from a number of different awards across multiple jurisdictions, and three key findings are apparent.
Firstly, public sector innovation is most commonly bottom-up in nature, originating with middle management and front-line staff. Top-down innovation from agency heads or politicians is responsible for fewer of the studied innovations. This contrasts with many private companies which have separate research and development processes and personnel to generate innovation. Second, although innovations are frequently bottom-up, support from the top is often critical in their eventual success. Other investigations have found that bottom-up innovations frequently require a political or ministerial trigger, such as changes in policy priorities, for innovation opportunities to be acted on.132 Third, most innovations arise in response to internal identifications of a problem. This is a broad category covering problems such as a failure to reach a target population, changing environment, resources constraints, and lack of policy coordination. Other research has also noted the problem-driven nature of public sector innovation.133 Not all of these problems will spur innovations that increase efficiency, but it is important to note that public sector innovation generally occurs in response to a range of factors, not all of which are present in the private sector.
Having looked at what drives public sector innovation, it will be useful to consider the factors that may act as barriers to innovation. Identifying barriers is necessary in order to consider strategies to encourage innovation that respond to these challenges. A useful summary of research on barriers to innovation is provided by the report Public Sector Innovation: Shaping the Future through Co-Creation.134 Different studies categorise barriers in a variety of structures. However, two themes run through this body of research: an overly risk averse approach taken by public sector organisations and a lack of resources, time and funding, devoted directly to innovation efforts. It is worthwhile exploring both these barriers in detail. In each case, the key point in identifying these barriers and the reasons for their existence is to see in them opportunities for investing in solutions, so that lasting improvements in efficiency can be achieved.
any change to adopt
more efficient practices
requires some capacity
to innovate
False Economies
48
Barriers to innovation – risk aversion
Attempts to innovate involve risk, and so innovation requires the ability to take risks in an effective way. This means that an inappropriately strong aversion to risk ultimately damages efficiency. While the APS has had some successes in innovation, the overriding perception is that public service organisations are not highly innovative because they are overly risk averse. This idea is found in a variety of literature, including academic papers, business research, government reports and media articles.135
It is important to keep in mind that some government agencies, due to the nature of their work, are required to be highly cautious and avoid any significant error at all. This often applies in areas of regulatory approval (e.g. regarding the safety of new medications or of key financial institutions). However, other areas do not have this need for low risk tolerance, and even where it is required it is still possible to be overly-cautious.
If it were the case that the APS was overly risk averse, then it would represent a barrier to the improvements in efficiency, through innovation, that we expect of our public service. It may affect the ability to trial new methods, introduce efficiency measures, share information and collaborate across agencies, collect and publish information, openly consult and explore ideas with external stakeholders, and impact risk management regulation and compliance. Given the breadth of areas that risk aversion potentially impacts, it is important to ask the following questions: Are public sector organisations, and the APS in particular, risk averse to the point that it damages innovation and efficiency? If so, what is driving this risk aversion? Can risk aversion be eliminated or is it inherent to the sector? Ultimately, what can be done to encourage effective and appropriate risk-taking in the public service?
Although little academic research has been done on public service risk aversion in Australia, there are international studies that have attempted to understand how risk aversion manifests in the public service. A study in the USA conducted over 30 years ago showed a correlation between a measure of individual risk aversion and public sector employment; the study interpreted this as indicating that risk averse individuals were more likely to choose public sector jobs.136 A recent Dutch study supports this view by showing that individuals employed in the public sector were less likely to take a risky option than those in the private sector, regardless of how long they had been part of the public sector.137
However, two more recent studies from the USA found that managers’ perceptions of organisational risk aversion were not directly related to the sector that they were in, but to factors that commonly differ between sectors (such as managerial trust and the levels of formal constraint on management actions).138 Bozeman and Kingsley explore the issue of public sector risk aversion in relation to managerial approaches. For them, the categorisation of sector has very little to do with actual risk aversion, but more to do with organisational structure and direction of employees. They posit that there is very little difference in the way things can be done in a public or private organisation. Instead, they argue that the problems of risk aversion in the public sector are caused by: an overemphasis on controlling employees, a high level of formalisation and red-tape, low expectations regarding rewards for good work and a lack of a clear organisational goal. In other words, particular managerial features determine the level of risk aversion. Although these features are more common in the public sector, if they are absent there is no reason for the sector to be more risk averse.
Although the studies differ on why risk aversion is characteristic of the sector (and it is possible that both managerial features and the personnel attracted are making a contribution), all support
False Economies
49
the notion that risk aversion is not inherent to the sector, since strategies to change managerial characteristics or attract different personnel would counter these effects. However, the studies agree that risk aversion tends to be stronger in the public sector.
It may be that the APS is overly risk averse even in comparison to other public services, though supporting evidence is limited. One study compared data from surveys of Canadian and Australian public service manager perceptions, and it touches briefly on risk averse behaviour and innovation.139 The main difference in this area was that although 79% of Canadian respondents thought that the balance between innovation and risk was recognised by senior staff and management, only 58% of Australian respondents thought that the balance was well understood.
Some Federal Government reports have provided evidence of an overly risk averse tendency. A series of reports on the capability of major agencies in the APS include assessments of innovation that specifically address whether an effective approach towards risk management is present. While the Department of Prime Minister and Cabinet140 and the Department of Infrastructure and Transport141 were assessed as performing well on innovation, the Department of Immigration and Citizenship (DIAC),142 the Department of Human Services,143 and the Australian Customs and Border Protection Service144 were all judged to be overly risk averse. Also, in the 2011-2012 State of the Service Report, 45% of around 87,000 respondents to its Employee Survey reported there was an ‘unwillingness of managers to take risks’ in relation to bringing about innovation.145
One recent example of public sector risk aversion is seen in the ongoing struggle faced by the APS to trial ways of implementing new methods of communication into its agencies using web technologies. In 2009, the Engage: Getting on with Government 2.0 report noted ‘the taskforce believes that the existing culture of the APS focuses on online engagement as a risk rather than a benefit’.146 Despite an Australian Public Service Commission (APSC) edict to update its online procedures,147 media reports still highlight the difficulty faced by public servants in effectively using social media to engage with the community, because of a culture of risk aversion.148 Andre Muys’ submission to the Government 2.0 report detailed the ‘constant fear of criticism and rebuke’ that government employees experience while drafting or implementing new policy. He suggested there needs to be room for failure, or the government risks losing employees to operational paralysis.149 This risk aversion is affecting the way new information technologies are being incorporated into the APS. This is also an example of the disconnect between the government’s strategies to innovate using technologies that will have efficiency benefits and the stalling of these innovations due to risk aversion.
Given the evidence that at least some areas of the APS are overly risk averse, it is important to consider the factors that may be driving this, so that the issues can be analysed and responses can be developed to minimise them as problems. A number of factors have been suggested as having a role in risk aversion in public service. They include, in particular:
» Culture: Risk aversion has been described as emerging out of an organisation’s culture.150 If an organisation attempts to introduce new strategies that are at odds with the organisation’s culture, the strategies are unlikely to stick. Or, in words attributed to management guru Peter Drucker, ‘culture eats strategy for breakfast’.151
» Incentives: Another issue is the lack of reward for public service workers to put themselves on the line and attempt to suggest and implement innovative ideas.152 Whereas many
risk aversion is not
inherent to the sector…
However, the studies
agree that risk aversion
tends to be stronger in
the public sector
False Economies
50
private sector organisations expect less than a 100% success rate for new products and processes, and design their strategies accordingly, this is less common in public services. Instead, there are often harmful effects on a public servant’s career if any one innovation fails and becomes the subject of media and opposition attention.153
» Leadership: It is critical that leaders in the APS support and demonstrate innovation.154 If managers in the APS do not take risks to innovate, then their employees are very unlikely to do so.155 The clear backing of senior managers is crucial.156
» Hierarchy: Long hierarchical reporting chains become as risk averse as the most risk averse actor in the chain. This process causes time delays and creates a disconnection for staff whom often lose the motivation to keep putting forward ideas. This is known within the internal circles of the APS as ‘death through frustration’.157
» Inhibited idea communication: Remaining apolitical is an important facet of an effective public service; indeed, it is enshrined in legislation.158 However, it has been suggested that efforts to remain apolitical go too far and inhibit the exchange of ideas amongst public servants.159 The risk that proposing new initiatives will be interpreted by the media as a criticism of current government policy hinders the free flow of ideas essential to innovation.
» Political micro-management: One APS employee described risk aversion as:
We’ll it’s sort of drilled into… every sort of public servants mind from day one… it’s because there is such an overarching responsibility around accountability, transparency, proper use of taxpayer money that… we’re all a Daily Telegraph headline away from disaster… so there’s a disconnect between the rhetoric and the reality, and until such time as people make mistakes and the government is seen to be supporting those people who make mistakes, then the APS will continue to be a bit risk averse.160
If ministers and their offices are actively micro-managing the APS in every sector and every program, they become directly responsible for every outcome. This means the political risk of programs is magnified and sheeted home to the minister. When the successes of government actions are ignored and the failures strongly punished it creates a risk averse environment. Ministers will face the temptation to avoid the risks involved in any innovation, regardless of its overall benefit, because there is unlikely to be any political benefit to them. This can also be seen in examples of ministers’ involvement in regulatory activity, where a tendency has been noted for ministers to intervene in ways inconsistent with regulatory agencies’ risk based approaches, modifying regulations based on particular political circumstances without regard for the risk management approach of the regulator.161 An example of this was the Commonwealth Parliament’s overriding of the Australian Fisheries Management Authority (AFMA) on the issue of the Abel Tasman ‘super trawler’. In this case the scientific risk assessment of the AFMA was that the vessel would be within sustainable limits for the fishery if it complied with a catch quota assigned to it. This was overturned due to a political decision to address the large public outcry about the size of the vessel. Thus, a permissive approach by the regulator on the kinds of vessels to be given licences was changed to a ban on ‘super trawlers’. There is disagreement over whether the scientific evidence was sufficient to support AFMA’s risk assessment,162 but regardless of this, the case represents a clear example of a more risk averse position being imposed on the regulatory body by elected representatives.
It is interesting to note that, with the exception of the two factors generated by the political environment, all of these can also be present in private sector organisations. It may be that in
False Economies
51
overly risk averse public service organisations the same factors existing in the private sector are simply present to a greater degree. However, an alternative possibility is that it is the political environment that is largely responsible for increased risk aversion in the public service.
In all cases, awareness of these problems and appropriate investments in responses usually produce valuable solutions that will enhance innovation towards efficiency. It might be thought that the incentive to invest in much needed changes increases if the public service faces greater austerity. However, innovation, research and change management are often the first things to be cut in times of austerity, because the political imperative remains to emphasise the continuation of front-line services while cutting the ‘back office’. This brings us to another major barrier to the pursuit of public service efficiency through innovation – the lack of resources applied to the task.
Barriers to innovation – lack of resources
The research on public sector innovation indicates that lack of resources can sometimes be a problem that spurs innovation.163 However, lack of resources is far more likely to act as a barrier to innovation. In surveys on public sector innovation award entrants, a lack of resources was the most commonly identified obstacle to innovation.164 In addition, it has been found to be by far the most difficult obstacle to overcome. One study in the USA measured the success rate of the public service in overcoming obstacles and found it to be 58% on average. The success rate for overcoming the specific obstacle of a lack of resources, however, was much lower than the average at 19%.165 This means that for almost every other obstacle the majority of innovations overcame it, but four out of five innovations continued to be negatively affected by a lack of resources. Analysis of the attempts to find funding show that most funding obtained was short-term.
In addition, the uniform and indiscriminate means by which APS resources are frequently reduced, such as through the Efficiency Dividend and other across-the-board cuts or hiring freezes, are poorly aligned with the dynamics of innovation.166 The Efficiency Dividend fails to take into account the reality that opportunities to innovate may vary widely from year to year – it is applied equally in years where major new relevant technologies are available as when they are not. Also, productivity during a successful innovation may initially dip with the introduction of the innovation, as personnel become familiar with a new way of operating. Later, as skills improve, the advantages of the innovation become apparent and productivity goes up to levels higher than before the introduction of this innovation. Because the Efficiency Dividend takes the ‘dividend’ out of agency budgets first, and then leaves the public service to implement innovations to cover the loss, embarking on an innovation means suffering a loss of productivity when resources are already stretched.
For these reasons, resource constraints need to be considered a significant potential barrier to innovation in the APS, and thereby a possible cause of inefficiency due to lack of innovation.
Driving innovation in public sector organisations
A number of potential reforms to increase innovation in the APS, including innovations for increased efficiency, are suggested by the above discussion. With the exception of adequate resourcing, these most often point to the need for significant changes in the way that the APS has been organised and led.
When the successes
of government actions
are ignored and the
failures strongly punished
it creates a risk averse
environment .
False Economies
52
Cross-agency innovation teamsSome studies discussed above indicate that public service organisations may attract individuals who tend to be more risk averse. If this is the case, then encouraging innovation might be achieved by pulling together teams of those public servants who are more risk tolerant. Cross-agency innovation teams made up of volunteers seconded to the initiative would be a good way of drawing together those public servants with an appetite for innovation and risk. They would also pull together knowledge from different areas of the APS, increasing the chances that integrated innovations can be devised and implemented.
A good example of cross-agency teams facilitating innovation, though not necessarily widely recognised as such, is the Suspected Child Abuse and Neglect (SCAN) teams that operate in Queensland. SCAN teams consist of professionals from statutory and non-statutory bodies involved in child protection. They meet regularly and are a formal forum for multi-disciplinary consultation.167 The purpose of the teams is to ensure a coordinated and effective approach is taken by relevant bodies to notifications of abuse or neglect. However, there is evidence that these teams also promote the implementation of new service delivery practices, which is a form of innovation.168 The research suggests that cross-agency teams have this effect because they have a number of features that make moves to new practices more likely, such as providing a new setting that can ‘unfreeze’ old attitudes and behaviours. Given this evidence, it seems likely that cross-agency teams set up to pursue innovations would be a highly effective way of boosting innovation.
This proposed means of facilitating innovation is slightly different from teams like the Gov 2.0 taskforce169 and design.gov.170 Those teams were set up to facilitate innovation elsewhere in the public service; their purpose is to draw out innovative ideas and provide support to those
implementing them. The cross-agency teams envisioned here are made up of public servants involved in an area of service delivery. Rather than being a support mechanism to enable others to innovate, these teams would generate the innovations and be directly involved in implementing them. The SCAN teams example above shows how cross-agency teams tend to be more innovative, even when the teams were not specifically set up for the purpose of driving innovation. These cross-agency teams would have driving innovation in service delivery as their explicit goal.
Top level facilitation of bottom-up innovationsAs research indicates that the majority of public sector innovations are initiated by middle-management and front-line public servants, but require top-level support, this implies that programs where bottom-up innovation is facilitated by top-level actions would be beneficial. An example of this is creating a window for innovation by the temporary adoption of more
permissive standards that govern aspects of public service operations. This allows groups of front-line public servants to experiment with new approaches, which can then be used to inform the creation of new standards. An example of this was implemented in the UK for standards governing diabetes education. As a result, a new approach to the treatment of type 2 diabetes was developed over 2002-2005 by a diabetes care unit in Salford.171 This was a move away from a traditional healthcare model where an entirely passive patient simply accepts the decisions and complies with the instructions of the health care professional, to a patient-centred approach that delivered substantial increases in the clinical benefits of treatment.
Low risk approach to pilot programsThe evidence that an overly risk averse approach may be present in the APS suggests that strategies
The significance of lack
of resources as a barrier
to innovation means
that a fund to provide
investments in innovation
might be advantageous
False Economies
53
to reduce the risks involved in innovations are needed. One way of achieving this is adopting measures reducing the political risks of innovation, such as running multiple pilot programs. Running multiple pilot programs simultaneously reduces the risk that a pilot program will be seen to have ‘failed’ if it is not adopted. If multiple trials are set up with the stated intention of taking on best practice, then trials not adopted have not failed, they are simply part of an evidence-based process of arriving at best practice.
Of course, while pilot programs can be very useful, they can be criticised as a political tool to make it look as though action is being taken, when in fact it is not. Pilot programs need to have robust and carefully administered evaluations. This is to ensure mediocre programs do not progress into long-term policy ‘solutions’ and that successful programmes are appropriately refined, scaled up and achieve full implementation. This may seem like an obvious point, but it is too often ignored in practice.172
Innovation awards and recognitionIn addition to reducing risk, incentive schemes could be devised to reward innovation and counter risk averse organisational culture. The prestige attached to such awards would be a motivator in itself, as well as providing career advantages, such as increased chance of promotion. Innovation awards exist in many public service organisations, including the APS, but more work is required to ensure they are fully effective. There are strong theoretical reasons to think that innovation awards can be highly effective, but empirical evidence on their effects is lacking.173 Nevertheless, widespread use of such awards across multiple jurisdictions indicates confidence in their effectiveness by senior public servants. Further research is necessary to develop a good understanding of the optimal features awards should have to encourage innovation. For example, how winners are publicised, the composition of the judging panel and what the award itself is.174
Innovation investmentsThe significance of lack of resources as a barrier to innovation means that a fund to provide investments in innovation might be advantageous, especially at a time where agency budgets are being reduced. By setting aside funding specifically, the government can encourage departments to feel more secure in submitting ideas for innovation. One such initiative, the Invest to Save Budget (ISB), was a UK idea that implemented some whole-of-government approaches (referred to in the UK as ‘joined-up government’). ISB gave money to initially fund programs that showed promise, and to encourage different agencies to collaborate and take risks on innovations, without undertaking too much of the initial risk themselves.175 What the fund also did is capture and share information on problems that programs face, and in this way it sought to educate other agencies on how not to make similar mistakes. The fund, which can be compared to venture capital because it is a special pool of money that is used to test out projects, reported many successes. One such was the Life Events Access Project (LEAP), which aimed to provide improved access to services at a single point through a structure linking services to eleven life events. For example, the ‘changing employment status’ life event provides access to information on assistance with job seeking, as well as information on the benefits available while unemployed. The estimated savings of the £2.2 million project were £8 million.176
Similar programs also exist in the USA, such as the Federal Department of Education’s Investing in Innovation Fund Competitive Grant Program and New York City’s Center for Economic Opportunity.177 It is worth noting that many private sector organisations have specific research teams and dedicated investments in innovation. The public sector relies more on in-house innovation by workers and their managers. This suggests that the APS should make specific investments in innovation rather than just hope the culture of existing practitioners will produce some.
False Economies
54
Illustrating potential innovation initiatives
While further work is required to define an efficiency-focused innovation agenda for the APS, there are some potential examples that can be drawn from recent studies to illustrate the possibilities:
» Tax-Transfer system single account platform: The Australia’s Future Tax System Review, chaired by Dr Ken Henry, included strategic recommendations for taking the tax and transfer system into the 21st century digital age, with major innovations to improve the interfaces between businesses, households and government.178 It recognised this would take new leadership and cross-agency collaboration, as well as close consultation with businesses and households. This example is a good illustration of the idea that the efficiency considerations must apply as much to the impact of government on the rest of the community (e.g. private sector efficiency) as on measured efficiency of government services alone. Tax and transfer processes since that report have instead remained largely under-resourced and siloed.179
» Public service design and behavioural economics: In the UK and northern Europe, governments have in recent years been building capacity for policy and process design experimentation in providing public services, including teams that have developed service applications of the latest developments in the behavioural sciences.180 These can greatly improve efficiency through better processes and policies that more effectively reach client targets. The very minimal Australian Federal Government efforts in these areas have been victims of general resource cutbacks (e.g. the closure in 2013 of the DesignGov pilot study of business-government interactions barely after it began).181
» Selection of infrastructure projects: The Productivity Commission has recently released a draft report on public infrastructure that is highly critical of the processes for project development, assessment and selection. Failures of process in this area have enormous efficiency costs, and this is a very good example of where investment in public service capability and systems, including in procurement, is far more likely to deliver efficiency gains than cutbacks to resources available for the task.182
» Wiki-based policy collaboration: A number of governments have begun using ‘wikis’ as a tool for community consultation and collaboration. (A wiki is a type of website that allows collaborative generation and editing of its content – the most well-known example is Wikipedia.183) The government of the Canadian province of Alberta used a wiki platform to develop its Social Policy Framework, a document setting out the goals, the measurable results to be achieved, and the roles of all those involved in Alberta’s social policy. The platform also includes a core set of actions the government has committed to.184 Such an approach allows for community consultation that is both broader and deeper than what can generally be achieved through previous consultation methods, such as focus groups. The wiki was accessed by 27,479 people and allowed them to fill in surveys and upload submissions, as well as directly edit wiki entries.185 Consultation of that quality aids efficiency by producing better designed and more informed policies, together with wider community support during implementation.
using ‘wikis’ as a tool for
community consultation and
collaboration… aids efficiency
by producing better designed
and more informed policies
False Economies
55
Professional accountabilityEnsuring accountability for achieving goals is critical for the efficiency of any organisation. The achievement of organisational goals are the results that must be considered, along with the resources used, to obtain a good assessment of technical efficiency (as discussed in Chapter 1). Knowing what organisational goals are being achieved is also critical to allocative efficiency; it is important to know that effort is being allocated to the right place. This is particularly important to public sector organisations like the APS, which have a duty to be responsive to the public interest embodied in such goals. Accountability is not just about ensuring better services; it is also about being responsive, either directly or through the political process, to the goals of citizens.
This section discusses the accountability structures of the APS, including the systems that assess whether goals are being met at all levels, from agencies to individuals. Of course, at an individual level it is often difficult or impossible to make a direct connection between actions taken and whether the broader goals of an organisation are being met. However, as is discussed below, it is important that there be some alignment between the outcomes expected of an employee and their organisation’s goals.
An examination of current APS accountability structures reveals they have become too focused on what can be easily measured or, even worse, on what can easily be claimed to have been achieved. A serious commitment to efficiency in the APS would involve an extensive review of the role and conduct of accountability arrangements. This would need to confront some fundamental questions about the style and substance of government itself, and about the relationships between the political and administrative arms of the public sector.
The current ‘performance management’ approach
The effectiveness of procedures to ensure accountability in the APS have been a concern for many years. The 1976 Royal Commission Report on Australian Government Administration (the Coombs Report) 186 quoted one public servant saying: ‘No matter how good you are you don’t get anywhere. I won’t be fired if I am a bad worker; I won’t be promoted if I am a good worker.’ The report was very critical of the staff assessment systems of the time. Undoubtedly, improvements have since been made. However, a 2013 report on the APS performance framework found that implementation of effective systems was uneven amongst agencies.187 The National Commission of Audit report also noted that the quality of performance reporting varies markedly and acknowledged the need for improved performance information in the APS.188 Suffice to say, there is still a great deal of work to be done. Less than half of all APS employees feel that their current performance management system will help them in improving their work.189 This general negative perception is backed up by investigations of specific elements, such as Key Performance Indicators (KPIs).
KPIs can be a useful means of monitoring and identifying problems with performance in the public sector, utilising qualitative and quantitative information to spur and inform queries as to whether departmental goals have been met. This is beneficial to efficiency, as KPIs can therefore be employed to help discern which managerial methods are working, and which are not. However, the theoretical potential benefits of KPIs are not always achieved in practice. A 2013 Australian National Audit Office report looked at a selection of KPIs across three APS agencies. It found that the majority of KPIs met the criteria of being measurable, but most failed to ‘signal the impacts of program activities’ completely.190 Also, none of the three agencies had KPIs that as a collective demonstrated both the full range and quality of its achievements in furthering program objectives. This provides a good example of the focus on what can be measured, without sufficient attention on the outcomes.
False Economies
56
Given the difficulties with previous ‘performance management’ systems, and how critical accountability is to efficiency, it may be useful to explore a more inclusive accountability approach. This might be termed a ‘professional accountability’ approach; it focusses on outcomes, and takes into account the critical role that values and relationships play in ensuring that organisational goals are met. Many of the features of this approach are exemplified, in a non-public service context, by reforms outlined in the Grattan Institute report, Making time for great teaching.191 Similar to what is described below, this approach focusses on outcomes, in that case improved teaching quality. The approach also incorporates peer assessment and giving staff flexibility and autonomy in pursuing improved performance.
Need for a focus on outcomes
A critical challenge for any organisation attempting to measure whether its goals are being met, is to measure what is important rather than what can be easily measured. The importance of outcome goals for public service organisations is widely acknowledged.192 This focus on organisational outcomes is vital for a number of reasons:
Firstly, if the focus is on easily measurable indicators it can result in the organisation only increasing the activities that are measured, and not better achieving its goals. An example of this is measuring hospital waiting times (defined as the period from the initial consultation to the recommended procedure) in the UK, which reduced waiting times, but only by delaying initial consultations. In other words, people were simply having to wait longer to get onto the waiting lists; the total time people spent waiting for a procedure had not decreased, only the narrowly defined and measured ‘waiting times’ had.193
Secondly, outcome measures are important for external accountability and transparency. If the activities of public service organisations are judged simply on inputs (e.g. how much money is being spent on a problem) or outputs (the activities undertaken) it can give a false impression of their performance. This impression can be falsely positive if, for example, the activities are not actually addressing the problem effectively. Alternatively, it can be falsely negative, such as a case where it is perceived that money is being spent on a problem that is not going away, when in fact the problem is being reduced. Although inputs and outputs are often easier to measure, ultimately it is the outcomes that are the main concern for governments and citizens.194
Thirdly, the process of measuring outcomes can improve planning by giving organisational goals and priorities more clarity. By following an outcomes-based approach, the organisation can better clarify what their objectives are in the short- and long-term, and properly assess how to prioritise the tools and resources needed to achieve those outcomes.195
In order to focus on outcomes, an organisation needs to ensure that the goals, strategies, systems and processes involved in this monitoring, and the overarching organisational culture, are aligned with the priorities of the organisation. This process of alignment requires organisations to have clearly defined and articulated priorities. As was mentioned above, the APS has multiple and complex goals, so this clarity can be difficult to achieve.
Geoff Gallop, the former Premier of Western Australia, has argued Australia needs a national plan and a process for developing national objectives.196 This would be in addition to strategic plans already created by some agencies. A national planning process would provide broad outlines of the policies, government programs and external partnerships needed to achieve these objectives, and would set out monitoring and evaluation mechanisms. This would be similar to plans developed by State and Local Governments, such as South Australia’s State Strategic Plan, although it would obviously involve a greater degree of complexity. A national plan clearly
False Economies
57
outlining the overall goals of government would no doubt make the alignment of agencies’ planning with these goals more effective, leading to a stronger outcome focus.
Other methods and institutions for determining and implementing national priorities are set out in Now for the Long Term, the report of the Oxford Martin Commission for Future Generations.197 The report highlights that a lack of long-term thinking and planning is widespread across governments, institutions and industries. It outlines a number of initiatives that have been used in various countries to drive a more strategic focus. These initiatives include institutions specifically set up to advance the interests of future generations, such as Finland’s Committee for the Future. Other initiatives follow a whole-of-government approach, such as the creation of National Planning Commissions. There is a great deal of international, as well as State and Local Government, experience that can be drawn on to design a process for determining national goals. In addition, useful complementary processes already exist at a Federal level, such as the Intergenerational Report, which requires Treasury to conduct a long-term stocktake of the implications of existing policy.198 Clarity and cross-party consensus on at least some national objectives is a necessary condition for the goals of the public service to be clearly set.
As mentioned above, it is important that employee goals are aligned with organisational goals. One way to achieve this is to ensure that the way individual employees can contribute to organisational goals is measured. This requires clarity in formulating organisational goals and clarity in the design of accountability systems that relate to these goals. APS management has had difficulty achieving high levels of clarity.199 The evaluation of KPIs described above provides a specific example of the lack of clarity affecting accountability systems. Given this, embodiment of organisational goals in accountability systems may require building further capacity in the APS for the process of goal specification and alignment with accountability systems. A leading role in this is consistent with the ‘new APSC’ proposed by the Ahead of the game report.200
Another means of focussing APS activities on outcomes is increased direct contact with the public by engaging citizens in the provision of services. This kind of client directed approach gives citizens more involvement, and therefore likely a bigger say, in the delivery of services. Greater contact with citizens is likely to help public servants to achieve a deeper understanding of their goals. Client directed systems can take a number of forms. Good examples are initiatives termed ‘co-production’. A number of successful co-production initiatives have been carried out in the UK such as the Croydon Service Users Network (SUN).201 This is a support network involving a partnership between people with long-standing behavioural or emotional issues, and psychiatric professionals. It draws together people with similar experiences who can help each other as individual crises occur. Groups are co-run by a professional and a former member of SUN with lived experience of personality disorder. The close partnership of professionals and service users leads to a much more active relationship, and has reduced usage of hospitals by members.
Need for an experimentalist approach to measuring outcomes
A challenge for the design of systems to ensure organisational goals are met is that the measurement of what is important, the outcomes, is often difficult and not always possible to undertake top-down or centrally without the input of those closer to the front-line of operations.
it is important that
employee goals are aligned
with organisational goals…
This requires clarity in
formulating organisational
goals and clarity in the design
of accountability systems .
False Economies
58
Neither of the above two difficulties with outcome measures are a reason to use input or output measures instead. As outlined in the previous section, they have more serious defects. Instead, one approach to improve efficiency (and effectiveness) may include some re-conceptualisation of accountability systems, from an emphasis on top-down ‘performance management’ to more decentralised models, such as greater reliance on client directed systems, subsidiarity principles and effective professional accountability. This means a focus on much more effective outcome measures. However, where centralised measurement is likely to lead to flawed metrics, there needs to be an ‘experimentalist’ approach to accountability that allows for the possibility that metrics may need to be corrected and adapted.
In addition to the difficulties posed by creating effective outcome measures, it is also possible for centrally determined measures to become counter-productive as the world changes or as knowledge grows. A simple example is assessing police performance by the percentage of crimes solved. In the Netherlands this statistic was decreasing, suggesting police performance was getting worse. However, this failed to take into account the changing nature of crime in the country. Crime had become more violent, so the police were dealing with more serious criminal activity, but this was not reflected in the statistic. Also, there were more incidences of arrests for crimes with multiple perpetrators (e.g. vandalism), meaning more criminals were being prosecuted, but this too was not covered by the indicator.202
Thus, it needs to be acknowledged that some outcome-based performance measures will need to change over time. Such changes will require the input of those being assessed if the measures are to be useful. Poor measures can cause significant problems for efficiency, as they can drive organisations to take actions that are unrelated, or even detrimental, to their goals. Investment in good measures is essential, and this investment needs to include the input of those with front-line experience and expertise. Measurement should not obliterate front-line discretion. This applies to both the creation of measures and on-going maintenance and improvement of them as circumstances change. An experimentalist approach also addresses both of the difficulties in creating effective measures, and in maintaining and adapting them over time.
The term ‘experimentalist’ is taken from Charles Sabel’s description of ‘experimentalist institutions’. A commitment to experimentation at an institutional level necessarily requires a level of experimentation and iteration in measuring performance within such institutions.203 Experimentalist institutions allow for discretion, but the discretion is explicitly authorised. In return, the front-line professional must provide detailed information on progress, including against agreed metrics, and the discretion and monitoring is reviewed by peers. The application of these ideas in an Australian context is supported by Terry Moran, former Secretary of the Department of the Prime Minister and Cabinet, who has expressed approval for ‘giving people at the local level a bundle of resources, some outputs to deliver, some standard pricing arrangements, and thus a whole lot of freedom to operate’.204 Commitment to peer review supplies accountability and an organisational learning mechanism, turning discretion from a problem for organisational change into part of its process. Peer review in a co-production environment could also include the input of service users.
Sabel contrasts experimentalist institutions with organisations that are similarly made up of public sector workers who, because of the complexity of their work and its distance from supervision, routinely exercise discretions that cannot be reviewed. However, such discretion is in practice exercised within a set of tacit rules that are embedded in organisational culture. This kind of discretion is, arguably, undesirable for two reasons. Firstly, it may be undemocratic if such culturally embedded rules are unresponsive to both elected representatives and the general
False Economies
59
public’s wishes. Secondly, it may be inflexible; organisational cultures tend to change slowly, so such discretion may not adapt effectively to rapid changes in circumstances.
The experimentalist approach acknowledges the need for investment in outcome measures and for front-line involvement in the development and reassessment of measures to avoid false measures, mismeasurement and the inefficiencies that result. Outcomes should be centrally measured, but there must be processes to allow questioning and revision of the measures. In this manner, outcome indicators are used to generate questions about whether the goal or target has been met, rather than simply answering the question ‘what has been produced or supplied?’ This is also similar to the concept of ‘double loop learning’, as described by Chris Argyris and Donald Schon, in which individuals may question and modify the governing norms, policies and objectives of an organisation upon the correction or detection of an error in organisational decisions and actions.205 This is in contrast to single-loop learning, where the response to unintended and unwanted consequences of an organisation’s actions is to seek new strategies and techniques to fulfil the current norms, policies and objectives, rather than questioning them.
The need for trust
As discussed, improvements in the system to ensure accountability will require managers to strengthen outcomes-based approaches and encourage higher levels of discretion. The potential problem with this approach is the increased uncertainty for public servants. Capacity to operate in uncertain environments will need to be built.
Capacity to operate within uncertain environments is addressed in literature on organisational trust, which is defined as: the ‘willingness to act on the basis of the words, actions and decisions of senior management under conditions of uncertainty or risk’.206 Lack of trust has been a factor in problems with performance management.207 Trusting relationships need not be blind or naïve, ignoring available clear evidence. Instead, relationships should promote authentic trust, which is focused on the relationship, is reflective and honest and is backed by reasons to trust.208
Assessments by managers are necessarily an interpretation, so staff trust in their supervisors and management generally is needed to allow full and frank feedback to be given and accepted. Since not all outcomes can be measured, trust in the values and dedication of public servants is required. Trust in management in turn increases the value that public servants place in being and staying in their organisation. It increases the chance of genuine participation in professional accountability and encourages commitment to areas of work that cannot be fully measured.
There is a great deal of literature on trust in organisations, and efforts to support trust must draw on available evidence. This means that there needs to be continuing efforts to improve the aspects of the public service workplace environment that have been associated with increased trust in management, such as communication, procedural justice and organisational support.209 Such factors can be significantly influenced by human resources policy.
All outcome-focussed approaches need trust. A professional accountability approach acknowledges this and therefore acknowledges the requirement to build and maintain trust. It should be noted that there are benefits to supporting trust that go beyond enhancing accountability systems. Trust has been implicated in reducing cynicism with regards to change.210 This would presumably reduce internal resistance to innovations and make the organisation more efficient. Also, employees who are engaged and committed to an organisation, and their roles within it, act as positive advocates for their organisation, which in turn improves its public image and reduces the cost of recruitment and training.
False Economies
60
Political supervision
Much of the discussion above on ensuring accountability is applicable to the relationship between ministerial offices and the public servants they interact with. This relationship requires an equivalent focus on outcomes, and perhaps a greater imperative to build and support trust. Arguably the most critical relationships in the operation of government are those between ministers’ offices and senior public servants. Worryingly, there are indications of increasing tensions in this relationship.
The Employee Surveys undertaken for previous State of the Service reports have in some years asked public servants who have had direct contact with ministers or their offices the following question: ‘have you faced a challenge in balancing the need to be apolitical, impartial and professional in dealing with Ministers and/or Ministers’ offices?’211 This question has not been asked since 2012, but data from the previous four years is available and raises a concern. Figure 3.2 shows the percentage of the public servants that have contact with ministers’ offices who reported facing such challenges:
Figure 3.2 - Percentage of public servants reporting difficulties when interacting with Ministers and/or Ministers’ offices
Growth (excl. coverage change) Average growth
-10%
-8%
8%
-6%
6%
-4%
4%
-2%
2%
0%
40
35
30
25
20
15
10
5
02007-8 2008-9 2009-10 2010-11
Source: Adapted from APSC, State of the Service Report: State of the Service Series 2010–11, 2011; APSC, State of the Service Report: State of the Service Series 2009–10, 2010; APSC, State of the Service Report: State of the Service Series 2008–09, 2009.
The data is limited, but signs of increasing strain in this critical relationship must be taken seriously. Questions on whether this is a long-term trend, what the causes might be and if it is reducing efficiency should be investigated. It may be that an approach based on outcomes and trust could improve this relationship. Perhaps there is a need to move away from daily management by ministers’ office. Such offices should perhaps focus less on how to run the public service and more on what to ask of it. This is not in any sense an argument that ministers should have less of a role in holding the public service to account. Clearly the public service must be accountable to democratically elected representatives. What is being pointed out is that there is evidence of some dysfunction in this vital relationship, and this implies a need to rethink how it is approached.
False Economies
61
ConclusionEfficiency in public services is critical if we want our tax dollars well spent and our government to achieve all of what we as a country think that it should. Unfortunately, public and political debates on this topic are too often mired in misunderstandings. The evidence on efficiency is misrepresented or ignored; the very meaning of the term is twisted to suit other agendas or evidence-free arguments.
The danger is that we risk falling into ‘false economies’ – actions taken in the name of efficiency that lead to waste and inefficiency, either within government or for the wider community. There are a number of different false economies possible. We can have our government step back from activities where there is collective benefit in government involvement, or step into areas when it should step back. We can make the wrong choices on how public services are delivered and who they should be delivered by. We can fail to match our expectations of what government should do with the realities of the resources these expectations require. And in the course of arguments over the ‘size’ of government, we can stifle or lose opportunities to increase the efficiency of our public services.
No discussion of efficiency should stop simply at considering the current resources we are using. We must consider the results we are getting for those resources, both now and as future investments. We must also consider whether those results are the work we want done, and how this work should adapt to changing technologies and practices. The more complete definition of efficiency offered by this report makes clear that, despite the stereotypes, our public service is already relatively efficient, whether you compare it to the public services of other countries or to the private sector. It also exposes the danger of simplistic arguments about cuts, and a misguided belief in guaranteed benefits from outsourcing or privatisation.
Although our public service is relatively efficient, it is of course not perfect. A final advantage of a full definition and analysis of efficiency is shining a light on how we can design genuine efficiency improvements. This report suggests two directions that have been given inadequate attention.
Firstly, our public service can become more innovative through:
» The creation of cross-agency teams to help drive innovative approaches to services
» Initiatives by agency heads to facilitate bottom-up innovations (such as temporarily implementing more permissive standards to create a window for experimentation with new techniques by front-line workers)
» Taking a low risk approach to pilot programs (such as running multiple simultaneous pilots to reduce the political risk of a pilot being seen as ‘failed’)
» Awards and other schemes to give recognition to innovative public servants
» An innovation investment fund to provide a public sector equivalent to venture capital, combined with mechanisms to capture and share information on implementing innovations
Secondly, much more could be done within the public service to develop a more efficient and effective outcome-focussed and experimentalist approach to accountability. This would help ensure organisational goals are being met, and could involve the following initiatives:
The danger is that
we risk falling into
‘false economies’
– actions taken in the
name of efficiency that
lead to waste
and inefficiency
False Economies
62
» Building further capacity in the APS for the process of goal specification and alignment with accountability systems, perhaps led by the APSC
» The creation of a national plan outlining the polices, government programs and external partnerships needed to achieve government objectives, along with monitoring and evaluation mechanisms
» Increased use of client directed systems, such as those implemented under co-production initiatives
» Shifting to an experimentalist approach to accountability where front-line discretion is explicitly authorised and in return the front-line professional must be peer reviewed and provide detailed information on progress against agreed metrics
» Increased efforts to build organisational trust by improving aspects of the public service workplace environment that have been associated in the literature with increased trust in management, such as communication, procedural justice and organisational support
» Review the ways that the political levels of government relate to and oversee the public service
The objective of this report has been to present these concepts and suggestions in such a way as to enable more Australians to take part in debates on the efficiency of public services. It is important because, as was stated at the beginning, the work of the public service represents our money being spent on us and the things that matter to us. A comprehensive study of efficiency provides all Australians with the tool-kit to have a say, not just at the ballot box, in public debates on how this money can best be spent.
False Economies
63
References1 C Stone, Decoding efficiency, Centre for Policy Development, Sydney, 2013.
2 C Stone, Bang for our bucks, Centre for Policy Development, Sydney, 2013, http://cpd .org .au/wp-content/uploads/2013/11/CPD-OP33-Bang-for-our-bucks1 .pdf.
3 C Stone, Doing less with less, Centre for Policy Development, Sydney, 2013, http://cpd .org .au/wp-content/uploads/2013/05/False-Economies-Part-2-Doing-less-with-less .pdf.
4 P Lion, ‘Julia Gillard, Tony Abbott reveal their election-year visions’, Adelaide Now, 30 December 2012, http://www .adelaidenow .com .au/news/national/our-leaders-election-year-resolutions/story-fndo1sx1-1226545406338.
5 B Shorten, Address to CPSU Members, Casselden Place, Melbourne, 16 August 2013, http://www .alp .org .au/cm12_160813 (when Minister for workplace relations).
6 C Milne, Australian culture protected from cuts, media release, Parliament House, Canberra, 9 May 2012, http://christine-milne .greensmps .org .au/content/media-releases/australian-culture-protected-cuts.
7 M Cormann, Smaller and more rational Government 2014-15: Ministerial paper, Minister for Finance, 2014, p. iii, http://www .financeminister .gov .au/publications/docs/smaller-and-more-rational-government .pdf.
8 K Carr (Minister for Human Services), Digital by design, not default, media release, Parliament House, Canberra, 14 February 2012, http://www .mhs .gov .au/media/media_releases/2013/02/14_feb_2013_-_digital_by_design_not_default .php.
9 Commonwealth Parliamentary Debates, House of Representatives, 21 May 2012, (Scott Buchholz).
10 P Wong (Minister for Finance and Deregulation), Delivering better government services, more efficiently, media release, Parliament House, Canberra, 8 May 2012, http://parlinfo .aph .gov .au/parlInfo/search/display/display .w3p;query=Id%3A%22media%2Fpressrel%2F1260414%22.
11 Commonwealth Parliamentary Debates, House of Representatives, 21 May 2012, (Paul Fletcher).
12 Commonwealth Parliamentary Debates, House of Representatives, 21 May 2012 (Stephen Jones).
13 Commonwealth Parliamentary Debates, House of Representatives, 21 May 2012 (Jamie Briggs).
14 Commonwealth Parliamentary Debates, House of Representatives, 21 May 2012 (Andrew Leigh).
15 Commonwealth Parliamentary Debates, House of Representatives, 24 May 2010 (Peter Lindsay).
16 Commonwealth Parliamentary Debates, House of Representatives, 20 August 2012 (Melissa Parke).
17 Commonwealth Parliamentary Debates, House of Representatives, 19 September 2012 (Adam Bandt).
18 Commonwealth Parliamentary Debates, House of Representatives, 1 March 2012 (Gary Gray).
19 On average Australian household income was $1790 per week in the 2009-2010 financial year. This figure includes social assistance cash benefits such as pensions and parenting payments, but does not include in-kind social benefits such as subsidised education and community health services. On average Australian household total taxes were calculated as $443 per week including tax on income and taxes on production such as GST. Source: Australian Bureau of Statistics, Government Benefits, Taxes and Household Income, Australia 2009-10, cat no. 6537.00, ABS, Canberra, 2012, http://www .abs .gov .au/AUSSTATS/abs@ .nsf/mf/6537 .0/.
20 Australian Bureau of Statistics, Schools, Australia, cat. no. 4221.0, ABS, Canberra, 2012, http://www .abs .gov .au/AUSSTATS/abs@ .nsf/Lookup/4221 .0Main+Features202012?OpenDocument.
21 Australian Institute of Health and Welfare, Australian hospital statistics 2009–10, Health services series no. 40. cat. no. HSE 107, AIHW, Canberra, 2011, p. 11.
22 Australian Government, Budget 2014-2015: Budget Paper 2 – Expense Measures, Canberra, 2014, p. 69 http://www .budget .gov .au/2014-15/content/bp2/html/bp2_expense-07 .htm.
23 J Alford and J O’Flynn, Rethinking public service delivery: Managing with external providers, Palgrave Macmillian, London, 2012, p. 9.
24 Productivity Commission, Access to justice arrangements: Draft report, Canberra, 2014, pp. 613-615, http://www .pc .gov .au/projects/inquiry/access-justice/draft.
25 L Eadie and C Stone, Farming smarter, not harder: Securing our agricultural economy, Centre for Policy Development, Sydney, 2012, p. 36, http://cpd .org .au/2012/10/farming-smarter-not-harder-2/ .
26 Commonwealth Parliamentary Debates, House of Representatives, 14 May 2013 (Wayne Swan), http://parlinfo .aph .gov .au/parlInfo/genpdf/chamber/hansardr/9876e2b9-5961-455f-aa38-455af1c59cb8/0125/hansard_frag .pdf;fileType=application%2Fpdf.
27 M Smart, CRA International consultants report: Value of CityRail externalities and optimal Government subsidy, Independent Pricing and Regulatory Tribunal, 2008, http://www .ipart .nsw .gov .au/Home/Industries/Transport/Reviews_All/City_Rail/Review_of_CityRail_fares_from_2009_and_regulatory_framework/06_Jun_2008_-_Release_of_CRA_International_Consultants_Report/CRA_International_Consultants_Report_-_Value_of_CityRail_externalities_and_optimal_Government_subsidy_-_06_June_2008.
28 R Florida, ‘Why denser cities are smarter and more productive’, The Atlantic Cities, 10 December 2012, http://m .theatlanticcities .com/jobs-and-economy/2012/12/why-denser-cities-are-smarter-and-more-productive/4049/; R Florida, ‘Cities and the creative class’, City & Community, vol. 2 no. 1, 2003, pp. 3-19, http://uv .vuchorsens .dk/r/KAZ/Undervisning%202012-2013/GEOLOGI/B%C3%A6redygtighed/Befolkning%20og%20b%C3%A6redygtighed/GetFile .pdf.
29 D A Hennessy and D L Wiesenthal, ‘The relationship between traffic congestion, driver stress and direct versus indirect coping behaviours’, Ergonomics, vol. 40, no. 3, 1997, pp. 348-361, http://dx .doi .org/10 .1080/001401397188198.
30 See, e.g., J Halligan, ‘The reassertion of the centre in a first generation NPM system’, in T Christensen and P Lægreid (eds), Autonomy and regulation: Coping with agencies in the modern state, 2006, pp. 162-80, 165.
31 Australian National Audit Office, Implementation of Programme and Policy Initiatives: Making implementation matter, Commonwealth of Australia, Canberra, 2006, p. 8, http://www .anao .gov .au/uploads/documents/Implementation_of_Programme_and_Policy_Initiatives .pdf.
32 G Hodge, Contracting out government services: A review of the international evidence, Montech, Clayton, Victoria, 1996; A Simms, Mythbusters: ‘The private sector is more efficient than the public sector’, New Economics Foundation, 2013, http://www .neweconomics .org/blog/entry/mythbusters-the-private-sector-is-more-efficient-than-the-public-sector.
33 C Bonnor and J Caro, What makes a good school?, Newsouth, Sydney, 2012, p. 181.
34 Productivity Commission, Public and private hospitals, Research Report, Productivity Commission, Canberra, 2009, http://www .pc .gov .au/__data/assets/pdf_file/0015/93030/hospitals-report .pdf .
35 A Kohler, ‘How Malcolm Turnbull saved the NBN’, The Drum, 10 April 2013, http://www .abc .net .au/news/2013-04-10/kohler-how-malcolm-turnbull-saved-the-nbn/4619868.
36 T Abbott, Budget 2011 – Our plan will get Australia back on track, media release, Liberal Party of Australia, Canberra, 12 May 2011, http://www .liberal .org .au/latest-news/2011/05/12/our-plan-0.
37 National Commission of Audit, Towards Responsible Government: The Report of the National Commission of Audit – Phase One, 2014, pp. 223-224, http://www .ncoa .gov .au/report/index .html.
38 Royal Commission on Australian Government Administration, Report, Australian Government Publishing Service, Canberra, 1976, paragraph 3.1.4.
39 Steering Committee for the Review of Government Service Provision (SCRGSP), Report on government services 2012, Productivity Commission, Canberra, 2012, paragraph 1.17.
40 Australian Associated Press, ‘51 economists back Labor’s stimulus spend’, The Sydney Morning Herald, 16 August 2010, http://m .smh .com .au/federal-election/economy/51-economists-back-labors-stimulus-spend-20100816-126dj .html.
41 MF, Australia: 2009 Article IV Consultation - Staff Report, IMF Country Report No. 09/248, Washington DC, 2009, http://www .imf .org/external/pubs/cat/longres .aspx?sk=23179 .0.
43 J Stiglitz and K O’Brien, ‘Troubles ahead for world economy’, The 7:30 Report, 27 July 2010, http://www .abc .net .au/7 .30/content/2010/s2965891 .htm.
44 T McDonald and S Morling, The Australian economy and the global downturn - Part 1: Reasons for resilience, Department of the Treasury, Canberra, 2011, http://www .treasury .gov .au/PublicationsAndMedia/Publications/2011/Economic-Roundup-Issue-2.
45 The World Bank, World DataBank: World Development Indicators, The World Bank Group, 2013, http://databank .worldbank .org/data/views/reports/tableview .aspx?isshared=true&ispopular=country&pid=20. The figure of $7 billion is the (rounded) result of subtracting 1% of Australia’s 2010 GDP from 2% of Australia’s 2011 GDP (in current AU$), data was extracted on 19 May 2013.
47 K Henry, ‘The Australian banking system: Challenges in the post Global Financial Crisis environment’, presented to the Australasian Finance and Banking Conference, Sydney, 15-17 December 2010, http://www .treasury .gov .au/PublicationsAndMedia/Publications/2011/Economic-Roundup-Issue-1/Report/The-Australian-banking-system-challenges-in-the-post-global-financial-crisis-environment.
48 T McDonald and S Morling, ‘The Australian economy and the global downturn - Part 1: Reasons for resilience’, Economic Roundup, Issue 2, Department of the Treasury, 2011, http://www .treasury .gov .au/PublicationsAndMedia/Publications/2011/Economic-Roundup-Issue-2/Report/Part-1-Reasons-for-resilience.
49 S Keen, ‘Giving the Bird to the Stimulus?’, Steve Keen’s Debtwatch, 18 August 2010, http://www .debtdeflation .com/blogs/2010/08/18/giving-the-bird-to-the-stimulus/.
51 World Economic Forum, The Global Competitiveness Report 2013 – 2014, Geneva, 2014, http://www .weforum .org/reports/global-competitiveness-report-2013-2014 .
52 World Bank, Worldwide Governance Indicators, 2013, http://info .worldbank .org/governance/wgi/index .aspx#reports .
53 S Van de Walle, ‘The state of the world’s bureaucracies’, Journal of Comparative Policy Analysis: Research and Practice, vol. 8, no. 4, 2006, pp. 437–448.
54 World Bank, Worldwide Governance Indicators, 2013, http://info .worldbank .org/governance/wgi/index .aspx#reports .
55 A Afonso, L Schuknecht and V Tanzi, Public sector efficiency: An international comparison, (Working paper no. 242, European Central Bank), 2003, http://www .ecb .europa .eu/pub/pdf/scpwps/ecbwp242 .pdf.
56 P Whiteford, Transfer Issues and Directions for Reform: Australian Transfer Policy in Comparative Perspective, , Australia’s Future Tax and Transfer Policy Conference, Melbourne Institute, 2010 http://taxreview .treasury .gov .au/content/html/conference/downloads/conference_report/03_afts_tax_and_transfer_policy_conference_chap_3 .pdf.
57 J Whelan, Big Society and Australia: How the UK Government is dismantling the state and what it means for Australia, Centre for Policy Development, Sydney, 2012, http://cpd .org .au/2012/05/big-society-how-the-uk-government-is-dismantling-the-state-and-what-it-means-for-australia/.
58 AS Blunn and S Krieger, Report of the review of Commonwealth legal services procurement, Canberra, 2009, p. 63, http://www .ag .gov .au/LegalSystem/LegalServicesCoordination/Documents/Blunn Krieger Report .pdf.
59 ibid, pp. 66-67.
60 ibid, p. 7.
61 ibid.
62 ibid.
63 ibid.
64 Department of Employment, Workplace Relations and Small Business, Job Network evaluation stage one: Implementation and market development, DEWRSB, Canberra, 2000, p. 13.
65 Australian Bureau of Statistics, Labour force – Australia, cat. no. 6202.0, ABS, Canberra, February 2013, p. 4 http://www .ausstats .abs .gov .au/ausstats/meisubs .nsf/0/70B7EC25FEF4162ECA257B2D000D426B/$File/62020_feb%202013 .pdf.
66 Trading Economics, Australia’s unemployment rate, 2013, http://www .tradingeconomics .com/australia/unemployment-rate. The modifiable website table relies on figures supplied by the Australian Bureau of Statistics.
67 M Thomas, A review of developments in the Job Network, Parliament of Australia, Canberra, 2007, http://www .aph .gov .au/About_Parliament/Parliamentary_Departments/Parliamentary_Library/pubs/rp/RP0708/08rp15.
68 L Fowkes, Rethinking Australia’s employment services, Whitlam Institute, Sydney, March 2011, p. 4.
69 T Stromback, ‘The Job Network and underemployment’, Economic papers: A journal of applied economics and policy, vol. 27, no. 3, September 2008, p. 287.
70 V Sheen, ‘Reading between the lines of Australia’s employment services ‘success’ story’, The Conversation, 29 January 2013.
71 Department of Education, Employment and Workplace Relations, Labour market assistance, long term outcomes: A longitudinal study of outcomes from customised assistance, Work for the Dole, job placement and job search training, DEEWR, Canberra, 2008.
72 See for example OECD, above n 1, and P Davidson and P Whiteford, ‘An overview of Australia’s system of income and employment assistance for the unemployed’, OECD Social, Employment and Migration Working Papers, No. 129, OECD Publishing, 2012, p. 122.
73 See for example Department of Education, Employment and Workplace Relations, Employment services – Building on success, DEEWR, Canberra, 2012, p. 8.
74 Department of Education, Employment and Workplace Relations, Customised assistance, job search training, work for the dole and mutual obligation, a net impact study, DEEWR, Canberra, 2006, p. 8.
75 L Fowkes, ‘Long Term Unemployment in Australia’, Australian Policy Online, 26 October 2011, http://apo .org .au/guide/long-term-unemployment-australia.
76 G Hodge, Contracting out government services: A review of the international evidence, Montech, Clayton, Victoria, 1996.
77 J Quiggin, Electricity privatisation in Australia: A record of failure, Victorian Electrical Trades Union, 2014, http://www .etu .org .au/system/files/ETU%20Electricity%20Privatisation%20Report .pdf.
78 T Roxburgh, Public works need public sector skills: The lost lessons of the BER program, Centre for Policy Development, Sydney, 2012, p. 8 http://cpd .org .au/2012/09/public-works-public-skills/.
79 ibid
80 Building the Education Revolution Implementation Taskforce, Final report, 2011.
81 Following the methodology of Roxburgh, capacity is being approximately measured by looking at census data on the number of Carpenters and Joiners, Architects and Landscape Architects, Plumbers, and Construction Managers. Unlike Roxburgh the numbers of these professions employed by local and state government are used, since this case looks at all public works, which includes those undertaken by local governments.
82 T Roxburgh, Public works need public sector skills: The lost lessons of the BER program, Centre for Policy Development, September 2012, http://cpd .org .au/2012/09/public-works-public-skills/.
83 Building the Education Revolution Implementation Taskforce, Final report, p 10.
84 Australian Bureau of Statistics, Census: Education and qualifications, 2012, http://www .abs .gov .au/census. Data was retrieved on 19 May 2013 using TableBuilder to show the number of Carpenters and Joiners, Architects and Landscape Architects, Plumbers, and Construction Managers at each of the five ranges of income employed by local and state government in Queensland. The numbers in each income range were multiplied by the mid-point dollar value of the range, with the exception of highest range ‘104,000 or more’, numbers in that range were multiplied by $129,000. The results were summed and increased by 20% to estimate overhead costs.
85 Australian Bureau of Statistics, Building activity, Australia, Dec 2012, cat no 8752.0, ABS, Canberra, 2011 http://www .abs .gov .au/AUSSTATS/abs@ .nsf/DetailsPage/8752 .0Dec%202012?OpenDocument.
86 R Pryke, Public Enterprise in Practice: the British experience of nationalisation over two decades, MacGibbon and Kee, London, 1971
87 R Pryke, The nationalised industries: Policies and performance since 1968, Martin Robinson, Oxford, 1981.
88 C Stone, Valuing skills: Why vocational training matters, Centre for Policy Development, Sydney, 2012, pp. 9-12, http://cpd .org .au/2012/11/valuing-skills/.
89 ibid, p. 8.
90 ibid, p. 14.
91 See e.g., P Toner, ‘Contracting out publicly funded vocational education: A transaction cost critique.’ The Economic and Labour Relations Review vol.25, no. 2, 2014, pp222-239.
92 National Commission of Audit, Towards Responsible Government: The Report of the National Commission of Audit – Phase One, 2014, pp. 236-241, http://www .ncoa .gov .au/report/index .html.
93 Productivity Commission, Public and Private Hospitals, Productivity Commission Research Report, Canberra, 2009, http://www .pc .gov .au/projects/study/hospitals/report.
94 Productivity Commission, Public and Private Hospitals: Multivariate Analysis, Supplement to Productivity Commission Research Report, Canberra, 2010, http://www .pc .gov .au/projects/study/hospitals/supplement.
95 The adage is expressed as a rhyme: “Good, better, best / Never let it rest / Till your good is better / And your better – best”. Its origin is uncertain, but it has been in use since at least the 1880s. See, http://www .latrobe .edu .au/shepparton/events/public-lectures/john-furphy.
96 See, e.g., J Sloan, ‘Budget crisis is a problem of spending, not revenue’, The Australian, 10 May 2014, http://www .theaustralian .com .au/opinion/columnists/budget-crisis-is-a-problem-of-spending-not-revenue/story-fnbkvnk7-1226912175911#.
97 See, e.g., P Martin, ‘It’s the debt, not the spending: why the budget is bleeding’, The Sydney Morning Herald, 2 May 2014, http://www .smh .com .au/federal-politics/its-the-debt-not-the-spending-why-the-budget-is-bleeding-20140503-zr3mo .html
99 M Cormann, Smaller and more rational Government 2014-15: Ministerial paper, Minister for Finance, 2014, http://www .financeminister .gov .au/publications/docs/smaller-and-more-rational-government .pdf.
100 ibid, p. iii.
101 ibid, p. 12
102 ibid, p. 12.
103 ibid, p. 8.
104 Australian Government, Budget 2014-2015: Budget Paper 2 – Expense Measures, Canberra, 2014, http://www .budget .gov .au/2014-15/content/bp2/html/bp2_expense-07 .htm, p. 69.
105 C Bowen and P Wong, Economic Statement: August 2013, Canberra, 2013, http://www .budget .gov .au/2013-14/content/economic_statement/download/2013_EconomicStatement .pdf.
106 Australian Government, Budget 2014-2015: Budget Paper 2 – Expense Measures, Canberra, 2014, http://www .budget .gov .au/2014-15/content/bp2/html/bp2_expense-07 .htm, p. 69.
107 Jennifer Doggett, Beyond the blunt instrument: The Efficiency Dividend and its alternatives, Centre for Policy Development, Sydney, 2010, http://cpd .org .au/wp-content/uploads/2010/12/CPD_OP11_Doggett_Beyond_Blunt_Instrument_FINAL_web2 .pdf
108 N Horne, The Commonwealth efficiency dividend: An overview, Parliamentary Library, 2012, p. 1, http://www .aph .gov .au/About_Parliament/Parliamentary_Departments/Parliamentary_Library/pubs/BN/2012-2013/EfficiencyDividend#_ftnref3.
109 See, e.g., Advisory Group on Reform of Australian Government Administration, Ahead of the Game: Blueprint for the Reform of Australian Government Administration, Department of the Prime and Cabinet, Canberra, 2010, pp.45, http://www .dpmc .gov .au/publications/aga_reform/aga_reform_blueprint/docs/APS_reform_blueprint .pdf; A Philipatos, Withholding Dividends: Better ways to make the public sector efficient, Centre for Independent Studies, 2014, https://www .cis .org .au/publications/target30-papers/article/5191-withholding-dividends-better-ways-to-make-the-public-sector-efficient.
110 National Commission of Audit, Towards Responsible Government: The Report of the National Commission of Audit – Phase Two, 2014, p. xiv, http://www .ncoa .gov .au/report/index .html.
111 Jennifer Doggett, Beyond the blunt instrument: The Efficiency Dividend and its alternatives, Centre for Policy Development, Sydney, 2010, p. 29, http://cpd .org .au/wp-content/uploads/2010/12/CPD_OP11_Doggett_Beyond_Blunt_Instrument_FINAL_web2 .pdf.
112 ibid.
113 N Horne, The Commonwealth efficiency dividend: An overview, Parliamentary Library, 2012, p. 7, http://www .aph .gov .au/About_Parliament/Parliamentary_Departments/Parliamentary_Library/pubs/BN/2012-2013/EfficiencyDividend#_ftnref3.
114 J Whelan, The state of the Australian Public Service: An alternative report, Centre for Policy Development, Sydney, 2011, p. 22, http://cpd .org .au/2011/08/the-state-of-the-australian-public-service/.
115 ibid.
116 T Abbott, Tony Abbott Budget Reply, Parliament House, Canberra, 16 May 2013, http://www .liberal .org .au/latest-news/2013/05/16/tony-abbott-budget-reply-parliament-house-canberra.
117 P Coorey, ‘Abbott government’s rethink on jobs to blow budget’, Financial Review, 19 November 2013, http://www .afr .com/p/national/abbott_government_rethink_on_jobs_es3iS8aV8Ek8GaUmz2nV7O.
118 Australian Government, Budget 2014-2015: Budget Paper 2 – Expense Measures, Canberra, 2014, http://www .budget .gov .au/2014-15/content/bp2/html/bp2_expense-07 .htm, p. 69.
119 See Peter Martin, ‘Budget cuts: how ASIC, the ABS and the ATO are turning off the lights’, The Age, 8 June 2014, http://www .theage .com .au/comment/budget-cuts-how-asic-the-abs-and-the-ato-are-turning-off-the-lights-20140609-zs16p .html.
120 Australian Public Service Commission, Australian Public Service Statistical Bulletin 2012-13, Canberra, 2013 http://www .apsc .gov .au/publications-and-media/print-only#stats; Australian Public Service Commission, Australian Public Service Statistical Bulletin 2010-11, Canberra, 2011 http://www .apsc .gov .au/publications-and-media/print-only#stats; Australian Public Service Commission, Australian Public Service Statistical Bulletin 2007-08, Canberra, 2008 http://www .apsc .gov .au/publications-and-media/print-only#stats.
121 Australian Public Service Commission, Australian Public Service Statistical Bulletin 2012-13, Canberra, 2013 http://www .apsc .gov .au/publications-and-media/print-only#stats; Australian Public Service Commission, Australian Public Service Statistical Bulletin 2010-11, Canberra, 2011 http://www .apsc .gov .au/publications-and-media/print-only#stats; Australian Public Service Commission, Australian Public Service Statistical Bulletin 2007-08, Canberra, 2008 http://www .apsc .gov .au/publications-and-media/print-only#stats.
122 National Commission of Audit: Terms of Reference, Canberra, 2013, http://www .financeminister .gov .au/docs/NCA_TERMS_OF_REFERENCE .pdf.
123 Fifty-eight of the eighty-six recommendations either explicitly mention efficiency or contain advice to limit expenditure, abolish organisations, or reduce the role of the Commonwealth Government. National Commission of Audit, Towards Responsible Government: The Report of the National Commission of Audit – Phase One, 2014, pp. xxxiv-lxviii, http://www .ncoa .gov .au/report/index .html; National Commission of Audit, Towards Responsible Government: The Report of the National Commission of Audit – Phase Two, 2014, pp. xviii-xxix, http://www .ncoa .gov .au/report/index .html.
124 National Commission of Audit, Towards Responsible Government: The Report of the National Commission of Audit – Phase One, 2014, pp. 146-149, http://www .ncoa .gov .au/report/index .html.
125 National Commission of Audit, Towards Responsible Government: The Report of the National Commission of Audit – Phase Two, 2014, p. xiv, http://www .ncoa .gov .au/report/index .html.
126 National Commission of Audit, Towards Responsible Government: The Report of the National Commission of Audit – Phase One, 2014, pp. 236-241, http://www .ncoa .gov .au/report/index .html; cf M Stewart-Weeks, and L Tanner, Changing Shape: Institutions for a Digital Age, Longueville Media, Sydney, 2014.
127 National Commission of Audit, Towards Responsible Government: The Report of the National Commission of Audit – Phase Two, 2014, p. 87, http://www .ncoa .gov .au/report/index .html.
128 ibid, pp. 111-112.
129 Australian National Audit Office, Innovation in the Public Sector: Enabling Better Performance, Driving New Directions, Better Practice Guide, Canberra, 2009, http://www .anao .gov .au/uploads/documents/Innovation_in%20the_Public_Sector .pdf.
130 Australian National Audit Office, Innovation in the public sector: Enabling better performance, driving new directions’, Better Practice Guide, 2009, p. 61. http://www .anao .gov .au/uploads/documents/Innovation_in%20the_Public_Sector .pdf.
131 S Borins, The Challenge of Innovating in Government, 2nd ed, IBM Center for the Business of Government, Toronto, 2006, http://www .businessofgovernment .org/sites/default/files/BorinsInnovatingInGov .pdf.
132 National Audit Office (UK), Achieving innovation in central government organisations, 2006, p. 24, http://www .governmentontheweb .org/sites/governmentontheweb .org/files/Achieving_Innovation_Full-Report .pdf.
133 R Green, G Roos, R Agarwal and D Scott-Kemmis, Public Sector Innovation: Shaping the Future through Co-Creation, Institute of Public Administration Australia, 2014, p. 18, http://www .ipaa .org .au/documents/2014/05/innovation-report .pdf.
134 ibid, pp. 21-25, 84-87.
135 See, e.g., S Borins, ‘Encouraging innovation in the public sector’, Journal of Intellectual Capital, Vol. 2 no. 3, 2001, pp. 310 – 319; BW Head, ‘Evidence-based policy-making for innovation’, in SP Osborne and L Brown (eds), Handbook of Innovation in Public Services, Edward Elgar, 2013, pp. 143-156, 153; Management Advisory Committee 9, Empowering Change: Fostering Innovation
in the Australian Public Service, Australian Public Service Commission, Canberra, 2010, p. vii, http://www .innovation .gov .au/innovation/publicsectorinnovation/Pages/Library%20Card/Empowering_Change .aspx; R Green, G Roos, R Agarwal and D Scott-Kemmis, Public Sector Innovation: Shaping the Future through Co-Creation, Institute of Public Administration Australia, 2014, pp. 19, 22, http://www .ipaa .org .au/documents/2014/05/innovation-report .pdf.
136 D Bellante, and AN Link, ‘Are public sector workers more risk averse than private sector workers?’, Industrial and Labor relations review, vol.34, no. 3, 1981, pp.408-412.
137 M Buurman, and R Dur, Public Sector Employees : Risk Averse and Altruistic?, Institute for the Study of Labor, Bonn, 2009, pp.1-23, http://ftp .iza .org/dp4401 .pdf.
138 R Bozeman, and B Kingsley, ‘Risk culture in public and private organizations’, Public Administration, vol. 58 no. 2, 1998, 108–118; C Chen and B Bozeman, ‘Organizational Risk Aversion: Comparing The Public and Non-Profit Sectors’ Public Management Review, vol. 14 no. 3, 2012, pp. 377–402.
139 C Althaus, B Evans & E Rathbone, ‘Trends in Australian and Canadian public service perceptions from and employee survey Perspective’, Australian Journal of Public Administration, vol. 71, no. 4, 2012, pp.423-439.
140 Australian Public Service Commission, Capability Review: Department of the Prime Minister and Cabinet, Canberra, 2012. http://www .apsc .gov .au/__data/assets/pdf_file/0020/10577/1217-PM-and-C_Capability_Review .pdf.
141 Australian Public Service Commission, Capability Review: Department of Infrastructure and Transport, Canberra, 2012, http://www .apsc .gov .au/__data/assets/pdf_file/0003/10578/1217-Doit_Capability_Review .pdf.
142 Australian Public Service Commission, Capability Review: Department of Immigration and Citizenship, Canberra, 2012, http://www .apsc .gov .au/__data/assets/pdf_file/0004/10579/1217-DIAC_capability_review .pdf.
143 Australian Public Service Commission, Capability Review: Department of Human Services, Canberra, 2012, http://www .apsc .gov .au/__data/assets/pdf_file/0019/10576/1217-DHS_capability_review .pdf.
144 Australian Public Service Commission, Capability Review: Australian Customs and Border Protection Service, Canberra, 2013, http://www .apsc .gov .au/__data/assets/pdf_file/0008/20006/Capability-review-CUSTOMS .pdf.
145 Australian Public Service Commission, State of the Service Report: State of the Service Series 2011-2012, Canberra, 2012, p. 4, http://www .apsc .gov .au/about-the-apsc/parliamentary/state-of-the-service/new-sosr.
146 Government 2.0 Taskforce, Report of the Government 2.0 Taskforce, Engage: Getting on with Government 2.0, 2009, p. 36, http://www .finance .gov .au/publications/gov20taskforcereport/.
147 ibid, p. 36.
148 S Davies, ‘The paranoia that will “shut” government’, The Sydney Morning Herald, 6 March 2012, http://www .smh .com .au/federal-politics/the-paranoia-that-will-shut-government-20120306-1uh86 .html.
149 Government 2.0 Taskforce, Report of the Government 2.0 Taskforce, Engage: Getting on with Government 2.0, 2009, pp. 36, http://www .finance .gov .au/publications/gov20taskforcereport/2009.
150 Attorney General’s Department, ‘Connecting Government: Whole of Government Responses to Australia’s Priority Challenges’, Management Advisory Committee 4, Canberra, 2004.
151 C Coffman and K Sorensen, Culture eats strategy for lunch, Liang Addison Press, Denver, 2013.
152 WD Eggers & SK Singh, The Public Innovators Playbook: Nurturing bold ideas in government, The Deloitte Member Firm Public Leadership Institute, 2009, https://www2 .deloitte .com/content/dam/Deloitte/global/Documents/Public-Sector/dttl-ps-public-innovators-playbook-08082013 .pdf.
153 S Borins, ‘Encouraging innovation in the public sector’, Journal of Intellectual Capital, vol.2, no. 3, 2001, pp.310-319.
154 Advisory Group on Reform of Australian Government Administration, Ahead of the Game: Blueprint for the Reform of Australian Government Administration, Department of the Prime Minister and Cabinet, Canberra, 2010, pp.45, http://www .dpmc .gov .au/publications/aga_reform/aga_reform_blueprint/docs/APS_reform_blueprint .pdf.
155 B Bozeman & G Kingsley, ‘Risk culture in public and private organizations’, Public Administration Review, vol. 58, no. 2, 1998, pp. 110.
156 Australian Public Service Commission, ‘Capability Review’, Department of Immigration and Citizenship, Australian Public Service Commission, Canberra, 2012, http://www .apsc .gov .au/__data/assets/pdf_file/0004/10579/1217-DIAC_capability_review .pdf.
157 Management Advisory Committee 9, Empowering Change: Fostering Innovation in the Australian Public Service, Australian Public Service Commission, Canberra, 2010, pp. 36, http://www .innovation .gov .au/innovation/publicsectorinnovation/Pages/Library%20Card/Empowering_Change .aspx.
158 Section 10 of the Public Service Act, 1999 (Cth).
159 R Langereis, ‘A silent service? (Public servants should get more involved in the dialogue about the public sector)’ Public Administration Today, vol. 25, 2011, p.54-57.
160 Ibid, pp. 18-19.
161 Productivity Commission , Regulator Engagement with Small Business: Australian Productivity Commission Research Report, Canberra, 2013, pp. 61 http://www .pc .gov .au/__data/assets/pdf_file/0007/128338/small-business .pdf
162 See, e.g.: J Meeuwig, ‘One fish, two fish, red fish, blue fish, science doesn’t support the super trawler’, The Conversation, 30 August 2012, http://theconversation .com/one-fish-two-fish-red-fish-blue-fish-science-doesnt-support-the-super-trawler-9143; and C Buxton, C Gardner, J Lyle and R Hilborn, ‘ Super Trawler gone, but is fisheries policy in trouble?’, The Conversation, 13 March 2013, http://theconversation .com/super-trawler-gone-but-is-fisheries-policy-in-trouble-12755.
163 Sandford F. Borins, Innovating With Integrity: How Local Heroes Are Transforming American Government, Georgetown University Press, 1998.
164 S Borins, The Challenge of Innovating in Government, PricewaterhouseCoopers, Toronto, 2001, http://www .strategie-cdi .ro/spice/admin/UserFiles/File/CA%20The%20Challenge%20of%20innovating%20in%20government .pdf.
165 Sandford F. Borins, Innovating With Integrity: How Local Heroes Are Transforming American Government, Georgetown University Press, 1998, p 67.
166 K MacDermott and C Stone, Death by a thousand cuts, Centre for Policy Development, 2013, https://cpd .org .au/wp-content/uploads/2013/08/CPD_OP30_Death-by-1000-cuts .pdf.
167 P Cameron, R Roylance and J Reilly, ‘Interagency Approach to Child Abuse’, Paper presented at the Children and Crime: Victims and Offenders Conference, Brisbane, 17-18 June 1999 http://www .aic .gov .au/media_library/conferences/children/cameron .pdf
168 Allen, Nicole E., Pennie G. Foster-Fishman, and Deborah A. Salem. 2002. “Interagency Teams: A Vehicle for Service Delivery Reform.” Journal of Community Psychology, vol. 30 no. 5, pp. 475–497.
169 N Gruen, ‘The last post: now for the main event- you!’, Government 2.0 Taskforce, May 5 2010, http://gov2 .net .au.
170 See: http://design .gov .au/
171 P Windrum, ‘Patient-centred diabetes education in the UK’ in P Windrum and P M Koch (eds), Innovation in Public Sector Services: Entrepreneurship, Creativity and Management, Edward Elgar Publishing, 2008, pp. 162-185; P Windrum, M García-Goñi, and E Fairhurst ‘Innovation in public health care: diabetes education in the UK’ in F Gallouj and F. Djellal (eds), The Handbook of Innovation and Services: A Multi-disciplinary Perspective, Edward Elgar Publishing, 2011, pp. 129-152.
172 JB Liebman, Building on Recent Advances in Evidence-Based Policymaking, The Brookings Institution, 2013, p8, http://www .brookings .edu/research/papers/2013/04/17-liebman-evidence-based-policy.
173 Rosenblatt, M, ‘The use of innovation awards in the public sector: Individual and organizational perspectives’ Innovation: Management Policy and Practice, Vol. 13, No. 2, 2011, pp. 207-219.
174 S Borins, ‘Public service awards programs: an exploratory analysis’, Canadian Public Administration, vol. 43, no. 3, pp. 321–342.
175 United Kingdom National Audit Office, The Invest to save budget, London, 2002, http://www .nao .org .uk/wp-content/uploads/2002/11/020350 .pdf.
176 ibid, p. 55.
177 JB Liebman, Building on Recent Advances in Evidence-Based Policymaking, The Brookings Institution, 2013, p8, http://www .brookings .edu/research/papers/2013/04/17-liebman-evidence-based-policy, pp 6-7.
179 cf: a recent report to government on welfare payments recommended a simpler system with fewer payments (L Kerin, ‘Patrick McClure says welfare system too complex and unsustainable’, The World Today, 12 June 2014, http://www .abc .net .au/worldtoday/content/2014/s4023852 .htm.
180 See, https://www .gov .uk/government/organisations/behavioural-insights-team
181 See, http://design .govspace .gov .au
182 Productivity Commission, Public infrastructure: Draft report, Canberra, 2014, p. 230, http://www .pc .gov .au/projects/inquiry/infrastructure/draft. Also see R Garnaut, Dog Days: Australia after the Boom, Redback, Melbourne, 2013, pp. 182-185.
183 Wikipedia contributors, Wiki, Wikipedia, The Free Encyclopedia, viewed: 16 June 2014, http://en .wikipedia .org/wiki/Wiki.
184 H Cooperrider, ‘Crowdsourced policy leads to $1B endowment for Alberta Gov’, Collabforge, viewed: 16 June 2014, http://collabforge .com/crowdsourced-policy-leads-to-1b-endowment-for-alberta-gov/
185 Human Services, Engagement Statistics for Alberta’s Social Policy Framework, Alberta Government, 28 February 2013, viewed: 16 June 2013, http://socialpolicyframework .alberta .ca/Document/Engagement_Statistics_Albertas_Social_Policy_Framework
186 Commonwealth of Australia, Royal Commission on Australian Government Administration, Canberra, 1976, http://apo .org .au/research/royal-commission-australian-government-administration-report.
187 APSC, Strengthening the performance framework: Towards a high performance APS, Canberra, 2013, http://www .apsc .gov .au/publications-and-media/current-publications/strengthening-performance.
188 National Commission of Audit, Towards Responsible Government: The Report of the National Commission of Audit – Phase Two, 2014, pp. x, 57, http://www .ncoa .gov .au/report/index .html.
189 APSC, State of the Service Report 2012 – 2013, Canberra, 2013, p. 200, http://www .apsc .gov .au/__data/assets/pdf_file/0018/29223/SOSR-2012_13-final-tagged2 .pdf.
190 Australian National Audit Office, The Australian Government Performance Measurement and Reporting Framework, Barton, 2013, http://www .anao .gov .au/~/media/Files/Audit%20Reports/2012%202013/Audit%20Report%2028/2012-13%20Audit%20Report%20No%2028 .pdf.
191 B Jensen, Making time for great teaching, Grattan Institute, Melbourne, 2014, http://grattan .edu .au/publications/reports/post/making-time-for-great-teaching/.
192 E Wimbush, ‘Implementing an outcomes approach to public management and accountability in the UK: Are we learning the lessons?’, Public Money & Management, vol. 31, no. 3, 2011, pp. 211-218; JJ Lew, ‘Delivering an efficient, effective and accountable government’, Memorandum for Heads of Executive Departments and Agencies, The Executive Office of the President, Washington DC, 2011, http://www .whitehouse .gov/sites/default/files/omb/memoranda/2011/m11-31 .pdf.
193 P Smith, ‘On the unintended consequences of publishing performance data in the public sector’, International Journal of Public Administration, vol. 18, 1995, pp. 277-310.
194 T Curristine, Z Lonti and I Joumard, ‘Improving Public Sector Efficiency: Challenges and Opportunities’ OECD Journal on Budgeting, vol. 7, no.1, 2007.
195 ibid.
196 G Gallop, ‘The vision thing: We need a national plan’ in M Lyons, Pushing our luck: Ideas for Australian Progress, Centre for Policy Development, Sydney, 2013, pp. 170-182.
197 Now For the Long Term: The Report of the Oxford Martin for Future Generations, University of Oxford, October 2013, pp. 46-47, http://www .oxfordmartin .ox .ac .uk/downloads/commission/Oxford_Martin_Now_for_the_Long_Term .pdf.
198 Treasury, Australia to 2050: Future challenges, Canberra, 2010, http://archive .treasury .gov .au/igr/.
199 APSC, State of the Service Report 2012 – 2013, Canberra, 2013, p. 209, http://www .apsc .gov .au/__data/assets/pdf_file/0018/29223/SOSR-2012_13-final-tagged2 .pdf.
200 Advisory Group on Reform of Australian Government Administration, Ahead of the Game: Blueprint for Reform of Australian Government Administration, Department of Prime Minister and Cabinate, Canberra, 2010, http://www .dpmc .gov .au/publications/aga_reform/aga_reform_blueprint/docs/APS_reform_blueprint .pdf.
201 J Slay and L Stephens, Co-production in mental health: A literature review, New Economics Foundation, London, 2013, http://www .neweconomics .org/publications/entry/co-production-in-mental-health-a-literature-review.
202 S Van Thiel and FL Leeuw, ‘The Performance Paradox in the Public Sector’, Public Performance & Management Review, Vol. 25, No. 3, 2002, pp. 267-281.
203 C Sabel, ‘Rethinking the street-level bureaucrat: Tacit and deliberate ways organisations can learn’, in Economy in Society: Essays in honor of Michael J. Piore, MIT Press, 2012, pp. 113-142, http://www2 .law .columbia .edu/sabel/Piore%20chapter .pdf.
204 D Donaldson, ‘Moran: public servants, states need more autonomy’, The Mandarin, 17 June 2014, http://themandarin .com .au/moran-public-servants-states-need-more-autonomy/; T Moran, ‘Public Sector Innovation’, speech at launch of Public Sector Innovation: Shaping the Future through Co-Creation, Sydney, 12 June 2014, http://www .ustream .tv/recorded/48670568.
205 C Argyris, and D A Schön, Organizational Learning: A Theory of Action Perspective, Addison-Wesley, 1978.
206 S Albrecht and A Travaglione, ‘Trust in Public-sector Senior Management’ The International Journal of Human Resource Management, vol. 14, no. 1, 2003, pp. 76–92.
207 APSC, State of the Service Report 2012 – 2013, Canberra, 2013, p. 69, http://www .apsc .gov .au/__data/assets/pdf_file/0018/29223/SOSR-2012_13-final-tagged2 .pdf.
208 B J Starnes, S A Truhon, and V McCarthy, A Primer on Organizational Trust, ASQ Human Development & Leadership Division, Milwaukee, 2010, https://asq .org/hdl/2010/06/a-primer-on-organizational-trust .pdf.
209 S Albrecht, and A Travaglione, ‘Trust in public-sector senior management’, The International Journal of Human Resource Management, vol. 14, no. 1, 2003, pp. 76–92.
210 DJ Stanley, JP Meyer and L Topolnytsky, ‘Employee Cynicism and Resistance to Organizational Change’, Journal of Business and Psychology, vol. 19, no. 4, pp. 429-459.
211 APSC, State of the Service Report 2010–11, Canberra, 2011, http://www .apsc .gov .au/about-the-apsc/parliamentary/state-of-the-service/state-of-the-service-2010.
The Centre for Policy Development is an independent research institute funded by donation. All our work is published under Creative Commons Licence.
We would like to thank all our supporters for helping CPD produce rigorous, evidence-based research and policy recommendations that can outlast governments and enhance the lives of current and future generations.
If you found this report valuable and want to help the Centre for Policy Development do more of the same, you can donate in the following ways: