Trust performance This report covers the period from 1st April 2016 to 30th September 2016. During this time, the Family Charities Ethical Trust (Income) returned 10.3% while, over the same period, the Family Charities Ethical Trust (Accumulation) returned 13.1% and the FTSE4Good UK 50 Total Return Share Index returned 14.0%. The difference in performance between the Family Charities Ethical Trust (Accumulation) and the benchmark is mainly due to the management charge being taken from the Trust. The difference between Family Charities Ethical Trust (Income) and Family Charities Ethical Trust (Accumulation) is due to the Income distribution being paid out at year-end. * Trust performance is based on price movement calculated using a nominal price at close, which will include all charges & distributions payable. The benchmark is not affected by any charges. Source: (Family Charities Ethical Trust Inc, Family Charities Ethical Trust Acc) OneFamily, basis bid to bid net of tax on dividend, (FTSE4Good UK 50 TR Share Index) State Street Global Advisors (SSGA). Market background The UK’s referendum on EU membership (Brexit) was the defining event during the reporting period. Sterling strengthened in April as fears of a possible Brexit eased somewhat. UK equities rose, led by the large-cap resources sector, which benefited from a pick-up in commodity prices, a trend that started in the previous quarter. In May, the results of a new poll appeared to slightly diminish the likelihood of imminent Fed tightening. The poll, released on the final day of May, showed a plurality of voters in favour of leaving the EU. Against high expectations in the market for a ‘remain’ vote, the poll resulted in a 1% one-day selloff of sterling against the US dollar and euro, and further increased currency volatility, which had been surging prior to the poll’s release. The referendum results announced on 24 June revealed that the UK had voted by a majority of 52% to 48% to leave the EU. The initial market reactions were pronounced: sterling fell dramatically, safe-haven assets like government bonds rallied and equity markets declined. Equities generally staged a recovery in the final days of the second quarter, supported by expectations that interest rates would stay lower for longer. The Bank of England surprised markets by failing to take action in July, despite an 82% probability priced in markets for a 25-basis-point (bps) cut in the bank’s policy rate just the day before. Market reaction was contained, however, as the central bank signalled strongly that new stimulus would be forthcoming at August’s meeting of the Monetary Policy Committee (MPC). In August, the MPC announced several easing measures including reducing the policy rate by 25 bps and extending their quantitative easing (QE) programme by £60bn over six months. The QE included a private sector asset purchase programme (consisting of up to £10bn of corporate bonds over the next 18 months) and the introduction of a new Term Funding Scheme. August’s data included positive news in some areas despite the continued anticipated fallout from the Brexit referendum. The CBI’s quarterly manufacturing and retail survey balances for August rallied from their July declines, suggesting there was no break in activity immediately following the Brexit vote, and that growth decelerated only moderately in the aftermath of the referendum. GDP growth estimates from the National Institute of Economic and Social Research (NIESR) moderated to 0.3% in the three months to August from 0.4% in the three months to July and 0.6% in the three months to June. “Hard Brexit” fears resurfaced in September, drowning out UK data improvements from August and September. During the month, the sterling declined and UK equities outperformed. Activity During the period, there was generally a steady stream of small daily cash-flows into the portfolio, with a large contribution worth approximately 2.38% of the Fund’s market value at the end of May. The contribution was invested in physical equities. Generally, the portfolio’s daily flows are invested in FTSE 100 futures as this is the most efficient way to invest cash-flows quickly. If the FTSE futures level rises to a level where it could start to impact risk, the futures would be sold and physical equities would be bought because a significant higher futures level would increase the tracking error of the fund. The ex-ante risk of the portfolio at the end of the period was 0.02%. This low level is in keeping with a passive fund. Outlook Looking forward to the remainder of 2016, we continue to view equity markets with caution, in particular in international developed markets where there has been a perceived decline in the efficacy of monetary policy support in the Eurozone and Japan. State Street Global Advisors 30th September 2016 Family Charities Ethical Trust Interim Short Report 1st April 2016 to 30th September 2016 The information in this report is designed to enable unitholders to make an informed judgement on the activities of the Trust during the period it covers, and the results of those activities. For more information about the activities and performance of the Trust for this and previous periods, please contact OneFamily’s Customer Service Team on 0344 8 920 920 (calls may be monitored or recorded for training purposes). Trust facts Sector: IA UK All Companies Trust size: At 30th Sep 2016 £154 (millions) At 31st Mar 2016 £131 Initial charge: nil Annual management charge: 1.5% Accounting dates: Interim 30th September Final 31st March Distribution due dates: Interim N/A Final 31st May Risk profile The main risks arising from the Trust’s financial instruments are market price, liquidity and currency rate risks. The Manager reviews (and agrees with the Trustee) policies for managing each of these risks. The value of investments and the income from them is not guaranteed and can go down as well as up. Investment objective and policy To achieve long-term capital growth by tracking the total return of the FTSE4Good UK 50 Share Index or such other similar Index as the Manager shall consider appropriate (“the Index”). In order to accurately track this Index, the Trust’s investments will closely replicate the holdings in that Index. Where appropriate, the Trust may use Transferable Securities, Approved Money Market Instruments, units in Collective Investment Schemes, deposits and cash or near cash. Derivatives and Forward Transactions may be used for Efficient Portfolio Management purposes (including hedging). The Trust may not consist of the exact composition and weighting of the Index in circumstances where the Manager determined that this is expedient for reasons of poor liquidity or excessive cost to the Trust.
Transcript
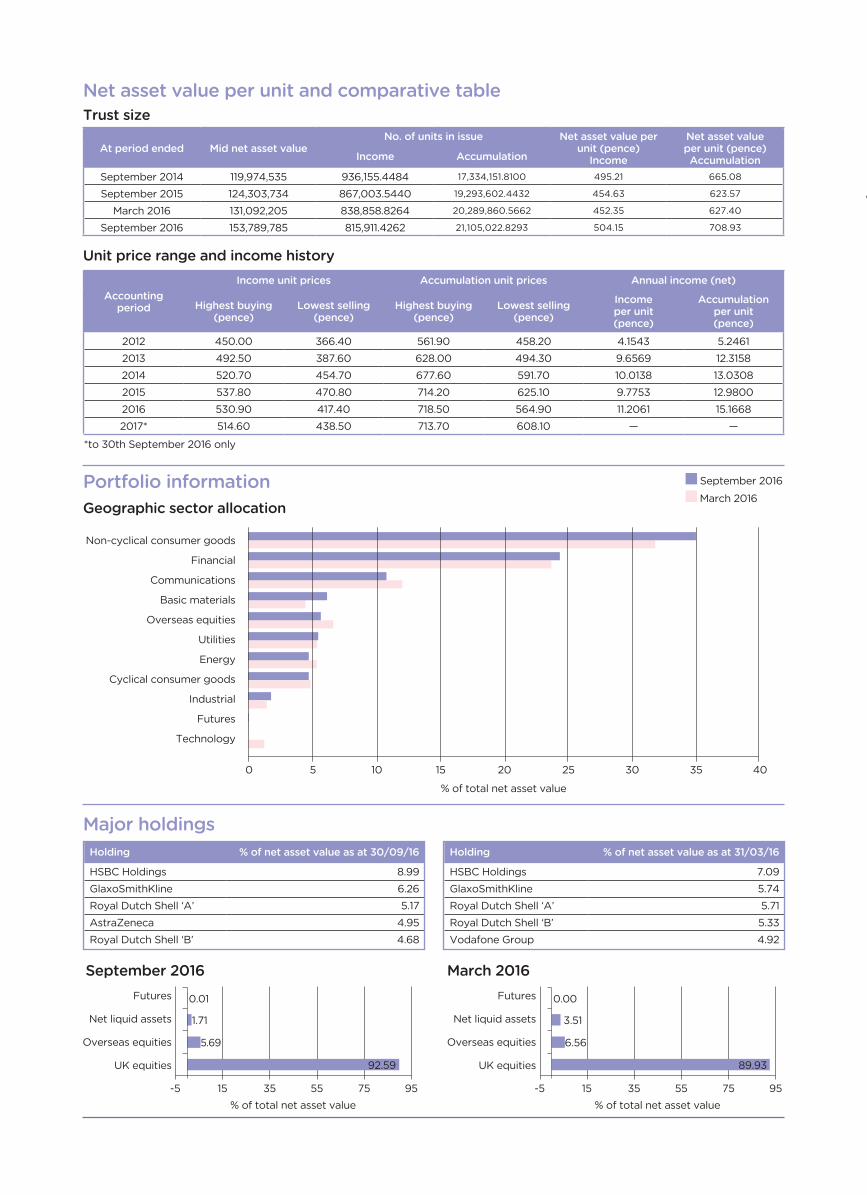
Trust performanceThis report covers the period from 1st April 2016 to 30th September 2016. During this time, the Family Charities Ethical Trust (Income) returned 10.3% while, over the same period, the Family Charities Ethical Trust (Accumulation) returned 13.1% and the FTSE4Good UK 50 Total Return Share Index returned 14.0%. The difference in performance between the Family Charities Ethical Trust (Accumulation) and the benchmark is mainly due to the management charge being taken from the Trust. The difference between Family Charities Ethical Trust (Income) and Family Charities Ethical Trust (Accumulation) is due to the Income distribution being paid out at year-end.
* Trust performance is based on price movement calculated using a nominal price at close, which will include all charges & distributions payable. The benchmark is not affected by any charges.
Source: (Family Charities Ethical Trust Inc, Family Charities Ethical Trust Acc) OneFamily, basis bid to bid net of tax on dividend, (FTSE4Good UK 50 TR Share Index) State Street Global Advisors (SSGA).
Market backgroundThe UK’s referendum on EU membership (Brexit) was the defining event during the reporting period. Sterling strengthened in April as fears of a possible Brexit eased somewhat. UK equities rose, led by the large-cap resources sector, which benefited from a pick-up in commodity prices, a trend that started in the previous quarter.
In May, the results of a new poll appeared to slightly diminish the likelihood of imminent Fed tightening. The poll, released on the final day of May, showed a plurality of voters in favour of leaving the EU. Against high expectations in the market for a ‘remain’ vote, the poll resulted in a 1% one-day selloff of sterling against the US dollar and euro, and further increased currency volatility, which had been surging prior to the poll’s release.
The referendum results announced on 24 June revealed that the UK had voted by a majority of 52% to 48% to leave the EU. The initial market reactions were pronounced: sterling fell dramatically, safe-haven assets like government bonds rallied and equity markets declined. Equities generally staged a recovery in the final days of the second quarter, supported by expectations that interest rates would stay lower for longer.
The Bank of England surprised markets by failing to take action in July, despite an 82% probability priced in markets for a 25-basis-point (bps) cut in the bank’s policy rate just the day before. Market reaction was contained, however, as the central bank signalled strongly that new stimulus would be forthcoming at August’s meeting of the Monetary Policy Committee (MPC). In August, the MPC announced several easing measures including reducing the policy rate by 25 bps and extending their quantitative easing (QE) programme by £60bn over six months. The QE included a private sector asset purchase programme (consisting of up to £10bn of corporate bonds over the next 18 months) and the introduction of a new Term Funding Scheme.
August’s data included positive news in some areas despite the continued anticipated fallout from the Brexit referendum. The CBI’s quarterly manufacturing and retail survey balances for August rallied from their July declines, suggesting there was no break in activity immediately following the Brexit vote, and that growth decelerated only moderately in the aftermath of the referendum. GDP growth estimates from the National Institute of Economic and Social Research (NIESR) moderated to 0.3% in the three months to August from 0.4% in the three months to July and 0.6% in the three months to June.
“Hard Brexit” fears resurfaced in September, drowning out UK data improvements from August and September. During the month, the sterling declined and UK equities outperformed.
ActivityDuring the period, there was generally a steady stream of small daily cash-flows into the portfolio, with a large contribution worth approximately 2.38% of the Fund’s market value at the end of May. The contribution was invested in physical equities. Generally, the portfolio’s daily flows are invested in FTSE 100 futures as this is the most efficient way to invest cash-flows quickly. If the FTSE futures level rises to a level where it could start to impact risk, the futures would be sold and physical equities would be bought because a significant higher futures level would increase the tracking error of the fund. The ex-ante risk of the portfolio at the end of the period was 0.02%. This low level is in keeping with a passive fund.
OutlookLooking forward to the remainder of 2016, we continue to view equity markets with caution, in particular in international developed markets where there has been a perceived decline in the efficacy of monetary policy support in the Eurozone and Japan.
State Street Global Advisors 30th September 2016
Family Charities Ethical TrustInterim Short Report 1st April 2016 to 30th September 2016The information in this report is designed to enable unitholders to make an informed judgement on the activities of the Trust during the period it covers, and the results of those activities. For more information about the activities and performance of the Trust for this and previous periods, please contact OneFamily’s Customer Service Team on 0344 8 920 920 (calls may be monitored or recorded for training purposes).
Trust factsSector: IA UK All CompaniesTrust size: At 30th Sep 2016 £154(millions) At 31st Mar 2016 £131Initial charge: nilAnnual management charge: 1.5%Accounting dates: Interim 30th September Final 31st MarchDistribution due dates: Interim N/A Final 31st May
Risk profileThe main risks arising from the Trust’s financial instruments are market price, liquidity and currency rate risks. The Manager reviews (and agrees with the Trustee) policies for managing each of these risks. The value of investments and the income from them is not guaranteed and can go down as well as up.
Investment objective and policyTo achieve long-term capital growth by tracking the total return of the FTSE4Good UK 50 Share Index or such other similar Index as the Manager shall consider appropriate (“the Index”). In order to accurately track this Index, the Trust’s investments will closely replicate the holdings in that Index.
Where appropriate, the Trust may use Transferable Securities, Approved Money Market Instruments, units in Collective Investment Schemes, deposits and cash or near cash. Derivatives and Forward Transactions may be used for Efficient Portfolio Management purposes (including hedging).
The Trust may not consist of the exact composition and weighting of the Index in circumstances where the Manager determined that this is expedient for reasons of poor liquidity or excessive cost to the Trust.
Source: (Family Charities Ethical Trust Acc) OneFamily, basis bid to bid net of tax on dividend (IA UK All Companies Sector, FTSE4Good UK 50 TR Share Index) Lipper.
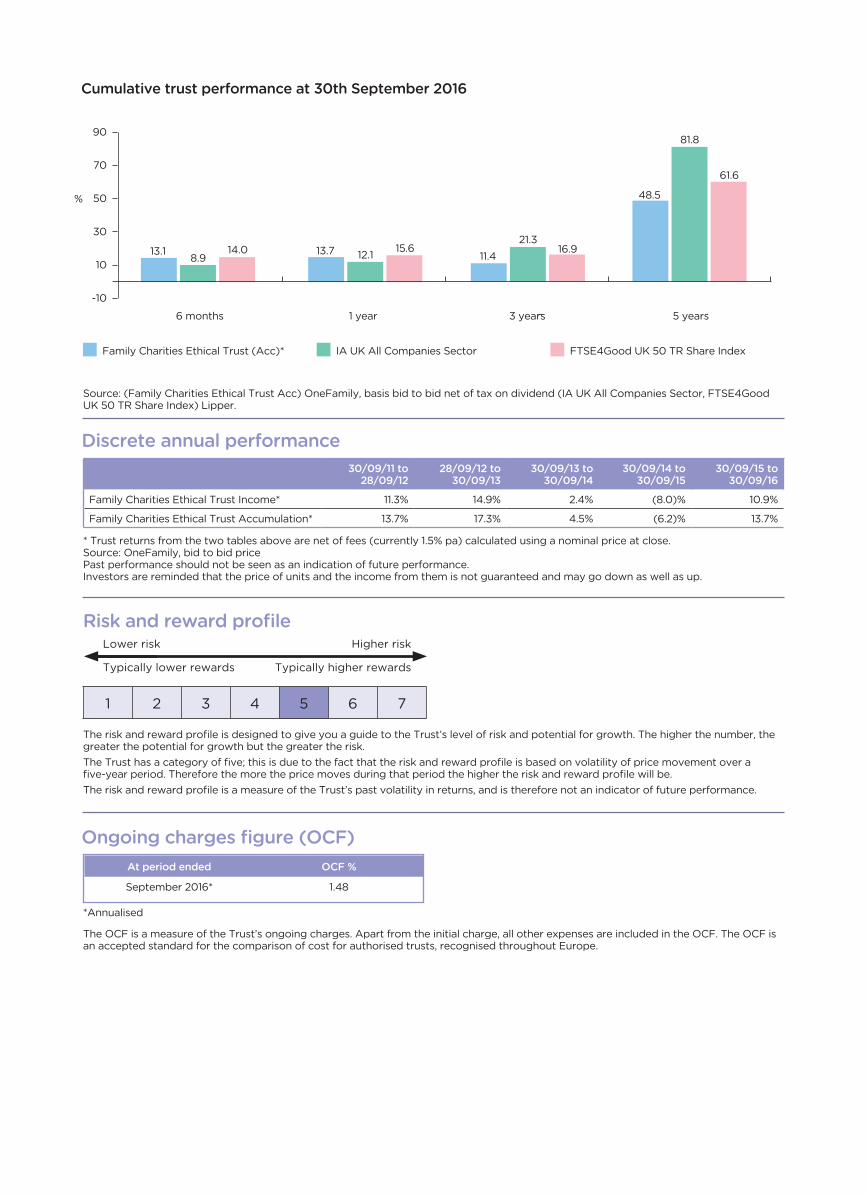
The risk and reward profile is designed to give you a guide to the Trust’s level of risk and potential for growth. The higher the number, the greater the potential for growth but the greater the risk.The Trust has a category of five; this is due to the fact that the risk and reward profile is based on volatility of price movement over a five-year period. Therefore the more the price moves during that period the higher the risk and reward profile will be.The risk and reward profile is a measure of the Trust’s past volatility in returns, and is therefore not an indicator of future performance.
Risk and reward profileLower risk Higher risk
Typically lower rewards Typically higher rewards
1 2 3 4 5 6 7
The OCF is a measure of the Trust’s ongoing charges. Apart from the initial charge, all other expenses are included in the OCF. The OCF is an accepted standard for the comparison of cost for authorised trusts, recognised throughout Europe.
Ongoing charges figure (OCF)At period ended OCF %
September 2016* 1.48
*Annualised
March 2016
Cumulative trust performance at 30th September 2016
Family Charities Ethical Trust (Acc)* IA UK All Companies Sector FTSE4Good UK 50 TR Share Index
* Trust returns from the two tables above are net of fees (currently 1.5% pa) calculated using a nominal price at close.Source: OneFamily, bid to bid pricePast performance should not be seen as an indication of future performance.Investors are reminded that the price of units and the income from them is not guaranteed and may go down as well as up.
Discrete annual performance
30/09/11 to 28/09/12
28/09/12 to 30/09/13
30/09/13 to 30/09/14
30/09/14 to 30/09/15
30/09/15 to 30/09/16
Family Charities Ethical Trust Income* 11.3% 14.9% 2.4% (8.0)% 10.9%
Family Charities Ethical Trust Accumulation* 13.7% 17.3% 4.5% (6.2)% 13.7%
90
70
50
30
10
-10
% 48.5
81.8
61.6
6 months 1 year 3 years 5 years
11.421.3
16.913.713.1 12.18.915.614.0
Significant ChangesThe obligation to produce and publish short reports will cease to apply from 22 November 2016, this will be the last short report distributed for Family Charities Ethical Trust. The annual and half yearly full report and accounts for Family Charities Ethical Trust will still be published and can be found on our website at www.onefamily.com website or by calling us on the number detailed at the front of this report.
Report and AccountsCopies of the annual and half yearly full Report and Accounts of the Family Charities Ethical Trust are available free of charge on request to the Manager. They are also available in the “Our Story” section of our website www.onefamily.com
Manager and RegistrarFamily Investment Management Limited 16 West Street Brighton BN1 2RE Tel: 01273 724570 Fax: 01273 736958
Registered in England No. 1915516 The Manager is authorised and regulated by the Financial Conduct Authority.
The Manager is a member of the Investment Association
This report is issued and approved by the Manager.
Investment AdvisorState Street Global Advisors 20 Churchill Place Canary Wharf London E14 5HJ
Authorised and regulated by the Financial Conduct Authority.
TrusteeState Street Trustees Limited 20 Churchill Place Canary Wharf London E14 5HJ
Authorised and regulated by the Financial Conduct Authority.
AuditorKPMG LLP 15 Canada Square London E14 5GL
21701 005 11.2016
The Family Charities Ethical Trust is not in any way sponsored, endorsed, sold or promoted by FTSE International Limited (FTSE), the London Stock Exchange Plc (the Exchange) or The Financial Times Limited (FT). Neither FTSE, the Exchange nor the FT provide any indication or guarantee (including any warranty or representation) of the results that may be obtained from the indices and/or the figures at which the indices stand at any particular time on any particular day. The indices are compiled and calculated by FTSE. Neither FTSE, the Exchange nor the FT will be liable to any person for any error in the indices or be under any obligation to advise anyone of any such error. FTSE® is a trade mark of the Exchange and the FT and is used by FTSE under licence.
OneFamily is a trading name of Family Assurance Friendly Society Limited (incorporated under the Friendly Societies Act 1992, Reg. No. 939F), Family PEP Managers Limited (Co. No. 2934967), Family Investment Management Limited (Co. No. 1915516) and Family Equity Plan Limited (Co. No. 2208249). Governor and Governor Money are trading names of Governor Finance Limited (Co. No. 07210404). Registered in England & Wales at 16-17 West Street, Brighton, BN1 2RL, United Kingdom. Family Assurance Friendly Society Limited is authorised by the Prudential Regulation Authority and regulated by the Financial Conduct Authority and the Prudential Regulation Authority. Family PEP Managers Limited, Family Investment Management Limited, Family Equity Plan Limited and Governor Finance Limited are authorised and regulated by the Financial Conduct Authority.
This document is available in large print or braille on request by calling 0344 8 920 920 (telephone calls may be monitored or recorded).