FAMILY GOVERNANCE AND FIRM VALUE: EVIDENCE FROM INDONESIA Hadi Sumarsono, Economic Faculty, Muhammadiyah University of Ponorogo, Indonesia. [email protected]Abstract Using a sample of non-bank and non-finance companies, on the Indonesia Stock Exchange in 2010, this study gives an overview of how the internal mechanisms of corporate governance in Indonesian family firm. This study also discusses how the combination of ownership, supervisory (commissioners) and management (directors) has consequences on the different types of agency problem. The results provide evidence that differences between family firms value with non-family firms value is not determined solely on the ownership component, but also depends on how the family is involved in the board of commissioners and/or directors. Conflict between family owners with non-family owners is more costly than the conflict between family owners with outside management. Increasingly dominant role family members in board of commissioners and/or board of director potential to cause expropriation of minority stakeholders. Keyword: Firm Value, Agency Problem, Family Firm, Family Governance. 1. Introduction Family firms is an interesting object for study. Most of the big companies in the world came from a family firm (Anderson and Reeb, 2003; Dyer, 2010). Family firms has more complex problems than nonfamily firms. Complexity of the problem indicated by considerations of family in business. In addition, family firm also consider the needs and wishes of the family, and bear the risk for the long-term interest (Ward, 2002). Some research linking family firm on its value still gives mixed results. Several studies have found that family firms are better than non-family firms. (Anderson and Reeb, 2003; Mc Connaughy et al. 1998; and Maury, 2006). Instead, Perez- Gonzales (2006), Bennedsen et al. (2007), and Bertland et al., (2008) proved that family firms are worse than non-family firms. Differences in the results of the study one due to differences in the definition of family firms (Villalonga & Amit, 2006). Difference in definition leads to different outcomes. Westhead and Cowling (1998) in Allouche et al. (2009) reveals how different definitions affect the research results of the comparison between family and non family firms. Definition of family firms should be based on the role of family members in internal governance. Defining the family business should consider the purpose of the study, and the relation with the legal context from different country (Allouche et al., 2009). Models of governance system that is applied in a country can not necessarily be applied to different institutional environments. The public company in Indonesia adopts a two-board system that ranks the board of commissioners (board of commissioner) acting supervisory roles (control) and the role of guidance (advisory) while the board of directors (the board of directions) includes work management executive function. Law of the Republic of Indonesia Number 40. In 2007 stated that the board of directors and board of commissioners similarly elected and accountable to the General Meeting of Shareholders. This governance system is different from the other countries (Lukviarman, 2004). Hadi Sumarsono, Int.J.Eco. Res., 2014, v5i6, 08 - 26 ISSN: 2229-6158 IJER NOV-DEC 2014 Available [email protected]8
Transcript
FAMILY GOVERNANCE AND FIRM VALUE: EVIDENCE FROM
INDONESIA
Hadi Sumarsono, Economic Faculty, Muhammadiyah University of Ponorogo,
Abstract Using a sample of non-bank and non-finance companies, on the Indonesia Stock Exchange in 2010, this study gives an overview of how the internal mechanisms of corporate governance in Indonesian family firm. This study also discusses how the combination of ownership, supervisory (commissioners) and management (directors) has consequences on the different types of agency problem. The results provide evidence that differences between family firms value with non-family firms value is not determined solely on the ownership component, but also depends on how the family is involved in the board of commissioners and/or directors. Conflict between family owners with non-family owners is more costly than the conflict between family owners with outside management. Increasingly dominant role family members in board of commissioners and/or board of director potential to cause expropriation of minority stakeholders. Keyword: Firm Value, Agency Problem, Family Firm, Family Governance.
owned, controlled and managed by a particular family. Families have a significant ownership stake and putting family members on the board of commissioners and top management. Type FOCM is a type of family firm's most powerful families against corporate domination. This type of family firm maybe didn’t have a conflict between supervision and management, but is potentially causing expropriations against minority owners. This type of company is a potential trigger agency problem II
2. FOC: It is a company owned and controlled by certain families. The family had a considerable share in the control of the company as well as putting family members on the position of commissioner (supervision and advisory), but do not put family members in positions of directors (management). Company management is left entirely to the management of professional (non-family). The role of the family perform a supervisory role in the board of commissioners may reduce the agency conflict between management and the owner's family. This type of company is not much family raises agency problems I. Dominance supervisory by family commissioners may potential arise conflict of interest between family owners and minority owners but independent commissioners from outside the ranks of the family members provide the demand for management to further improve transparency, so as to give confidence to the owner who is not actively involved in the company. The potential emergence of agency problem II depends on the role of independent commissioners.
3. FOM: The company is owned and managed by the family but do not put family members on the position of commissioner. Potential conflict between management with the owner (agency problem I) does not exist as part of the family so that the directors of professionalism, talent and the ability to determine the performance of the management of the family firm. In the family firm type FOM is a family surveillance formally handed over to outsiders (non-family) so that commissioners are expected to provide insight and leads objective but if it is filled by the family crony then become less objectivity. More commissioner roles serves as a director (advisor) rather than supervisors. In this case, the possibility of conflict between family owner-minority owner (agency problem II) is very large.
4. FO: The company is owned by the family without involving a family member in the board of commissioners and management. This type of company type is a passive type of family firms. Oversight and management functions delivered by non family. Type a company like this is very rare because of the family (the owners) can be greatly harmed. Agency problem type II does not occur in this type of company, but the company is included in the family of this type has the potential to have a conflict between the owner and the management (agency problem I).
5. FCM: Company that its ultimate ownership is not owned by a particular family, but two or more family members or positions of commissioners and directors (managerial). Families may not have a dominant stock but very dominant in managing and overseeing the company. Type a company like this might be very rare. There is a
possibility once the company was originally owned by the family but later sold their stock is owned by another party. Family only became minority owners. Another possibility is that there is a strong element of nepotism within the company. In this type of company like this, management has the potential to act opportunist. Based on agency theory, this type of company is likely to raise agency problems I.
6. FC: Company that its ultimate ownership is not owned by the family, but two or more members of the family occupy the position of commissioner alone. Family only plays a minor role in the ownership of the company, but many provide a role in oversight. Type of company FC is probably a lot going on when the company is widely dispersed ownership structure. Enhancing control mechanism is done formally through the role of the family in the board of commissioners. Almost the same as the type of company FCM, the family has the potential to benefit personally through oversight role.
7. FM: Company that its ultimate ownership is not owned by a particular family but put two or more family members in the managerial position (boar of directors). Element of nepotism within the company may be very thick. If directors cannot do better than the supervisory function, it is potentially detrimental to the interests of the owners. Agency problems type I prevalent in this type of family companies.
8. NF: non-family companies. The family was not involved in the ultimate ownership, the commissioner or the management company. This types of companies are include foreign firm and governments firms.
2.4. Hypothesis Development Based on the previous description, it can be seen that the differences in family engagement in corporate governance types produce different type of agency problem. Each type has a corporate governance agency, so that different types have different effects on firm value. Villalonga and Amit (2006), proving that family engagement in the company have an influence on the firm value. Family firm which has control mechanism enhance and managed by the family (family CEO) has a lower performance than non-family firms. But the company's performance to be better when the family managed (family CEO) without the enhance control mechanism. Family firm with no control enhance mechanism have lower agency conflict than most other types of companies. Furthermore Villalonga and Amit (2006) explains that the agency conflict between managers with owners (agency type I) have a higher cost than the conflict between family owners with non-family owners (agency type II) when the company's founder is still the CEO. Conversely, when the founder had not served as CEO, the conflict between family owners with non-family owners (agency type II) have higher agency costs. While Allouche, et al, (2009) proved that there are differences firm value between the strong control family business (family members involved in the management and major shareholders) with weak control family business (family members only involved in the management course or as a main course shareholders). Family of companies (strong control) in Japan have higher performance than companies that have family that weak supervision (weak control). Based on these explanations, it can be an alternative hypothesis as follows: H1: There are a difference firm value between 8 type of firm
3. Methodology 3.1. Samples and Data The sample used in this study are all companies listed on the Indonesia Stock Exchange is actively traded in 2010. The use of only one year of data is done with the reason that families usually owned company in the long term so that the ownership structure and corporate governance mechanisms remains relatively stable from year to year. The sample used should have data available which includes: - The owner's full name firms. - Full name board of commissioners. - Full name of the board of directors. - The financial statements of 2010. Such data can be obtained from the Indonesian Capital Market Directory 2011 and as additional information of data, annual report, prospectus or other sources from internet. 3.2. The procedure of extracting data
type family company. Data to develop the type of family firm conducted several stages. The steps were carried out following the procedure as follows: Identify " Controling Family Name ".
Name of company controllers can be identified by the names of the owners of the company or the name of the founder of the company, the name or names on the board of directors in the board of commissioners. Name search is done by knowing the level of family attachment relationship full name or the name of the possible repetition (Garcia-Castro and Casasola, 2011). If more than one name is obtained relating the name is set as "Controlling Family Name"1. The full
1 Identification of a family relationship that is based on the full name may not be able to provide excellent results in the data mining process. However, this method still remains relevant and justifiable given the lack of
name of all shareholders, directors and commissioners of each company can be found in the Indonesian Capital Market Directory.
Determine the company "Family Owned". Based on the name of the controlling family is then seen the proportion of ownership in the company. If the proportion of ultimate family ownership is greater than 25% then immediately set as a corporate "Family Owned"2. Faccio and Lang (2003) states that the ownership of the company is classified as a family-owned company if the company is owned by individuals, and or a few individuals and or unlisted companies (owned indirectly). Information unlisted company ownership structure (indirect ownership) can be traced through a prospectus the company in the "Brief Description of Legal Entity Form Owner"
Looking for "Family Commissioner". Family commissioner determined by repetition name of "Controling Family Name" which entered the ranks of its commissioners. If there is a repetition of "Controling Family Name" on the board of commissioners then directly determined as " Family Commissioner".
Look for "Family Management". The family management is based on the repetition "Controlling Family Name" on the company's board of directors. If there is a repetition of the name of the company designated as "Family Management"
This procedure should not be performed in sequence but have
regulation regarding disclousure in Indonesia (Tabalujan, 2002). 2 Decision of the Capital Market Supervisory Board No. Kep/PM/2002 of Company Takeover controller defines public companies as having more than 25% of shares or has control of the company either directly or indirectly
mutual cross-check. If there is a " Controlling Family Name " who still doubt that the name of the data traced through "history of ownership" in the company's prospectus. The author also check potential family names through various sources on the Internet which may not be based on the relationship name.
After the criteria of "Family Owned", “Family Commissioner” and “Family Management” can be identified, then these three components are combined as in Table 1 to determine which type of company.
3.3. Variables Measurement Type of Family Firm Based on the opinion of Villalonga and Amit (2006), this study classifies the type of family firms in three dimensions, namely ownership (family ownership), control governance (family commissioner) and management (family directors). Then these components are combined into 8 types of firms (see table 1). Number 7 company is a family firm type (F_ALL), namely: FOCM, FOC, FOM, FO, FCM, FC, FM and 1of non-family firm are denoted by NF. Firm Value In this study, the company's value is measured by using the company's market performance measure Tobin's
Q. Tobin's Q indicates whether the company's market value is higher or lower than the replacement value of the company's assets. According Bunkanwanicha et al (2008) Tobin's Q is calculated using the ratio of book value of total assets minus book value of equity plus the market value of equity to book value of total assets. 4. Result and Discussion 4.1. Sample and Data Description As of December 2010 the number of companies listed on the Indonesia Stock Exchange 428 companies. The company registered in various industrial sectors. Listed companies in the banking industry and other financial institutions are not included in the sample because the financial industry has different rules than non-financial firms. Number of population until the period of December 2010 as many as 348 companies. Of these, there were 33 companies which does not fulfill the data to be used in research. Most of the missing data is due ownership structures (especially information incorporated owners) can not be identified. Finally the number of samples used in this study were 315 companies. In summary statement number of the samples in this study can be seen in table 2
Tabel 2.
Number of samples
Information Number of companies
The total number of companies listed on the Stock Exchange
428
Registered in the banking sector, credit agency, securities and other investment institutions
(80)
Non Bank and non Financial Institutions listed on the Stock Exchange by December 2010
348
Companies cannot be identified (33) Number of Samples 315
Table 3 shows the number of types of companies by industry sector. In 2010 the number of non-family firms (NF) is known to many as 101 companies or by 32.06% of the 315 firms used in the sample. The rest as many as 214 companies or 67.9%, is a family company. This amount is not much different from the results of the study Claessens et al. (2000) and Ahmad et al. (2009). Based on 1997 data, Claessens et al. (2000) noted that about 67 percent of companies listed on the Indonesia Stock Exchange (BEI) is a family company. It also expressed by Ahmad (2008) who showed that 63.81 percent of companies listed on the Indonesia Stock Exchange in 2006, is classified as a family firm. Not surprise if the South China Morning Post in 2002 reported that Indonesia has the highest percentage of family firms in companies listed on the exchange, over Malaysia and Hong Kong (Jaggi et al., 2009).
NA : Not Available A : Companies identified (Available data) FC : Family Commissioner FCM : Family Commissioner-Management FM : Family Management FO : Family Ownership FOC : Family Ownership-Commissioner FOCM : Family Ownership-Commissioner-Management NF : Non Family Firm F(ALL) : All type of family firm
Based on the industry sector, the real estate industry is the sector most companies entered categorized as a family company. A total of 34 of the 44 companies in the real estate industry sector is classified as a family firm. While no family firm in the cement industry sector. There are three companies in the cement industry and all are categorized as nonfamily firms. Companies in the industry sector Adhesive, Metal Fabricate and Lumber and Wood is dominated by family firms. Likewise, the textile industry sector, from 9 companies engaged in the industry, 8 of whom are family firms. Proficiency level of discussion it can be said that this type of family firms scattered in almost all sectors of industry. Based on the type of governance, the family company has most of the characteristics of ultimate ownership. Most of the ultimate owners put family members on the position of commissioners and directors. A total of 76 companies not only have more than 25% shares of the company but also put his family members in positions of commissioners and directors. Only some 35 firms or 11.29% that have more than 25% the proportion of shares but not put family members in both the board of directors and commissioners. This result is in accordance with the opinion Lukviarman (2004) which states that the majority of family firms listed on the Indonesia Stock Exchange puts the family members to get involved in the company. Another thing that needs to be noted is, there are a number of 21 companies, although not dominant in the possession of the company but can put a family member in a position of commissioners and directors. Although not significant
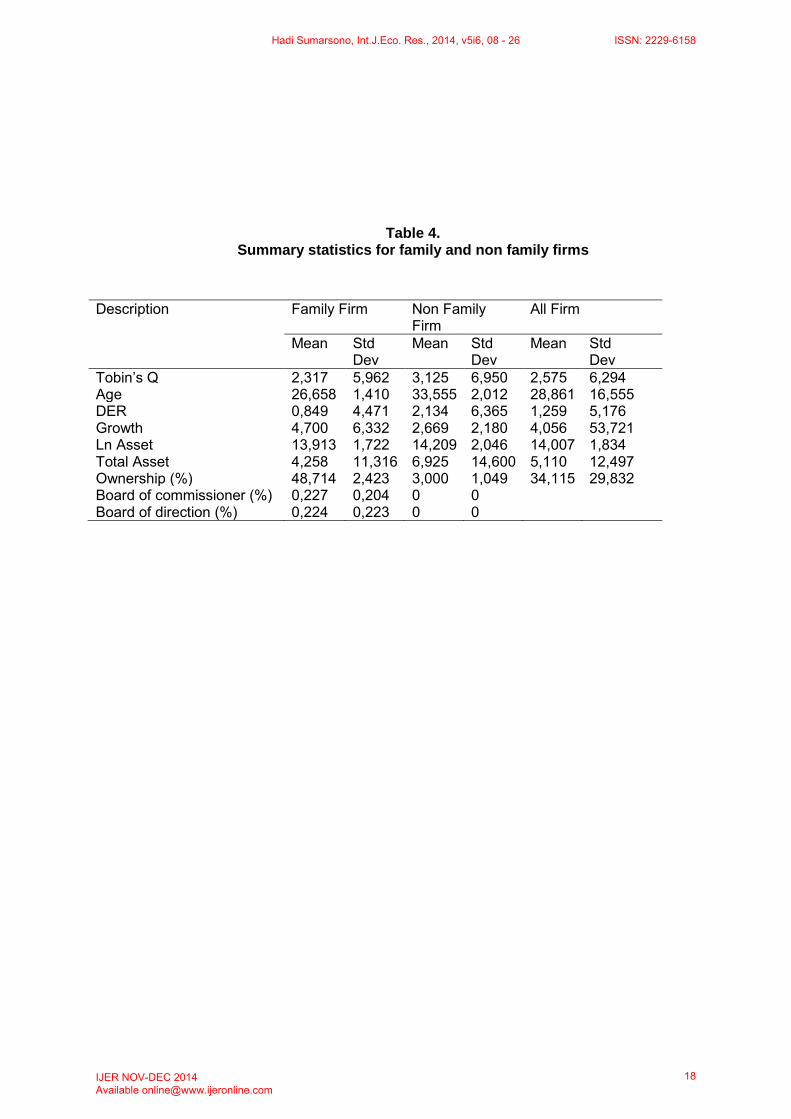
voting rights at the ownership, family can control firm by management and supervision. Almost the same number shown in the type of family firm FM (Family Management). Identification of data indicated that there are 19 companies that put two or more family members in management positions. The average proportion of ownership of family firms is quite high. From table 4. it is known that the average proportion of family ownership of 48.714 % . While the average proportion of family ownership that cannot be categorized as a family company by 3 % . Average proportion of family ownership of all types of companies (including non- family firm) amounted to 34.115 % . Table 4. shows that the average performance of family firms is lower than non- family firm. The average value of the Tobin's Q family of companies actually experienced overvalued or greater than 1, is equal to 2,317 but the average is still below the average Tobin's Q non- family firm. Overall, the average performance of family firms is lower than non- family companies. But, not all types of family firms on average have lower performance than non- family companies. Based on Table 5. it is known that the type of family firm FOC has average Tobin’s Q is higher than other types of companies, including non- family firm types (Type NF). Type FOC company has an average of 4.543 above Tobin's Q non family-type company was 3,166. Type FC and FM companies are two types of companies that have an average of Tobin's Q is equal to 1.199 and the lowest type FM firm slightly above it is equal to 1.300 .
Table 6 shows that numbers of family members who are placed in the position of commissioner-directors are quite varied among companies. Number of family members who are placed in the position of commissioner is between 1 to 4 family members. There are 95 companies that put 1 family member in board of commissioner. While 37 companies put 2 family members and 4 companies put 3 family members. Only one (1) company put 4 members of his family in the position of commissioner. The number of companies that put members in the position of directors of the company as much as 139. This amount is much less than the number of companies to place a family member in the position of commissioner. There are 3 companies that put 4 family members and 3 companies that put 5 family members on the board of directors position. Compared to the position of commissioners, directors position seems more likely to be occupied family members. Most companies put 2 or more family members in positions of commissioners and directors. Only some 53 companies
that put a family member in a position of commissioners or directors only. There are 6 companies that put the 6 members of his family in the position of commissioners and directors. This suggests that the placement of a family member in the position of commissioners or directors are common in family firms that go public in Indonesia, but the dominance of the family members or the board of commissioners and directors are quite varied among companies. Placement of a number of family members in the board of commissioners may provide benefits for companies can play a role in the oversight of nonfamily managers or directors, thereby reducing agency conflict. However, the dominant member of the family in the board of commissioners and directors can make a less independent board role. Family supervision by the board of commissioners may provide benefits to a minority owner, but on the other hand, the dominance of the strong potential to lead to conflict of interest between the family and non-family owners (Anderson and Reeb, 2003).
Table 6 Sum of Family members involved in board of commissioner and/or board of direction
Positions Sum of family members Number of firms
1 2 3 4 5 6
Board of Commissioners 95 37 4 1 0 0 137
Board of Directors 87 39 7 3 3 0 139
Board of Commissioners and directors 53 70 34 13 3 6 179
The large number of family members in the board of directors and commissioners can increase conflict between family members themselves. Minichilli et al. (2010) proved that the increase in the proportion of families in the ranks of top management team can degrade the performance of the company. Friction from the number of family members in the top management team has the potential to create discord itself so that family members can reduce the performance of the company. 4.3. Performance Differences
Between Firm Types Table 7 shows that the average performance of family firms is lower than non-family firms. The means of the Tobin's Q on family firm (F_ALL) is equal to 1.8173, still below the means of Tobin's Q on nonfamily firms (NF) is equal to 2.1894. Although the means Tobin's Q on family firm lower than non-family firms, but the results shows statistically no significant. Not all types of family firms have lower performance than non family firms. The means of Tobin’s Q on FOC type (4.543) is higher than means of Tobin's Q on nonfamily firm types (3,166). While the company types of FC and FM are two types of firm that have lowest performance across all types. An average, type FC firm have Tobin's Q is equal to 1.199 and type FM firm slightly above, it is equal to 1.300. The results between the across firm type with independent t-test showed that the means of Tobin's Q on FCM, FC and FM types is no different than the means of Tobin's Q on another types of company. Statistically significant difference in performance of the company only occurs across firms involving family members on ownership (FOCM, FOC, FOM and FO).
Table 7 Performance differences between firm types
Firm Types NF FOCM FOC FOM FO FCM FC
Average Performance
2,1894 1,4669 2,3302 1,4788 2,6121 1,5536 1,2301
F ALL 1,8173 -1,363 (0,174)
FOCM 1,4669 -2,766 (0,006)*
FOC 2,3302 0,269 (0,788)
1,406 (0,168)
FOM 1,4788 -2,544 (0,012)*
0,57 (0,955)
-1,184 (0,241)
FO 2,6121 0,823 (0,412)
1,926 (0,062)*
0,338 (0,737)
1,880 (0,068)*
FCM 1,5536 -1,174 (0,243)
0,277 (0,782)
-0,927 (0,358)
0,205 (0,838)
-1,556 (0,209)
FC 1,2301 -1,033 (0,304)
-0,505 (0,615)
-0,770 (0,446)
-0,693 (0,494)
-0,972 (0,337)
-0,490 (0,628)
FM 1,7409 -0,807 (0,421)
0,799 (0,427)
-0,681 (499)
0,590 (0,558)
-1,015 (0,315)
0,325 (0,747)
Description: FC : Family Commissioner FCM : Family Commissioner-Management FM : Family Management FO : Family Ownership FOC : Family Ownership-Commissioner FOCM : Family Ownership-Commissioner-Management NF : Non Family Firm F ALL : All of family firm types (FC, FCM, FM, FO, FOC., FOCM, FM)
The means Tobin's Q type FOCM company and FOM are lower than the average Tobin's Q of nonfamily firms. While type FO and FOC companies have better performance than non-family firms, but this difference is not significant. It could be argued that the strong dominance of the owner's family by putting family members on the board of directors (type FOM) or the owner's family who put family members on the board of directors and commissioners (FOCM) had lower performance of the company. Type of FOCM and FOM has a high potential to expropriate to minority owners. According to Young et al (2008), expropriation to minority owners can occurs when family put
members of family on the key positions of firm without consider of their competences. There is interesting to be delivered from this study. When the family is not active in direction or commissioner, it has a positive impact on the market performance of the company. The performance difference was seen between Tobin's Q of firm type (FO) with the type of company FOCM and FOM. Although firm (FO) has the potential to increase agency problem I, however this type have a better performance compared to company FOCM and FOM, which could increase agency problem II. In the case of companies in Indonesia, Agency
problem II conflict have a higher cost than the agency problem I. These findings are contrary with Allouce et al. (2009) and Maury (2006) at the family firm in Western Europe. Allouce et al. (2009) proved that the family as the primary owners and family members that are involved in the managerial position or directors (strong control) have higher performance than companies that do not put family members in top manager or directors (weak control). Maury (2006) showed that companies that involve the active participation of the families have higher profitability than non-family firms but not the passive role of the family that have an impact on profitability. Although contrary to the findings of Maury (2006) and Allouce et al (2009), but these results support the findings from Mannarino et al. (2011) which examines the role of the management team of the company's family in Italy. Mannarino et al. (2011) proved that family firms are not more productive when managed by their families member rather than be managed by professionals. It also expressed by Bart et al (2005) which proved that the management of the owner is not more productive than non-family management. This happens because the outside manager has management oversight more effective than family. The differences are also due to differences between family management expertise with professional management. In general it can be said that the performance differences between family firms with non-family firms is not determined solely on the ownership structure, but also determined how the role of family members in the company. Results of this study support the idea Villalonga and Amit (2006) which states that the family firm performance affected the interaction between ownership, control and management of
the family. The combination between ownership control families, commissioners and directors of the company producing the performance differences. 5. Conclusions and Suggestions This study provides evidence that family firm performance is better or worse than non-family firms depends not only on the components of family ownership, but also depends on how the control system or component attachment to the family in the company. Internal mechanisms of corporate governance affect family firm value. This study also proves that the agency conflict between owners of families with non-family owners have a more several impact than the agency conflict between owners of a family with the manager. The more active involvement of the family in the board of commissioners and board of directors led to even more potential agency conflict between owners of families with non-family owners. Expropriation family owners (majority) to the non-family owners (minority) depend on the placement of family members in key positions of the company (the commissioners and/or directors). Using independent t-test in this study isn’t considered other variables as a control to influence of firm value. Future studies are advised to use regression analysis as a means of testing the effect of ownership, commissioners and directors of the family on the company's performance. Future studies also suggested to include components founder because Villalonga and Amit (2006) prove that the cost of agency problems I higher or lower than the cost of agency problem II depends role the company's founder.
G., 2009. The Iniquitous Influence of Family Ownership Structures on Corporate Performance. The Journal of Global Business Issues 3, Issues 1, 41-48.
Allouche, J., Amann, B., Jaussaud, J.,
Kurashina, T., 2008. Impact Family Control on The Performance and Financial Caracteristics of Family Versus Nonfamily Businesses in Japan: A Matched-Pair Investigation. Family Business Review 21: 315-329
Anderson, R. Reeb, D., 2003. Founding
family Ownership and Performance. Evidence From The S& P 500. Journal of Finance 58, 1301–1327.
Andres, C. 2008. Large Shareholders
and Firm Performance-An Empirical Examination of Founding-Family Ownership. Journal of Corporate Finance 14, 431-445
Arosa, B., Iturralde, T., Maseda, A.,
2010, Ownership Structure and Firm Performance in Non-Listed Firms: Evidence From Spain, Journal of Family Business Strategy 1, 88-96.
Barth, E., Gulbrandsen, T., Schonea,
P., 2005. Family Ownership and Productivity: The Role of Owner-Management. Journal of Corporate Finance 11, 107–127
Bennedsen, M., Nielsen, K., Perez-
Gonzalez, F., Wolfenzon, D., 2007. Inside the Family Firm: The Role of Families in Succession Decisions
and Performance. Quantitative Journal
Economics 122, 647–691. Bennedsen, M., Nielsen, Kasper, M.,
2010. Incentive and Entrenchment Effects in European Ownership, Journal of Banking and Finance 34: 2212-2229.
Bertland, M., Schoar, A., 2006. The role
of Family in Family Firms. Journal of Economics Perspective 20, 73–96.
Bunkanwanicha, P. Gupta, J. Rokhim,
R., 2008, Debt and entrenchment: Evidence from Thailand and Indonesia, European Journal of Operational Research 185, 1578–1595
Chrisman, James J., Chua, Jess H.,
Sharma, P., 2003. Current Trends and Future Directions in Family Business Management Studies: Toward a Theory of The Family Firm. Coleman White Paper Series.
Claessens, S., Djankov, S., Lang,
L.P.H., 2000. The Separation of Ownership and Control in East Asian Corporations. Journal of Financial Economics 58, 81–112.
Dyer Jr, W. Gibb, 2010. Are You the
Right Type of Family Business?, Organizational Dynamics 39 No. 3, 269-278.
Faccio, M., Lang, L., 2002. The
Ultimate Ownership of Western European Corporations. Journal of Financial Economics 65, 365– 395.
García-Castro R.; Casasola, M.J.,
2011. A Set-Theoretic Analysis of The Components of Family Involvement in Publicly Listed and Major Unlisted Firms, Journal of
Family Control, Board Independence and Earnings Management: Evidence Based on Hong Kong Firms. Journal Accounting Public Policy 28. 281-300
Jensen, M.C. and Meckling, W., 1976.
Theory of The Firm: Managerial Behavior, Agency Cost and Ownership Structure. Journal of Financial Economic 3, 305-360.
Kim, Kenneth A., Kitsabunnarat, P.,
and Nofsinger, J. R., 2007, Large Shareholders, Board Independence, and Minority Shareholder Rights: Evidence from Europe, Journal of Corporate Finance 13, 859-880
La Porta, R., Lopez De Silanes, f.,
Shleifer, A., 1999. Corporate Ownership Araund The World. Journal of Finance 54, 471-517
Lukviarman, N., 2004, Ownership
Structure and Firm Performance: The Case of Indonesia, DBA Thesis, Curtin University of Technology (available on-line through the Australian Digital Thesis/ADT)
Mannarino, L., Pupo, Valeria and
Ricotta, F. 2011, Family Involvement in Management and Firm Performance: Evidence from Italy. University of Calabria, Department of Economics and Statistics, Working Paper.
Maury, B., 2006. Family Ownership and
Firm Performance: Empirical Evidence From Western European
corporations. Journal of Corporate Finance 12, 321–341.
McConnaughy, D., Walker, M.,
Henderson, G., Chandra, M., 1998. Founding family Controlled Firms: Efficiency and Value. Review of Financial Economics 7, 1–19.
Minichilli, A., Cobetta, F., & MacMillan,
I. C., 2010. Top Management Teams in Family-Controlled Companies: Familiness, Faultlines, and Their Impact on Financial Performance. Journal of Management Studies 47: 2
Perez-Gonzalez, F., 2006. Inherited
Control and Firm Performance. American Economic Review 96, 1559–1588.
Sharma, P. 2002. Stakeholder Mapping
Technique: Toward the Development of a Family Firm Typology. Paper presented at the 62nd meeting of the Academy of Management, Denver, August. (available on-line through https://www.wlu.ca)
Sharma, P. 2004. An Overview of the
Field of Family Business Studies: Current Status and Directions for The Future. Family Business Review, Vol XVII, No 1
Siregar, Veronica S and Utama, S.,
2008. Type of Earnings Management and The Effect of Ownership Structure, Firm Size, and Corporate-Governance Practices: Evidence from Indonesia, The International Journal of Accounting 43, 1–27
Sraer, D., Thesmar, D., 2007.
Performance and Behavior of Family Firms: Evidence From the
French Stock Market. J. Europ. Econ. Assoc. 5, 709–751.
Tabalujan, Beny S., 2002. Family
Capitalism and Corporate Governance of Family-Controlled Listed Companies in Indonesia. University of New South Wales Law Journal 25 (2).
Villalonga, B., and Amit, R., 2006. How
Do Family Ownership, Control and Management Affect Firm Value? Journal of Financial Economics. 80, 385–417.
Ward John. 2002. The Role of The
Board in Family Business Strategy. Family Business Know-How.
Westhead, P., and Cowling, M. 1998.
Family firm Research: The Need for Methodology rethink. Entrepreneurship Theory and Practice, Fall, 31-56.
Young, Michael N., Peng, Mike W.,
Ahlstrom D., Bruton, Garry D., dan Jiang Y., 2008, Review Paper. Corporate Governance in Emerging Economies: A Riview of Principal-Principal Perspective, Journal of Management Studies 45:1 January.