1
Family Matters in a Meritocracy: Networks, Civil
Service Exams, and Officialdom in the Joseon Dynasty
Sok Chul Hong† Christopher Paik‡ Yangkeun Yun§
July 2019
Abstract
How do family networks influence social mobility in a meritocracy? Climbing the ladder
of success may be fraught with nepotism and corruption, especially in monarchies where
connections can trump talent. A merit-based selection of government officials in such
context may serve as a remedy to curb these negative outcomes. In this paper, we
investigate the effects of family networks on successfully obtaining official positions
during the Joseon Dynasty from 1392 to 1897 CE. The Korean kingdom implemented
literary examinations intended to fill central official positions based on merit. Its
comprehensive records on family ties, exam results and official positions span over 503
years, longer than any other such data under a single dynasty in the world to our
knowledge, and offer researchers a unique opportunity to investigate the efficacy of merit-
based selections of political elites under a monarchy. We use an individually linked
database of successful candidates and their family members from the literary examination
rosters and official position information. We find that those from more connected
predecessors in the network had significantly higher likelihoods of obtaining high-level
rank positions after passing the exams, even when conditioning on age and performance
at the examination. In light of the persistent family network influence, we evaluate the
efficacy of meritocratic selection of political elites under a monarchy, and changing
relevance of family networks as reflective of state performance over time.
This study was financially supported by Center for Distributive Justice at Seoul National University (Grant Number:
0405-20180014) † Professor, Department of Economics, Seoul National University; [email protected] ‡ Assistant Professor, Division of Social Science, New York University Abu Dhabi; [email protected] § Ph.D. student, Department of Economics, University of Connecticut; [email protected]
2
1. Introduction
Throughout history, monarchies have existed as common forms of governance. Hierarchical
order and class divisions have often characterized their structures, in which social mobility was
limited and representation in government was reserved for only the powerful few with connections.
In order to combat nepotism and corruption from within, the rulers sought out ways to select
government officials based on merit. An examination system that screened talented and capable
candidates would, in theory, serve as a remedy to curb these negative outcomes.
Similar to the civil service examination system in China, the Joseon Dynasty (Korean
dynastic kingdom, 1392-1897 CE) was a centralized bureaucratic state which gave opportunities
for officialdom to those who succeeded in Joseon’s merit-based examination. Those who passed
gwageo, the Civil Service Examination, formed the ruling class. The examination system was the
most significant means of recruiting officials for major central and provincial government posts
(Wagner, 1974). Among the different types of exams under gwageo, mungwa (the literary
examination) in particular was the most selective and accordingly prized as ensuring the elite status
in society.1
Did the merit-based selection process actually work? Family connections, particularly in the
form of prestigious lineage of mungwa passers, could strongly influence the career paths of elites.
According to Kyŏngguk taejŏn (the National Code) and its subsequent laws, a variety of promotion
standards were applied (Kim, 2017). The assignment of official position was apparently based on
not only the competence of specific candidates but also recommendations from other officials as
well as the king, particularly for high-level officials. In other words, the road to eventual
officialdom was likely met with subjective factors such as family connections and king’s favors,
in addition to scholarly ability (Won, 2007; Kim, 2017). Passing mungwa thus might not have been
a sufficient condition to obtain a high-ranking position in the court.
In this paper, we investigate the effects of family networks in obtaining official positions
1 Gwageo were composed of four categories: (1) mungwa (literary examination); (2) mugwa (military examination);
(3) japgwa (technical examination); and (4) saengwon jinsa (classics and literary licentiate examination). We focus
on those who succeeded in mungwa because they represented the ruling class of Joseon as major state officials.
Successful candidates of saengwon jinsa became qualified to enroll at Sungkyunkwan, the National Confucian
Academy, which trained students for mungwa. They could alternatively be appointed as ninth-ranked junior officials,
which were the lowest positions among the court officials. Those who passed mugwa (military examination) or japgwa
(technical examination) were regarded as lower-class officials. Table A1 in Appendix A provides the official ranking
system during the Joseon Dynasty.
3
during the Joseon Dynasty. We use an individually linked database of successful mungwa passers
and their family members from both mungwa rosters and appointment records of government
officials. We find that those who are central, i.e. having more connected predecessors in the
network, had significantly higher likelihoods of getting high-level rank positions after passing the
exams, even when conditioning on age and performance at the examination. Specifically, our
centrality score for each successful mungwa passer considers whether the ancestors themselves
also passed mungwa. Because only the successful candidates appeared on the exam rosters, the
ancestors had records of their own only if they passed the exam. The successful candidates with
more ancestors who passed the exams themselves thus would have more connections, and become
central by definition. We capture this score by using the eigenvector centrality measure, which
accounts for the number of each candidate’s ties as well as the connections of the ties themselves
(Bonacich, 1972, 1987; Jackson, 2010). The measure allows one to capture how those connected
to the candidate are themselves influential, and is often used to assess prestige and popularity (Cruz
et al. 2017; Jackson, 2010). Under the Confucian tradition that dominated the morals of society,
scholarly achievement was of utmost importance for the elites in Korea. In our case, a higher score
would indicate a more academic, and thus prestigious and influential, family connection.
Throughout five centuries of rule in which the merit-based exam was in effect, we find that
family connection was a key factor in selection into officialdom. The estimates from our preferred
specifications, which controls for family clan, king in rule, pre-exam social status, exam type,
year-of-birth, and residence fixed effects among other, suggest that one standard deviation increase
in the natural log of eigenvector centrality is associated with approximately a 4 percent point
increase in the likelihood of being high-level officials.2 We find this result for the positions that
are higher than or equal to the upper senior third rank, the upper echelon of political elites in Joseon.
The case of Joseon is of interest for its commonalities with other monarchies, but also for its
unique context and comprehensive historical records. Nepotism among political elites likely exists
in any governance structure, and arguably remains more prevalent in non-democratic settings
where political representation and accountability are limited. Throughout history, monarchies
represented the most common types of government. They adopted and institutionalized
mechanisms to curb the influence of family connections and sought to recruit talent, while still
2 The probability that a candidate reached high-level officials was 56% in our sample.
4
maintaining strict social hierarchies. One of these institutional inventions was the merit-based
selection of government officials. First found in Chinese dynasties, other Asian countries including
Korea and Vietnam adopted similar practices. In a broader context, exam-based civil servant
selections were also later found in the British government and other European states, as well as
the United States.
Among the monarchies that adopted the examination system, the Joseon dynasty stands out
as an invaluable case study offering comprehensive records of exam passers, their eventual career
paths as well as family connections spanning over five centuries. For example, in addition to
information on the history of passing exams and the ranks of official positions the ancestors had
obtained, the data allow us to analyze family networks through both marriages as well as patrilineal
connections.3 Marriage is an important underlying mechanism that influences social status, as it
plays a key role in preserving status-relevant family groups (Clark, 2014; Shiue, 2016). We have
information on the marriage relations of each candidate who passed mungwa, with profile
information of the candidate’s maternal grandfather and father-in-law. To our knowledge, these
records comprise the world’s longest continual data of such kind under single dynasty. Our paper
is also the first study examining the eventual political ascension of successful examination
candidates, and the importance of family networks that could compromise the principles of
meritocracy.4
Our work relates to several strands of the literature. First, this paper contributes to the
literature on the institutional selection process of political candidates. Dal Bo et al. (2017) for
example show that democracy can produce competent and socially representative politicians,
while Cruz et al. (2017) document that family connections still matter for electoral outcomes in a
democracy, as they facilitate relationships of political exchange. Several works in the literature
also look at the authoritarian context to find that official appointment is heavily determined by
power hierarchies and loyalty concerns; the leaders tend to hire mediocre and loyal, non-
3 By mandate, each mungwa taker filled out information on his father, paternal grandfather and great-grandfather, as
well as information on the maternal grandfather and father-in-law as well as foster father, if any. Surviving records
only have these information on the candidates who passed the exam.
4 Even though many authors studying the Chinese contexts explore the civil examination system, to our best
knowledge, no research analyzes entry into office for the successful candidates. See, for example, Kracke (1947), Ho
(1962), Hymes (1986), Jiang and Kung (2016), Bai and Jia (2016).
5
threatening candidates for positions in the bureaucracy (Zakharov 2016; Egorov and Sonin 2011;
Reuter and Robertson 2012). Our paper also focuses on political candidates and outcomes, but
expands the scope of the literature by looking at the monarchy system commonly found in history
as opposed to the contemporary democracy context.
Our paper also relates to the literature on social mobility and its long-term implications. Some
of the existing research find significant inter-generational persistence in wealth (Clark and
Cummins, 2015), education (Clark and Cummins, 2014; Shiue, 2016), as well as exam success
(Wagner, 1974; Hao and Clark, 2012; Jiang and Kung, 2016) due to predecessors’ social class
standings.5 Our study provides further support for intergenerational persistence of socio-economic
status, by showing that having connected predecessors indeed have an important role in obtaining
the high-level court positions for the next generation, even in the presence of meritocratic
institutions (i.e. mungwa).
Finally, our paper contributes to studies on Korean political economy and economic history
which, despite offering important insights with rich context and data, have been relatively
underexplored in the broader literature. Taking a full advantage of the rich set of available
historical records, we combine each candidate’s exam ranking, family connections and eventual
ascension to officialdom for 4,227 individuals from 1396 to 1894, and cover essentially the entirety
of the Joseon dynasty period (1392-1897). This exercise provides us with a complex narrative on
how meritocratic institutions worked to increase social mobility under a monarchy.
We organize this paper as follows. In Section 2, we summarize the historical background of
the examination system and official rank positions in the court during the Joseon Dynasty. In
Section 3, we introduce our data sources and key variables. Section 4 presents the results of
baseline and alternative specifications. We discuss how do estimates vary in relation to the extent
of family networks increasing over time in Section 5. Section 6 concludes.
5 Wagner (1974) points out that successful candidates of mungwa were released from about 750 family clans, with the
21 leading clans producing over 40% while 560 extremely minor clans producing only 10%. This may indicate that
those who came from major family clans might have been in a favorable position to pass the grueling civil examination.
However, there is a debate about whether the family clan was a group that had a single identity and cohesiveness. For
instance, Jeonju Yi clan which produced 870 successful candidates (5.74% of total) was a complex group of 123
fractions divided in the late Joseon Dynasty (Baek, 2017). Thus, we need to inspect more narrow unit by focusing on
the micro-level relationships among individuals, not on how certain paternal blood groups produced political elites.
6
2. Historical Background
2.1. Literary Examination
Passing mungwa brought personal glory and honor to the family, as it was the official gateway
to public officialdom in the Joseon era.6 However, passing mungwa was as difficult as finding a
needle in the haystack. It was so competitive that it took 10-15 years on average to pass the exam
and the average passing age was 34.3.7 Men who entered government service by passing mungwa
thus could be expected to serve at important posts in principal departments (Lee, 1994).
Mungwa was divided into regular exams and irregular exams. Siknyeonsi, the regular exam,
was triennial, and the irregular exams included jeunggwangsi (augmented exam), byulsi (special
exam), alsungsi (memorial exam of royal visitation to the Confucian hall), and so on. Though
jeunggwangsi was one of the irregular exams, we regard it as a regular exam from now on since it
was more similar to the triennial exam.8
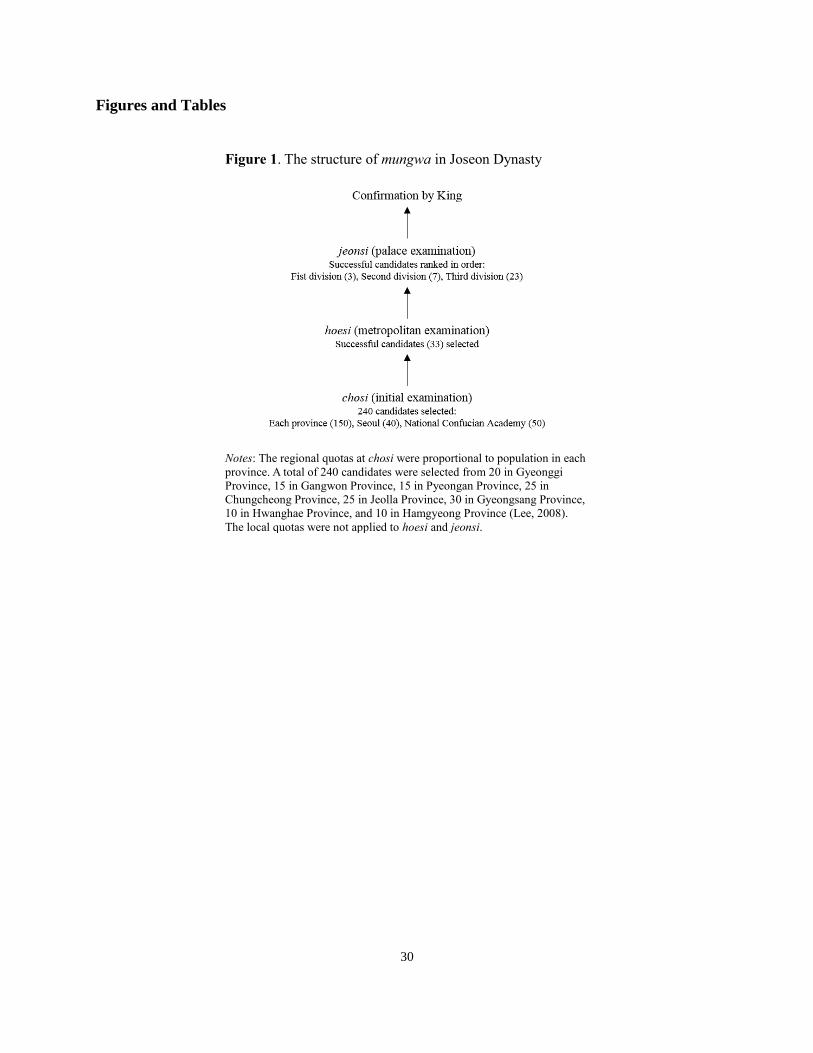
Figure 1 summarizes the structure and selection process of mungwa. 9 The regular
examination was implemented in the order of chosi (initial examination), hoesi (metropolitan
examination), jeonsi (palace examination), and the confirmation by the king. Both chosi and hoesi
consisted of chojang (first-round test), jungjang (second-round test) and jongjang (final test).
These exams were meant to mainly test the applicant’s ability in writing composition and
knowledge of the Confucian texts based on the Five Classics and the Four Books (Lee, 2003). A
total of 240 successful candidates, including those from provinces (150 in total), the capital (40
from Hanyang, presently Seoul), and Sungkyunkwan (the National Confucian Academy) (50) were
chosen in chosi, and they assembled in the capital for hoesi (Lee, 2008). Only 33 successful
6 Eumseo were positions specifically reserved for the merit subjects who did not have to take mungwa. However,
these were also positions with limited opportunities for promotions and were generally considered inferior to those
obtained through mungwa (Paik, 2014).
7 This indicates that studying for the literary exam might have been prohibitively costly since the average lifespan
was estimated only 40 during the Joseon Dynasty (Paik, 2014).
8 Both siknyeonsi and jeunggwansi consisted of the three separate examinations and selected top 33 candidates. Since
the regular exams and irregular exams have different characteristics regarding the process and purpose of the test, we
control for different types of exams in our empirical analysis.
9 Irregular exams varied in their structures and processes, thus we only provide those of regular ones.
7
candidates were selected to compete in jeonsi to determine the respective rankings. At jeonsi,
candidates wrote essays on a subject suggested by the king, and their administrative and political
competence were evaluated accordingly. Both the examiners and the king determined the rankings
of these final candidates (Won, 2019).10
[Figure 1 Here]
2.2. Official Position Assignment and Promotion
Government officials in the Joseon Dynasty consisted of nine ranks (see Table A1 of the
Appendix). Each rank was divided into jeong (senior) and jong (junior), and the posts above the
sixth rank junior official were subdivided into sanggye (upper) and hagye (lower), for a total of 30
ranks. High-ranking officials above or equal to the third rank senior official title were collectively
called dangsanggwan (palace-ascendable officials). The remainders, called danghagwan (palace-
downward officials), comprised chamsanggwan (mid-level officials) who were higher than or
equal to the sixth rank junior officials, and chamhagwan (low-level officials) who were lower than
the sixth rank junior officials.
Dangsanggwan officials were the ministers authorized to participate in discussions or parties
with the king at palace halls (Yi, 2015). They were given important rights to vote on the
administration, to recommend other officials, and to direct the military (Cha, 2002). On the other
hand, chamsanggwan officials were in charge of the central administration as well as local
government and implementation of duties, with possibilities of promotion to dangsanggwan
positions (Cha, 2012). However, promotions from the low-level to the mid-level, and from the
mid-level to the high-level were difficult to achieve because of the entailed rigorous screening
processes (Lee, 1994).
Table 1 shows that the initial placement of successful candidates for the court was based on
the official status of the candidates (if any) and the final grades in jeonsi. According to Kyŏngguk
Taejŏn (the National Code), the candidates at the time of passing the exam fit into one of the
10 The ranking by examiners were sometimes changed by the king. For example, Sung Jin who passed jeonsi as a
third-place in 1465 was nominated as a first-place since King Sejo was highly impressed after reading his essay. In
theory, the exam grading was done anonymously; however, there are debates among historians on whether the
anonymity rule was always implemented or not.
8
following categories: saengwon (classics licentiate), jinsa (literary licentiate), yuhak (Confucian
student); and those already holding official titles. Candidates placed in gapgwa (first-division)
were able to become court officials immediately.11 On the other hand, those placed in eulgwa
(second-division) and byunggwa (third-division) were not guaranteed actual posts, and only
received official ranks; they were assigned as temporary officials until positions became available
(Won, 2007). Therefore, there was a huge gap in the career path of civil servants according to
whether being placed in gapgwa in jeonsi or not. Similarly, those already holding official titles
acquired immediate promotion, but the opportunity also differed by the final grade in jeonsi.12
[Table 1 Here]
3. Prestige: Inheritance of Political Power
We apply and extend a simple model of Dal Bó et al. (2009). Let 𝑦𝑖 be a successful candidate
𝑖 ’s political power and 𝑘𝑖 be the amount of political capital available to him. Suppose that
successful candidate 𝑖 has a predecessor (hereafter referred to as 𝑖’s father), whose amount of
political power and capital are defined as 𝑦𝑖,1 and 𝑘𝑖,1, respectively. Assume that candidate 𝑖’s
political capital 𝑘𝑖 is a linear function of father’s political capital and political power. That is, the
political capital of the candidate 𝑖 is determined as follows
𝑘𝑖 = 𝛼𝑘𝑖,1 + 𝛽𝑦𝑖,1
where 𝛼 and 𝛽 are scalars. As in Dal Bó et al. (2009), we define political capital as any personal
characteristic that is inherited within family and influences on political power, from raw talent and
overall competence to human capital to name recognition.
We assume that candidate 𝑖’s political power depends on the political capital
𝑦𝑖 = 𝛾𝑘𝑖 + 𝑣𝑖
11 Jangwon (first-rank candidate) were appointed as the sixth rank junior officials, and the second- and third- rank
candidates (non-jangwon gapgwa candidates) were assigned as the seventh rank senior officials.
12 If mid-level officials passed mungwa, they were guaranteed to have promoted positions though they were not placed
in gapgwa in jeonsi (Won, 2007).
9
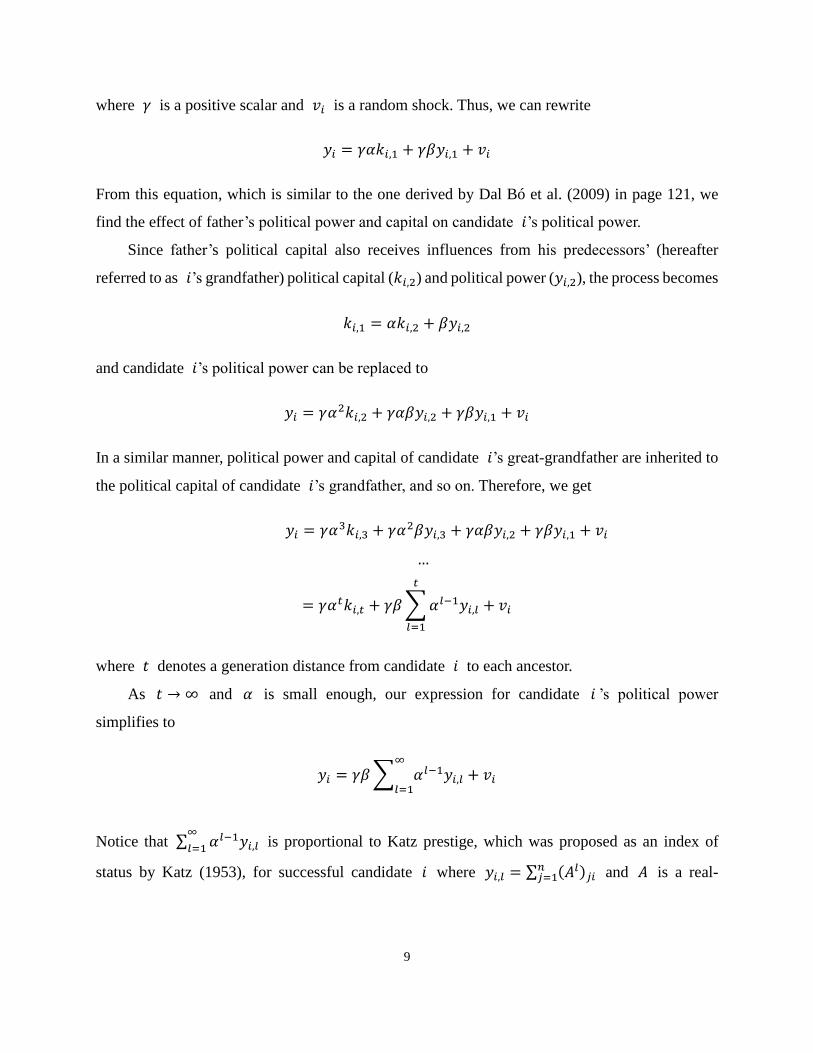
where 𝛾 is a positive scalar and 𝑣𝑖 is a random shock. Thus, we can rewrite
𝑦𝑖 = 𝛾𝛼𝑘𝑖,1 + 𝛾𝛽𝑦𝑖,1 + 𝑣𝑖
From this equation, which is similar to the one derived by Dal Bó et al. (2009) in page 121, we
find the effect of father’s political power and capital on candidate 𝑖’s political power.
Since father’s political capital also receives influences from his predecessors’ (hereafter
referred to as 𝑖’s grandfather) political capital (𝑘𝑖,2) and political power (𝑦𝑖,2), the process becomes
𝑘𝑖,1 = 𝛼𝑘𝑖,2 + 𝛽𝑦𝑖,2
and candidate 𝑖’s political power can be replaced to
𝑦𝑖 = 𝛾𝛼2𝑘𝑖,2 + 𝛾𝛼𝛽𝑦𝑖,2 + 𝛾𝛽𝑦𝑖,1 + 𝑣𝑖
In a similar manner, political power and capital of candidate 𝑖’s great-grandfather are inherited to
the political capital of candidate 𝑖’s grandfather, and so on. Therefore, we get
𝑦𝑖 = 𝛾𝛼3𝑘𝑖,3 + 𝛾𝛼2𝛽𝑦𝑖,3 + 𝛾𝛼𝛽𝑦𝑖,2 + 𝛾𝛽𝑦𝑖,1 + 𝑣𝑖
…
= 𝛾𝛼𝑡𝑘𝑖,𝑡 + 𝛾𝛽 ∑ 𝛼𝑙−1𝑦𝑖,𝑙
𝑡
𝑙=1
+ 𝑣𝑖
where 𝑡 denotes a generation distance from candidate 𝑖 to each ancestor.
As 𝑡 → ∞ and 𝛼 is small enough, our expression for candidate 𝑖 ’s political power
simplifies to
𝑦𝑖 = 𝛾𝛽 ∑ 𝛼𝑙−1𝑦𝑖,𝑙
∞
𝑙=1+ 𝑣𝑖
Notice that ∑ 𝛼𝑙−1𝑦𝑖,𝑙∞
𝑙=1 is proportional to Katz prestige, which was proposed as an index of
status by Katz (1953), for successful candidate 𝑖 where 𝑦𝑖,𝑙 = ∑ (𝐴𝑙)𝑗𝑖𝑛𝑗=1 and 𝐴 is a real-
10
valued 𝑛 × 𝑛 adjacency matrix representing the network constructed by family members. 13
Therefore, our conceptual framework predicts that successful candidates with higher Katz prestige
are in a better position to attain political power.
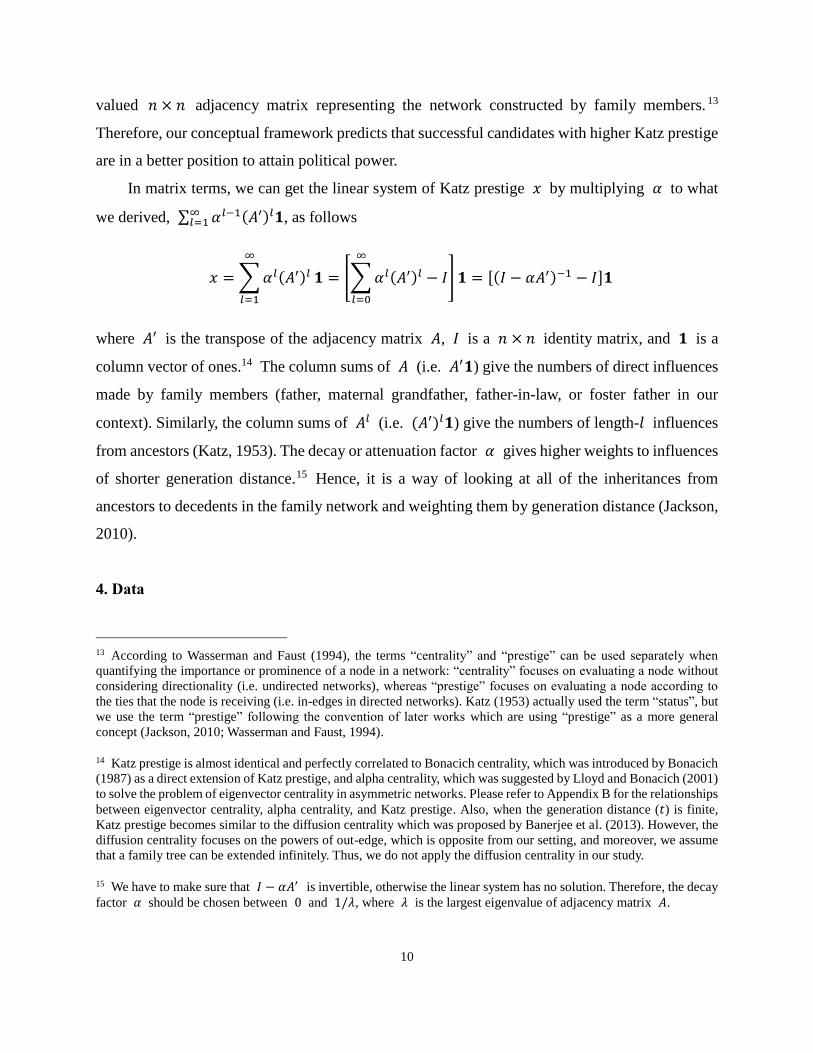
In matrix terms, we can get the linear system of Katz prestige 𝑥 by multiplying 𝛼 to what
we derived, ∑ 𝛼𝑙−1(𝐴′)𝑙𝟏∞𝑙=1 , as follows
𝑥 = ∑ 𝛼𝑙(𝐴′)𝑙
∞
𝑙=1
𝟏 = [∑ 𝛼𝑙(𝐴′)𝑙
∞
𝑙=0
− 𝐼] 𝟏 = [(𝐼 − 𝛼𝐴′)−1 − 𝐼]𝟏
where 𝐴′ is the transpose of the adjacency matrix 𝐴, 𝐼 is a 𝑛 × 𝑛 identity matrix, and 𝟏 is a
column vector of ones.14 The column sums of 𝐴 (i.e. 𝐴′𝟏) give the numbers of direct influences
made by family members (father, maternal grandfather, father-in-law, or foster father in our
context). Similarly, the column sums of 𝐴𝑙 (i.e. (𝐴′)𝑙𝟏) give the numbers of length-𝑙 influences
from ancestors (Katz, 1953). The decay or attenuation factor 𝛼 gives higher weights to influences
of shorter generation distance.15 Hence, it is a way of looking at all of the inheritances from
ancestors to decedents in the family network and weighting them by generation distance (Jackson,
2010).
4. Data
13 According to Wasserman and Faust (1994), the terms “centrality” and “prestige” can be used separately when
quantifying the importance or prominence of a node in a network: “centrality” focuses on evaluating a node without
considering directionality (i.e. undirected networks), whereas “prestige” focuses on evaluating a node according to
the ties that the node is receiving (i.e. in-edges in directed networks). Katz (1953) actually used the term “status”, but
we use the term “prestige” following the convention of later works which are using “prestige” as a more general
concept (Jackson, 2010; Wasserman and Faust, 1994).
14 Katz prestige is almost identical and perfectly correlated to Bonacich centrality, which was introduced by Bonacich
(1987) as a direct extension of Katz prestige, and alpha centrality, which was suggested by Lloyd and Bonacich (2001)
to solve the problem of eigenvector centrality in asymmetric networks. Please refer to Appendix B for the relationships
between eigenvector centrality, alpha centrality, and Katz prestige. Also, when the generation distance (𝑡) is finite,
Katz prestige becomes similar to the diffusion centrality which was proposed by Banerjee et al. (2013). However, the
diffusion centrality focuses on the powers of out-edge, which is opposite from our setting, and moreover, we assume
that a family tree can be extended infinitely. Thus, we do not apply the diffusion centrality in our study.
15 We have to make sure that 𝐼 − 𝛼𝐴′ is invertible, otherwise the linear system has no solution. Therefore, the decay
factor 𝛼 should be chosen between 0 and 1/𝜆, where 𝜆 is the largest eigenvalue of adjacency matrix 𝐴.
11
4.1. Sources
Our empirical analysis is based on data drawn from two sources. The first is Jae-Ok Lee’s
data that link individuals appearing in the Academy of Korean Studies (AKS)’s digitized mungwa
rosters (Lee, 2018).16 The mungwa bangmok, or literary examination rosters, from AKS contains
lists of all the successful candidates qualified for jeonsi taken at the palace over different time
periods and exams. These digitized rosters include the following information for each candidate:
name; post or title at the time of the examination; year of birth; ranking at jeonsi; father, paternal
grandfather and paternal great-grandfather, maternal grandfather, and father-in-law; family clan;
place of residence; and brief career highlights.17 Lee’s dataset links candidates with others based
on their ancestral lineages. There are 47,308 nodes (14,634 successful candidates and 32,674 their
family members) which altogether construct networks with 49,229 ties.18 Specifically, each node
is directly linked to another through four types of ties (father, foster father, maternal grandfather,
and father-in-law). In our network analysis, we also capture additional ties with other members of
extended families, as long as they passed mungwa and shared common ancestors. For example, a
candidate’s uncle would be in the network if he passed the exam; we could then match his
grandfather as the same as the candidate’s great-grandfather.
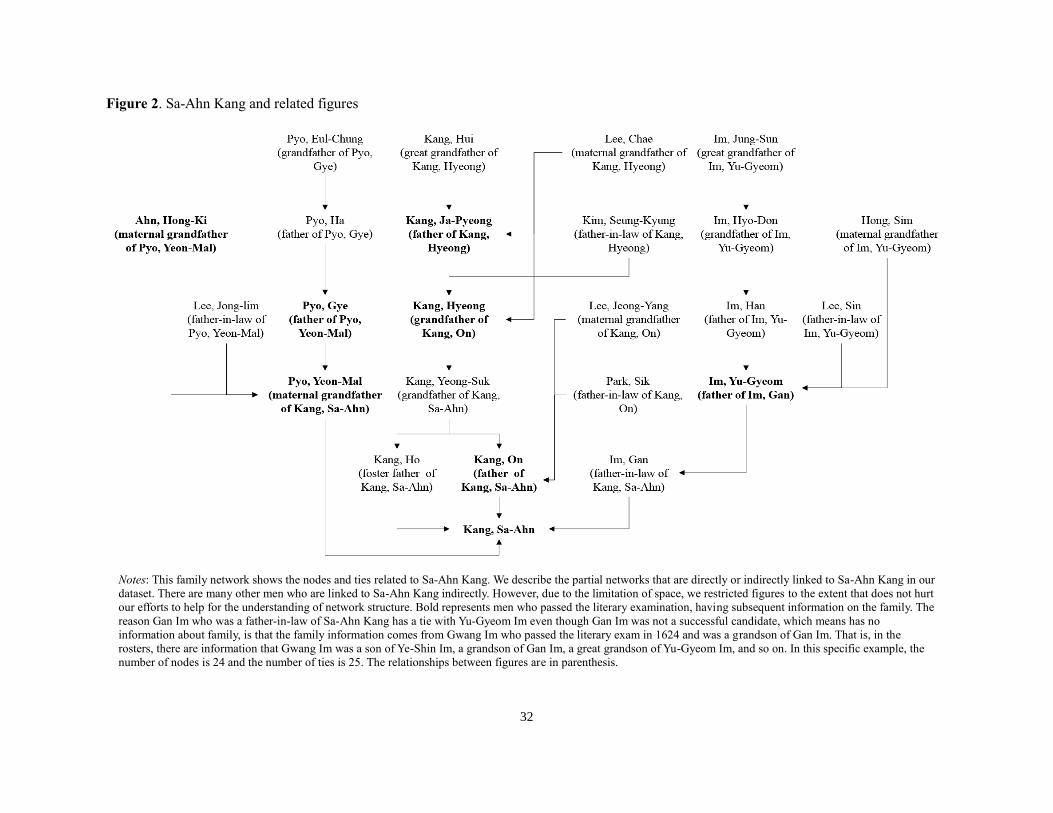
Figure 2 describes the partial networks that are directly or indirectly linked to Sa-Ahn Kang,
16 Jae-Ok Lee is a research fellow at the Academy of Korean Studies in charge of the digitized mungwa records. His
data linking individuals based on family connections are available at http://dh.aks.ac.kr/~sonamu5/wiki.
17 Each exam taker had to fill out the application form requesting information on the three paternal ancestors, maternal
grandfather, and father-in-law to enroll the exam. From these forms, we have information on the candidates’ family
backgrounds at the time of the examination, and before they started their careers as government officials. The
construction of the database initially started with the “Civil Examination Rosters Project (Munkwa Project)” by
Edward W. Wagner and Jun-ho Song (Song, 2010). They were dedicated to digitizing mungwa rosters for about 40
years. The Academy of Korean Studies has since expanded the data and made them available to the public after taking
over the project (Wagner, 1974; Lee, 2018). The mungwa database is available at the Academy of Korean Studies
(AKS)’ Historical Figures Comprehensive Information System (http://people.aks.ac.kr/index.aks).
18 The adjacency matrix 𝐴 of our family network (graph), with respect to all nodes, becomes the 47,308 × 47,308
zero-one matrix (i.e. unweighted graph) with its (𝑖, 𝑗)th entry,
𝑎𝑖𝑗 = {1, if 𝑖 contributes to 𝑗′s status0, otherwise
We check the robustness of weighted graph in the analysis of Table 3.
12
who passed mungwa in 1542, in the dataset.19 For example, Kang’s biological father was On Kang,
foster father was Ho Kang, grandfather was Yeong-Suk Kang, great grandfather was Hyeong Kang,
maternal grandfather was Sik Park, and father-in-law was Gan Im. The names in bold represent
those who passed mungwa themselves.
[Figure 2 Here]
Mungwa bangmok provides only limited information about the official positions of successful
candidates after they pass mungwa. The rosters record only one of each successful candidate’s
official positions of during one’s entire career. Thus, it is not possible to identify whether the
recorded positions in mungwa bangmok are each successful candidate’s highest position.
Furthermore, from the middle of the 18th century onward, records on candidates’ official positions
are missing entirely altogether. To bridge this gap, we complement the information for officialdom
by using a document containing a list of officials, titled Cheongsungo, or the Reference for the
Uncorrupted Selection for High Officials. The document contains information on over 40,000
officials and is the most comprehensive data of all over the Joseon Dynasty. 20 We match
individuals who appear on this list to those on Mungwa bangmok to investigate who was assigned
which position after they passed the exam.21 Of the 14,638 successful candidates who passed
mungwa during the dynasty, 5,738 officials are matched with those on the official list.22
19 Kang was initially placed in the ninth rank senior position, and later reached the third rank lower senior position.
There are many other men who are linked to Sa-Ahn Kang indirectly; given the space constraint, we only present the
linkages directly coming from Kang’s closest ancestors.
20 The Academy of Korean Studies provides the digitized database. There are 196 positions and we can identify 120
positions’ official ranks from the junior ninth rank to the first senior upper, altogether comprising 30 ranks as described
in Section 2.2.
21 There are 15,151 successful candidates in Mungwa bangmok. Among them, 503 successful candidates passed
mungwa more than once, so in total there are 14,638 unique individuals who passed the exam. Using the Universal
Content Identifier (UCI) system created by the Academy of Korean Studies to code each individual mentioned in
historical documents throughout the Dynasty, we exactly match individuals in Mungwa bangmok and Cheongsungo,
at the same time also checking Lee’s network data for any duplicate entries and identical names.
22 The remainders, which are not matched between two sources, include both those who never obtained official
positions after passing mungwa and those who obtained some positions but are missing in Cheongsungo. We use the
matched sample as our base dataset, but later check the results by including the unmatched sample as a robustness test
in Table 3 (NOT YET DECIDED TO INCLUDE THIS PART).
13
4.2. Variables
Our main dependent variable is an indicator equal to one if the successful candidate’s highest
official position was higher than or equal to the third rank upper senior position. As in Section 2.2,
this was the dividing rank between those classified low- and mid-levels vs. high-level (palace-
ascendable), the latter with authority to participate in discussions with the king at the palace halls
(see Table A1 in the Appendix). It was of paramount importance for the government officials in
the Joseon Dynasty to move from the mid-level to the high-level in order to obtain considerable
political power. Therefore, the indicator of dangsanggwan is the variable that captures political
power each candidate attained or not.
Graphing the full family networks of all the candidates in our dataset (47,308 nodes with
49,229 ties), we evaluate how centrally connected each individual is in his extended family
network. As discussed in Section 3, we use Katz prestige, which captures how well each individual
has influences from other important people, rather than simply considering the number of links
(Katz, 1953; Bonacich, 1972, 1987; Jackson, 2010).23 Using this measure, central individuals (or
nodes) are those with connections from other well-positioned predecessors (Katz, 1953; Bonacich,
1972, 1987; Jackson, 2010; Cruz et al., 2017). This is our measure of family connection and is the
main variable of interest. In our network setting, well-positioned family members for an individual
candidate are those who themselves pass mungwa, have their own family members recorded in
mungwa bangmok and thus provide more ties for the candidate. The family members who appear
in mungwa bangmok not because they pass mungwa but because of family connection, on the other
hand, do not have additional family records in mungwa bangmok and thus contribute less to the
centrality of the candidate.
To measure the political prestige inherited within a family, we exploit the Katz prestige for
23 For the details on network centrality measures, please refer to Appendix B and Jackson (2010). There are various
centrality measures including degree centrality, betweenness centrality, closeness centrality, eigenvector centrality,
alpha centrality, and PageRank. Each captures theoretically different statistics. In a broad category, degree centrality,
eigenvector centrality, alpha centrality, Katz prestige, and PageRank centrality can be classified as degree-based
centrality measures, on the other hand, betweenness centrality and closeness centrality are shortest-path based
centrality measures (Freeman, 1972; Meghanathan, 2015). Since we focus on the power and prestige of predecessors
(ancestors) and their influences to decedents rather than the distance from decedents to predecessors, exploiting
degree-based centralities can be a right strategy in our context. We summarize the relationship between degree-based
centralities in Appendix B.
14
directed graphs as shown in Figure 2 instead of undirected ones.24 Each candidate’s success in the
court would have been influenced by his predecessors, rather than vice versa.25 A directed graph
thus emerges as the appropriate framework to work with, especially since we want to predict the
candidate’s eventual position assignment. Our prediction is that successful candidates with higher
Katz prestige would have been in a better position to become dangsanggwan (high-level officials)
as discussed in Section 3. Figure 3 shows the partial networks that correspond with Figure 2, in
which the size of the circle is proportional to the node’s Katz prestige.26 We set the decay factor,
𝛼, as 0.3 in our basic estimation and check other decay factors (0.1 and 0.5) in the robustness test.
[Figure 3 Here]
There are clear advantages to using the network measure for overall family connections,
rather than simply looking at whether ancestors passed mungwa or not. We are interested in
maximizing the use of family data from the exam records and measuring the level of prestige that
came with it in a quantifiable way. Using the network approach, we are not only able to identify
the ties that individuals have, but also weigh each connection based on the ties that these
connections themselves have. Furthermore, we are able to include multiple indirect connections
outside the family members on the candidate’s records, and assess their contribution to the
candidate’s overall level of connectedness. Finally, our key mechanism explaining the role of
family connection on political careers is the level of prestige perceived by others and its subsequent
24 The Katz prestige works for directed networks in a more novel way than in undirected networks (Jackson, 2010).
25 We exclude information on the official positions of ancestors in a candidate’s network, and instead calculate our
centrality measure based only on whether the ancestors pass mungwa or not. It is difficult to imagine that a successful
candidate may influence the likelihood of his father passing mungwa, especially given the age gap and the years of
preparation it takes. On the other hand, a father’s position in the court may indeed change during his lifetime by his
son passing mungwa. We also assume here that since a typical marriage in Joseon was customarily pre-arranged by
the parents rather then decided by the individual, the directed relationship with the father-in-law is also appropriate
(as opposed to an undirected relationship in which the individual at the time of taking the exam somehow may affect
the likelihood of the father-in-law’s success in the court).
26 Figure A1 in Appendix A describes the sample family network of our dataset. To simplify the graph, we restricted
the nodes that have more than or equal to 5 ties including in- and out-edges. In this network, the number of nodes is
2,729 (5.71% of total) and that of ties is 2,391 (4.86% of total), respectively. In the graph, it is easy to check that those
who achieved high-level rank positions (black dots) also tended have bigger circles (i.e. to be more centrally connected)
than those without (gray dots).
15
influence, rather than the cultural transmission of scholarly aptitude passed down the families.27
For capturing the prestige mechanism, we argue that the network-based centrality measure,
especially Katz prestige, is more suitable.
In addition to the family connection variable, we also consider the candidate’s age upon
passing hoesi (the metropolitan examination) and the final grade in jeonsi (the palace examination).
These two variables together control for the candidate’s overall level of competence, and also
reflect the level of “family human capital” that provided the know-how in passing the exam (Jiang
and Kung, 2016). First, the age upon passing hoesi reflects the applicants’ ability in writing
compositions and memorizing codified knowledge of the Confucian classics (Lee, 2003). The
more competent candidates would be more likely to pass the exam at a younger age (Marsh, 1961;
Jiang and Kung, 2016). Younger successful candidates, in turn, would have more opportunities to
go up in the ranks than their counterparts. Second, the final grade in jeonsi captures the knowledge
pertaining to statecraft beyond Confucian studies. This final exam tested on both administrative
and political expertise, and was meant to screen those for senior appointments in the government
(Jiang and Kung, 2016). The topic of the exam was open and allowed for highly subjective answers
from candidates, who often had to give their opinions on thorny issues that the king himself
confronted. As discussed in Section 2.2, the achievement of gapgwa in jeonsi was a starting point
to become an important court official in a later political career (Table 1).28 Table A2 in the
Appendix shows the summary statistics of the relevant variables.
5. Family Network, Prestige, and Political Power
27 In the Chinese civil service examination context, Jiang and Kung (2016) for example interpret the father’s
educational attainment as a proxy for a family’s human capital. However, looking at only the influences of immediate
ancestors is more close to degree centrality which is likely to fail to capture influences coming from longer distance.
We also test this measure in our regression analysis (Table 2).
28 To compare the final rankings of candidates in jeonsi across time and exam, Jiang and Kung (2016) standardize the
ranks as the following:
total number of passers in a given exam − actual ranking
total number of passers in a given exam
with the value ranging in [0,1). However, as shown in Table 1, the association between the final ranking in jeonsi and
official position assignment was step-wise rather than linear. Thus, we exploit the final “grade” (gapgwa, eulgwa, or
byunggwa) instead of ranking in this study.
16
5.1. Baseline Estimation
We start with simple graphical evidence of network effect in Figure 4. We compare the
proportions of those who achieved dangsanggwan positions by the final grade in jeonsi and across
Katz prestige. To construct this binned scatter plot, we first divide Katz prestige into ten equal
sized-groups (deciles) and then plot the means of the y-axis variable within each bin against the
mean value of Katz prestige (z-score) within each bin. The first thing we can find here is that
candidates placed in gapgwa generally show a higher proportion of dangsanggwan within the same
group of prestige. Also, candidates with higher Katz prestige were likely to enjoy a higher
likelihood of being dangsanggwan in all grades. Finally, and most importantly, even though
candidates started their career as eulgwa or byunggwa finalists, if they came from prestigious
family (i.e. high Katz prestige), they acquired a higher proportion of dangsanggwan in average
than those who were placed in gapgwa with low prestige. What we discover is that even after
scoring high on the final stage of mungwa and in spite of subsequent advantages in the initial
appointment, the eventual career ascension could have been reversed by family background.
[Figure 4 Here]
We now explore to quantify the impact of network connections on the successful candidate’s
likelihood of obtaining high-level official positions. To do so we estimate a linear probability
model of the following form:
𝑦𝑖 = 𝛼 + 𝛽𝑥𝑖 + 𝐶𝑖′Γ + 𝑍𝑖
′H + 𝜀𝑖 (1)
where 𝑦𝑖 is an indicator equal to one if individual 𝑖’s highest official position was higher than or
equal to the third rank upper senior position (i.e. belonging to the group of high-level rank officials).
𝑥𝑖 denotes the Katz prestige of individual 𝑖. 𝐶𝑖 is a vector of competence controls including
candidate 𝑖’s indicators of the final grade in jeonsi as well as the age upon passing hoesi. 𝑍𝑖 is a
vector of identifiers including candidate 𝑖’s family clan, king in rule at the time of the exam, pre-
exam status (Confucian student, classics licentiate, literary licentiate, or court officer), type of
exam (regular exams and irregular exams), year-of-birth, and place-of-residence before the exam.
Table 2 summarizes the baseline estimation results across different model specifications,
reporting the coefficients and their standard errors clustered by family clans. In each specification,
17
we control for the family clan, king in rule, pre-exam status, year-of-birth, and exam type fixed
effects. The estimation results strongly suggest that candidates with high prestige scores tend to
have higher probabilities of becoming high-level officials. The coefficient estimate reported in
column (1) for example indicates that one standard deviation increase in Katz prestige is associated
with approximately 6 percentage points increase in the likelihood of becoming dangsanggwan.
The estimates, reported in column (2), show that this effect is robust under within variations of the
final grade in jeonsi. We additively control for the age upon hoesi in column (3) confirming the
small decrease of the effect of prestige. Column (4), which is our preferred specification, adds the
residence fixed effects to rule out the varying spatial impact of regional characteristics, suggesting
that the likelihood of becoming dangsanggwan is higher by approximately 3.9 percent points with
one standard deviation increase in the prestige score. For our prestige measure, we standardize the
score so that one unit increase in the measure is equivalent to one standard deviation increase. In
other words, if one were to take the minimum prestige score in our sample and increase it to the
maximum (about an increase of 6.8 standard deviations), the likelihood of becoming
dangsanggwan would increase by 26.5 (= 6.8 × 3.9) percentage points. This magnitude amounts
to approximately 48% of the sample average of 0.55.
Overall, the estimated result is robust across different regression specifications: Katz prestige,
final grade in jeonsi, and age upon passing exam are highly associated with the probability of
becoming dangsanggwan positions. Further, we closely follow Jiang and Kung (2016)’s approach
in columns (5)-(7) by additionally controlling indicators for whether the ancestor passed mungwa.
The findings yield the robust results, in line with our main findings even when considering the
family’s immediate human capital.
[Table 2 Here]
5.2. Robustness Checks
We first check how our results vary across different cutoffs for our outcome variable. If
prestige inherited within family really mattered for eventual political power, the impact would
have been greater especially when obtaining a high-level position (third rank upper senior position
or higher) because of the political powers and privileges that it entailed. We test this hypothesis
with the same approach as the baseline estimation. Specifically, we use equation (1) but replace
the dependent variable with different cut-offs. We report the coefficient estimates for Katz prestige
18
in panel (a), estimates for the gapgwa dummy in panel (b), and estimates for the age upon passing
hoesi in panel (c) with their 95 percent confidence intervals in Figure 5.29
We observe several important trends emerging from Figure 5. First, the estimated coefficients
of Katz prestige are relatively stable across different cut-offs in rankings until US3 (third rank
upper senior position or higher). The results from this specification can be interpreted as a placebo
experiment to our baseline. Second, we find that from the third rank upper senior position cutoff,
the estimates rapidly deviate in magnitude. The effect on position assignment for low- and mid-
level positions appears systematically different from the high-level positions. Third, the
magnitudes in gapgwa dummy are quite consistent throughout different cutoffs but show a peak
in the third rank upper senior position cutoff. This may also indicate the importance of statecraft
competence and initial position at attaining power. Finally, we observe that the age effect becomes
larger in magnitude and statistically significant for higher-rank positions. Competence in the form
of learning codified knowledge and early success in exam appears to matter.
[Figure 5 Here]
In Table 3, we present a number of further tests that include 1) other regression models; 2)
other decay factors; and 3) different weighting for family link types. First, one may argue that the
linear probability model can produce inaccurate estimates (Johnston and Dinardo, 1997;
Wooldridge, 2002). Columns (2) and (3) show the results of logit and probit regressions,
respectively. To make them comparable using the probability scale, we report the average marginal
effects across the values of each variable. Compared to the baseline result in column (1), we find
that the results are strikingly similar. These show that our baseline linear probability estimation
does not cause bias.
Next, we use different decay factors of Katz prestige replacing the base value (𝛼 = 0.3) to
0.1 in column (4) and 0.5 in column (5) to identify whether a particular decay factor causes biases
to the baseline estimation.30 The estimated coefficients in columns (4) and (5), which are similar
29 As an example, when the dependent variable is the dummy for obtaining the fourth rank junior position or higher,
we plot the estimation results at J4 on the x-axis in each panel. The results plotted on the third rank upper senior
position or higher are marked as US3, and are the same as those in column (4) in Table 2.
30 Small values of decay factor (𝛼) heavily weight the local structure, whereas large values take more into account
the position of individuals in the structure as a whole (Bonacich, 1987).
19
to those of the baseline estimation, can rule out those concerns.
From column (6) to column (8), we test whether different types of family ties cause inaccurate
estimation. Specifically, in our network, there are four types of ties (father, foster father, maternal
grandfather, and father-in-law), but each type is based on different generation distances and
different characteristics. For instance, a link from father is the one-generation length and a link
from maternal grandfather is the two-generation length, but our network structure treats them equal.
In addition, the influence of father may be quite different from that of father-in-law or foster father.
Hence, we need to reflect the distinct features of ties by using different edge weights. In column
(6), we replace the edge weights of maternal grandfather from 1 to 1/2. Additionally, we replace
the edge weights of father-in-law from 1 to 1/2 in column (7) and the edge weights of foster father
from 1 to 0 in column (8), respectively. In other words, we give fewer weights to the influences
from maternal grandfather and father-in-law, and no weights from foster father.31 The results in
columns (6)-(8) dispel such worries.
[Table 3 Here]
6. Family Network and Political Stability
Our results suggest that successful candidates with higher prestige through family networks
had significantly higher likelihoods of getting high-level official positions after passing their
exams. In this section, we examine whether the changing importance of family networks and exam
performances in officialdom reflects macro trends in the political stability of the Joseon Dynasty.
If family connections mattered as much or even more than success in mungwa for high-level
official positions, one could argue that the Dynasty suffered from weakening principles of
meritocracy and plausibly poor state performance. One of the variables that we can compare
against key variables is the number of exiled officials over the 500 years across 26 kings (please
refer to Table A3 in Appendix A for the list of Joseon monarchs). Figure 6 shows the yearly number
31 The alternative weighting method 3 implies that the adjacency matrix 𝐴 is constructed with its (𝑖, 𝑗)th entry
f(x) = {
1, if 𝑖 contributes to 𝑗′s status as a father
1/2, if 𝑖 contributes to 𝑗′s status as a maternal grandfather
1/2, if 𝑖 contributes to 𝑗′s status as a fatherinlaw0, otherwise
20
of exiles (black dots) and political events including Literati Purges and Treason Cases (vertical
lines), using the data of exiled officials during the Dynasty from Hong et al. (2019). It is
straightforward that the number of exiles abruptly increased during politically unstable times. Thus,
we interpret this variable as a proxy for political instability in the state.
[Figure 6 Here]
In Figure 7, the x-axis represents the natural log of exile numbers per year during each king’s
reign. To construct the graph, we first residualize each key independent variable (Katz prestige,
gapgwa dummy, and passing age) with respect to exam year fixed effects to capture year-specific
common shocks impacting the entire candidates and secular trends in each variable.32 We then
take average separately by dangsanggwan group and non-dangsanggwan group, and check how
the differences between the two groups evolve against exile numbers by each king’s rule. The
dashed lines show the best linear fit. The coefficients show the estimated slope of the best-fit line
with p-values.
The results show that the difference in Katz prestige between those who achieved
dangsanggwan positions and those who did not become larger as the number of exiles increases.
However, panel (b) indicates that the performance in jeonsi becomes less important when political
environments are unstable. This circumstantial evidence suggests that political instability was the
highest when family connections mattered the most in explaining the discrepancy between high
and low-ranking officials rather than meritocratic merits.
[Figure 7 Here]
7. Conclusion
In this paper, we have explored Joseon’s civil service examination as an important institutional
32 Specifically, Katz prestige, gapgwa dummy, and passing age are projected on to dummies for passing year of
mungwa, i.e. we run the following regression:
𝑥𝑖 = 𝛼 + 𝛽𝑦𝑒𝑎𝑟𝑖 + 𝜀𝑖
We then compute the residual (𝑟𝑖) using the following equation:
𝑟𝑖 = 𝑥𝑖 − 𝑥�� = 𝑥𝑖 − ��𝑦𝑒𝑎𝑟𝑖 − ��
21
feature of the monarchy. In particular, mungwa was set in place in order to recruit a talented pool
of candidates for positions in the court, providing a channel of social mobility and preventing
nepotism and corruption that jeopardized the performance of the state. While similar civil service
exam systems were historically adopted in other countries and across different time periods, the
surviving records from the Joseon Dynasty stand out for their comprehensive information on the
candidates’ families and official positions obtained, as well as coverage over five centuries of rule
under a single dynasty.
We find that even with the adoption of the meritocratic recruiting system, family connections
under the monarchy continued to matter in determining the candidate’s eventual career path in the
court. More centrally connected candidates obtained higher positions in the court after passing
mungwa, controlling for measures of competence (age upon taking the final examination and score
ranking in the exam), type of family clan, pre-exam status, exam types and periods, place of
residence, and year of birth. Performance in mungwa, on the other hand, had a tenuous effect on
the likelihood of obtaining a high-level position. Younger candidates passing mungwa did
eventually find their way to high-level positions in the court more easily relative to older
counterparts, but scoring high in jeonsi (final palace exam) only mattered when considering a much
broader pool of candidates without verified records on their final positions.
While we do not necessarily observe a trend toward weakening meritocracy near the demise
of the Joseon Dynasty, we do find that periods of political instability and poor economic
performance coincide in time with those during which being centrally connected heavily
influenced appointment into officialdom. These observations provide suggestive evidence that
changing relevance of family connections for official positions does reflect the state performance
at the time. As an important feature of the government institution, the exam system certainly
fostered scholarly traditions and creation of educated political elites. The efficacy of mungwa
system in selecting competent officials in the court, however, appears to have been limited by
persistent effects of family connections.
22
Appendix A. Figures and Tables
[Table A1 Here]
[Table A2 Here]
[Table A3 Here]
[Figure A1 Here]
Appendix B. Degree-based Centrality Measures
In this section, we briefly summarize degree-based centrality measures. We first explain the
concept of degree centrality and show how it can be extended to eigenvector centrality. However,
there is a shortcoming of the eigenvector centrality for an asymmetric network. Hence we discuss
how it can be fixed using alpha centrality and how it relates to Katz prestige. We also state the
reason why we do not consider PageRank centrality in our study. Finally, we provide a simple
example of a network to compare degree centrality and Katz prestige.
Let a graph (N, A) consist of a set of nodes, N = {1, …, 𝑛}, and a real-valued 𝑛 × 𝑛
adjacency matrix, 𝐴 , where 𝑎𝑖𝑗 represents that node 𝑖 contributes to node 𝑗 . That is, the
adjacency matrix 𝐴 is a zero-one square matrix with its (𝑖, 𝑗)th entry,
𝑎𝑖𝑗 = {1, if node 𝑖 gives a (one way) link to node 𝑗0, otherwise
Since we focus on a directed graph, 𝑎𝑖𝑗 ≠ 𝑎𝑗𝑖 in our study.
Indegree centrality assigns one point for every link a node receives. Thus, we can obtain
indegree centrality of node 𝑖, 𝑥𝑖𝑖𝑛, by simply calculating
𝑥𝑖𝑖𝑛 = ∑ 𝑎𝑗𝑖
𝑗
In a similar way, outdegree centrality of node 𝑖 becomes
𝑥𝑖𝑜𝑢𝑡 = ∑ 𝑎𝑖𝑗
𝑗
23
However, degree centrality is easily missing important information of a network by considering
all nodes are equivalent. Some are more relevant than others, and endorsements from important
nodes need to be counted more. To reflect this aspect, eigenvector centrality, proposed by Bonacich
(1972), considers the centrality of neighboring nodes.
Let a 𝑛 × 1 vector 𝑥𝑒 denote the eigenvector centrality associated with a network
(adjacency matrix) 𝐴. The key idea of eigenvector centrality is that the centrality of a node is
proportional to the sum of the centrality of its neighbors (Bonacich, 1972). Thus, we write
𝜆𝑥𝑖𝑒 = ∑ 𝑎𝑗𝑖
𝑗𝑥𝑗
𝑒
where 𝜆 is a proportionality factor. In terms of matrix notation,
𝜆𝑥𝑒 = 𝐴′𝑥𝑒 (B1)
and
(𝐴′ − 𝜆𝐼)𝑥𝑒 = 0
where 𝐼 denotes the 𝑛 × 𝑛 identity matrix. In order for this equation to have a non-zero solution
𝑥𝑒, it must be that 𝐴′ − 𝜆𝐼 is a singular (or non-invertible) matrix. In other words,
𝑑𝑒𝑡(𝐴′ − 𝜆𝐼) = 0
where 𝑑𝑒𝑡(·) indicates determinant. Therefore, 𝑥𝑒 is the left eigenvector of 𝐴 (or right
eigenvector of 𝐴′), which corresponds to the in-edges in the graph, and 𝜆 is its corresponding
eigenvalue. The standard convention is to look for the eigenvector associated with the largest
eigenvalue (dominant eigenvalue).33
A problem of eigenvector centrality occurs in directed networks, especially when some
positions are unchosen. Only nodes in a strongly connected component of two or more vertices
can have a positive centrality value, which makes eigenvector centrality useless in asymmetric
33 According to the Perron-Frobenius Theorem, the largest eigenvalue of any nonnegative matrix is real-valued, and
its corresponding eigenvector is nonnegative (Jackson, 2010).
24
networks.34 As a solution to this problem, Lloyd and Bonacich (2001) suggest alpha centrality
(𝑥𝐴) by assigning a certain minimum score to each node. Let 𝑒 be a parameter of base value or
exogenous sources of status and replace the equations (B1) with the following new equation
𝑥𝐴 = 𝛼𝐴′𝑥𝐴 + 𝑒𝟏
where 𝟏 is a column vector of ones.
The parameter 𝛼 reflects the relative importance of endogenous versus exogenous factors in
the determination of centrality. The solution of this equation exists only if 𝛼 <1
𝜆 where 𝜆 is the
largest eigenvalue of 𝐴. If 𝛼 → 0+, then alpha centrality reduces to degree centrality. On the other
hand, if 𝛼 → (1
𝜆) and 𝛽 = 0, then it becomes similar to eigenvector centrality.35 The matrix
solution of this equation becomes
𝑥𝐴 = (𝐼 − 𝛼𝐴′)−1𝑒𝟏
where 𝐼 denotes the 𝑛 × 𝑛 identity matrix. This measure of centrality is almost identical to Katz
prestige (𝑥), and the relationship between the two measures can be derived as follows
𝑥𝐴 = [(𝐼 − 𝛼𝐴′)−1]𝑒𝟏 = [(𝐼 − 𝛼𝐴′)−1 − 𝐼 + 𝐼]𝑒𝟏 = 𝑒𝑥 + 𝑒𝟏
Therefore, we can find that alpha centrality is simply an affine transformation of Katz centrality.
In a practical manner, the exogenous source of status (𝑒) is usually normalized to one since it just
scales scores (Bloch et al., 2017; Jackson, 2010). In this case, the two measures differ only by one
(Lloyd and Bonacich, 2001).
There is a common concern about Katz prestige in that if a node with high prestige gives links
to many other nodes, all targeted nodes are likely to get high prestige. PageRank centrality is an
adjustment of this issue by giving less weight for the influences from higher outdegree nodes.
However, in our context, it is unlikely that ancestors give shared (penalized) influences to
34 Our family network structure is asymmetric, thus theoretically, we cannot apply eigenvector centrality.
35 The degree centrality measures the immediate local influence and the eigenvector centrality measures the global
influence within the network. On the other hand, alpha centrality (and Katz prestige) covers both the local and global
influence based on the damping factor (Cruz et al., 2017; Zhan et al., 2017).
25
decedents because of many out-edges. For example, assume that an individual has a (politically)
powerful father and many brothers. When evaluating his centrality, it is not suitable to reduce the
power of his father because of many brothers. Thus, there is no reason to penalize the link from a
high-outdegree source node. For this reason, PageRank centrality is not the right measure for our
study.
Now, we show an example of a directed network (N, g) which consists of a set of nodes, 𝑁 =
{1,2, … ,10}, and a 10 × 10 adjacency matrix, 𝐴, where 𝑎𝑖𝑗 denotes the relation from 𝑖 to 𝑗.
The adjacency matrix 𝐴 is represented in Table B1. For example, 𝑎31 = 1 and 𝑎13 = 0 mean
that node 3 gives an influence to node 1, but not vice versa.
[Table B1 Here]
We calculated scores of each measure in Table B2 and graphically represented the network
with corresponding scores in Figure B1.
[Table B2 Here]
We need to note that a node receiving many links does not necessarily have high Katz prestige.
Also, a node with high Katz prestige is not necessarily linked to many other nodes. In Table B2,
node 3 and node 4 have the largest scores of indegree centrality (= 3), but they have second and
third scores of Katz prestige (when 𝛼 = 0.3), respectively, because they receive links from less
central (prestigious) nodes (Figure B1).
[Figure B1 Here]
26
References
Baek, Kwang Ryeol (2017) “The concept and analysis method of ‘Kinship Network’ of t
he ruling elite in the late Joseon Dynasty,” Society and History, Vol. 114, pp. 7-6
0.
Bai, Ying and Ruixue Jia (2016) “Elite recruitment and political stability: the impact of t
he abolition of China’s civil service exam,” Econometrica, Vol. 84, pp. 677-733.
Banerjee, Abhijit, Chandrasekhar, Arun G., Duflo, Esther, and Jackson, Matthew O. (201
3) “The diffusion of microfinance,” Science, Vol. 341, pp. 363-370.
Bloch, Francis, Jackson, Matthew O., and Tebaldi, Pietro (2017) “Centrality measures in
networks,” Available at SSRN 2749124.
Bonacich, Phillip (1972) “Factoring and weighting approaches to status scores and clique
identification,” Journal of Mathematical Sociology, Vol. 2, pp. 113-120.
_____ (1987) “Power and centrality: A family of measures,” American Journal of Sociol
ogy, Vol. 92, pp. 1170-1182.
Bonacich, Phillip and Lloyd, Paulette (2001) “Eigenvector-like measures of centrality for
asymmetric relations,” Social Networks, Vol. 23, pp. 191-201.
Cha, Mihee (2002) “The promotion to the sixth grade-officials’ duties of the passers of c
ivilian service examination in the former 16th century,” The Choson Dynasty Hist
ory Association, Vol. 20, pp. 79-106.
_____ (2012) “The promotion to the sixth grade-officials’ duties of the passers of civilia
n service examination in the 17th and the former 18th centuries,” The Society for
Studies of Korean History, Vol. 47, pp. 75-108.
Clark, Gregory (2014) The son also rises: Surnames and the history of social mobility,
Vol. 49, Princeton, New Jersey: Princeton University Press.
Clark, Gregory and Neil Cummins (2014) “Surnames and social mobility in England, 117
0-2012,” Human Nature, Vol. 25, pp. 517-537.
_____ (2015) “Intergenerational wealth mobility in England, 1858-2012: Surnames and so
cial mobility,” The Economic Journal, Vol. 125, pp. 61-85.
Cruz, Cesi, Julien Labonne, and Pablo Querubin (2017) “Politician family networks and e
lectoral outcomes: Evidence from the Philippines,” American Economic Review, Vo
l. 107, pp. 3006-37.
27
Dal Bo, Ernesto, Frederico Finan, Olle Folke, Torsten Persson, and Johanna Rickne (201
7) “Who becomes a politician?” The Quarterly Journal of Economics, Vol. 132, p
p. 1877-1914.
Dal Bó, Ernesto, Dal Bó, Pedro, and Snyder, Jason (2009) “Political dynasties,” The Revi
ew of Economic Studies, Vol. 76, pp. 115-142.
Egorov, Georgy and Konstantin Sonin (2011) “Dictators and Their Viziers: Endogenizing
the Loyalty-competence Trade-Off,” Journal of the European Economic Associatio
n, Vol. 9, pp. 903-930.
Freeman, Linton C. (1979) “Centrality in Networks: I. Conceptual Clarifications,” Social
Networks, Vol. 1, pp. 215-239.
Hao, Yu and Gregory Clark (2012) “Social mobility in China, 1645-2012: A surname stu
dy,” Working paper.
Ho, Ping-ti (1962) The Ladder of Success in Imperial China: Aspects of Social Mobility,
1368-1911, New York: Columbia University Press.
Hong, Sok Chul, Christopher Paik, and Yangkeun Yun (2019) “Spreading knowledge in
exile,” Working Paper.
Hymes, Robert (1986) Statesmen and Gentlemen: The Elite of Fu-Chou Chiang-Hsi, in N
orthern and Southern Sung, Cambridge (England): Cambridge University Press.
Jackson, Matthew O. (2010) Social and Economic Networks, Princeton, NJ: Princeton uni
versity press.
Jiang, Qin and James Kai-Sing Kung (2016) “Social mobility in pre-industrial China: Rec
onsidering the ‘Ladder of Success’ hypothesis,” Working Paper.
Johnston, Jack, and John DiNardo (1997) Econometric Methods (Fourth edition), New Yo
rk, NY: McGraw-Hill.
Katz, Leo (1953) “A new status index derived from sociometric analysis,” Psychometrika,
Vol. 18, pp. 39-43.
Kim, Yul (2017) “A study on the determinants of bureaucrats’ promotion in the Joseon
Dynasty,” Korean Public Administration Quarterly, Vol. 29, pp. 637-657.
Kracke, Edward A (1947) “Family vs. merit in Chinese civil service examinations under
the empire,” Harvard Journal of Asiatic Studies, Vol. 10, pp. 103-123.
Lee, Jae-Ok (2018) “Digital humanities, and applications of the successful exam passers l
28
ist,” The Study of the Eastern Classic, Vol. 70, pp. 303-345.
Lee, Nam-Hee (2008) “The state examination system, its lights and shadows,” Issues in
East-Asian Philosophy, pp. 117-136.
Lee, Peter Hacksoo (2003) A history of Korean literature, Cambridge (England): Cambrid
ge University Press.
Lee, Sung-moo (1994) “Education system and civil service examination,” in Jon-hee Lee
ed. History of Korea, Gwacheon: National Institute of Korean History, pp. 279-36
8.
Li, Song-Mu (2000) “The history of the factional strifes in Chosun Dynasty,” The Journ
al of Korean History, Vol. 111, pp. 241-247.
Marsh, Robert M (1961) “Formal organization and promotion in a pre-industrial society,”
American Sociological Review, pp. 547-556.
Meghanathan, N (2015) Correlation Coefficient Analysis of Centrality Metrics for Comple
x Network Graphs, Intelligent Systems in Cybernetics and Automation Theory, Swit
zerland: Springer International Publishing AG.
Paik, Christopher (2014) “Does lineage matter? A study of ancestral influence on educati
onal attainment in Korea,” European Review of Economic History, Vol. 18, pp. 43
3-451.
Reuter, Ora John and Graeme B. Robertson (2012) “Subnational Appointments in Authori
tarian Regimes: Evidence from Russian Gubernatorial Appointments,” Journal of P
olitics, Vol. 74, pp.1023-1037.
Shiue, Carol H (2016) “Social mobility in the long run: An analysis with five linked ge
nerations in China, 1300-1900,” Working paper.
Song, Man-ho (2010) “Professor Edward Wagner and Professor Jun-ho Song, who set a
milestone in the pursuit of the ruling class in the Joseon Dynasty,” Civil Educatio
n of Korean History, pp. 217-232.
Wagner, Edward W (1974) “The ladder of success in Yi dynasty Korea,” Occasional Pa
pers on Korea, pp. 1-8.
Wasserman, Stanley, and Katherine Faust (1994) Social network analysis: Methods and a
pplications, Cambridge (England): Cambridge University Press.
Won, Chang-ae (2007) “Assignment of successful candidates of the civil service examinat
29
ion to regular official positions in the Choseon Dynasty,” The Choson Dynasty Hi
story Association, Vol. 43, pp. 5-50.
_____ (2019) “Description for civil service examination rosters,” URL: http://people.aks.a
c.kr/front/haeje/haeje.aks?h=MN, accessed on 4th January, 2019.
Wooldridge, Jeffrey M. (2010). Econometric analysis of cross section and panel data, Ca
mbridge, MA: MIT press.
Yi, Hyang-woo (2015) Koran Royal Palace: Changdeokgung, Seoul: Inmunwalk.
Zakharov, Alexei V (2016) “The loyalty-competence tradeoff in dictatorships and outside
options for subordinatesy,” Journal of Politics, Vol. 78, pp. 457-466.
Zhan, J., Gurung, S., and Parsa, S. P. K (2017) “Identification of top-K nodes in large
networks using Katz centrality,” Journal of Big Data, Vol. 4.
30
Figures and Tables
Figure 1. The structure of mungwa in Joseon Dynasty
Notes: The regional quotas at chosi were proportional to population in each
province. A total of 240 candidates were selected from 20 in Gyeonggi
Province, 15 in Gangwon Province, 15 in Pyeongan Province, 25 in
Chungcheong Province, 25 in Jeolla Province, 30 in Gyeongsang Province,
10 in Hwanghae Province, and 10 in Hamgyeong Province (Lee, 2008).
The local quotas were not applied to hoesi and jeonsi.
31
Table 1. Initial placement based on previous status and results of palace examination
Official rank (position) assignment
Ranking in palace exam Number Without official position With official position
Gapgwa (First division)
1st rank (jangwon) 1 Junior 6th rank position 4 ranks promoted
2nd and 3rd rank 2 Senior 7th rank position 3 ranks promoted
Eulgwa (Second division) 7 Junior 8th rank 2 ranks promoted
Byunggwa (Third division) 23 Senior 9th rank 1 rank promoted Notes: This table is re-tabulated from the tables of Lee (1994). “Without previous position” means the status upon
taking the examination was either saengwon (classics licentiate), jinsa (literary licentiate), yuhak (Confucian student).
“With previous official position” denotes those already holding official titles. Candidates of the second and third
divisions without previous official position were not guaranteed a post but only received an official rank (not a real
official position) and had to wait as temporary officials until one became vacant. If mid-level officials passed
mungwa, they were guaranteed to have promoted positions though they were not placed in gapgwa in jeonsi (Won,
2007).
32
Figure 2. Sa-Ahn Kang and related figures
Notes: This family network shows the nodes and ties related to Sa-Ahn Kang. We describe the partial networks that are directly or indirectly linked to Sa-Ahn Kang in our
dataset. There are many other men who are linked to Sa-Ahn Kang indirectly. However, due to the limitation of space, we restricted figures to the extent that does not hurt
our efforts to help for the understanding of network structure. Bold represents men who passed the literary examination, having subsequent information on the family. The
reason Gan Im who was a father-in-law of Sa-Ahn Kang has a tie with Yu-Gyeom Im even though Gan Im was not a successful candidate, which means has no
information about family, is that the family information comes from Gwang Im who passed the literary exam in 1624 and was a grandson of Gan Im. That is, in the
rosters, there are information that Gwang Im was a son of Ye-Shin Im, a grandson of Gan Im, a great grandson of Yu-Gyeom Im, and so on. In this specific example, the
number of nodes is 24 and the number of ties is 25. The relationships between figures are in parenthesis.
33
Figure 3. Sa-Ahn Kang and related figures with scores of Katz prestige
Notes: This family network shows the nodes and ties related to Sa-Ahn Kang. We describe the partial networks that are
directly or indirectly linked to Sa-Ahn Kang in our dataset, corresponding with Figure 2. The size of the circle is
proportional to scores of Katz prestige.
34
Figure 4. Proportion of dangsanggwan by grade in jeonsi and Katz prestige
Notes: This figure is a binned scatter plot indicating the proportion of dangsanggwan (high-level officials). To
construct this binned scatter plot, we first divide Katz prestige into ten equal sized-groups (deciles) and plot the
means of the y-axis variable within each bin against the mean value of Katz prestige (z-score) within each bin.
35
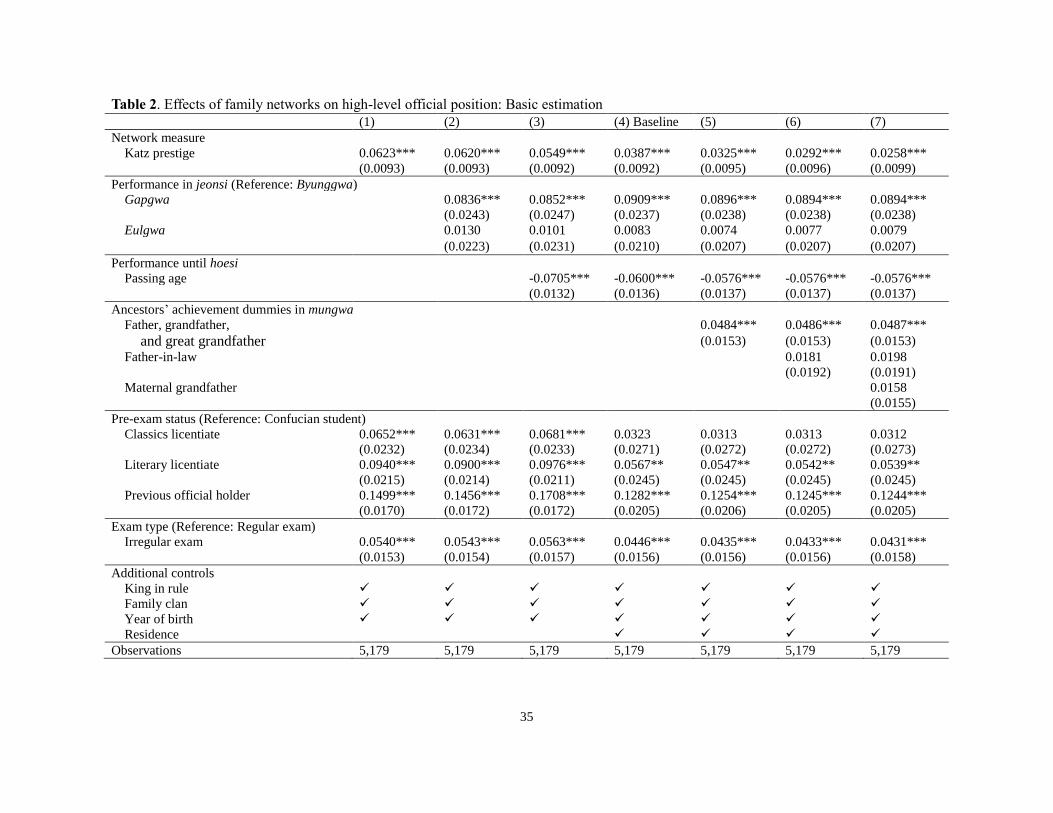
Table 2. Effects of family networks on high-level official position: Basic estimation
(1) (2) (3) (4) Baseline (5) (6) (7)
Network measure
Katz prestige 0.0623*** 0.0620*** 0.0549*** 0.0387*** 0.0325*** 0.0292*** 0.0258***
(0.0093) (0.0093) (0.0092) (0.0092) (0.0095) (0.0096) (0.0099)
Performance in jeonsi (Reference: Byunggwa)
Gapgwa 0.0836*** 0.0852*** 0.0909*** 0.0896*** 0.0894*** 0.0894***
(0.0243) (0.0247) (0.0237) (0.0238) (0.0238) (0.0238)
Eulgwa 0.0130 0.0101 0.0083 0.0074 0.0077 0.0079
(0.0223) (0.0231) (0.0210) (0.0207) (0.0207) (0.0207)
Performance until hoesi
Passing age -0.0705*** -0.0600*** -0.0576*** -0.0576*** -0.0576***
(0.0132) (0.0136) (0.0137) (0.0137) (0.0137)
Ancestors’ achievement dummies in mungwa
Father, grandfather, 0.0484*** 0.0486*** 0.0487***
and great grandfather (0.0153) (0.0153) (0.0153)
Father-in-law 0.0181 0.0198
(0.0192) (0.0191)
Maternal grandfather 0.0158
(0.0155)
Pre-exam status (Reference: Confucian student)
Classics licentiate 0.0652*** 0.0631*** 0.0681*** 0.0323 0.0313 0.0313 0.0312
(0.0232) (0.0234) (0.0233) (0.0271) (0.0272) (0.0272) (0.0273)
Literary licentiate 0.0940*** 0.0900*** 0.0976*** 0.0567** 0.0547** 0.0542** 0.0539**
(0.0215) (0.0214) (0.0211) (0.0245) (0.0245) (0.0245) (0.0245)
Previous official holder 0.1499*** 0.1456*** 0.1708*** 0.1282*** 0.1254*** 0.1245*** 0.1244***
(0.0170) (0.0172) (0.0172) (0.0205) (0.0206) (0.0205) (0.0205)
Exam type (Reference: Regular exam)
Irregular exam 0.0540*** 0.0543*** 0.0563*** 0.0446*** 0.0435*** 0.0433*** 0.0431***
(0.0153) (0.0154) (0.0157) (0.0156) (0.0156) (0.0156) (0.0158)
Additional controls
King in rule
Family clan
Year of birth
Residence
Observations 5,179 5,179 5,179 5,179 5,179 5,179 5,179
36
Notes: We conducted the regressions in equation (1) across different model specifications. The dependent variable is a dummy variable whether highest official position was
higher than or equal to the third rank upper senior position (i.e. belonging to the group of high-level rank officials). Katz prestige and passing age are standardized to be
mean zero and standard deviation one. In column (1), the specification includes the pre-exam status, exam type, period of king in rule, family clan, and year-of-birth fixed
effects. We additively contain grade in jeonsi in column (2) and age upon passing hoesi in column (3), respectively. Column (4), which is our preferred specification, adds
residence fixed effects to rule out the varying spatial impact of the regional characteristics. Family clan fixed effects include the dummies of 319 family clans. King fixed
effects include the dummies of 26 kings during the Joseon Dynasty. Exam type fixed effects include the regular exams (siknyeonsi and jeunggwangsi) and the irregular
exams (byulsi, alsungsi, jungsi, and so on). Year-of-birth fixed effects include each successful candidate's birth year dummies from 1363 to 1878. Residence fixed effects
include 202 district-level (Gun-Hyun) region dummies. Each cell reports the estimated coefficients and their standard errors clustered on family clans in parenthesis. A
single asterisk denotes statistical significance at the 90% level of confidence, double 95%, and triple 99%.
37
Figure 5. Alternative cut-offs of high-level official position
Notes: We repeat the same estimation with the baseline by replacing the dependent variable with the different cut-offs. We report the
coefficient estimates for the Katz prestige in panel (a), estimates for gapgwa in jeonsi in panel (b), and estimates for the age upon passing
hoesi in panel (c) with their 95 percent confidence intervals.
38
Table 2. Effects of family networks on high-level official position: Alternative estimation
Alternative model Alternative decay factor Alternative edge weight
Baseline Logit Probit α=.1 α=.5 Method 1 Method 2 Method 3
(1) (2) (3) (4) (5) (6) (7) (8)
Network measure
Katz prestige 0.0387*** 0.0384*** 0.0388*** 0.0313*** 0.0338*** 0.0342*** 0.0260*** 0.0410***
(0.0092) (0.0105) (0.0085) (0.0099) (0.0073) (0.0094) (0.0090) (0.0109)
Performance in jeonsi (Reference: Byunggwa)
Gapgwa 0.0909*** 0.0953*** 0.0924*** 0.0900*** 0.0928*** 0.0904*** 0.0911*** 0.0914***
(0.0237) (0.0333) (0.0223) (0.0238) (0.0237) (0.0238) (0.0238) (0.0237)
Eulgwa 0.0083 0.0071 0.0060 0.0087 0.0082 0.0087 0.0086 0.0088
(0.0210) (0.0188) (0.0187) (0.0210) (0.0209) (0.0209) (0.0210) (0.0209)
Performance until hoesi
Passing age -0.0518*** -0.0523*** -0.0544*** -0.0524*** -0.0532*** -0.0548*** -0.0516*** -0.0515***
(0.0118) (0.0140) (0.0119) (0.0117) (0.0119) (0.0119) (0.0120) (0.0110)
Observations 5,179 4,633 4,633 5,179 5,179 5,179 5,179 5,179
Notes: We conducted the baseline regressions using alternative specifications. Column (1) presents the baseline results, which is reported in column (4) of Table 2, for
comparison purpose. In columns (2) and (3), we estimate using logit and probit model instead of linear probability model. To make them comparable using probability scale, we
report the average marginal effects across values of each variable. Columns (4) and (5) show the results of different decay factor in Katz prestige. From column (6) to column (8),
we use different edge weights according to the kind of ties. In the weighting method 1, we replace the edge weights from maternal grandfather to 1/2. Additionally, we replace
the edge weights from father-in-law to 1/2 in column (7) and the edge weights from foster father to 0 in column (8), respectively. In other words, we give less weight to the
influences from maternal grandfather and father-in-law, and no weight from foster father. Each cell reports the estimated coefficients and their standard errors clustered on family
clans in parenthesis. A single asterisk denotes statistical significance at the 90% level of confidence, double 95%, and triple 99%.
39
Figure 6. Political stability and exile
Notes: Each dot depicts the number of exiles by year. Vertical lines are political events including Literati Purges and Treason Cases.
020
40
60
80
Num
ber
1390
1410
1430
1450
1470
1490
1510
1530
1550
1570
1590
1610
1630
1650
1670
1690
1710
1730
1750
1770
1790
1810
1830
1850
1870
1890
40
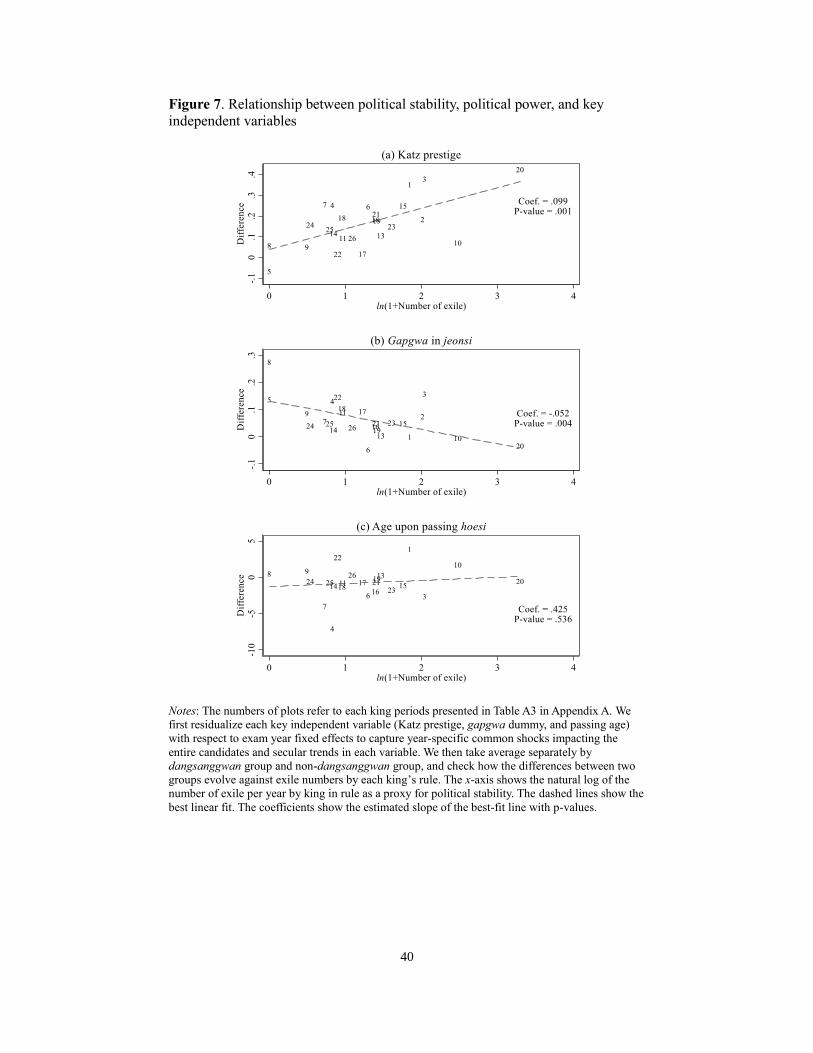
Figure 7. Relationship between political stability, political power, and key
independent variables
Notes: The numbers of plots refer to each king periods presented in Table A3 in Appendix A. We
first residualize each key independent variable (Katz prestige, gapgwa dummy, and passing age)
with respect to exam year fixed effects to capture year-specific common shocks impacting the
entire candidates and secular trends in each variable. We then take average separately by
dangsanggwan group and non-dangsanggwan group, and check how the differences between two
groups evolve against exile numbers by each king’s rule. The x-axis shows the natural log of the
number of exile per year by king in rule as a proxy for political stability. The dashed lines show the
best linear fit. The coefficients show the estimated slope of the best-fit line with p-values.
41
Table A1. Rank system of the government officials
Category Rank and Sub-rank
Dangsanggwan (high-level officials) 1st Senior
Upper
Lower
1st Junior
Upper
Lower
2nd Senior
Upper
Lower
2nd Junior
Upper
Lower
3rd Senior
Upper
Chamsanggwan (mid-level officials) Lower
3rd Junior
Upper
Lower
4th Senior
Upper
Lower
4th Junior
Upper
Lower
5th Senior
Upper
Lower
5th Junior
Upper
Lower
6th Senior
Upper
Lower
6th Junior
Upper
Lower
Chamhagwan (low-level officials) 7th Senior
7th Junior
8th Senior
8th Junior
9th Senior
9th Junior Notes: Dangsanggwan (high-level officials) were defined as the ministers of upper senior third or
higher ranks, collectively known as ‘palace-ascendable officials’ They were given important rights
to vote on the administration, to recommend other officials, and to direct the military of the
relevant officials (Cha, 2002). Officials from lower junior sixth rank to the lower senior third rank
were called ‘chamsanggwan (mid-level officials)’ and they were in the charge of central
administration and local government.
42
Table A2. Summary statistics
Total Dangsanggwan vs. Non-dangsanggwan
Mean SD Min Max Mean Difference P-value
Proportion of dangsanggwan 0.556 0.497 0 1 1 0
Network measure
Katz prestige 2.287 0.587 1.000 4.857 2.373 2.179 0.194*** 0.000
Performance in jeonsi
Gapgwa 0.117 0.321 0 1 0.137 0.092 0.045*** 0.000
Eulgwa 0.200 0.400 0 1 0.208 0.190 0.018 0.100
Byunggwa 0.683 0.465 0 1 0.654 0.718 -0.064*** 0.000
Performance in hoesi
Passing age 33.169 9.176 13 82 32.698 33.757 -1.059*** 0.000
Pre-exam status
Confucian student 0.275 0.447 0 1 0.225 0.338 -0.113*** 0.000
Classics Licentiate 0.147 0.354 0 1 0.143 0.151 -0.008 0.407
Literary Licentiate 0.198 0.398 0 1 0.204 0.190 0.014 0.198
Previous official holder 0.380 0.486 0 1 0.428 0.321 0.107*** 0.000
Irregular exam 0.526 0.499 0 1 0.544 0.503 0.040*** 0.004
Lived in Seoul before exam 0.604 0.489 0 1 0.674 0.515 0.159*** 0.000
Observations 5,179 5,179 5,179 5,179 2,879 2,300 5,179
Notes: This table reports descriptive statistics on variables related to empirical analysis.
43
Table A3. List of Joseon monarchs
Number Temple name Period of reign Name of king
1 Taejo 1392–1398 Yi Seong-gye
2 Jeongjong 1398–1400 Yi Bang-gwa
3 Taejong 1400–1418 Yi Bang-won
4 Sejong 1418–1450 Yi Do
5 Munjong 1450–1452 Yi Hyang
6 Danjong 1452–1455 Yi Hong-wi
7 Sejo 1455–1468 Yi Yu
8 Yejong 1468–1469 Yi Gwang
9 Seongjong 1469–1494 Yi Hyeol
10 Yeonsangun 1494–1506 Yi Yung
11 Jungjong 1506–1544 Yi Yeok
12 Injong 1544–1545 Yi Ho
13 Myeongjong 1545–1567 Yi Hwan
14 Seonjo 1567–1608 Yi Yeon
15 Gwanghaegun1 1608–1623 Yi Hon
16 Injo 1623–1649 Yi Jong
17 Hyojong 1649–1659 Yi Ho
18 Hyeonjong 1659–1674 Yi Yeon
19 Sukjong 1674–1720 Yi Sun
20 Gyeongjong 1720–1724 Yi Yun
21 Yeongjo 1724–1776 Yi Geum
22 Jeongjo 1776–1800 Yi San
23 Sunjo 1800–1834 Yi Gong
24 Heonjong 1834–1849 Yi Hwan
25 Cheoljong 1849–1863 Yi Byeon
26 Gojong 1863–1897 Yi Myeong-bok
27 Sunjong 1907–1910 Yi Yu
Notes: This table shows the list of twenty-seven kings of the Joseon Dynasty.
44
Figure A1. Sample of family networks having more than or equal to 5 ties
Notes: This figure shows sample family networks of those who reached dangsanggwan, or high-level official,
(black dots) and those who did not (gray dots). The size of the circle is proportional to Katz prestige. To simplify
the graph, we restricted the nodes that have more than or equal to 5 ties. In this network, the number of nodes is
2,729 (5.71% of total) and that of ties is 2,391 (4.86% of total), respectively. We represented this network using
ForceAtlas layout (see https://gephi.org/users/tutorial-layouts/).
45
Table B1. Adjacency matrix of a sample network
Node ID 1 2 3 4 5 6 7 8 9 10
1 0 0 0 0 0 0 0 0 0 0
2 0 0 0 0 0 0 0 0 1 0
3 1 0 0 0 0 0 0 0 0 0
4 1 0 0 0 0 0 0 0 0 0
5 0 0 1 0 0 0 0 0 0 0
6 0 0 1 0 0 0 0 0 0 0
7 0 1 0 1 0 0 0 0 0 0
8 0 1 1 1 0 0 0 0 0 0
9 0 0 0 0 0 0 1 0 0 0
10 0 0 0 1 0 0 0 0 0 0 Notes: This table shows the adjacency matrix of sample network. For
example, a31 = 1 and a13 = 0 mean that node 3 gives an influence on node 1,
but not vice versa.
46
Table B2. Example of network and centrality measures
Degree centrality Katz prestige
Node ID In-edge Out-edge α=.1 α=.3 α=.5
1 2 0 0.261 1.181 2.786
2 2 1 0.211 0.737 1.571
3 3 1 0.300 0.900 1.500
4 3 1 0.311 1.037 2.071
5 0 1 0.000 0.000 0.000
6 0 1 0.000 0.000 0.000
7 1 2 0.112 0.456 1.143
8 0 3 0.000 0.000 0.000
9 1 1 0.121 0.521 1.286
10 0 1 0.000 0.000 0.000
Notes: This table shows each centrality measure corresponding network in Table B1.
47
Figure B1. Graphical representation of sample network with scores
(a) Indegree centrality (b) Katz prestige (α=.3)
Notes: Each network graph corresponds to the sample network of Table B1. The numbers in each circle denote the
nodes’ id. The size of circles is proportional to scores of each measure.