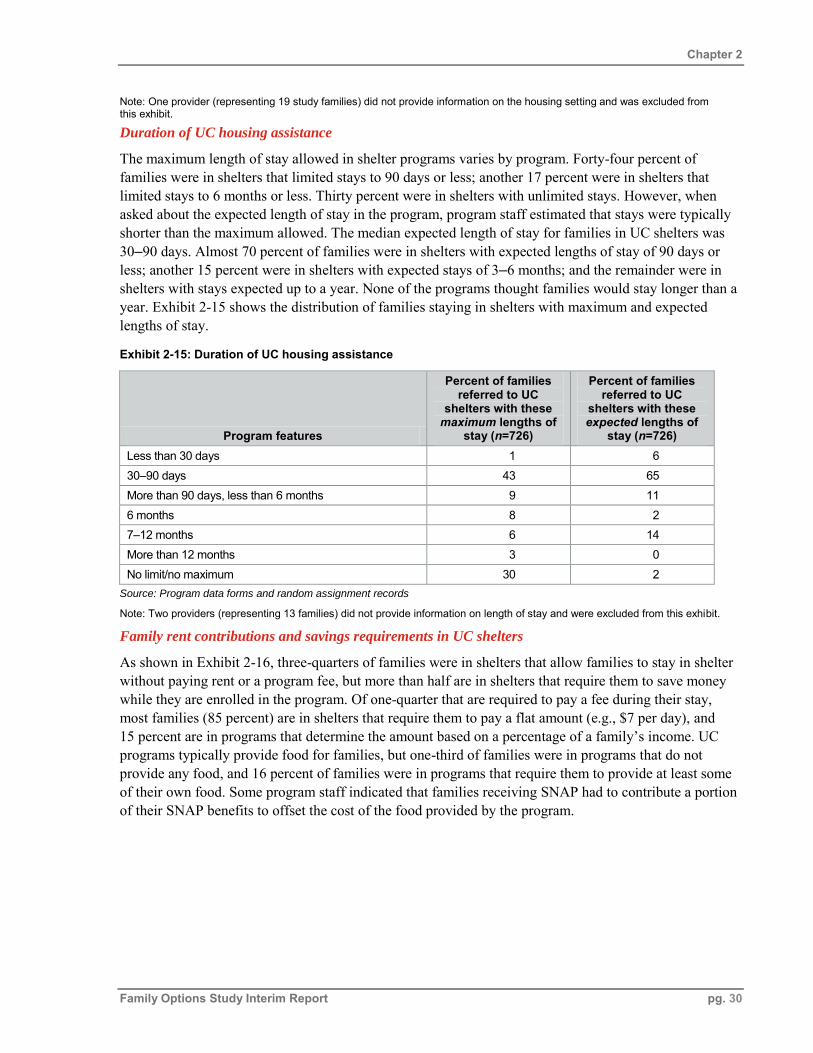
U.S. Department of Housing and Urban Development | Office of Policy Development and Research U.S. Department of Housing and Urban Development | Office of Policy Development and Research Interim Report FAMILY OPTIONS STUDY
Transcript
U.S. Department of Housing and Urban Development | Office of Policy Development and ResearchU.S. Department of Housing and Urban Development | Office of Policy Development and Research
Interim Report FAM I LY O P T I O N S S T U DY
Visit PD&R’s website
www.huduser.orgto find this report and others sponsored by HUD’s Office of Policy Development and Research (PD&R). Other services of
HUD USER, PD&R’s research information service, include listservs, special interest reports, bimonthly publications (best
practices, significant studies from other sources), access to public use databases, and a hotline (800-245-2691) for help
accessing the information you need.
Interim Report FAM I LY O P T I O N S S T U DY
Prepared for: U.S. Department of Housingand Urban DevelopmentWashington, D.C.
The Family Options Study began in 2008. The authors of this report gratefully acknowledge the efforts of many individuals who have assisted in carrying out this work. We wish particularly to thank the Government Technical Reviewer, Anne Fletcher, for her ongoing guidance and insight and her support throughout all phases of the research. Other staff members of HUD’s Office of Policy Development and Research have also provided valuable guidance and technical oversight for the study. In particular, we wish to thank Paul Dornan, the study’s former GTR, and Mark Shroder. HUD’s Office of Community Planning and Development and Special Needs Assistance Programs have been active partners throughout the design and implementation of the Family Options Study, and the Abt research team is grateful for the support and assistance these staff have provided.
The study would not be possible without the enthusiasm and dedication of local service providers, Continua of Care leaders, and public housing agencies in the 12 participating communities: Alameda County, California; Atlanta, Georgia; Baltimore, Maryland; Boston, Massachusetts; New Haven and Bridgeport regions, Connecticut; Denver, Colorado; Honolulu, Hawaii; Kansas City, Missouri; Louisville, Kentucky; Minneapolis, Minnesota; Phoenix, Arizona; and Salt Lake City, Utah. The study team is grateful for the contributions of local service providers and study champions to the design and execution of this study and sustained commitment over the study design and enrollment period.
Many staff at Abt Associates and within our team of partners have contributed to this research effort. The study’s co-principal investigators, Stephen Bell of Abt Associates and Marybeth Shinn of Vanderbilt University, have guided the study design and analysis with attention to both the methodological rigor required in a random assignment evaluation and grounding in operational realities of the homeless assistance service delivery system. The intervention design, site recruitment, participant enrollment, and program data collection activities were enhanced by the contributions of the senior staff who serve as research liaisons for each of the participating communities: Martha Burt, Dennis Culhane (University of Pennsylvania), Marybeth Shinn (Vanderbilt University), Brooke Spellman and Matt White (Abt Associates), Suzanne Zerger and Wendy Vaulton (Center For Social Innovation), and Donald Chamberlin. Lauren Dunton, Nichole Fiore, Scott Brown, and Meghan Henry of Abt Associates served as study team site liaisons, contacting participating providers for updates on families enrolled in each intervention.
Baseline data collection and random assignment were conducted by local field interviewers under the supervision of AbtSRBI. Brenda Rodriguez is the study’s survey director and Debi McInnis of Abt Associates coordinated efforts of the field team with the site liaisons.
A number of individuals have played important roles in developing the design of the study interventions; selecting and recruiting participating sites; collecting, analyzing, and interpreting the data; and writing this report. We are particularly grateful for the constructive and thoughtful input and feedback on earlier versions of this report provided by Project Quality Advisors Jill Khadduri and Jacob Klerman. The team is also grateful for the contributions of Jennifer Bagnell Stuart and Ruby Jennings, who assembled program data from the participating providers, and Katherine Buck who assisted with proofreading. Abt Creative Services provided production and graphic design support for this report.
Disclaimer
Family Options Study Interim Report
Disclaimer
The contents of this report are the views of the authors and do not necessarily reflect the views or policies of the U.S. Department of Housing and Urban Development or the U.S. Government.
Table of Contents
Family Options Study Interim Report pg. vi
Table of Contents
Executive Summary .................................................................................................................................. xi
Study interventions ................................................................................................................. xi
Random assignment design ................................................................................................... xii
Baseline characteristics......................................................................................................... xiii
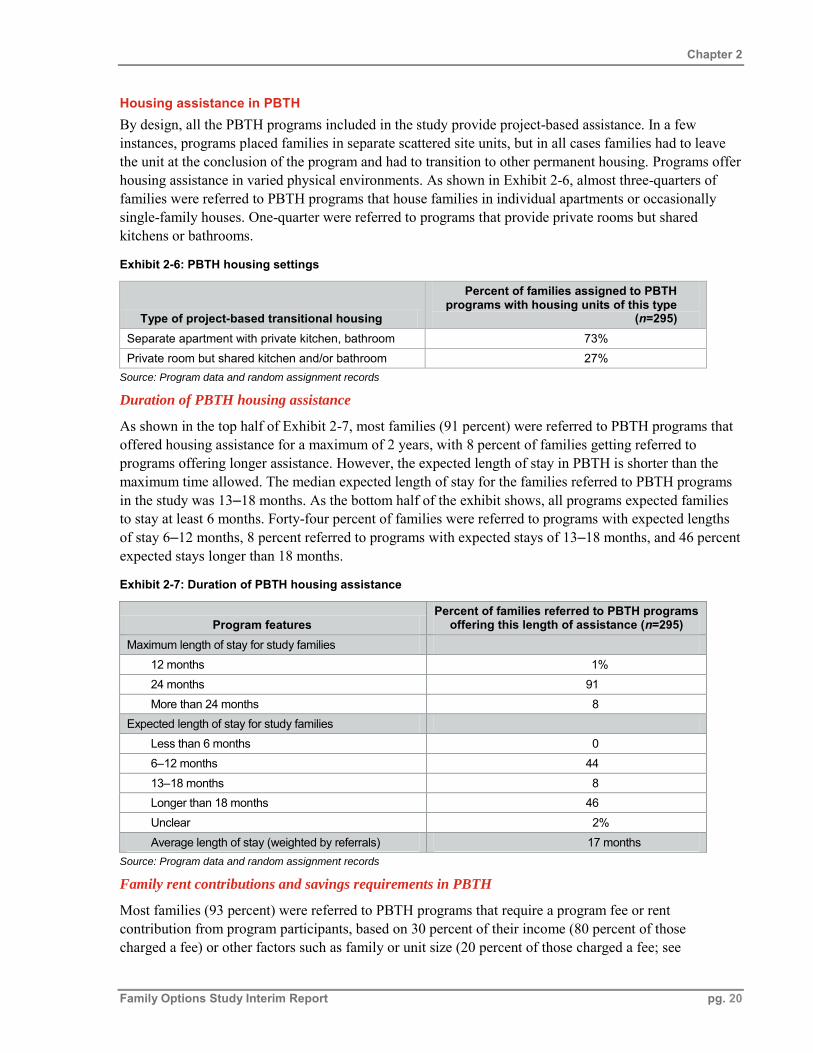
Exhibit 2-7: Duration of PBTH housing assistance .....................................................................................20
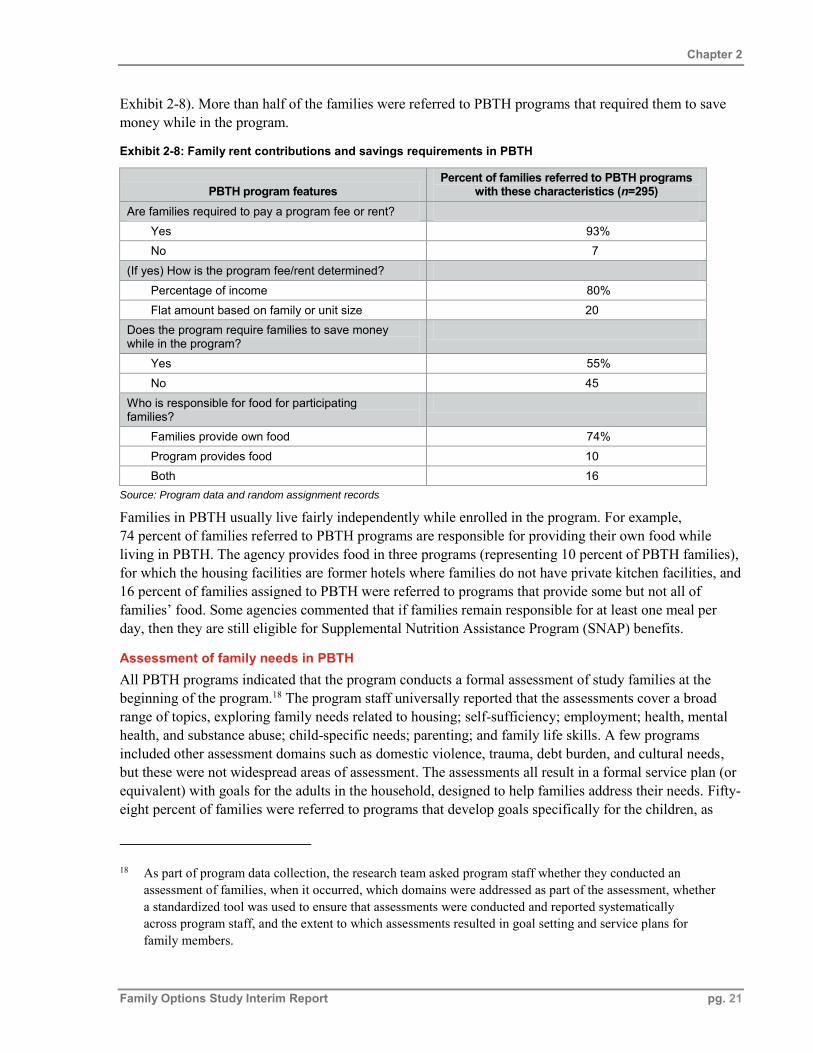
Exhibit 2-8: Family rent contributions and savings requirements in PBTH ...............................................21
Exhibit 2-9: Types of supportive services offered in PBTH programs and how they are delivered ...........22
Exhibit 2-10: PBTH case management intensity (ratio and frequency) ......................................................23
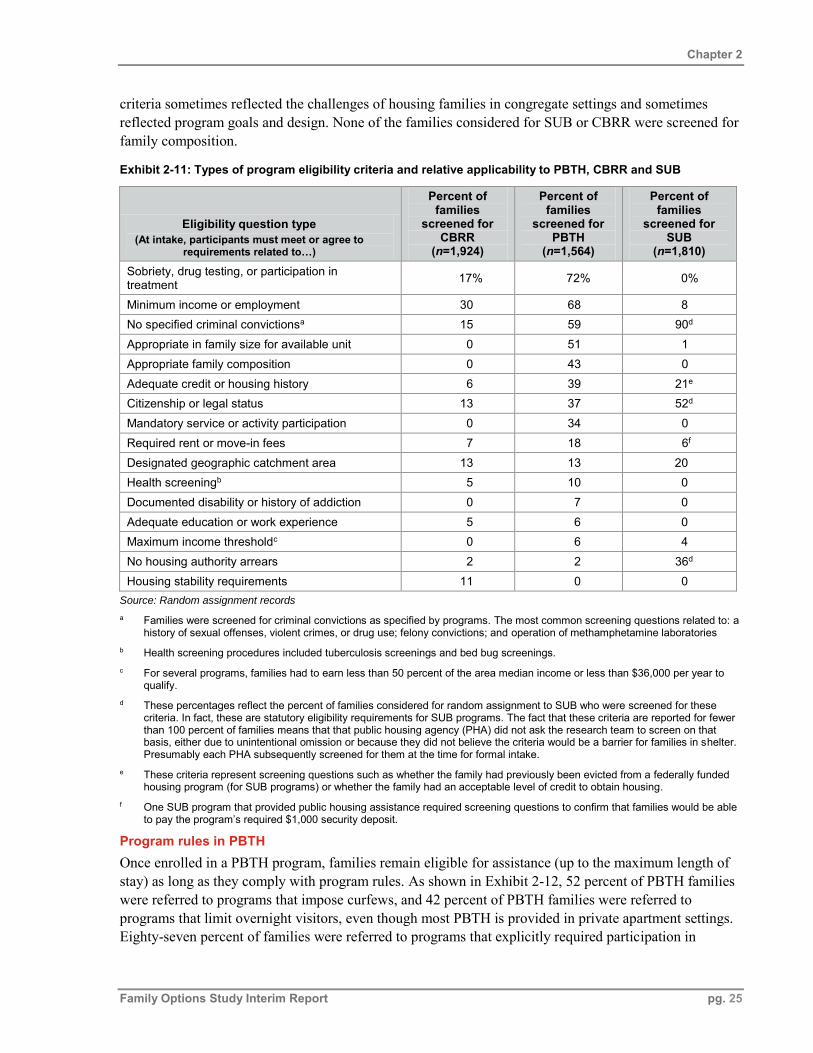
Exhibit 2-11: Types of program eligibility criteria and relative applicability to PBTH, CBRR and SUB .25
Exhibit 2-12: Types of program rules in PBTH ..........................................................................................26
Exhibit 2-13: Subsidy type provided by site ...............................................................................................26
Exhibit 2-14: Type of emergency shelter housing .......................................................................................29
Exhibit 2-15: Duration of UC housing assistance .......................................................................................30
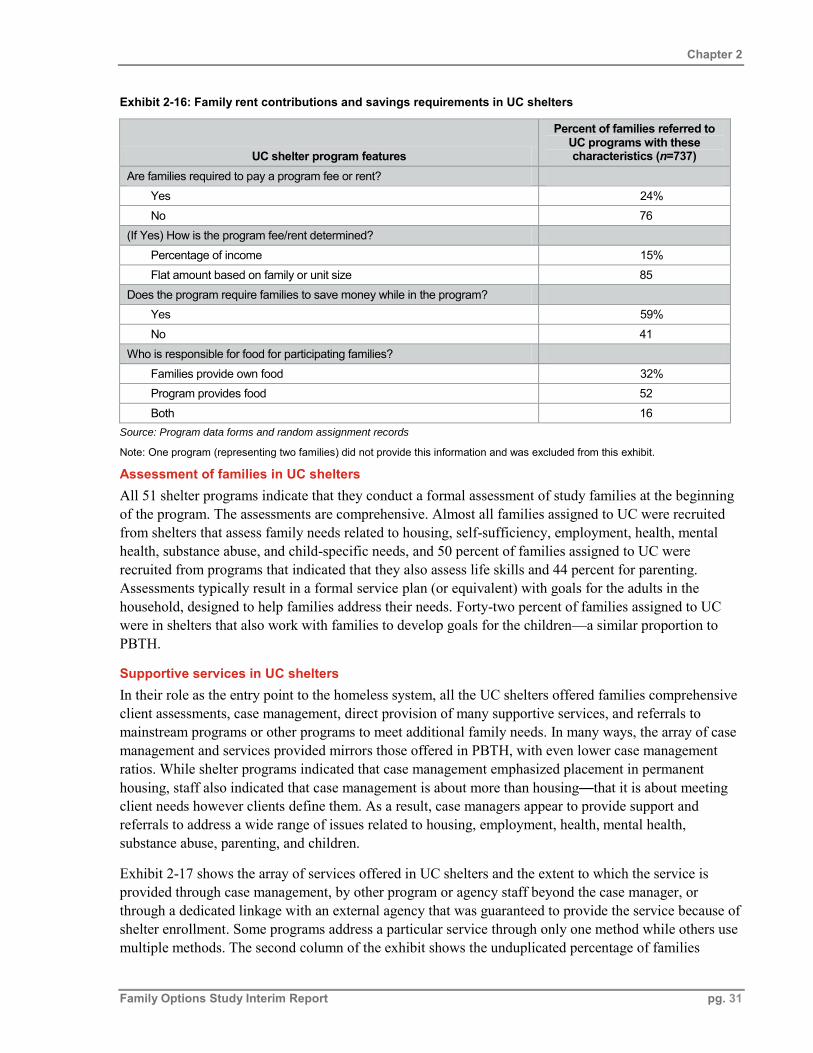
Exhibit 2-16: Family rent contributions and savings requirements in UC shelters .....................................31
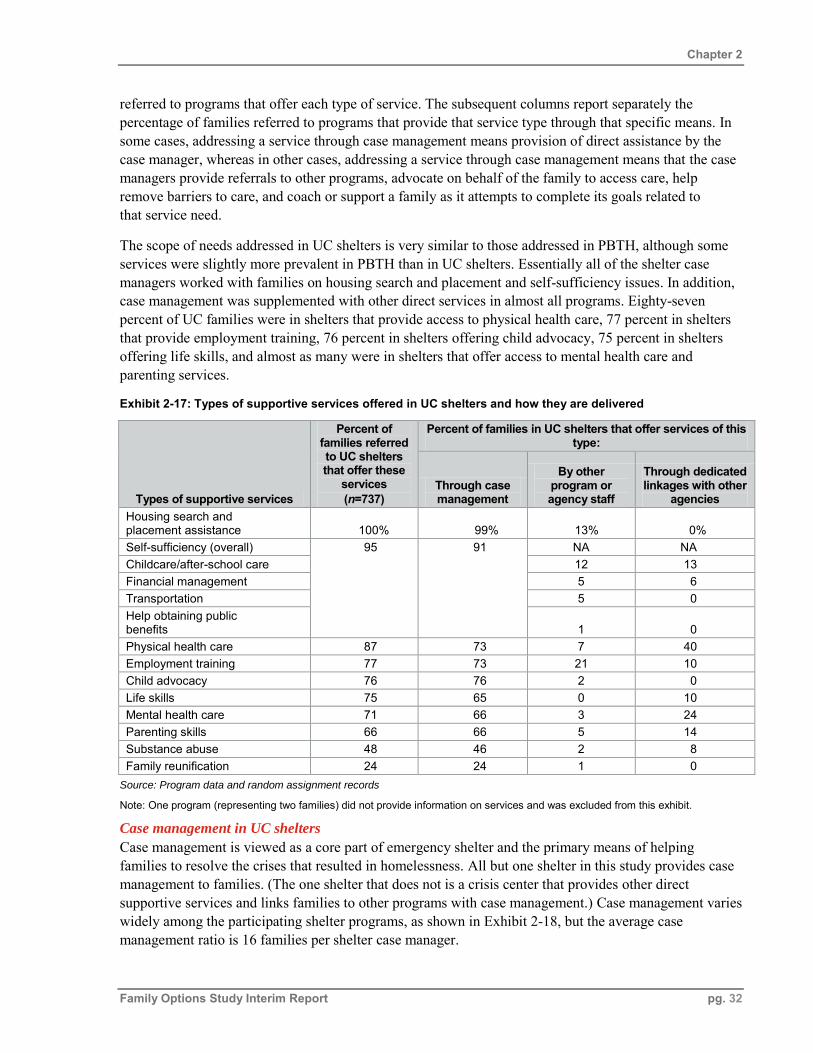
Exhibit 2-17: Types of supportive services offered in UC shelters and how they are delivered .................32
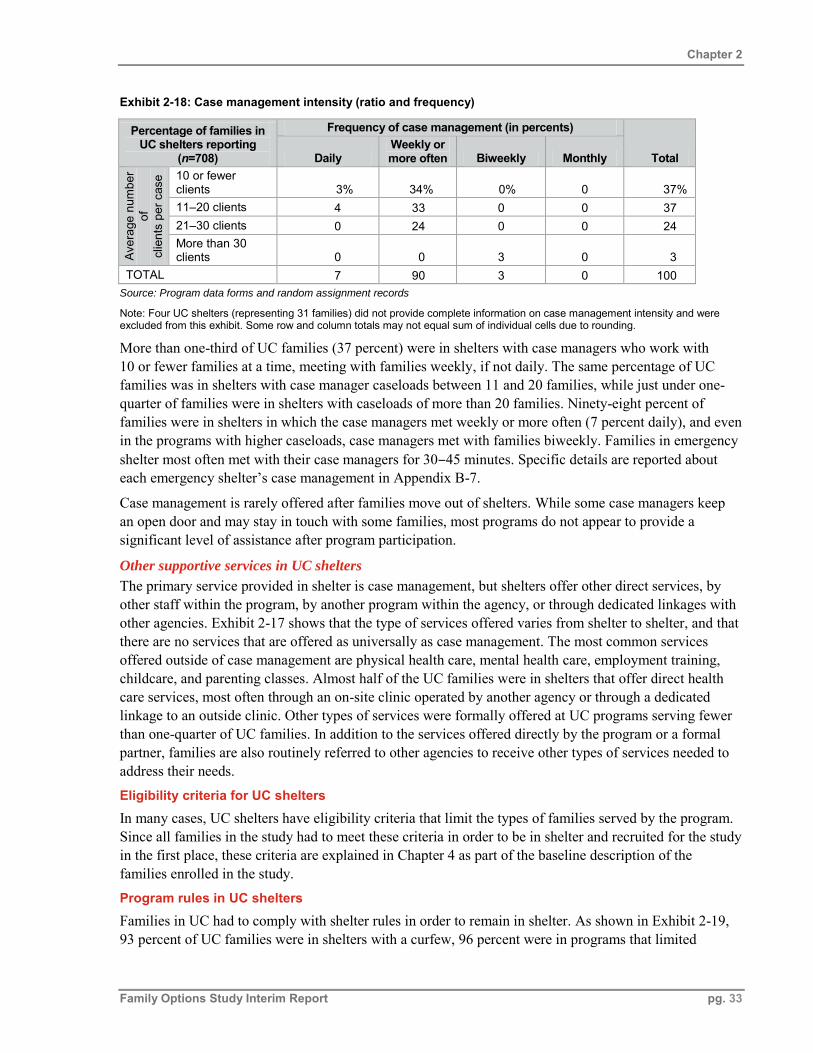
Exhibit 2-18: Case management intensity (ratio and frequency) ................................................................33
Exhibit 2-19: Types of program rules in UC shelters ..................................................................................34
Exhibit 2-20: Summary of intervention features that will be compared through the Family Options Study ...........................................................................................................................34
Exhibit 3-1: Random assignment design .....................................................................................................37
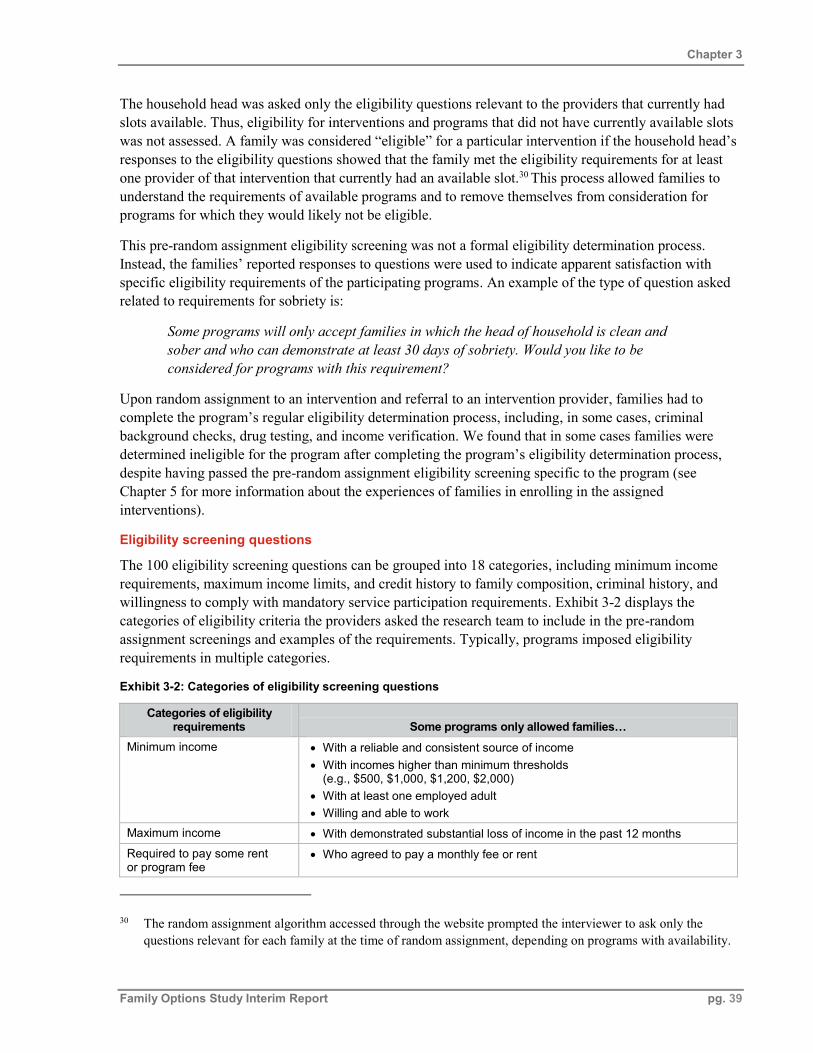
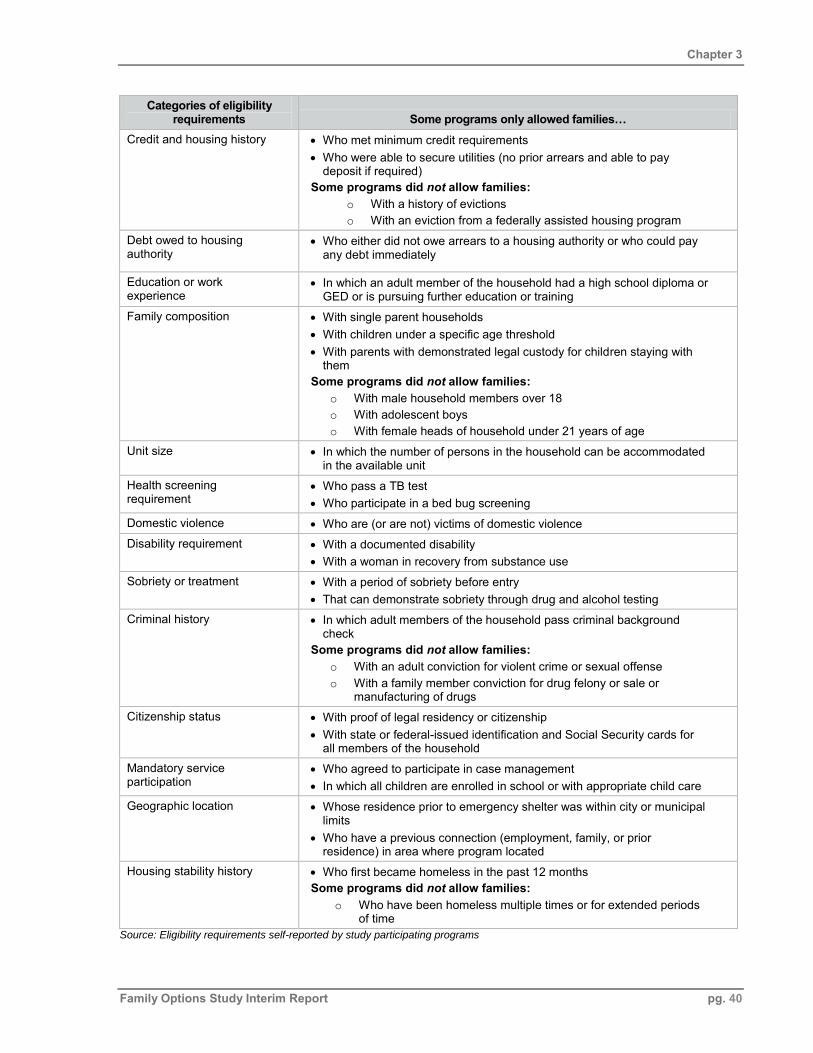
Exhibit 3-2: Categories of eligibility screening questions ...........................................................................39
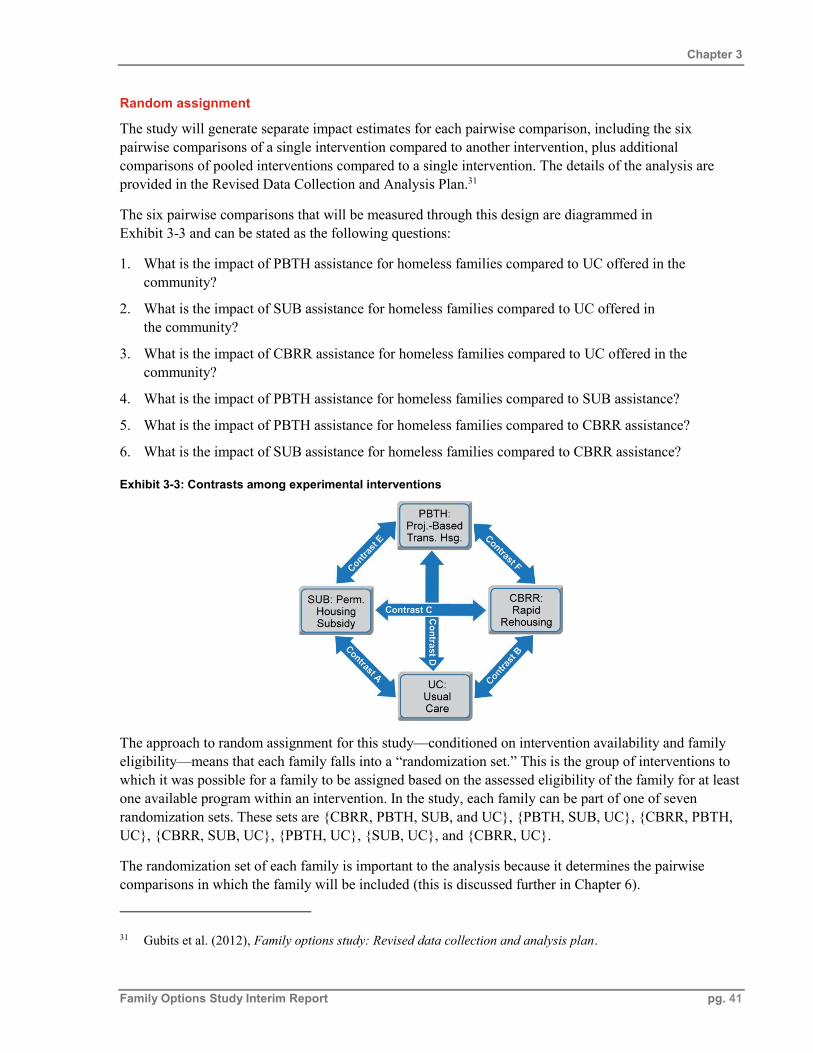
Exhibit 3-3: Contrasts among experimental interventions ..........................................................................41
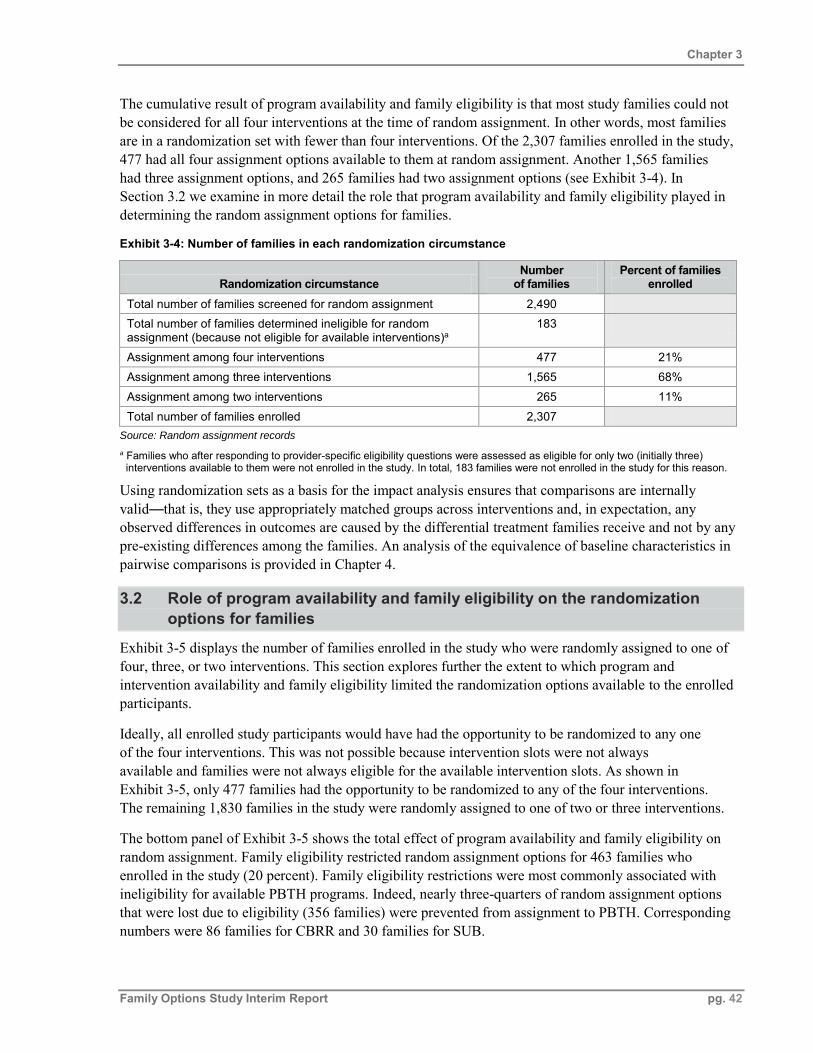
Exhibit 3-4: Number of families in each randomization circumstance .......................................................42
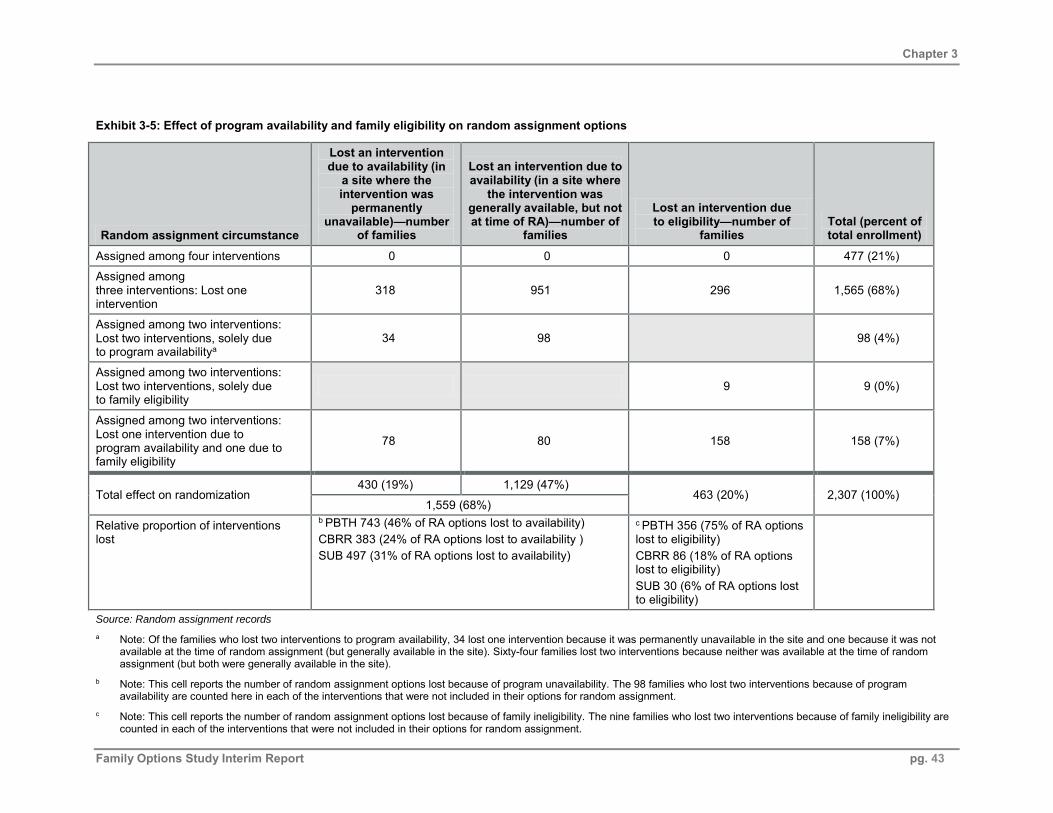
Exhibit 3-5: Effect of program availability and family eligibility on random assignment options .............43
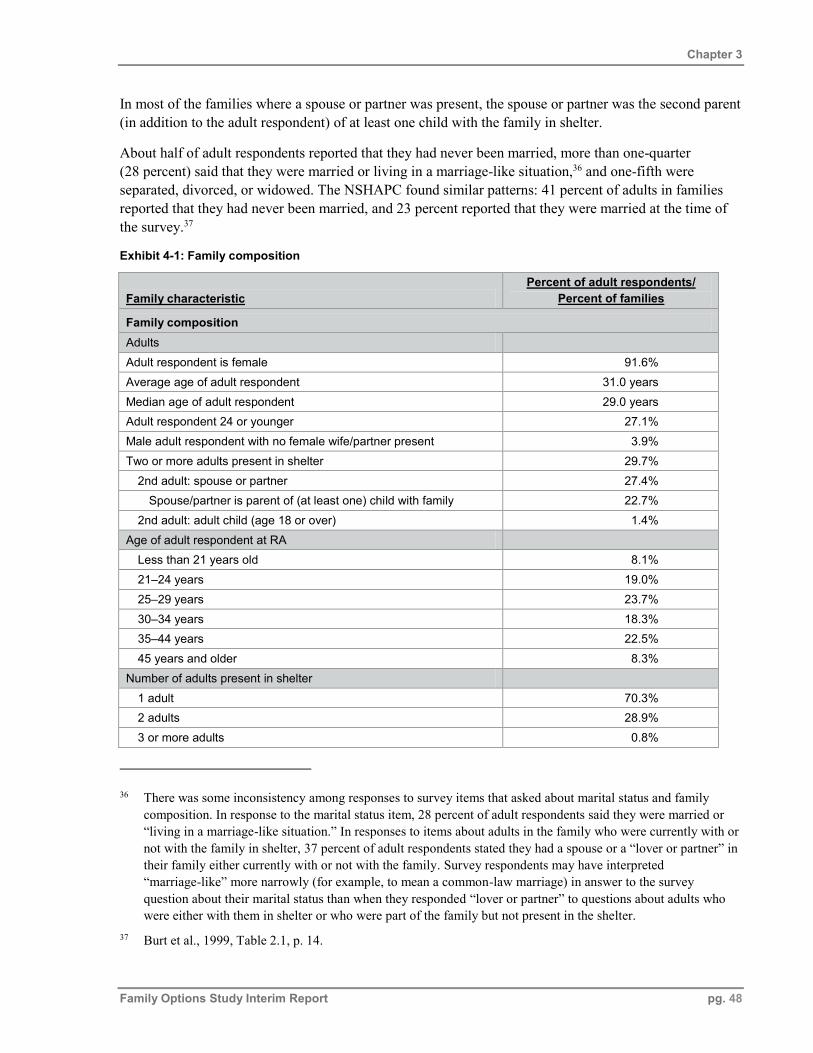
Exhibit 4-1: Family composition .................................................................................................................48
Exhibit 4-2: Family separation ....................................................................................................................50
Exhibit 4-4: Family race/ethnicity by site ...................................................................................................52
Table of Contents
Family Options Study Interim Report pg. x
Exhibit 4-5: Housing stability and history of homelessness ........................................................................53
Exhibit 4-6: Income stability and disability ................................................................................................55
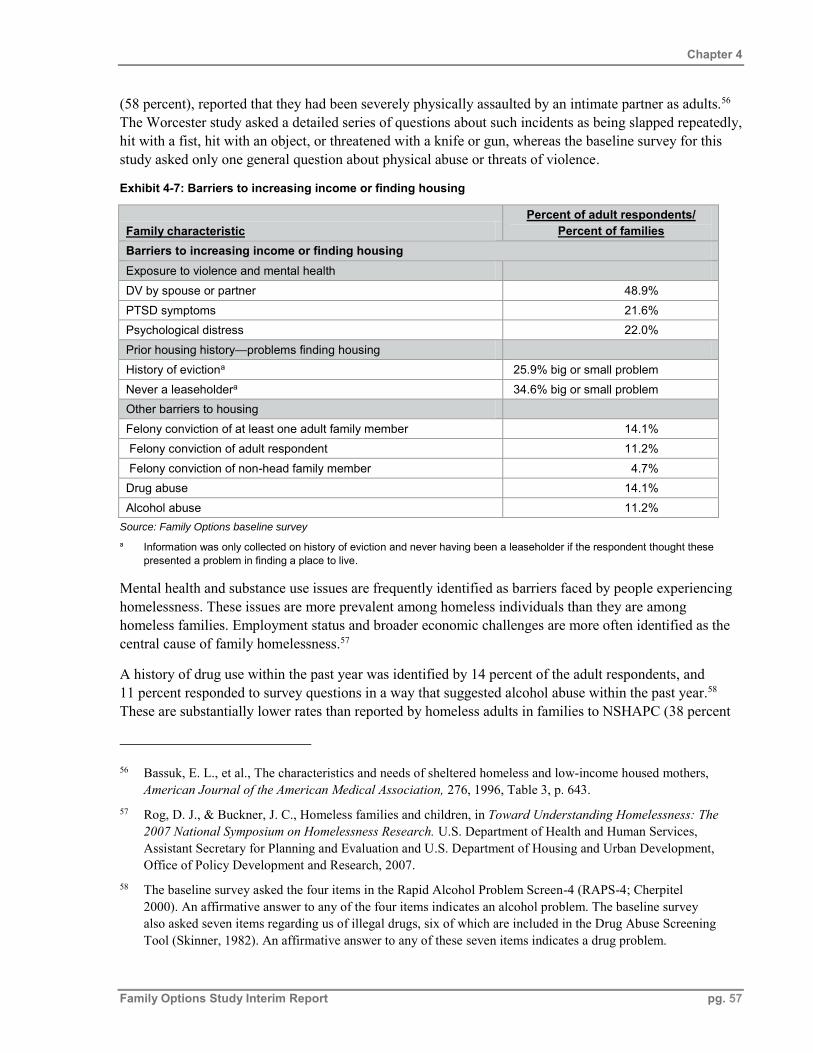
Exhibit 4-7: Barriers to increasing income or finding housing ...................................................................57
Exhibit 4-8: Sample sizes for six pairwise impact comparisons (number of families) ...............................59
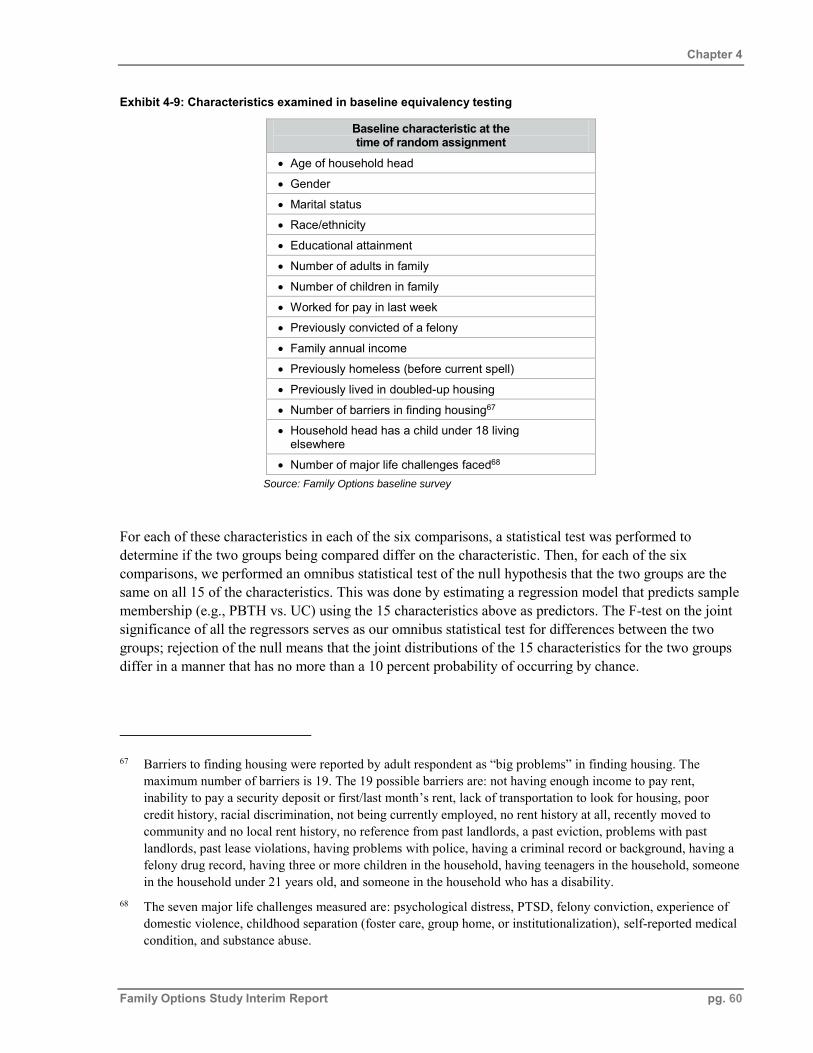
Exhibit 4-9: Characteristics examined in baseline equivalency testing .......................................................60
Exhibit 5-1: Intervention take-up rates as of June 15, 2012 ........................................................................64
Exhibit 5-2: Status of families assigned to CBRR from enrollment verification data ................................66
Exhibit 5-3: Status of families assigned to PBTH from enrollment verification data .................................67
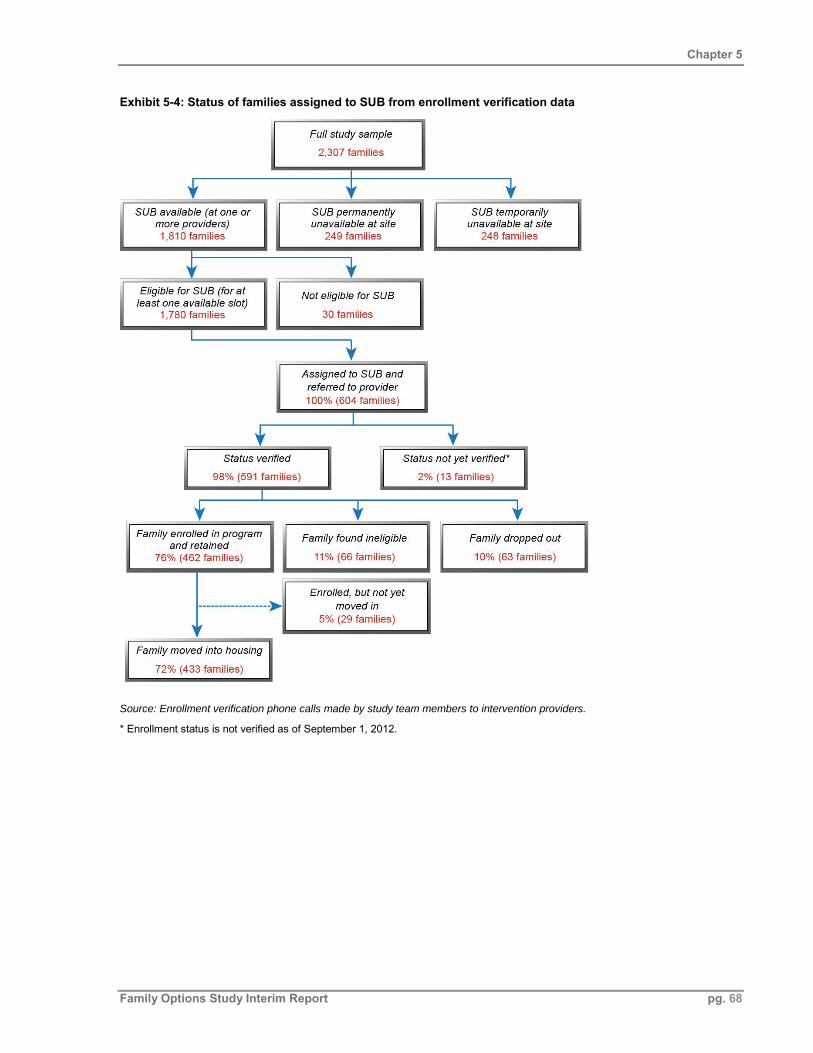
Exhibit 5-4: Status of families assigned to SUB from enrollment verification data ...................................68
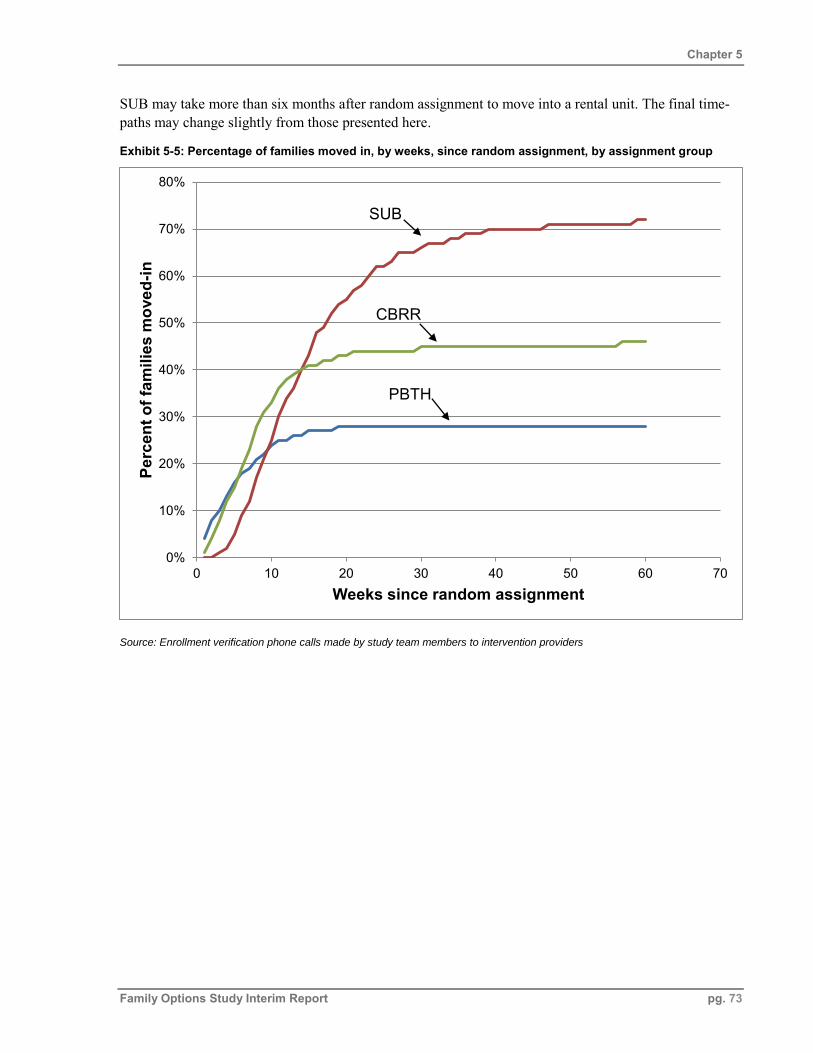
Exhibit 5-5: Percentage of families moved-in by weeks since random assignment, by assignment group 73
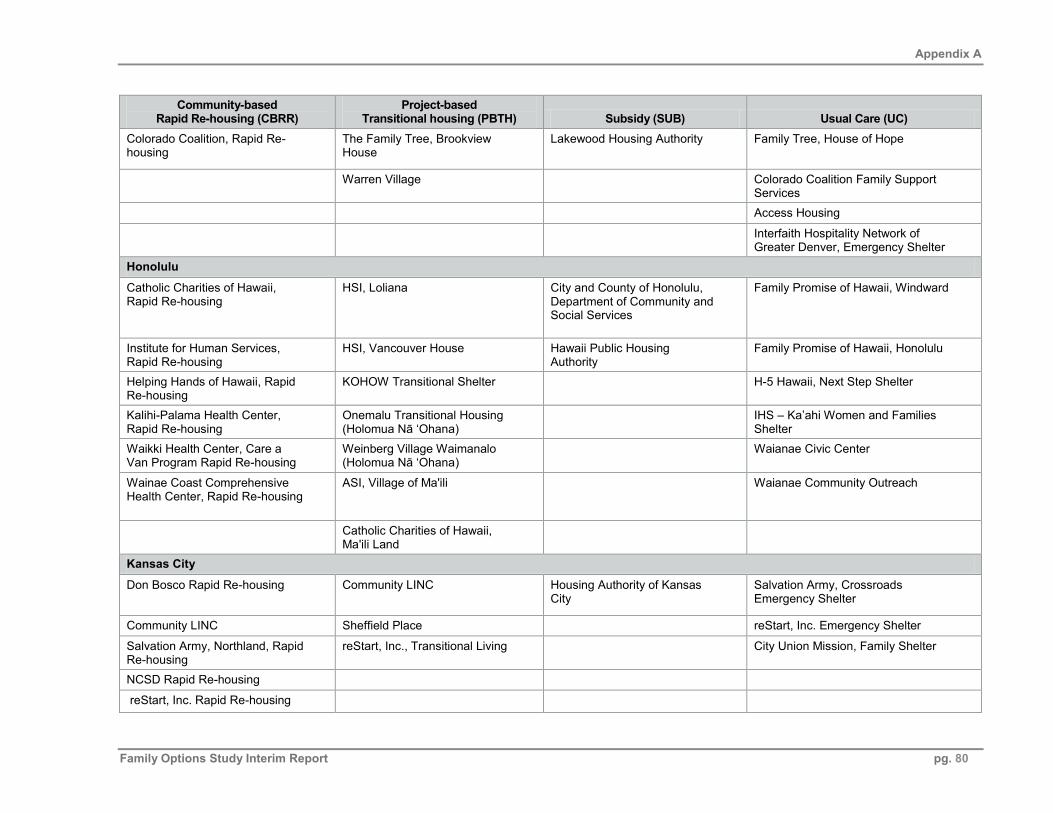
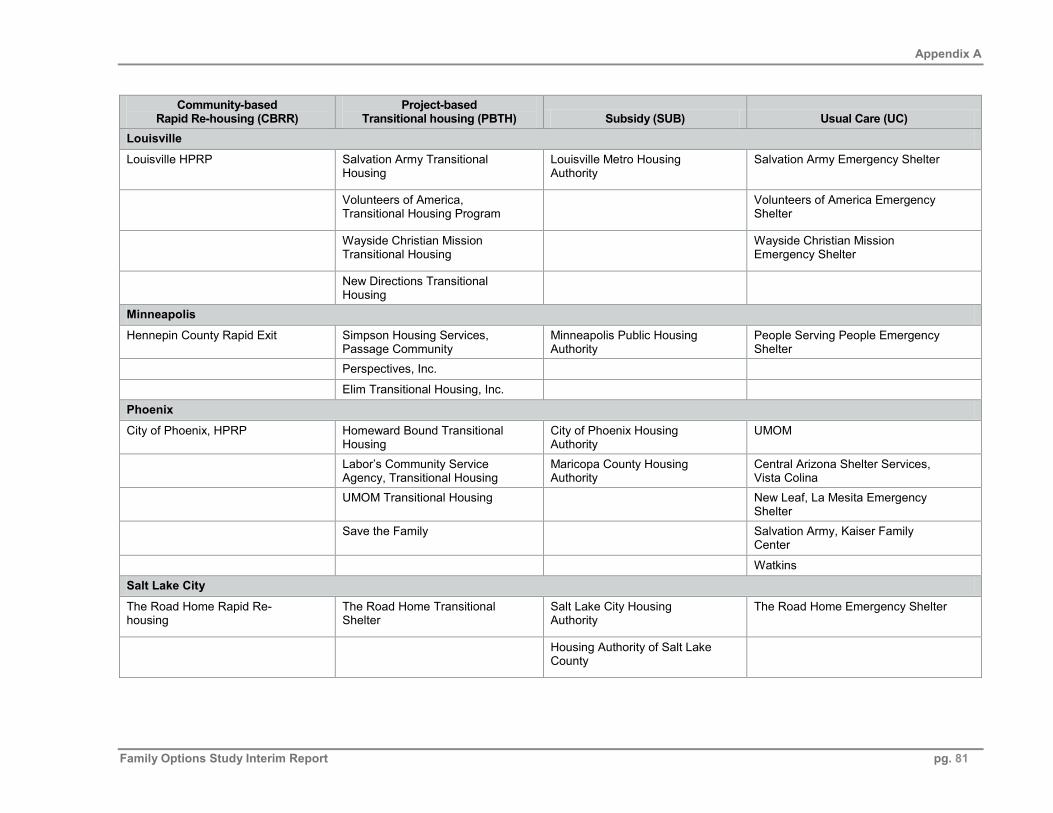
Exhibit A: Programs operating in study sites ..............................................................................................77
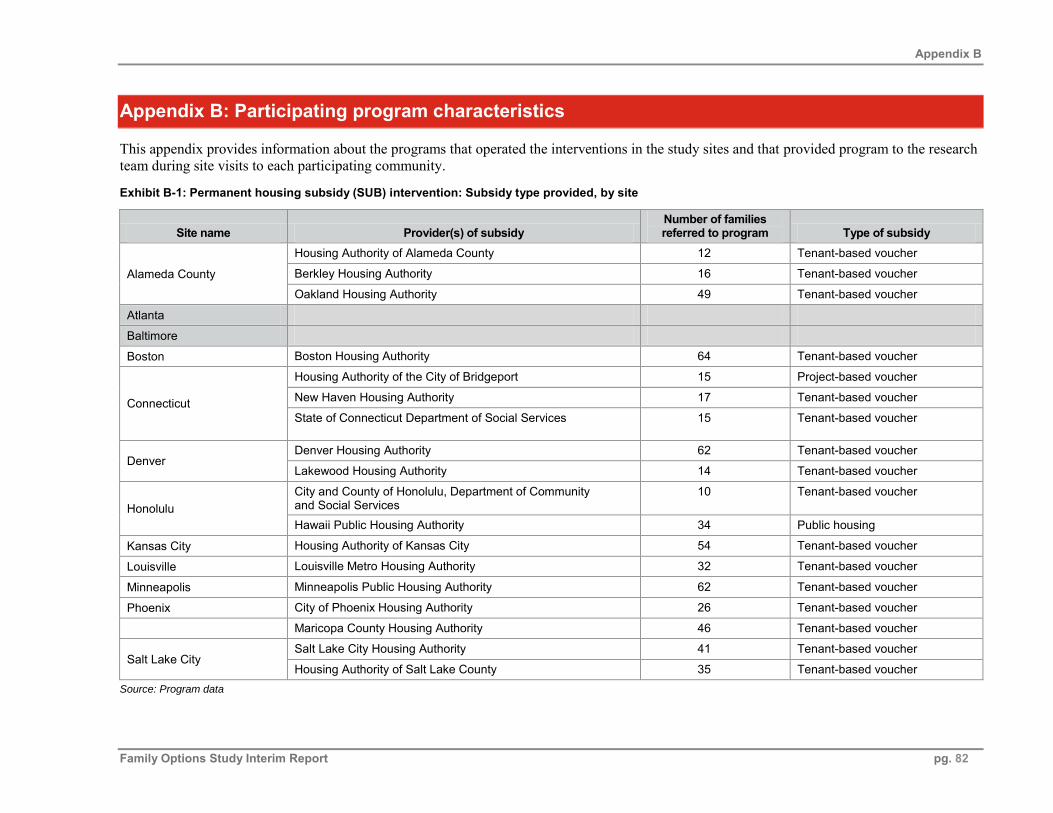
Exhibit B-1: Permanent housing subsidy (SUB) intervention: Subsidy type provided by site ...................82
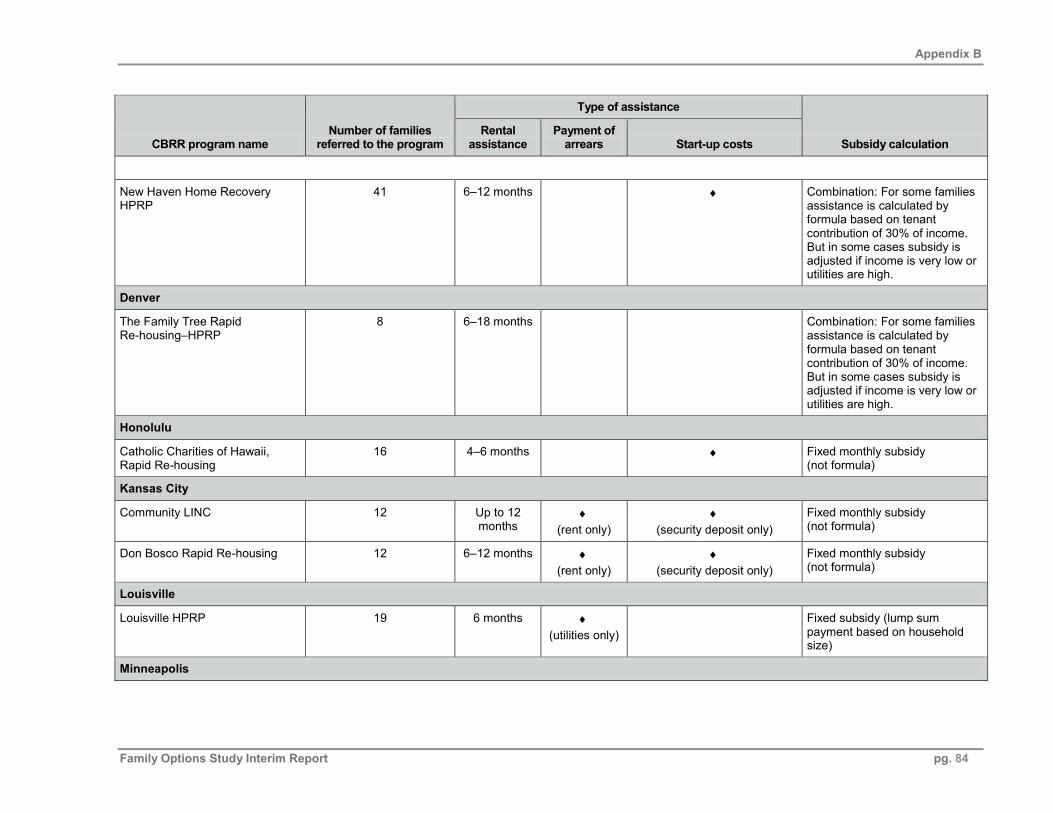
Exhibit B-2: Type of housing assistance provided through CBRR intervention .........................................83
Exhibit B-3: CBRR case management characteristics – ratio, frequency, and duration .............................86
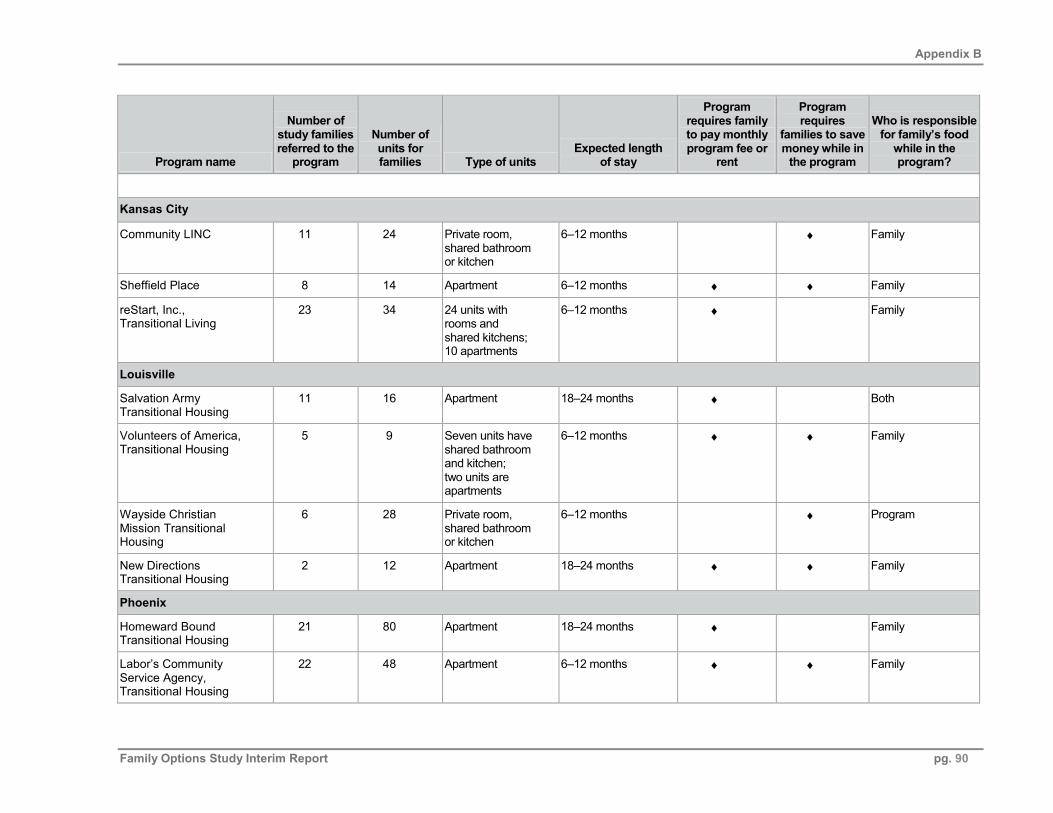
Exhibit B-4: Housing features of PBTH programs .....................................................................................88
Exhibit B-5: Case management characteristics for PBTH – ratio, frequency and duration ........................92
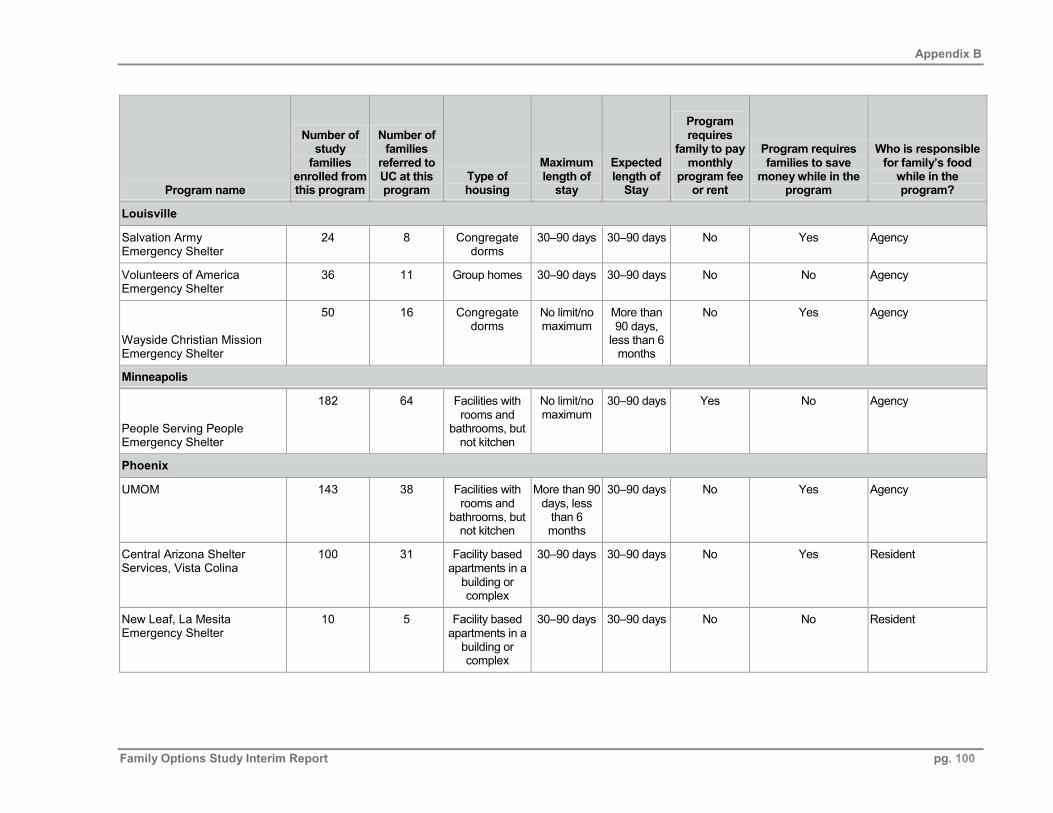
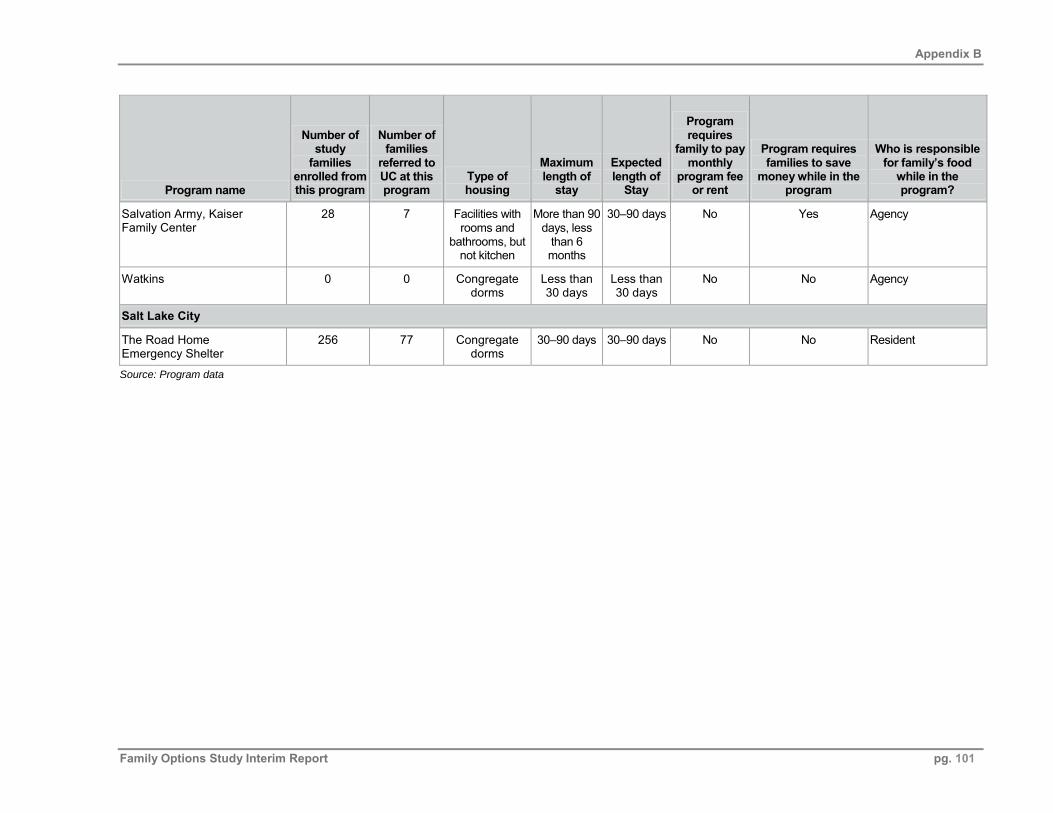
Exhibit B-6: Housing features of UC programs ..........................................................................................95
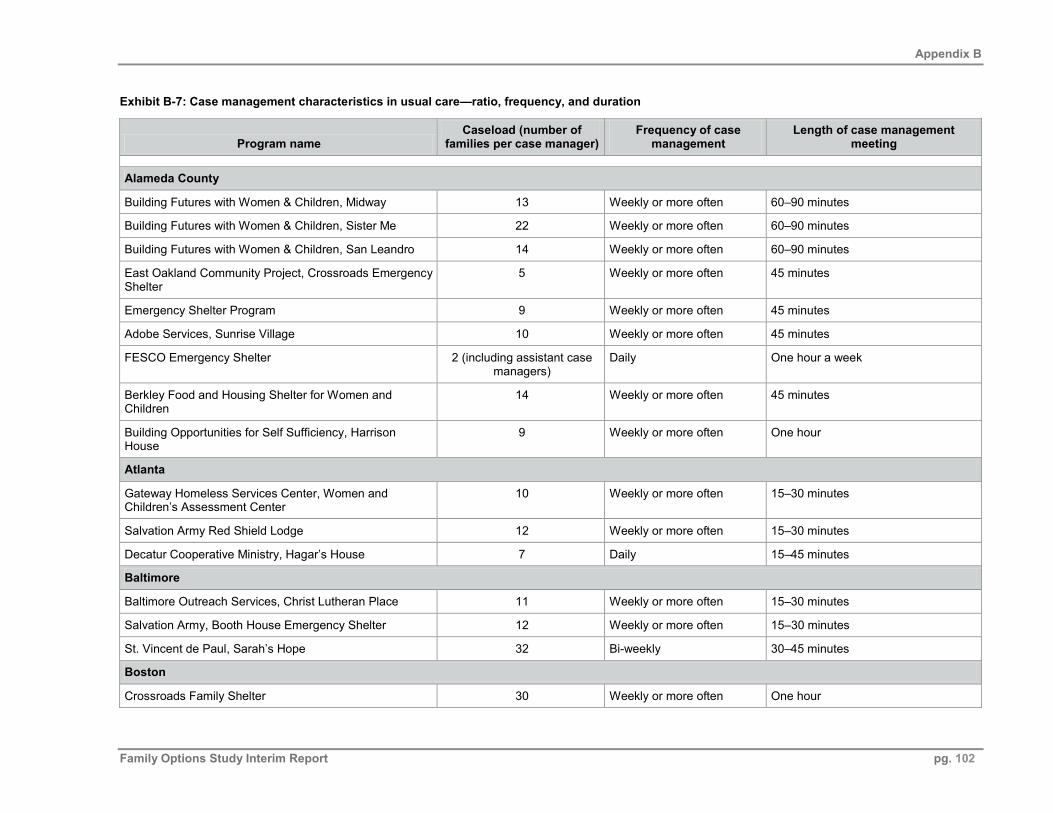
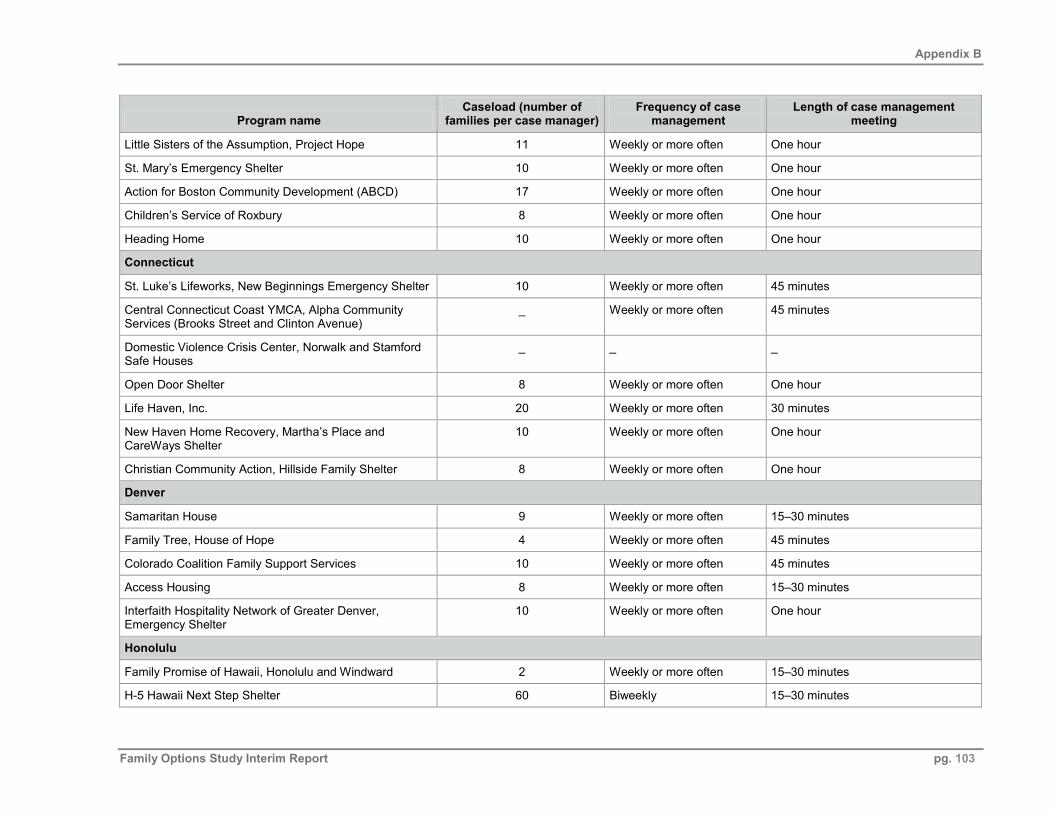
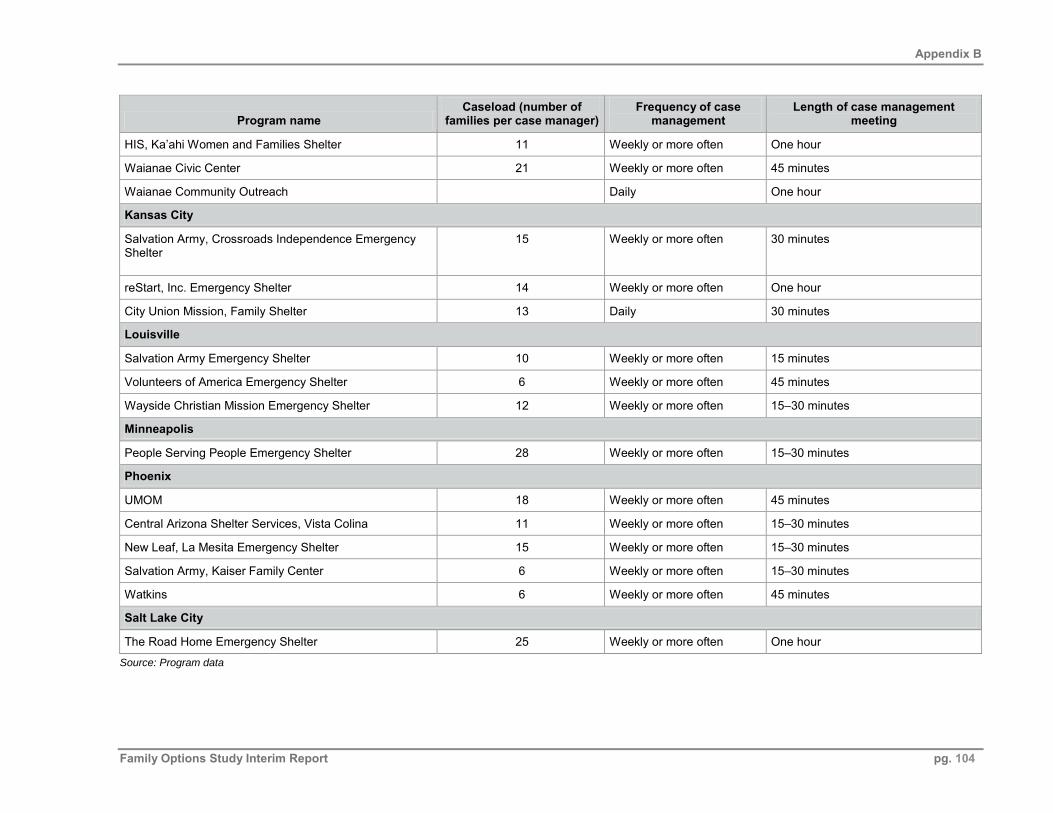
Exhibit B-7: Case management characteristics in usual care – ratio, frequency and duration ..................102
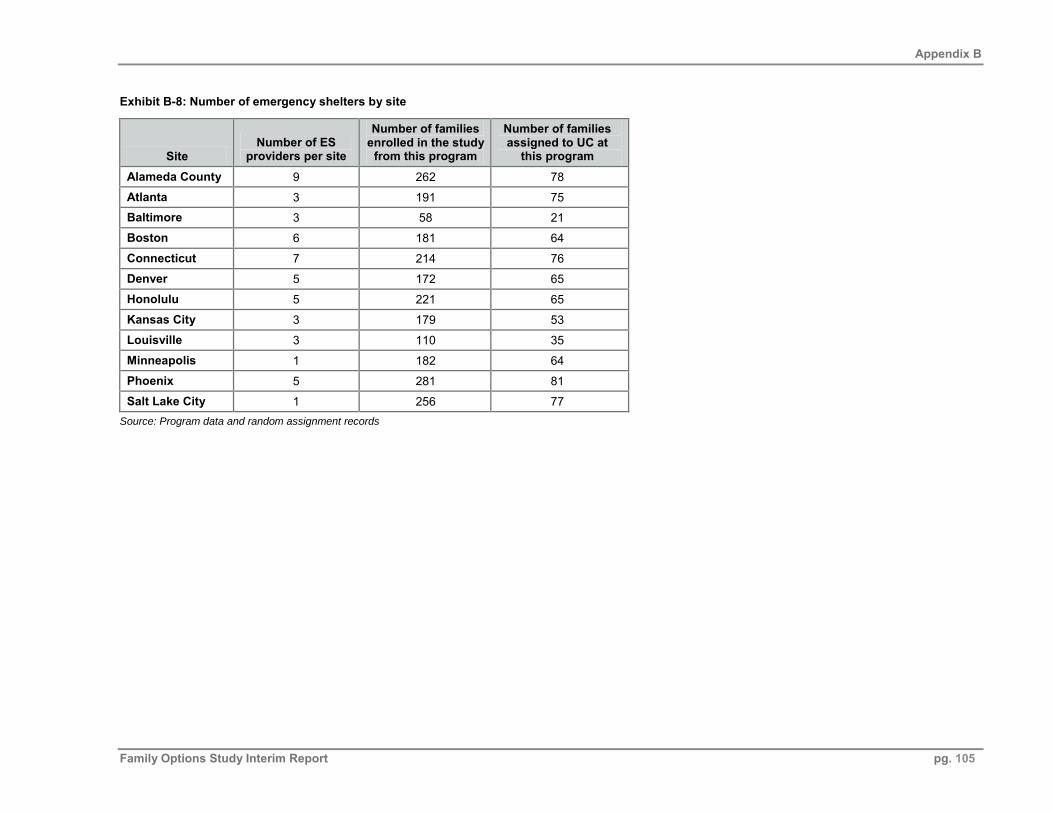
Exhibit B-8: Number of emergency shelters by site ..................................................................................105
Exhibit C-1: Random assignment probabilities by site .............................................................................106
Exhibit D-1: Family Options Study – baseline equivalency check, PBTH vs. UC ...................................107
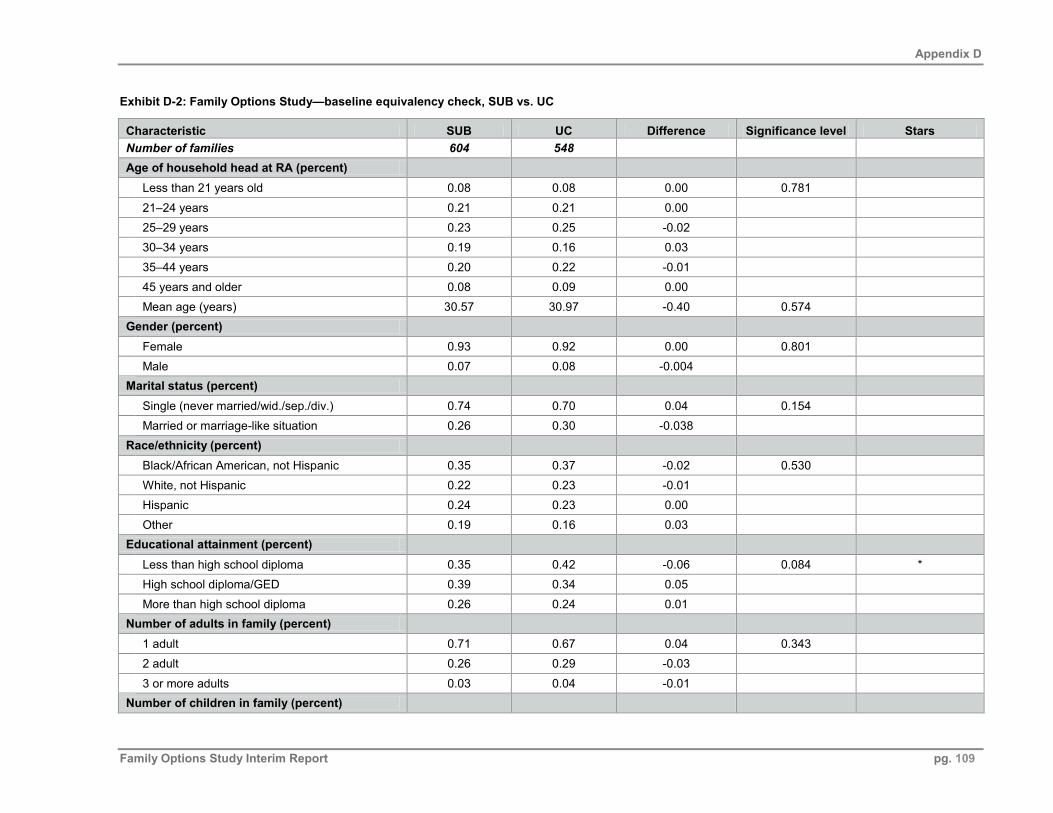
Exhibit D-2: Family Options Study – baseline equivalency check, SUB vs. UC .....................................109
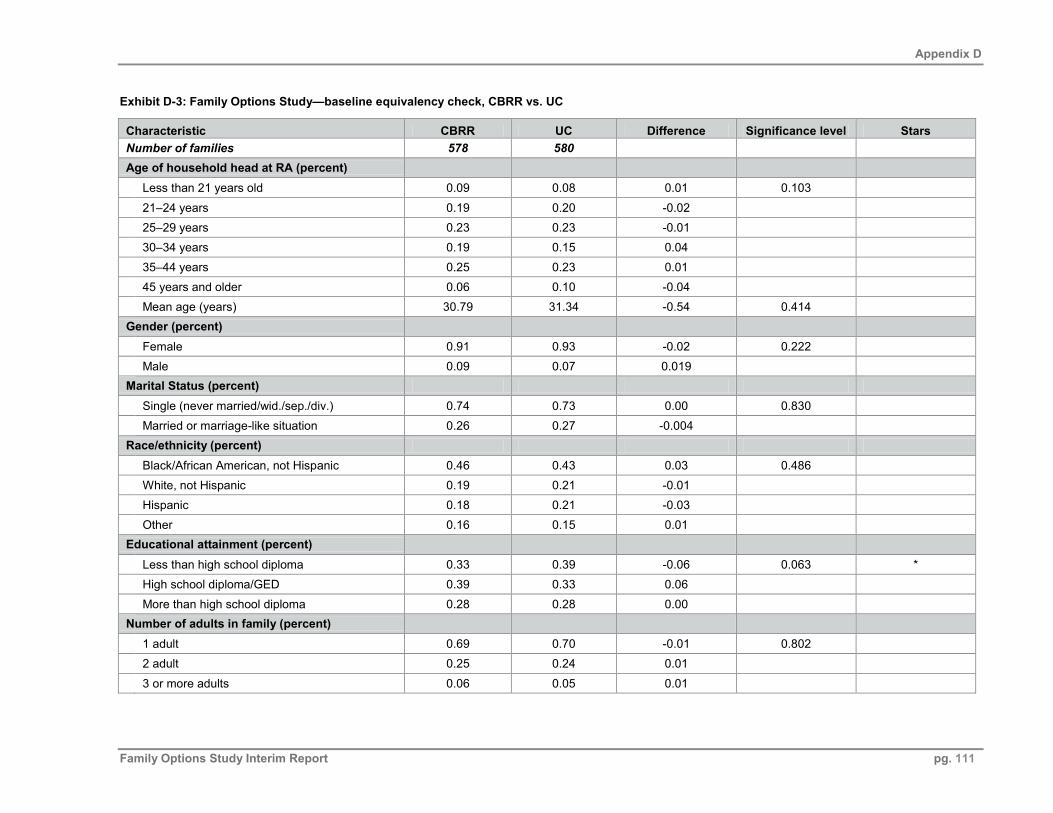
Exhibit D-3: Family Options Study – baseline equivalency check, CBRR vs. UC ..................................111
Exhibit D-4: Family Options Study – baseline equivalency check, PBTH vs. SUB .................................113
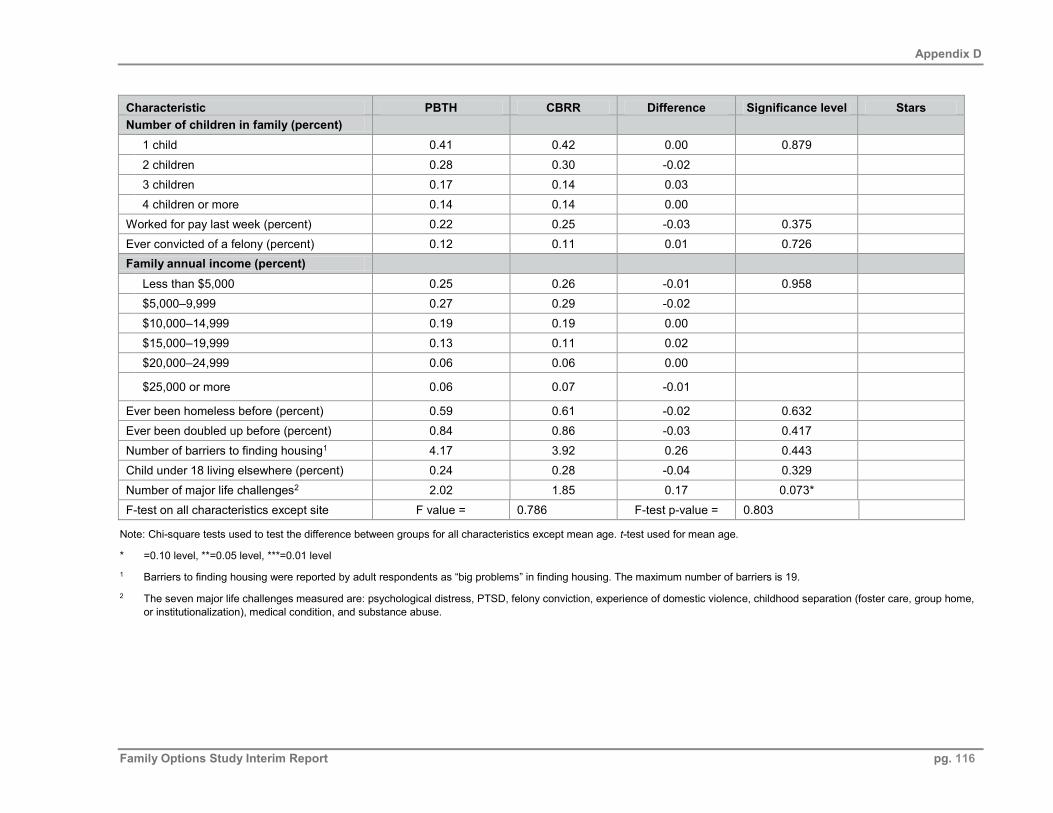
Exhibit D-5: Family Options Study – baseline equivalency check, PBTH vs. CBRR ..............................115
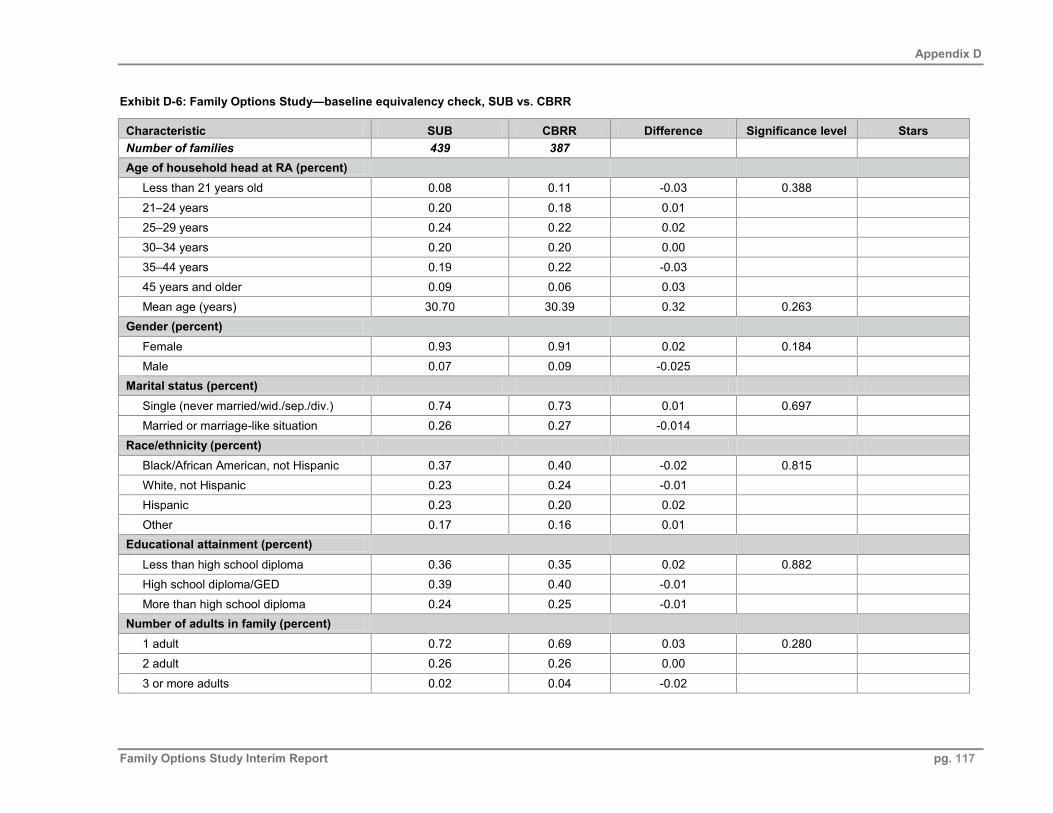
Exhibit D-6: Family Options Study – baseline equivalency check, SUB vs. CBRR ................................117
Executive Summary
Family Options Study Interim Report pg. xi
Executive Summary
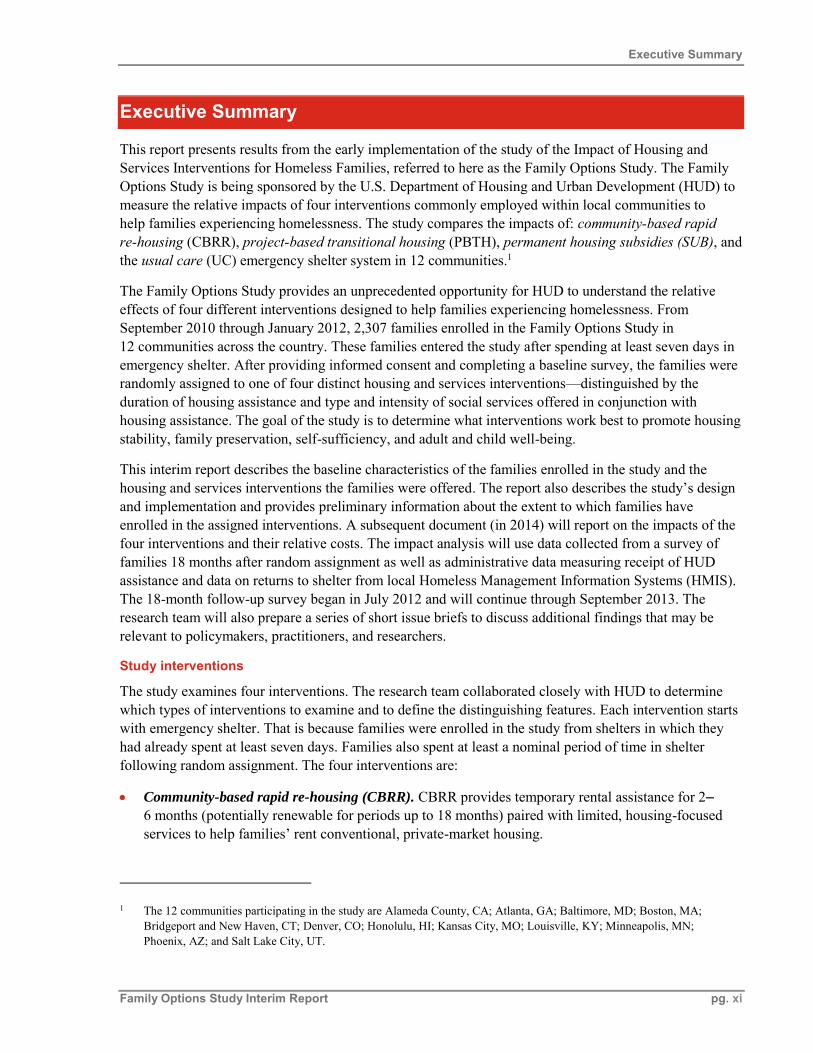
This report presents results from the early implementation of the study of the Impact of Housing and Services Interventions for Homeless Families, referred to here as the Family Options Study. The Family Options Study is being sponsored by the U.S. Department of Housing and Urban Development (HUD) to measure the relative impacts of four interventions commonly employed within local communities to help families experiencing homelessness. The study compares the impacts of: community-based rapid re-housing (CBRR), project-based transitional housing (PBTH), permanent housing subsidies (SUB), and the usual care (UC) emergency shelter system in 12 communities.1
The Family Options Study provides an unprecedented opportunity for HUD to understand the relative effects of four different interventions designed to help families experiencing homelessness. From September 2010 through January 2012, 2,307 families enrolled in the Family Options Study in 12 communities across the country. These families entered the study after spending at least seven days in emergency shelter. After providing informed consent and completing a baseline survey, the families were randomly assigned to one of four distinct housing and services interventions—distinguished by the duration of housing assistance and type and intensity of social services offered in conjunction with housing assistance. The goal of the study is to determine what interventions work best to promote housing stability, family preservation, self-sufficiency, and adult and child well-being.
This interim report describes the baseline characteristics of the families enrolled in the study and the housing and services interventions the families were offered. The report also describes the study’s design and implementation and provides preliminary information about the extent to which families have enrolled in the assigned interventions. A subsequent document (in 2014) will report on the impacts of the four interventions and their relative costs. The impact analysis will use data collected from a survey of families 18 months after random assignment as well as administrative data measuring receipt of HUD assistance and data on returns to shelter from local Homeless Management Information Systems (HMIS). The 18-month follow-up survey began in July 2012 and will continue through September 2013. The research team will also prepare a series of short issue briefs to discuss additional findings that may be relevant to policymakers, practitioners, and researchers.
Study interventions
The study examines four interventions. The research team collaborated closely with HUD to determine which types of interventions to examine and to define the distinguishing features. Each intervention starts with emergency shelter. That is because families were enrolled in the study from shelters in which they had already spent at least seven days. Families also spent at least a nominal period of time in shelter following random assignment. The four interventions are:
Community-based rapid re-housing (CBRR). CBRR provides temporary rental assistance for 2–6 months (potentially renewable for periods up to 18 months) paired with limited, housing-focusedservices to help families’ rent conventional, private-market housing.
1 The 12 communities participating in the study are Alameda County, CA; Atlanta, GA; Baltimore, MD; Boston, MA; Bridgeport and New Haven, CT; Denver, CO; Honolulu, HI; Kansas City, MO; Louisville, KY; Minneapolis, MN; Phoenix, AZ; and Salt Lake City, UT.
Executive Summary
Family Options Study Interim Report pg. xii
Project-based transitional housing (PBTH). PBTH is temporary housing (up to 24 months, withaverage expected stays of 6–12 months) in agency-controlled buildings or apartment units paired withintensive supportive services.
Subsidy (SUB). SUB is a permanent housing subsidy (usually a housing choice voucher), withpossible housing placement assistance but no other targeted services after placement.
Usual care (UC). UC is the emergency shelter from which families were recruited and any housing orservices that people would normally access from shelter in the absence of the first three interventions.
Among the interventions studied, CBRR and SUB provide rental subsidies for private market apartments or single-family homes, whereas PBTH provides temporary housing in project-based facilities. The expected length of assistance differs across interventions. Most UC shelters provide very short-term assistance; the median expected length of stay for families in UC shelters is 30–90 days. The median expected length of assistance for families referred to CBRR programs is 4–6 months; whereas the median expected length of stay for families referred to PBTH is 13–18 months. Finally, SUB assistance is indefinite, as long as tenants abide by the terms of the assistance—for example, cooperate with annual recertification of income used to determine the tenant’s share of the rent and continue to live in standard quality housing. In terms of supportive services, SUB provides only very limited housing placement services, CBRR provides case management focused primarily on housing and income growth, and UC shelters and PBTH both provide comprehensive assessments with intensive case management and formal linkages to internal agency and external services to address identified needs.
To compare the effects of the four interventions, the research team will analyze all six possible pairwise comparisons for the four outcomes, shown in Exhibit ES-1.
Exhibit ES-1: Six possible pairwise comparisons for the four outcomes
Random assignment design
The Family Options Study was conducted as a randomized experiment. To be eligible for the study, families had to have stayed in emergency shelter for seven or more days and had to include at least one child 15 years old or younger staying with the family. Each family that gave informed consent to participate in the study was randomly assigned to one of the available interventions. In an effort to maximize the likelihood that families randomly assigned to the study interventions could actually receive the assigned intervention, the research team established conditions that had to be met for random assignment to proceed.
Executive Summary
Family Options Study Interim Report pg. xiii
Intervention slots had to be available at the time of random assignment or anticipated within 30 days.Although providers of the interventions in the 12 communities that participated in the study hadcommitted program resources to the study, program slots were not always available at the same timethat the family was ready for random assignment.
Families had to meet program eligibility criteria for at least one available slot in two or moreinterventions. Providers of the interventions were not asked to modify their eligibility criteria.Instead, families ready for random assignment were asked questions intended to determine whetherthey would likely be eligible for a program. If their answers suggested that they would not be eligiblefor any of the local programs providing one of the interventions, they were not given a chance to berandomly assigned to that intervention.
The cumulative result of program availability and family eligibility was that most study families could not be considered for all four interventions at the time of random assignment. Of the 2,307 families enrolled in the study, 477 (21 percent) had all four assignment options available to them at random assignment. Another 1,565 (68 percent) families had three assignment options, and 265 (11 percent) families had two assignment options. UC was always one of the available interventions, as the family was already in the emergency shelter. PBTH was the intervention most likely to not be available at the time a family was ready for random assignment and also the program type most likely to have eligibility requirements that families were deemed unlikely to meet.
In comparing the interventions, a family will be included only in the pairwise comparisons of its assigned intervention with other interventions that were available and for which the family was eligible—that is, other interventions that were randomization options.
Baseline characteristics
To understand how the families in the study compare to the national homeless population, we compared them to two national estimates of family homelessness—HUD’s 2010 Annual Homelessness Assessment Report (AHAR) and the 1996 National Survey of Homeless Providers and Clients (NSHAPC) and to other studies of homeless families in particular communities.
Family composition
A typical family in the study consists of an adult female, about 29 years old, who has one or two children with her in the shelter. Thirty-one percent of families had more than one adult present at baseline. In most cases (27 percent of all families), families with two adults present were headed by couples.
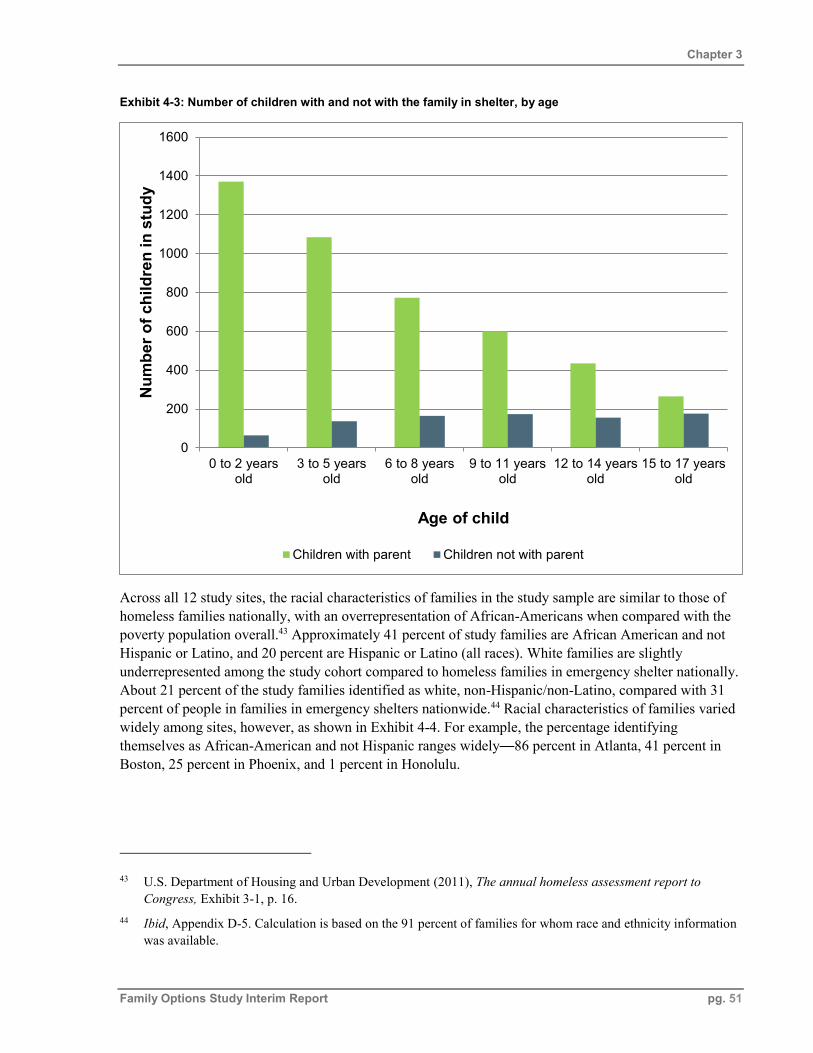
A plurality of families (44 percent) had just one child under 18 with them in the shelter, and another 30 percent had two children present, and 26 percent had three or more children present. Half of the families had a child under the age of three in the shelter, and 10 percent of adult respondents reported that they were pregnant.
The average size of families in the study is 3.29 persons. This is quite similar to the average size of families with children in emergency shelters and transitional housing nationally (3.37 persons) found in the AHAR data on families in 2010.
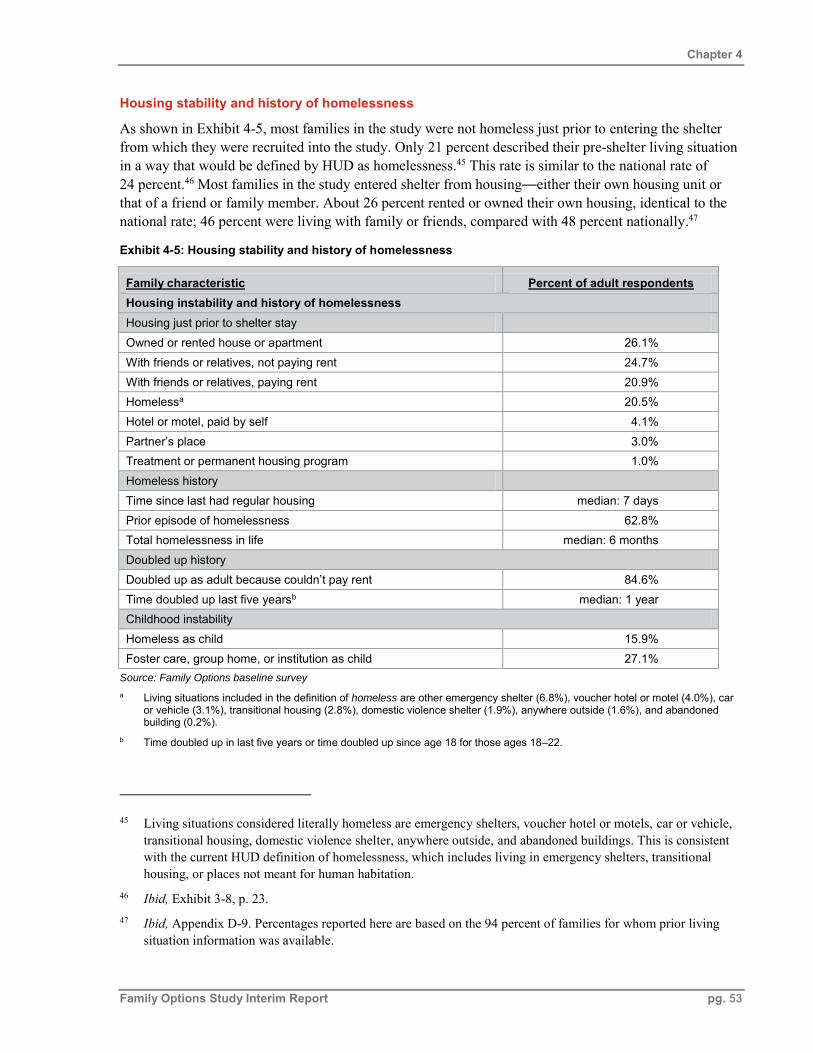
Housing stability and history of homelessness
For nearly two-thirds of the sample, this was not their first episode of homelessness. About 63 percent of adult respondents in the study had experienced homelessness at some other point in their lifetime, with
Executive Summary
Family Options Study Interim Report pg. xiv
16 percent of adult respondents having experienced homelessness as a child. For adult respondents with a history of homelessness, the median length of lifetime homelessness was six months.
Twenty-seven percent of adult respondents in this study’s sample had lived in foster care, group homes, or some institutional setting as a child, and 85 percent indicated that they were doubled up at some point as an adult, defined as “staying with family or friends because you couldn’t find or afford a place of your own.” NSHAPC showed very similar patterns of childhood housing instability among people who subsequently became homeless in 1996, with about 25 percent of the adults in homeless families reporting that they had been in foster care, a group home, or another institutional setting as a child.
Employment and other sources of income
Study information on employment, income, and program participation of families in the study provide insight into the severity of income barriers currently faced by families in emergency shelters. Most adult respondents in the study were not working at the time of enrollment (83 percent), and more than half had not worked for pay in the previous six months. For the 17 percent who were working at the time of enrollment, median hours at their main job were 30 hours a week, and median annualized earnings were about $12,000 per year. The median household income of all families in this study was $7,440 at the baseline interview.
Most families in the study receive some form of public assistance. Eighty-eight percent of families in the study reported receiving assistance from the Supplemental Nutrition Assistance Program (SNAP, formerly food stamps), 10 percent receive Supplemental Security Income (SSI) for someone in the family, and 41 percent receive Temporary Assistance to Needy Families (TANF). Most families in the study receive some combination of Medicaid benefits, state health insurance benefits, and State Children’s Health Insurance. Fourteen percent of families do not receive any of these types of health insurance benefits.
Other barriers to increasing income or finding housing
A history of drug use within the past year was reported by 14 percent of the adult respondents, and 11 percent responded to survey questions in a way that suggested alcohol abuse within the past year.2 Approximately 22 percent of adult respondents gave survey responses that indicate symptoms of post-traumatic stress disorder (PTSD), 22 percent reported symptoms of serious psychological distress, and 30 percent reported evidence of one or the other.
The baseline survey asked families explicitly about factors that would affect their ability to find a place to live. Many reported that they either had a poor rental history (26 percent had been evicted) or that they had never been a leaseholder at all (35 percent). Some families (14 percent) reported that at least one adult in the family had been convicted of a felony for drugs or other offenses. In 11 percent of families, the adult respondent had a felony conviction.
2 The baseline survey asked the four items in the Rapid Alcohol Problem Screen-4 (RAPS-4; Cherpitel, 2000). An affirmative answer to any of the four items indicates an alcohol problem. The baseline survey also asked seven items regarding use of illegal drugs, six of which are included in the Drug Abuse Screening Tool (Skinner, 1982). An affirmative answer to any of these seven items indicates a drug problem.
Executive Summary
Family Options Study Interim Report pg. xv
Intervention take-up
Not all families who are assigned to an intervention end up receiving the housing and other services associated with the intervention. Families assigned to CBRR, PBTH, or SUB while in shelter had to take a next step—contacting the provider of the assistance and enrolling in the program. Those whose enrollment in CBRR or SUB constitutes an offer of rental assistance to be used in private market housing must also find a housing unit with a willing landlord and lease the housing. For families assigned to PBTH and for a few families for whom the SUB offer was public housing or project-based assisted housing, enrolling in the program is close to synonymous with moving in. Not all families take these further steps, so the “take-up” of the intervention is less than 100 percent.
The study has already collected data from the providers of the interventions showing which families enrolled in each program and which families moved in. In the future, the study will also use data from tracking and follow-up surveys on where they families report they live, as well as HUD administrative data (for SUB), and HMIS data (for PBTH) to document participation in each intervention. The information on take-up presented in this report draws upon the enrollment verification data only, through June 15, 2012.
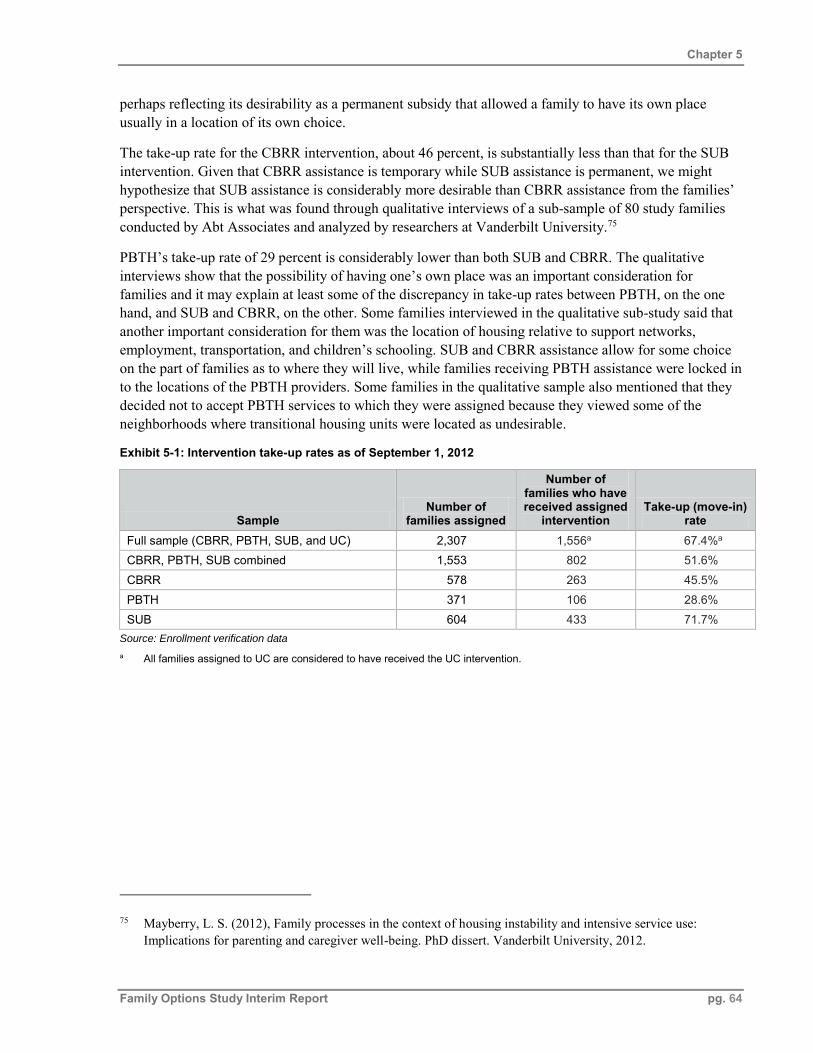
Families assigned to UC all have received their assigned intervention, as they are already in the shelter. As expected, the other three interventions—CBRR, PBTH, and SUB—have take-up rates considerably below 100 percent. As of September 1, 2012, SUB has the highest take-up rate, at about 64 percent, reflecting its desirability as a permanent subsidy that usually allows for having one’s own place in a location of one’s choice. (Most of the SUB units offered to families in the study were housing choice vouchers.) The take-up rate for CBRR was about 46 percent, and the take-up rate for PBTH was 29 percent. Some families assigned to SUB may take more than six months after random assignment to move in to a rental unit. It is possible that some families who have not yet enrolled will end up pursuing and receiving their assigned intervention; the final take-up rates may change slightly from those presented in this report.
The lease-up “success rate” for housing vouchers for families in this study is higher than that found in other studies of vouchers. The lease-up success rate is the percentage of families who enroll in the program and are provided vouchers and ultimately lease a housing unit subsidized by the program. This rate differs from the take-up rate for SUB in that the take-up rate includes all families assigned to the SUB intervention in its denominator, including those who never enroll in the program. When the lease-up success rate is calculated for those families in this study who were issued vouchers, we find that the rate is about 94 percent.
Implications of program availability, eligibility, and take-up
An analysis of the impacts of alternative interventions for homeless families will not be available until 2014, by which time the 18-month follow-up survey will be completed and the results will have been analyzed. However, the process of implementing this random assignment study already provides some insights about how homeless assistance is currently delivered relative to the needs of families who become homeless.
Homeless system resources are highly constrained, and project-based models present incommunities do not have the flexibility to shift resources to either accommodate surges in demand orconserve resources during declines in demand.
Executive Summary
Family Options Study Interim Report pg. xvi
Homeless programs have imposed eligibility criteria that exclude many of the families in shelter whoneed the assistance.
Families who are homeless do not always take up the program that is offered to them, which suggeststhat programs do not always deliver assistance that families perceive as more valuable than theirother options.
Families who are homeless are highly motivated to pursue opportunities for permanent housingsubsidies and are successful in navigating the application processes and rules associated with them.
PBTH enrollment was constrained by availability, eligibility, and family choice. Thus, while project-based transitional housing is a model commonly employed across the country, it does not seem to be accessible or attractive to a high proportion of families residing in shelter for more than seven days who are presumably among those who need assistance the most.
In contrast, the SUB intervention, usually a housing choice voucher, was the most accessible model in the communities in which the study succeeded in gaining commitments from public housing agencies (PHAs) to provide permanent housing subsidies for families in the study. When given the opportunity to use a permanent housing subsidy, most of the study families were able to pass the subsidy program’s eligibility criteria, and a high percentage of families enrolled in the program and were able to use the subsidy.
Summary
The platform in place for this study provides a strong basis for further research on homelessness and highly vulnerable families, a population that has not been studied to this extent previously and is not readily found in other studies of low-income families. The participant baseline, tracking, and follow-up surveys will provide rich longitudinal data about a wide range of characteristics for families who enrolled in the study, including the children present and those not accompanying their parents at the time of enrollment. Supplemental funding from the Eunice Kennedy Shriver National Institute for Child Health and Human Development (NICHD) promises to yield important information about children’s outcomes that is unavailable from other sources.
We acknowledge that sample size and early indications of take-up rates may affect our ability to detect impacts for some of the pairwise comparisons. At the same time, the random assignment design was implemented successfully, yielding well balanced groups for estimation of impacts, and presents the best opportunity to date to understand the effects of the interventions being studied.
Chapter 1
Family Options Study Interim Report pg. 1
Chapter 1: Introduction
This report presents results from the early implementation of the study of the Impact of Housing and Services Interventions for Homeless Families, referred to here as the Family Options Study. The Family Options Study is being sponsored by the U.S. Department of Housing and Urban Development (HUD) to measure the relative impacts of four interventions commonly employed within local communities to help families experiencing homelessness. The study compares the impacts of community-based rapid re-housing (CBRR), project-based transitional housing (PBTH), permanent housing subsidies (SUB), and the usual care (UC) emergency shelter system in 12 communities.3
The report describes the study sites, the features of the housing and services interventions studied, and the study implementation. The report also presents findings on the baseline characteristics of the 2,307 families enrolled in the study. The purpose of the report is to describe the study sample for future reference, to provide context for interpreting later findings on intervention impacts, and to compare and contrast the interventions being studied. The report also provides some early information about the take-up of the interventions by families in the study.
1.1 Background
The objective of the Family Options Study is to provide research evidence to help federal policymakers, community planners, and local practitioners make sound decisions about the best ways to address homelessness among families. The ultimate goal of the study is to determine what interventions work best to promote housing stability, family preservation, self-sufficiency, and adult and child well-being for families who are homeless. The study has been conducted as a rigorous, multi-site experiment in which eligible families who consented to participate were randomly assigned to one of CBRR, PBTH, SUB, and UC. Within the limits of statistical power, the study will also analyze what types of families benefit most from each intervention.
Families were invited to participate in the study if they had been in emergency shelter for at least seven days. For the study, families were defined as households with at least one adult accompanied by at least one child age 15 or under. Families were referred to the study team by emergency shelter case managers. Although the study aimed to invite all eligible families in shelter to enroll in the study, some families may not have been referred by case managers and a small number (13 families altogether) indicated that they were not interested in enrolling and declined to do so. If case managers determined that a family would be appropriate for permanent supportive housing, which is not one of the four interventions, and if permanent supportive housing was available in the community, case managers were asked to refer families directly to permanent supportive housing rather than to the study.
The Family Options Study began in October 2008. During the first year of the study, the research team developed specifications for the interventions and the study methodology. In 2009, the research team developed site selection criteria and began recruiting 12 communities to participate in the study. Site recruitment was completed in 2010 and family enrollment began in September of that year. Enrollment continued until the end of January 2012. Altogether, 2,307 families enrolled in the study. The research
3 The 12 communities participating in the study are Alameda County, CA; Atlanta, GA; Baltimore, MD; Boston, MA; Bridgeport and New Haven, CT; Denver, CO; Honolulu, HI; Kansas City, MO; Louisville, KY; Minneapolis, MN; Phoenix, AZ; and Salt Lake City, UT.
Chapter 1
Family Options Study Interim Report pg. 2
team administered a baseline survey when the families enrolled, and since enrollment, the team has attempted to contact families every three months to maintain contact information. Every six months, the research team administers a short interview to collect information about the families’ housing situations and family composition and to update contact information.
This document—the second in a series of reports about the study—focuses on study implementation and baseline characteristics of the research sample. An earlier report described the research design and analysis plan4 for estimating impacts of the four interventions compared to one another. A final report will document findings from the impact analysis, and a series of short issue briefs will be produced to highlight additional findings that may be particularly relevant to policymakers, practitioners, or researchers.
This report is organized as follows. This chapter provides a brief overview of the study, including the research questions, study sites, interventions, random assignment process, and enrollment results. Chapter 2 discusses the characteristics of the four interventions actually offered to study families in the sites. These descriptions focus on key features of the housing assistance, assessments, case management, and services offered to families in the programs that provide each of the interventions. Chapter 3 discusses implementation of the study, approaches used to recruit study families and to randomly assign them to the study interventions, and challenges encountered in implementation. The chapter also includes a discussion of eligibility requirements in place for the interventions and how availability of interventions and family eligibility affected random assignment in the sites. Chapter 4 presents descriptive statistics about the families enrolled in the study, taken from the baseline survey conducted at the time of random assignment. The chapter also discusses tests to ensure that random assignment worked as intended to provide well-matched groups of families based on baseline characteristics. Chapter 5 discusses the extent to which families have enrolled in the interventions to which they were assigned. Chapter 6 is a summary and presents some insights about how the homeless services system for families works, based on the early implementation of the study. Several appendices support the report. Appendix A is a listing, by site, of all homeless programs involved in the study. Appendix B provides detailed information about the housing and services programs that participated in the study. Appendix C provides information about random assignment probabilities. Appendix D presents supplemental tables showing baseline characteristics of the study families for each of the pairwise comparisons that will be analyzed.
1.2 Research questions
The study seeks to answer six questions:
1. What is the relative effectiveness of homeless interventions in ensuring housing stability ofhomeless families?
2. Are the same interventions that are effective for short-term stability of homeless familieseffective for longer-term stability as well?
3. What is the relative effectiveness of homeless interventions in ensuring the well-being ofhomeless parents and self-sufficiency of homeless families?
4 Gubits, D., et al. (2012), Family options study: Revised data collection and analysis plan. Prepared for the U.S. Department of Housing and Urban Development and Research. Bethesda, MD: Abt Associates Inc.
Chapter 1
Family Options Study Interim Report pg. 3
4. Do some interventions promote family preservation and benefit children’s well-being more thanother interventions?
5. Are different homeless interventions more effective for some categories of homeless families thanfor others?
6. What features of housing and services explain the effectiveness (or lack thereof) of varioushomelessness interventions?
1.3 Interventions studied
The study examines four interventions. The research team collaborated closely with HUD to decide what types of interventions should be studied and to define the distinguishing features. Each intervention starts with emergency shelter, since families were enrolled in the study from shelters in which they had already spent at least seven days, and even after enrollment, the family would spend at least a nominal period of time in shelter following random assignment. The four interventions are:
Community-based rapid re-housing (CBRR). CBRR provided temporary rental assistance for 2–6 months (potentially renewable for periods up to 18 months) paired with limited, housing-focusedservices to help families rent conventional, private-market housing.
Project-based transitional housing (PBTH). PBTH involved temporary housing (up to 24 months,with average expected stays of 6–12 months) in agency-controlled buildings or apartment units pairedwith intensive supportive services.
Subsidy (SUB). The SUB intervention is a permanent housing subsidy, usually a Housing ChoiceVoucher, with possible housing placement assistance, but no other targeted services after placement.
Usual care (UC). Emergency shelter from which families were recruited and any housing or servicesthat people would normally access on their own from shelter in the absence of the first threeinterventions.
Chapter 2 provides detailed descriptions of the interventions and compares their key features.
1.4 Site selection
After defining the distinguishing features of the study interventions, the research team had to recruit sites in which to conduct the study. To select and recruit the sites, the research team canvassed a large group of communities across the country to locate cities, counties, and metropolitan areas in which the number of families entering emergency shelter was considered sufficient to achieve enrollment goals and where the intervention models defined for the study were present. The homeless assistance program providers in selected communities had to be willing to implement a random assignment evaluation. Participating in the study meant that programs had to agree to commit program slots to families in the study and to comply with random assignment as the method of determining which families would be referred to their programs from participating emergency shelters. The team worked closely with the Continuum of Care (CoC) and local homeless system leaders to collect information about the homeless assistance system and then
Chapter 1
Family Options Study Interim Report pg. 4
negotiated with program providers to determine if a sufficient number of program slots in each intervention were available in the site to make the study viable in the community.5
By definition, all sites were assumed to have UC. The study team initially sought to select sites that had all three of the other defined interventions (CBRR, PBTH, and SUB) available. Later, in collaboration with HUD, we agreed that in the interest of securing sufficient numbers of families for the study, it would be acceptable to include some sites in which only two of the other defined interventions were available. Appendix A lists the names of the programs providing the interventions in each study site.
The research team recruited 12 sites to conduct the study. Exhibit 1-1 lists the 12 sites and the number of families assigned to each intervention in each site.
Exhibit 1-1: Study sites—interventions available and participant enrollment by intervention by site
Site CBRR PBTH SUB UC Total enrolled participants
Alameda County 57 50 77 78 262 Atlanta 74 42 75 191 Baltimore 20 17 21 58 Boston 53 64 64 181 Connecticut 73 18 47 76 214 Denver 8 23 76 65 172 Honolulu 46 66 44 65 221 Kansas City 30 42 54 53 179 Louisville 19 24 32 35 110 Minneapolis 52 4 62 64 182 Phoenix 63 65 72 81 281 Salt Lake City 83 20 76 77 256 TOTAL 578 371 604 754 2,307
Source: Random assignment records
As indicated in the exhibit, all four interventions were offered in nine sites. Two sites, Atlanta and Baltimore, did not offer SUB. In Boston, PBTH was not offered at all, and in Minneapolis, PBTH was so limited that only four families could be assigned to it. In Denver, the CBRR intervention was not widely available and, therefore, only eight families were assigned to this intervention.
Part of the site recruitment process involved confirming that all programs included in the study were good representatives of their assigned intervention. The research team started by defining the distinguishing features of the interventions along dimensions of the housing assistance (subsidy duration and level) and presence of dedicated services linked to the housing assistance. The challenge in this endeavor was that shorthand terms used by practitioners and researchers, such as “transitional housing” or “supportive housing,” do not reflect uniform approaches. In reality, as Rog and Randolph (2002) note, even when programs of a particular “type” are specifically chosen for study, their characteristics can overlap considerably with other programs that nominally use an approach labeled in a different way. Therefore,
5 The Connecticut site includes the cities of Bridgeport and New Haven, as well as providers in some of the surrounding cities and towns that participated in the local CoCs.
Chapter 1
Family Options Study Interim Report pg. 5
during initial site selection, the team visited potential study programs (and interviewed some by phone), collected data on their operations, and completed an assessment for each candidate program. We selected programs that fit our definitions of the interventions based on our assessments, rather than based on programs’ self-descriptions. Exhibit 1-2 shows the number of providers that agreed to participate in the study at each site.
Exhibit 1-2: Study sites—number of programs by site and intervention
Site CBRR PBTH SUB UC
Alameda County 1 7 3 9
Atlanta 4 7 4 Baltimore 2 5 3 Boston 2 1 8 Connecticut 2 3 3 10 Denver 1 3 2 5 Honolulu 6 7 2 6 Kansas City 5 3 1 3 Louisville 1 4 1 3 Minneapolis 1 2 1 1 Phoenix 1 4 2 4 Salt Lake City 1 1 2 1 TOTAL 27 46 18 57
Source: Site recruitment data and program data
During enrollment, the research team also visited all programs in which at least five study families participated to collect additional information about program features and operations. Chapter 2 describes and contrasts the interventions that participating families received.
1.5 Characteristics of participating sites
The 12 study sites represent a diverse range of geographic locations, size, population, and housing and labor market characteristics. To provide context for the impact analysis, the exhibits in this section display descriptive information about the study sites, including the population of families experiencing homelessness and the demographic, economic, and housing market conditions present in the communities at the time study enrollment began in 2010.6 Although not a randomly selected sample of communities, the sites are varied in geography and conditions that are related to homelessness. The sites are located in all five of the Census Bureau-designated regions in the country. Exhibit 1-3 displays the geographic coverage of the sites.
6 Ten of the study sites began enrollment in the fall of 2010; two sites (Baltimore and Louisville) began enrolling families in the study during spring 2011.
Chapter 1
Family Options Study Interim Report pg. 6
Exhibit 1-3: Location of study sites
Exhibit 1-4 provides the 2010 U.S. Census population data, as well as poverty rates and median income for each site. Study sites include large metropolitan regions such as Phoenix (Maricopa County) with more than 3.8 million residents, and Alameda County and Minneapolis/surrounding Hennepin County, with more than 1.1 million residents each. Smaller metropolitan regions included in the study were Salt Lake City (1.02 million), Louisville (741,096), and Kansas City (674,158). Other city study sites with populations of between 420,000 and 621,000 included Atlanta, Baltimore, Boston, and Denver. Honolulu (337,256) and the combined site of Bridgeport and New Haven (274,008) were the sites with the smallest populations.
Poverty rates varied among study sites. The Bridgeport–New Haven, Connecticut site had the highest poverty rate, with 26.4 percent of the population living in poverty in 2010. Atlanta had a similarly high rate of 26.1 percent. Five sites—Baltimore, Boston, Denver, Kansas City, and Louisville—had poverty rates between 17 and 26 percent, above the national average of 15.3 percent. Only three sites, Alameda County, Minneapolis/Hennepin County, and Salt Lake City and County, had poverty rates lower than the national average. Honolulu and Phoenix had poverty rates close to the national average of 15.3 percent. Median household incomes ranged from $67,169 in Alameda County to $37,021 in the Connecticut site. Five sites—Atlanta, Boston, Denver, Kansas City, and Louisville—had median household incomes between $40,000 and $50,000. At four sites—Honolulu, Minneapolis, Phoenix, and Salt Lake City—the median household income fell between $50,000 and $60,000.
Chapter 1
Family Options Study Interim Report pg. 7
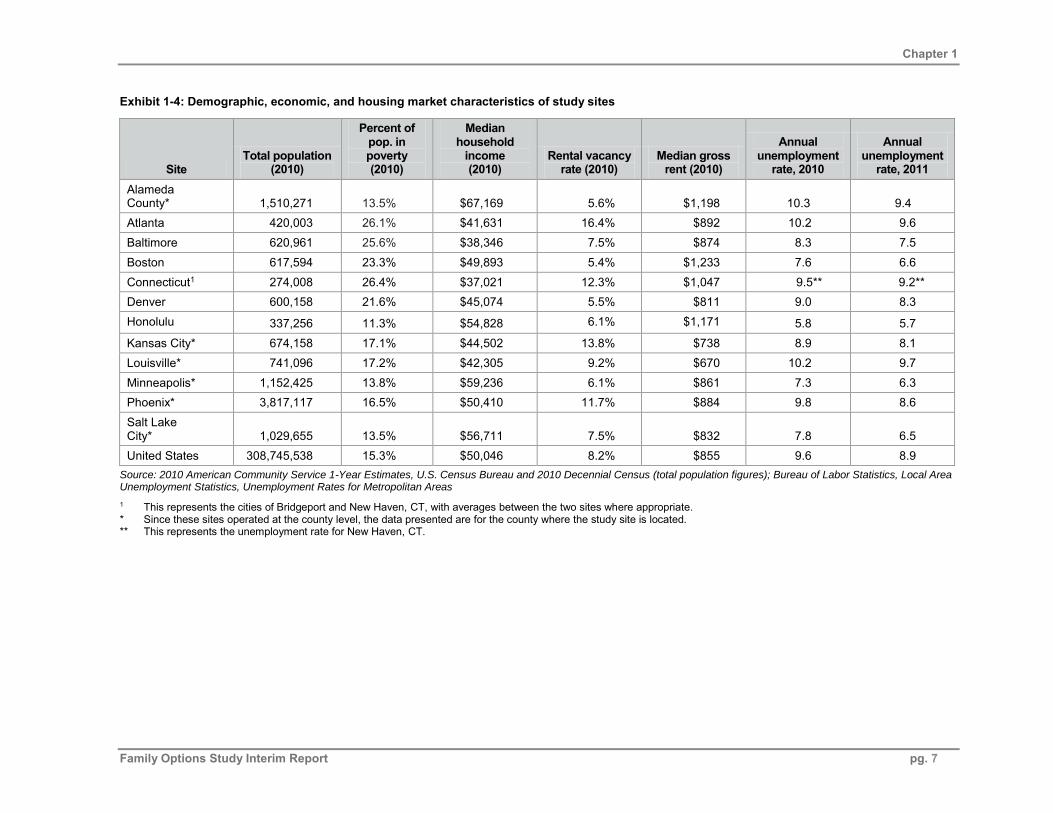
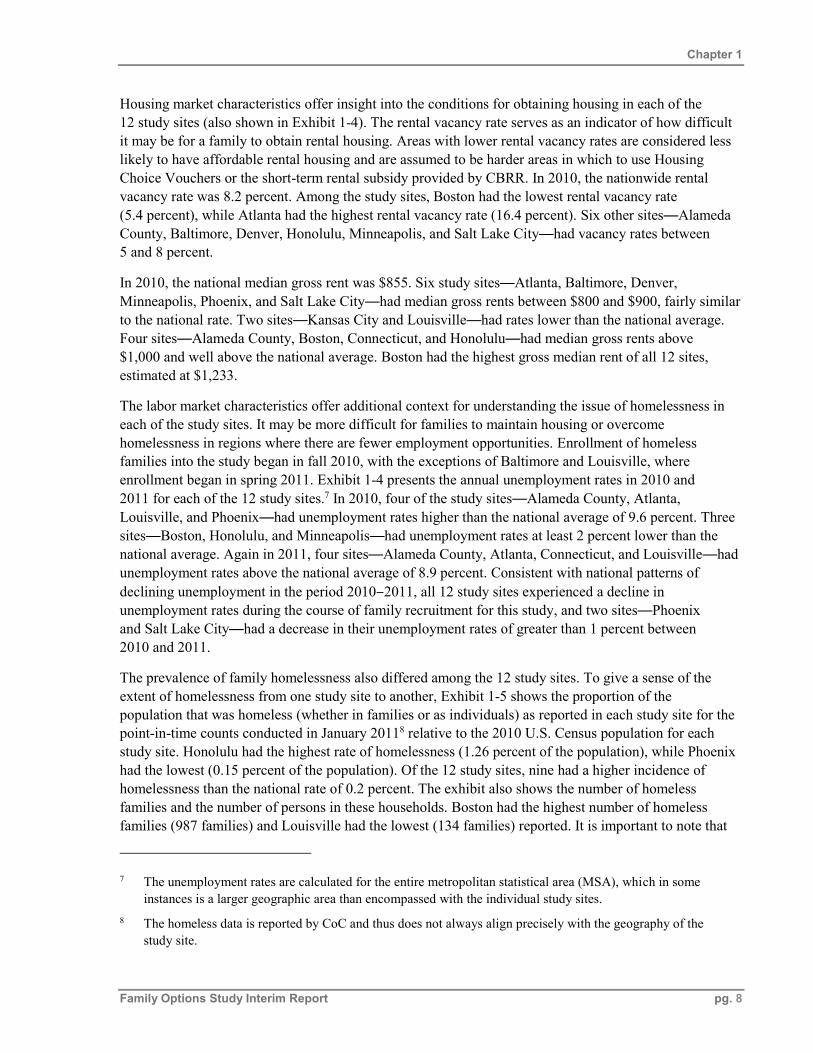
Exhibit 1-4: Demographic, economic, and housing market characteristics of study sites
Source: 2010 American Community Service 1-Year Estimates, U.S. Census Bureau and 2010 Decennial Census (total population figures); Bureau of Labor Statistics, Local Area Unemployment Statistics, Unemployment Rates for Metropolitan Areas
1 This represents the cities of Bridgeport and New Haven, CT, with averages between the two sites where appropriate. * Since these sites operated at the county level, the data presented are for the county where the study site is located.** This represents the unemployment rate for New Haven, CT.
Chapter 1
Family Options Study Interim Report pg. 8
Housing market characteristics offer insight into the conditions for obtaining housing in each of the 12 study sites (also shown in Exhibit 1-4). The rental vacancy rate serves as an indicator of how difficult it may be for a family to obtain rental housing. Areas with lower rental vacancy rates are considered less likely to have affordable rental housing and are assumed to be harder areas in which to use Housing Choice Vouchers or the short-term rental subsidy provided by CBRR. In 2010, the nationwide rental vacancy rate was 8.2 percent. Among the study sites, Boston had the lowest rental vacancy rate (5.4 percent), while Atlanta had the highest rental vacancy rate (16.4 percent). Six other sites—Alameda County, Baltimore, Denver, Honolulu, Minneapolis, and Salt Lake City—had vacancy rates between 5 and 8 percent.
In 2010, the national median gross rent was $855. Six study sites—Atlanta, Baltimore, Denver, Minneapolis, Phoenix, and Salt Lake City—had median gross rents between $800 and $900, fairly similar to the national rate. Two sites—Kansas City and Louisville—had rates lower than the national average. Four sites—Alameda County, Boston, Connecticut, and Honolulu—had median gross rents above $1,000 and well above the national average. Boston had the highest gross median rent of all 12 sites, estimated at $1,233.
The labor market characteristics offer additional context for understanding the issue of homelessness in each of the study sites. It may be more difficult for families to maintain housing or overcome homelessness in regions where there are fewer employment opportunities. Enrollment of homeless families into the study began in fall 2010, with the exceptions of Baltimore and Louisville, where enrollment began in spring 2011. Exhibit 1-4 presents the annual unemployment rates in 2010 and 2011 for each of the 12 study sites.7 In 2010, four of the study sites—Alameda County, Atlanta, Louisville, and Phoenix—had unemployment rates higher than the national average of 9.6 percent. Three sites—Boston, Honolulu, and Minneapolis—had unemployment rates at least 2 percent lower than the national average. Again in 2011, four sites—Alameda County, Atlanta, Connecticut, and Louisville—had unemployment rates above the national average of 8.9 percent. Consistent with national patterns of declining unemployment in the period 2010 2011, all 12 study sites experienced a decline in unemployment rates during the course of family recruitment for this study, and two sites—Phoenix and Salt Lake City—had a decrease in their unemployment rates of greater than 1 percent between 2010 and 2011.
The prevalence of family homelessness also differed among the 12 study sites. To give a sense of the extent of homelessness from one study site to another, Exhibit 1-5 shows the proportion of the population that was homeless (whether in families or as individuals) as reported in each study site for the point-in-time counts conducted in January 20118 relative to the 2010 U.S. Census population for each study site. Honolulu had the highest rate of homelessness (1.26 percent of the population), while Phoenix had the lowest (0.15 percent of the population). Of the 12 study sites, nine had a higher incidence of homelessness than the national rate of 0.2 percent. The exhibit also shows the number of homeless families and the number of persons in these households. Boston had the highest number of homeless families (987 families) and Louisville had the lowest (134 families) reported. It is important to note that
7 The unemployment rates are calculated for the entire metropolitan statistical area (MSA), which in some instances is a larger geographic area than encompassed with the individual study sites.
8 The homeless data is reported by CoC and thus does not always align precisely with the geography of the study site.
Chapter 1
Family Options Study Interim Report pg. 9
Massachusetts has a “right to shelter” policy for homeless families, meaning that all families that apply for shelter and lack alternative housing options and whose income does not exceed 115 percent of the federal poverty line are entitled to shelter.9
Exhibit 1-5 also shows the number of emergency shelter and transitional housing beds10 that are dedicated to assisting homeless families, as reported to HUD during the 2011 housing inventory. While the housing inventory does not include a comprehensive count of rapid re-housing subsidies, these figures provide an indication of the local homeless service system’s size and the relative prevalence of emergency shelter and transitional housing in each community’s system for families. One-third of the sites had excess emergency shelter and transitional housing capacity on the night of the count, whereas the other two-thirds were using overflow capacity or had families who were unsheltered, meaning that they had to stay in cars, on the streets, or in other locations unfit for human habitation. Whereas nationally, there are roughly equal numbers of emergency shelter beds and transitional housing beds for homeless families, 9 of the 12 study sites have more transitional housing beds than emergency shelter beds.
9 Institute for Children and Poverty, “National Survey of Programs and Services for Homeless Families.” 10 The housing inventory includes project-based and scattered-site, transition-in-place transitional housing beds,
whereas the study only referred families to project-based transitional housing in which the transitional housing operator maintained control of the housing, requiring families to move out of the assisted unit into other housing at the completion of the program.
Chapter 1
Family Options Study Interim Report pg. 10
Exhibit 1-5: Homeless population in study sites
Site U.S. Census population
Percentage of total population
homeless (based on 2011 total point-in-time person count)
Total number of homeless families (2011 point-in-time
count)
Total number of homeless persons in
families (2011 point-in-time
count)
Number of emergency
shelter beds dedicated to
homeless families (2011)
Number of transitional
housing beds dedicated to
homeless families (2011)
Alameda County 1,510,271 0.28% 376 1,136 447 852
Atlanta1 1,612,474 0.42% 365 1,073 484 1,489
Baltimore 620,961 0.66% 323 934 164 448
Boston 617,594 0.89% 987 2,926 2,648 435
Connecticut2 274,008 0.16% 165 498 410 248
Denver 600,158 0.80% 924 2,609 727 1,635
Honolulu 337,256 1.26% 558 2,235 675 1,733
Kansas City 674,258 0.41% 407 1,548 494 663
Louisville* 741,096 0.22% 134 386 178 275
Minneapolis* 1,152,425 0.27% 467 1,572 1,279 823
Phoenix* 3,817,117 0.15% 683 2,238 1,130 1,381
Salt Lake City* 1,029,655 0.20% 241 827 322 479
United States 308,745,538 0.20% 76,653 234,079 110,679 110,364
Source: 2011 CoC Housing Inventory Chart and Homeless Populations and Subpopulations Data, HUD
* Since these sites operated more at the county level, the data presented is for the county where the study site is located.
1 This represents the population of DeKalb and Fulton Counties, because CoC GA-500 includes this larger geography including Atlanta.
2 This represents the population of New Haven and Fairfield County, while the CoC data represents the four CoCs that participated in the study: CT-501 New Haven;CT-503 Bridgeport; CT-506 Norwalk-Fairfield; and CT-508 Stamford/Greenwich.
Chapter 1
Family Options Study Interim Report pg. 11
1.6 Data sources for this report
This report uses data from three sources: baseline survey of families; program information about participating programs; and random assignment enrollment data. Each is discussed in this section.
Baseline survey
All adult respondents who agreed to participate in the study completed a baseline survey during the enrollment session conducted at the emergency shelter, prior to random assignment. The baseline survey was conducted in person using Computer-Assisted Personal Interviewing (CAPI) software. The baseline survey topics include housing history, homelessness, barriers to obtaining housing, employment status at baseline, family composition, income and income sources, adult physical health, adult behavioral health, substance use, demographic characteristics, and contact information. These data are used to describe the families in the study sample for the current report and to provide contact information for participant tracking and locating for the follow-up survey. The baseline data will be used in the future to provide covariates in the impact analyses, to help adjust for non-response on the follow-up surveys, and, to the extent feasible, to form subgroups for separate analysis.
Program information
The project team collected data from program providers who participated in the study. This program information is the basis for Chapter 2. Senior members of the research team (the site leads) visited each site several times during participant enrollment. Near the conclusion of enrollment, site leads conducted interviews with staff at programs to which five or more families had been referred (or from which families were recruited, in the case of emergency shelters) to collect information about the provider, housing assistance offered to families, and the assessment, case management, and services provided by the program or through referrals to other organization. The semi-structured interviews followed a standard protocol and also included information about staffing and sources of program cost data.
Random assignment enrollment data
To support the process of enrolling families in the study, the research team created a secure website to operate random assignment. Chapter 3 provides additional details about this process, which included cataloging program eligibility questions, monitoring program availability, screening families for available programs, and conducting real-time random assignment based on the results. Members of the research team maintained close communication with participating programs throughout the enrollment period to track availability and to ensure that families were aware of and pursuing their assigned referrals.
The database created by the random assignment website contains comprehensive data of program availability, eligibility questions, family screening, random assignment results, and the status of referrals. The random assignment database is another key data source for this report.
Chapter 2
Family Options Study Interim Report pg. 12
Chapter 2: Understanding the housing and service features of the study interventions
Families enrolled in the study were randomly assigned to community-based rapid re-housing (CBRR), project-based transitional housing (PBTH), subsidy (SUB), and usual care (UC). To better understand what families received when assigned to a given intervention, this chapter describes and compares the primary housing and service features of each of the four interventions.
This description of study interventions is based on data collected from participating programs. Research staff visited each site and conducted interviews with program staff to collect information about programs that provided each of the four interventions. Altogether, we have collected program data for 16 providers of CBRR; 31 PBTH programs; 18 subsidy providers; and 51 emergency shelters. These are not all of the programs to which study families were referred, as we focused data collection efforts on programs that served at least five families.11
Prior to selecting programs to participate in the study, we identified minimum requirements for each intervention. Selecting programs that met these requirements assured that families assigned to the study would receive comparable levels of housing assistance and service support within an intervention regardless of site differences, allowing us to test the outcomes associated with distinct interventions. The minimum requirements are discussed as part of each intervention’s description in this chapter. Overall, the data collected from the participating programs confirm that the interventions are distinct from each other in the ways intended by the study’s design.
2.1 General comparison of the study interventions
Among the interventions studied, CBRR and SUB both place and subsidize families in private market apartments or single-family homes, whereas PBTH and UC shelters primarily provide temporary housing assistance in project-based facilities. The median expected length of assistance differs across interventions. Most UC shelters provide very short-term assistance. The median expected length of stay for families in UC shelters is 30–90 days. The median expected length of assistance for families referred to CBRR programs is 4–6 months; whereas the median expected length of stay for families referred to PBTH is 13–18 months. Finally, SUB provides rental assistance for years, as long as tenants abide by the terms of their assistance—for example, cooperate with the annual recertification of income used to determine the tenant’s share of the rents and continue to live in standard quality housing. In terms of supportive services, SUB provides only very limited housing placement services, CBRR provides case management focused primarily on housing and income growth, and UC shelters and PBTH both provide comprehensive assessments with intensive case management and formal linkages to internal agency and
11 In this case, served is used loosely to describe the number of study families who were potentially served by the program. We determined whether a program met the “five family” threshold for program data collection by considering the number of referrals to the program less the number of study families rejected by the program. If a study site had three or more programs within a single intervention type (e.g., PBTH, UC), we attempted to interview at least three programs in each intervention category, even if three did not meet the “five family” threshold. In the latter situation, we included the programs with the largest number of enrollments (referrals minus rejections).
Chapter 2
Family Options Study Interim Report pg. 13
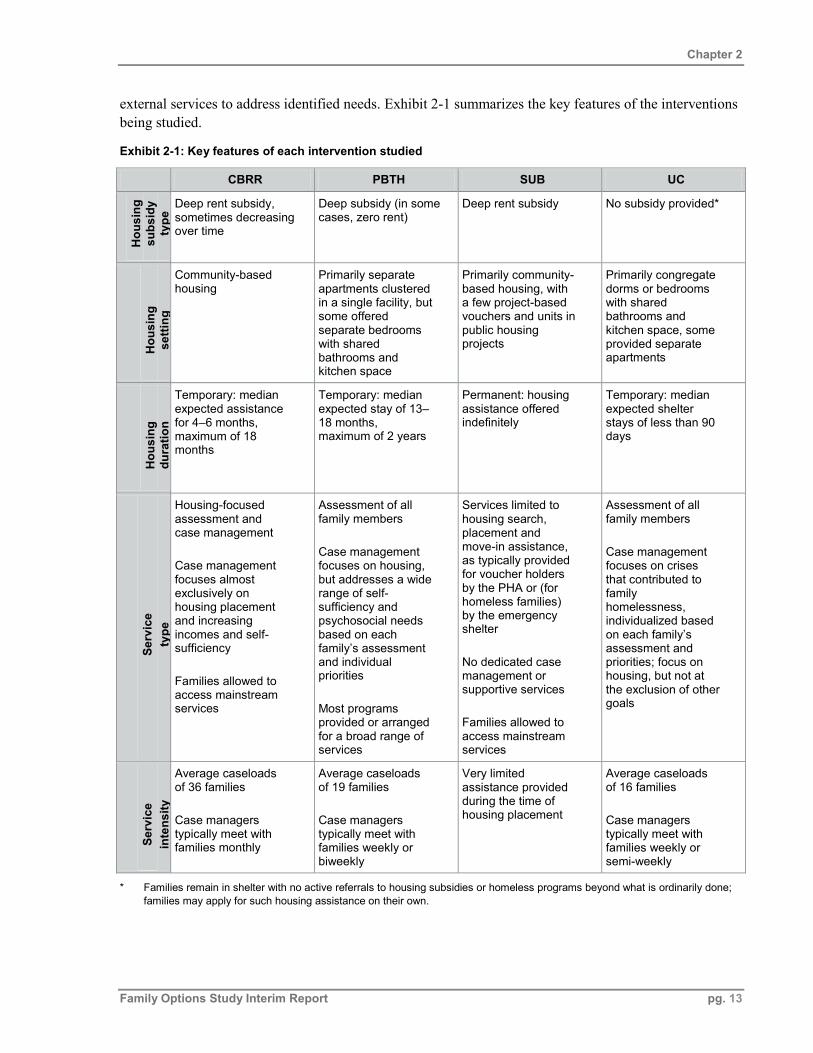
external services to address identified needs. Exhibit 2-1 summarizes the key features of the interventions being studied.
Exhibit 2-1: Key features of each intervention studied
CBRR PBTH SUB UC
Hou
sing
su
bsid
y ty
pe Deep rent subsidy,
sometimes decreasing over time
Deep subsidy (in some cases, zero rent)
Deep rent subsidy No subsidy provided*
Hou
sing
se
tting
Community-based housing
Primarily separate apartments clustered in a single facility, but some offered separate bedrooms with shared bathrooms and kitchen space
Primarily community-based housing, with a few project-based vouchers and units in public housing projects
Primarily congregate dorms or bedrooms with shared bathrooms and kitchen space, some provided separate apartments
Hou
sing
du
ratio
n
Temporary: median expected assistance for 4–6 months, maximum of 18 months
Temporary: median expected stay of 13–18 months, maximum of 2 years
Temporary: median expected shelter stays of less than 90 days
Serv
ice
type
Housing-focused assessment and case management
Case management focuses almost exclusively on housing placement and increasing incomes and self-sufficiency
Families allowed to access mainstream services
Assessment of all family members
Case management focuses on housing, but addresses a wide range of self-sufficiency and psychosocial needs based on each family’s assessment and individual priorities
Most programs provided or arranged for a broad range of services
Services limited to housing search, placement and move-in assistance, as typically provided for voucher holders by the PHA or (for homeless families) by the emergency shelter
No dedicated case management or supportive services
Families allowed to access mainstream services
Assessment of all family members
Case management focuses on crises that contributed to family homelessness, individualized based on each family’s assessment and priorities; focus on housing, but not at the exclusion of other goals
Serv
ice
inte
nsity
Average caseloads of 36 families
Case managers typically meet with families monthly
Average caseloads of 19 families
Case managers typically meet with families weekly or biweekly
Very limited assistance provided during the time of housing placement
Average caseloads of 16 families
Case managers typically meet with families weekly or semi-weekly
* Families remain in shelter with no active referrals to housing subsidies or homeless programs beyond what is ordinarily done;families may apply for such housing assistance on their own.
Chapter 2
Family Options Study Interim Report pg. 14
The remainder of this chapter describes each of the intervention types individually, starting with CBRR, then PBTH and SUB, and concluding with UC. For each, we describe the number of families assigned to the intervention within the study, the primary housing and service features of the intervention, and any common eligibility criteria or program rules associated with programs in that intervention. To the extent that features vary among programs within the intervention, they are described based on the proportion of families referred to programs with each type of feature rather than the raw count of programs with each feature, as the number of families referred more accurately conveys the influence of the feature for families assigned to that intervention in this study.
2.2 Community-based rapid re-housing intervention
The CBRR intervention provides program participants with temporary rental assistance and limited services focused on housing and basic service coordination. A total of 578 families were referred to 27 CBRR programs across the 12 sites, ranging from as few as 8 families in Denver to as many as 83 families in Salt Lake City. A total of 16 CBRR programs, representing 528 of the families referred to the CBRR intervention, provided the program data used in this report to describe the CBRR intervention. More detail about specific CBRR programs is provided in Appendices A and B.
CBRR was funded by the rapid re-housing component of the Homelessness Prevention and Rapid Rehousing Program (HPRP) in all of the sites except Boston.12 The HPRP rapid re-housing program can be used to provide rental assistance (from one-time to 18 months), security deposits, utility deposits and payments, help with moving costs, and hotel and motel vouchers. HPRP also can fund case management for participating families. Any rental assistance paid for with HPRP funds must meet rent reasonableness standards, and units must pass a habitability inspection. The inspection requirements are slightly less stringent than the housing quality standards that must be met for the Housing Choice Voucher (HCV) form of SUB. In Minneapolis, the CBRR intervention was supplemented with funding from the State of Minnesota. In Boston, the CBRR intervention was provided through the Flex Funds program and later the Homebase program, both funded by the Massachusetts Department of Housing and Community Development (DHCD). The Boston programs offered assistance very similar to HPRP, although rental assistance could be provided for longer periods. In Salt Lake City, the CBRR provider also used TANF emergency assistance funds available through the American Reinvestment and Recovery Act of 2009 (ARRA), which offered up to four months of rental assistance.
Housing assistance in CBRR CBRR was included in the study as a short-term temporary rental assistance intervention to enable participating families to rent conventional housing that is not owned or leased by the program. Information from the programs confirms this feature of the intervention, although in some cases the program was a co-signer on the lease for an interim period. In all programs, the intention was that, even after the period of rental assistance ended, the participants would remain in the unit that they obtained with the CBRR assistance.
12 HPRP was authorized in 2009 through the American Recovery and Reinvestment Act of 2009 (ARRA). Across the nation, communities received $1.5 billion in HPRP funding, a one-time funding stream available for three years from program inception, to provide both homelessness prevention and rapid re-housing assistance to individuals and families facing homelessness.
Chapter 2
Family Options Study Interim Report pg. 15
HPRP programs were allowed to provide up to 18 months of assistance according to the HPRP regulations, but HUD encouraged programs to provide the least amount of rental assistance needed to stabilize families in housing. Accordingly, HPRP regulations required CBRR programs to recertify families for income-eligibility and need every three months.13 Some programs also provided assistance with payment of arrears (either rental arrears or back payments owed on utilities) or assistance with start-up costs such as security deposits, utility set-up costs, and moving expenses.
Duration and type of CBRR housing assistance
Exhibit 2-2 shows the different packages of assistance provided across CBRR programs and their relative prevalence based on the proportion of families referred to programs with each combination. The median expected length of assistance was 4–6 months of rental assistance, with 68 percent of families being referred to programs that provide an average of 4–6 months of rental assistance. Most of these programs also provide assistance with paying for arrears and start-up costs, such as security deposits and moving expenses. Roughly one-fifth of families were referred to CBRR programs that provide 7–12 months of rental assistance on average, with access to support for start-up costs but not arrears, and 11 percent of families were referred to programs that provided more than 12 months (some with start-up assistance, some without).
Exhibit 2-2: Type of housing assistance provided through CBRR intervention
Duration of rental assistance provided by CBRR programs
Other assistance provided Percent of families referred to CBRR
with this combination of assistance
(n=528)
Percent of families referred to CBRR
with this duration of assistance (n=528)
Payment of arrears
Payment for start-up costs
4‒–6 months 36
68 22
10 7‒–12 months 19
21 2
13–18 months 2 2 More than 18 months
5 10
5 Source: Program data and random assignment records
Note: Payment of arrears included rent and sometimes utility arrears, and payment for start-up costs included security deposits and moving costs. The 10 percent of families referred to CBRR that was expected to last more than 18 months were all located in Boston, which used a State-funded CBRR program that was not time-limited like the HPRP-funded programs.
Since HPRP was statutorily funded through ARRA for only three years, many CBRR programs were beginning to run out of funds toward the end of study enrollment. Some programs began to reduce the length of time for which a family could receive assistance or reduced the amount of each family’s subsidy. These programs sometimes adjusted their eligibility criteria accordingly to limit enrollment to families who would be likely to remain stably housed even with shorter periods or lower levels of rental assistance.
13 U.S. Department of Housing and Urban Development (2009), Notice of allocations, application procedures, and requirements for homelessness prevention and rapid re-housing program grantees under the American Recovery and Reinvestment Act of 2009.
Chapter 2
Family Options Study Interim Report pg. 16
Depth of CBRR housing assistance
The subsidy provided through CBRR represents a substantial fraction of monthly rent; however, the subsidy in CBRR is rarely determined based on participant contribution of a fixed percentage of income, as is the case in the HCV program. More than half of families were referred to CBRR programs that calculate subsidy as a fixed monthly amount. The fixed monthly amount is typically determined by CBRR case managers based on data collected through the client assessment, considering a standard set of criteria, such as family income, debt, size, and local housing costs. For another 19 percent of families, the initial subsidy is set at the discretion of the program, based on what the program staff determine is needed to get the family into housing, and then the ongoing subsidy is based on a formula. Rental assistance for the remaining 27 percent of families is calculated by formula, most often as a percentage of the contract rent but sometimes based on the contract rent less the participant’s rental contribution. In one of the sites, the CBRR program paid the full monthly rent. Some programs establish caps on the total amount of subsidy paid to a given family. Exhibit 2-3 summarizes the methods used by CBRR providers to calculate subsidies for families in the study.
Exhibit 2-3: Methods used to calculate CBRR subsidy amounts
CBRR subsidy calculation
Percent of families assigned to CBRR programs with each type of
subsidy calculation (n=528) Subsidy amount is set by case managers on a case-by-case basis
55%
Combination (initial subsidy not determined by formula, then formula based on family contribution to rent)
19
Subsidy amount is a percentage of rent 23 Subsidy amount is difference between rent and participant contribution of a % of income
4
Source: Program data and random assignment records
Assessment of family needs in CBRR All 16 CBRR programs indicate that they conduct a formal assessment of study families at the beginning of the program. In addition, all programs report that they reassess family needs as part of the three-month program recertification. The assessments typically examine family needs related to housing, self-sufficiency, and employment, but three-quarters of families were referred to CBRR programs that also indicate they explore health, mental health, and substance abuse issues. Just over half of families were referred to CBRR programs that assessed for children’s needs; other domains, such as parenting and life skills were only formally incorporated into a handful of programs’ assessments. In all 16 programs, the assessments result in a formal service plan with goals for the adults in the household designed to help families obtain and remain in stable housing and to guide subsequent case management and referrals to other service programs. Thirty percent of families were referred to CBRR programs that also work with families to develop goals for the children.
Supportive services provided in CBRR Consistent with the minimum requirements established for CBRR programs, participating CBRR programs provide limited case management with linkages to other programs for additional support. CBRR services are heavily focused on housing and self-sufficiency. Most families were referred to CBRR programs in which the CBRR case manager takes primary responsibility for providing housing search and placement assistance; one program (representing 8 percent of family referrals) has a housing specialist to provide that function instead. Three-quarters of CBRR referrals were to programs in which
Chapter 2
Family Options Study Interim Report pg. 17
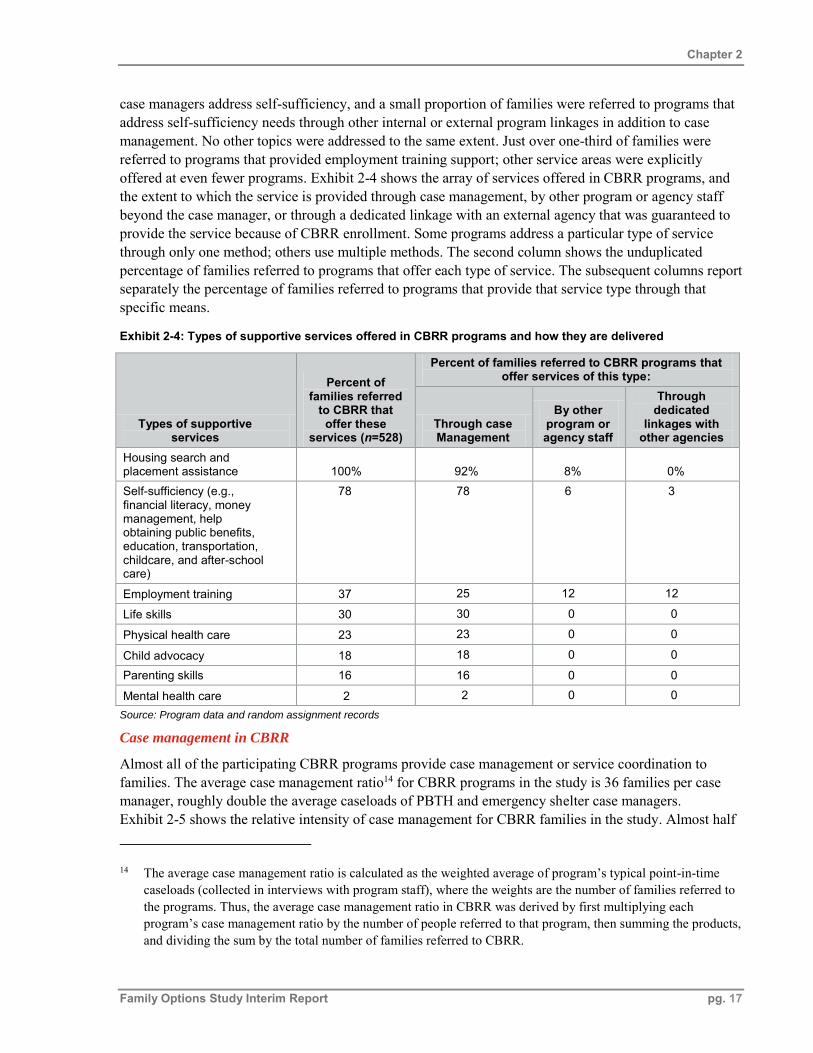
case managers address self-sufficiency, and a small proportion of families were referred to programs that address self-sufficiency needs through other internal or external program linkages in addition to case management. No other topics were addressed to the same extent. Just over one-third of families were referred to programs that provided employment training support; other service areas were explicitly offered at even fewer programs. Exhibit 2-4 shows the array of services offered in CBRR programs, and the extent to which the service is provided through case management, by other program or agency staff beyond the case manager, or through a dedicated linkage with an external agency that was guaranteed to provide the service because of CBRR enrollment. Some programs address a particular type of service through only one method; others use multiple methods. The second column shows the unduplicated percentage of families referred to programs that offer each type of service. The subsequent columns report separately the percentage of families referred to programs that provide that service type through that specific means.
Exhibit 2-4: Types of supportive services offered in CBRR programs and how they are delivered
Types of supportive services
Percent of families referred
to CBRR that offer these
services (n=528)
Percent of families referred to CBRR programs that offer services of this type:
Through case Management
By other program or agency staff
Through dedicated
linkages with other agencies
Housing search and placement assistance 100% 92% 8% 0% Self-sufficiency (e.g., financial literacy, money management, help obtaining public benefits, education, transportation, childcare, and after-school care)
78 78 6 3
Employment training 37 25 12 12
Life skills 30 30 0 0
Physical health care 23 23 0 0
Child advocacy 18 18 0 0
Parenting skills 16 16 0 0
Mental health care 2 2 0 0 Source: Program data and random assignment records
Case management in CBRR
Almost all of the participating CBRR programs provide case management or service coordination to families. The average case management ratio14 for CBRR programs in the study is 36 families per case manager, roughly double the average caseloads of PBTH and emergency shelter case managers. Exhibit 2-5 shows the relative intensity of case management for CBRR families in the study. Almost half
14 The average case management ratio is calculated as the weighted average of program’s typical point-in-time caseloads (collected in interviews with program staff), where the weights are the number of families referred to the programs. Thus, the average case management ratio in CBRR was derived by first multiplying each program’s case management ratio by the number of people referred to that program, then summing the products, and dividing the sum by the total number of families referred to CBRR.
Chapter 2
Family Options Study Interim Report pg. 18
of clients were referred to programs in which a case manager works with more than 30 families at a time, most meeting at least quarterly and sometimes monthly. (Some programs indicate that case managers meet more frequently up front to support families as they search for and move into housing, meeting less frequently once the family is housed.) About one-fifth of families were referred to programs with 11‒20 clients per case manager, meeting weekly to monthly, 11 percent of families were referred to programs with active caseloads of 10 or fewer families, and 18 percent of families were referred to programs with variable sized caseloads. Intensity can also be measured by the amount of time that case managers spend with families at each visit. Programs reported variable length of times, but visits of approximately one hour are fairly typical for CBRR programs. Specific details are reported about each program’s case management in Appendix B-3. Case management typically ends at the same time as the completion of the rental assistance aspect of the CBRR program.
Exhibit 2-5: Case management intensity (ratio and frequency)
Percentage of families referred to CBRR programs that offer case management
in each of the following packages (n=471)
Frequency of case management (in percents)
Total Weekly Biweekly Monthly Quarterly Variable
Ave
rage
num
ber o
f cl
ient
s pe
r cas
e m
anag
er
10 or fewer clients 0% 0% 11% 0% 0% 11%
11–20 clients 4 4 0 0 11 20%
21–30 clients 3 0 3 0 0 3%
More than 30 clients 0 3 30 13 0 46%
Variable 0 0 18 0 0 18%
Total 7 7 61 13 11 100% Source: Program data and random assignment records.
Note: Two CBRR programs (representing 57 families referred) did not provide information on case management ratios or frequency and have been excluded from this exhibit.
Eligibility criteria for CBRR Similar to SUB programs (described later in the chapter), HPRP-funded rapid re-housing programs had statutory eligibility criteria. Families had to be literally homeless, at or below 50 percent of the area median income, and without financial resources and support networks to obtain and remain in housing—none of which were impediments for the homeless families enrolled in the study. However, many of the CBRR programs had additional eligibility criteria related to families’ ability to lease units in the private market or the likelihood that they would be able to sustain the rent on their own once CBRR rent subsidies ended. Thirty percent of the 1,924 families considered for CBRR programs had to meet screening criteria regarding minimum work or income requirements; 17 percent had to meet screening criteria related to sobriety, drug testing, or treatment requirements; and 15 percent had to meet screening criteria regarding their criminal backgrounds. Exhibit 2-11 provides more detail on the types of questions used to screen for CBRR program eligibility, in comparison with PBTH and SUB eligibility criteria.
Program rules in CBRR Per statutory guidelines, families must continue to meet income recertification requirements in order to continue to receive assistance for the period offered by the CBRR program. Some CBRR programs also imposed additional program requirements with which families had to comply in order to maintain
Chapter 2
Family Options Study Interim Report pg. 19
eligibility for assistance, such as working with a case manager to achieve employment or increase earned income.
The PBTH intervention provides time-limited housing assistance coupled with a wide array of services. Services include, at a minimum, assessment of family needs, case management, and provision of, or linkage to, a wide range of services to meet identified needs. PBTH was offered to study families in all of the sites except Boston; however, it was extremely limited in Minneapolis.15 A total of 371 families were randomly assigned to this intervention (ranging from 4 in Minneapolis to 66 in Honolulu) and referred to a total of 46 programs. Of these, 31 PBTH programs (representing 295 of the families referred to PBTH) provided the program data used in this report to describe the PBTH intervention.16 Details about each of these programs are provided in Appendices A and B.
For this study, we selected transitional housing programs that provide housing in project-based facilities, a common model in the field but not the only model of transitional housing implemented. Some communities offer transitional housing in scattered site settings. At the completion of a scattered site program, families may be able to transition in place and eventually take over the lease for the unit.17 Transition-in-place programs share many of the same characteristics of CBRR, so we excluded them from this study to provide a stronger contrast between the PBTH and CBRR interventions.
Project-based transitional housing programs are often funded with federal Supportive Housing Program (SHP) grants, which results in some consistency across PBTH programs. For instance, the SHP grant limits transitional housing assistance to 24 months, funds a broad range of supportive services, and sets parameters for the way in which programs must calculate participant rent contributions when they choose to require them. However, not all the PBTH programs in the study are funded by SHP grants. Most have a wide range of funding sources, including private foundation grants and local fundraising proceeds. Some programs are faith-based; often these are completely privately funded.
For purposes of the study, we required that PBTH provide only temporary housing assistance. We allowed any time limit on tenure but specifically sought programs that offered at least 6 months of assistance. (Exhibit 2-7 illustrates that we were successful in achieving this goal.) Referrals to permanent housing assistance at the end of the transitional housing period are permitted, but permanent assistance cannot be guaranteed as part of the intervention.
15 Three PBTH programs agreed to participate in the study in Minneapolis, and four families were randomly assigned to PBTH and referred to two of these programs.
16 Families were referred to 15 additional PBTH programs. However, fewer than five families were referred to each of these 15 programs, so the research team did not collect information about their program characteristics. The research team established a threshold for program data collection, focusing on programs to which five or more families were referred through the study.
17 A few of the PBTH programs included in this study offer transitional housing in standalone apartment units or small single-family homes, but we have considered them PBTH for purposes of this study since the agency maintains control of the unit at the completion of the program and requires the family to relocate to other housing.
Chapter 2
Family Options Study Interim Report pg. 20
Housing assistance in PBTH By design, all the PBTH programs included in the study provide project-based assistance. In a few instances, programs placed families in separate scattered site units, but in all cases families had to leave the unit at the conclusion of the program and had to transition to other permanent housing. Programs offer housing assistance in varied physical environments. As shown in Exhibit 2-6, almost three-quarters of families were referred to PBTH programs that house families in individual apartments or occasionally single-family houses. One-quarter were referred to programs that provide private rooms but shared kitchens or bathrooms.
Exhibit 2-6: PBTH housing settings
Type of project-based transitional housing
Percent of families assigned to PBTH programs with housing units of this type
(n=295) Separate apartment with private kitchen, bathroom 73% Private room but shared kitchen and/or bathroom 27%
Source: Program data and random assignment records
Duration of PBTH housing assistance
As shown in the top half of Exhibit 2-7, most families (91 percent) were referred to PBTH programs that offered housing assistance for a maximum of 2 years, with 8 percent of families getting referred to programs offering longer assistance. However, the expected length of stay in PBTH is shorter than the maximum time allowed. The median expected length of stay for the families referred to PBTH programs in the study was 13–18 months. As the bottom half of the exhibit shows, all programs expected families to stay at least 6 months. Forty-four percent of families were referred to programs with expected lengths of stay 6–12 months, 8 percent referred to programs with expected stays of 13–18 months, and 46 percent expected stays longer than 18 months.
Exhibit 2-7: Duration of PBTH housing assistance
Program features Percent of families referred to PBTH programs
offering this length of assistance (n=295) Maximum length of stay for study families
12 months 1% 24 months 91 More than 24 months 8
Expected length of stay for study families Less than 6 months 0 6–12 months 44 13–18 months 8 Longer than 18 months 46 Unclear 2% Average length of stay (weighted by referrals) 17 months
Source: Program data and random assignment records
Family rent contributions and savings requirements in PBTH
Most families (93 percent) were referred to PBTH programs that require a program fee or rent contribution from program participants, based on 30 percent of their income (80 percent of those charged a fee) or other factors such as family or unit size (20 percent of those charged a fee; see
Chapter 2
Family Options Study Interim Report pg. 21
Exhibit 2-8). More than half of the families were referred to PBTH programs that required them to save money while in the program.
Exhibit 2-8: Family rent contributions and savings requirements in PBTH
PBTH program features Percent of families referred to PBTH programs
with these characteristics (n=295) Are families required to pay a program fee or rent?
Yes 93% No 7
(If yes) How is the program fee/rent determined? Percentage of income 80% Flat amount based on family or unit size 20
Does the program require families to save money while in the program?
Yes 55% No 45
Who is responsible for food for participating families?
Families provide own food 74% Program provides food 10 Both 16
Source: Program data and random assignment records
Families in PBTH usually live fairly independently while enrolled in the program. For example, 74 percent of families referred to PBTH programs are responsible for providing their own food while living in PBTH. The agency provides food in three programs (representing 10 percent of PBTH families), for which the housing facilities are former hotels where families do not have private kitchen facilities, and 16 percent of families assigned to PBTH were referred to programs that provide some but not all of families’ food. Some agencies commented that if families remain responsible for at least one meal per day, then they are still eligible for Supplemental Nutrition Assistance Program (SNAP) benefits.
Assessment of family needs in PBTH All PBTH programs indicated that the program conducts a formal assessment of study families at the beginning of the program.18 The program staff universally reported that the assessments cover a broad range of topics, exploring family needs related to housing; self-sufficiency; employment; health, mental health, and substance abuse; child-specific needs; parenting; and family life skills. A few programs included other assessment domains such as domestic violence, trauma, debt burden, and cultural needs, but these were not widespread areas of assessment. The assessments all result in a formal service plan (or equivalent) with goals for the adults in the household, designed to help families address their needs. Fifty-eight percent of families were referred to programs that develop goals specifically for the children, as
18 As part of program data collection, the research team asked program staff whether they conducted an assessment of families, when it occurred, which domains were addressed as part of the assessment, whether a standardized tool was used to ensure that assessments were conducted and reported systematically across program staff, and the extent to which assessments resulted in goal setting and service plans for family members.
Chapter 2
Family Options Study Interim Report pg. 22
compared with 30 percent in CBRR, another illustration of the way in which PBTH programs offer a more holistic assessment perspective than CBRR programs.
Supportive services provided in PBTH Consistent with the minimum requirements established for PBTH programs, participating PBTH programs provided comprehensive case management, direct provision of many supportive services, and linkage to mainstream programs or other programs to meet additional family needs. While all PBTH programs focused on ending a family’s homelessness through placement in permanent housing, more than 90 percent of families were referred to programs that also provided services related to self-sufficiency and employment training. Exhibit 2-9 shows the wide array of services offered in PBTH programs and the extent to which the service is provided through case management, by other program or agency staff beyond the case manager, or through a dedicated linkage with an external agency that was guaranteed to provide the service because of PBTH enrollment. Some programs address a particular type of service through only one method while others use multiple methods. The second column of the exhibit shows the unduplicated percentage of families referred to programs that offer each type of service. The subsequent columns report separately the percentage of families referred to programs that provide that service type through that specific means. In some cases, addressing a service through case management meant provision of direct assistance by the case managers, whereas in other cases, addressing a service through case management means that the case managers provide referrals to other programs, advocate on behalf of the family to access care, help remove barriers to care, and coach or support a family as it attempts to complete its goals related to that service need.
The scope of needs addressed in PBTH differs substantially from the limited focus of CBRR on housing and self-sufficiency. More than 75 percent of PBTH families were referred to programs that provide services to address employment training, life skills, mental health care, parenting needs, physical health care, and approximately two-thirds of PBTH families were referred to programs that provide child advocacy and care related to substance abuse through one of the three services approaches.
Exhibit 2-9: Types of supportive services offered in PBTH programs and how they are delivered
Types of supportive services
Percent of families referred
to PBTH that offer these
services (n=295)
Percent of families referred to PBTH programs that offer services of this type:
Through case management
By other program or agency staff
Through dedicated
linkages with other agencies
Housing search and placement assistance 100% 100% 16% 4% Self-sufficiency (overall) 92 92 NA NA Childcare/after-school care 23 13 Financial management 8 14 Help obtaining public benefits 3 2 Transportation 0 0 Employment training 92 88 14 14 Life skills 82 82 10 2 Mental health care 82 82 19 5
Chapter 2
Family Options Study Interim Report pg. 23
Types of supportive services
Percent of families referred
to PBTH that offer these
services (n=295)
Percent of families referred to PBTH programs that offer services of this type:
Source: Program data and random assignment records
Case management in PBTH
All PBTH programs provide case management and consider it a core part of their intervention. This may be even more of a focus of their intervention than the direct housing the program provides. Case management varies among the participating PBTH programs, with the average case management ratio for PBTH programs of 20 families per PBTH case manager. Exhibit 2-10 shows that almost three-fifths of families were referred to programs in which a case manager works with 20 or fewer families at a time, meeting with families weekly if not more often. The other two-fifths were referred to programs with lower-intensity case management, in which case managers have active caseloads of more than 20 families but generally fewer than 30. These programs still often meet with families weekly, though some only meet on a biweekly or monthly basis. Intensity can also be measured by the amount of time that case managers spend with families at each visit. Reported visit times varied from 15 to 90 minutes, with programs reporting one-hour case management sessions most frequently. Specific details are reported about each program’s case management in Appendix B-5.
Exhibit 2-10: PBTH case management intensity (ratio and frequency)
Percentage of families referred to PBTH programs that offer case management in each of
the following packages (n=287)
Frequency of case management
Total Weekly or more often Biweekly Monthly Quarterly
Ave
rage
num
ber o
f cl
ient
s pe
r cas
e m
anag
er
10 or fewer Clients 13% 0% 0% 0% 13%
11 to 20 clients 42 3 0 0 45
21 to 30 clients 15 6 7 0 28
More than 30 clients 6 8 0 0 14
TOTAL 76 17 7 0 100 Source: Program data and random assignment records
Note: One provider (representing eight family referrals) did not provide information on case management ratios and was excluded from this exhibit.
Case management is often offered for up to six months after families move out of the PBTH program, but program staff generally describes post-exit supportive contact as an open-door policy rather than regular contact.
Chapter 2
Family Options Study Interim Report pg. 24
Other supportive services in PBTH
The core of PBTH programs is its case management, but most PBTH programs offer direct services beyond case management. As was shown in Exhibit 2-9, additional services are sometimes provided by other staff within the agency and sometimes are secured through a dedicated linkage with another agency. The type of services offered vary significantly across PBTH programs, but child care, life skills training, employment training, mental health care, and parenting were provided most frequently. In addition to the services offered directly by the program or a formal partner, families are also routinely given suggestions of other places to contact to address their needs.
Eligibility criteria for PBTH While PBTH programs do not have statutory eligibility criteria in the same way that CBRR programs do, many of the PBTH programs established eligibility criteria to limit admissions to the types of families they deemed appropriate for PBTH assistance. PBTH programs were fairly restrictive in terms of whom they targeted. As part of recruiting families for this study, research staff screened candidates to see which program they would qualify for. Each program participating in the study was asked what would cause it to reject a family for enrollment, and screening questions were developed to identify these factors and prevent study staff from referring a family to an agency at which it would almost certainly be rejected.
The major categories of screening questions and their relative use in screening study families for available PBTH, CBRR, and SUB openings are shown in Exhibit 2-11. Of the 1,564 families considered for random assignment to an available PBTH unit, nearly three-quarters were screened for sobriety or willingness to engage in substance abuse treatment, as compared with only 17 percent of those considered for CBRR and none of those considered for SUB. More than two-thirds of families considered for PBTH were screened for minimum incomes or employment, compared with 30 percent in CBRR and only 8 percent in SUB.19 20 PBTH is less restrictive than SUB only in relation to the statutory criteria required for SUB: criminal convictions, citizenship or legal status, and money owed to a housing authority.
Two categories of questions are unique to PBTH as compared to most of the SUB programs and to CBRR: unit size and family composition. Unit size criteria are an artifact of the project-based nature of PBTH and of the project-based forms of SUB to which a few families were assigned. Just over half of the families screened for PBTH were asked questions to determine whether their households were the correct size for the available transitional housing unit. For example, if a two-bedroom unit was available, a family had to have the right number of persons and right mix of ages and genders to be considered for the unit in order to avoid overcrowding or underutilization. In contrast, only 1 percent of families considered for SUB (those considered for project-based vouchers in Bridgeport) and none of the families considered for CBRR were screened for unit size. Family composition criteria limited enrollment for families based on the types of people who were part of their household. For instance, some programs excluded adult males, male children over 13 years, or any children of either gender over a certain age. Family composition
19 In two SUB programs, both in Honolulu, the programs requested that the research team ask screening questions to confirm that families had a consistent source of income.
20 Many PBTH programs (with 68 percent of families referred) required families to have sufficient income to be able to pay their own rent in coming months. The programs thus asked the research team to limit referrals to families who indicated (in responses to screening questions) having some type of income, participating in TANF, or being willing and able to obtain employment shortly after enrolling in the program.
Chapter 2
Family Options Study Interim Report pg. 25
criteria sometimes reflected the challenges of housing families in congregate settings and sometimes reflected program goals and design. None of the families considered for SUB or CBRR were screened for family composition.
Exhibit 2-11: Types of program eligibility criteria and relative applicability to PBTH, CBRR and SUB
Eligibility question type (At intake, participants must meet or agree to
requirements related to…)
Percent of families
screened for CBRR
(n=1,924)
Percent of families
screened for PBTH
(n=1,564)
Percent of families
screened for SUB
(n=1,810) Sobriety, drug testing, or participation in treatment 17% 72% 0%
Minimum income or employment 30 68 8 No specified criminal convictionsa 15 59 90d Appropriate in family size for available unit 0 51 1 Appropriate family composition 0 43 0 Adequate credit or housing history 6 39 21e Citizenship or legal status 13 37 52d Mandatory service or activity participation 0 34 0 Required rent or move-in fees 7 18 6f Designated geographic catchment area 13 13 20 Health screeningb 5 10 0 Documented disability or history of addiction 0 7 0 Adequate education or work experience 5 6 0 Maximum income thresholdc 0 6 4 No housing authority arrears 2 2 36d Housing stability requirements 11 0 0
Source: Random assignment records
a Families were screened for criminal convictions as specified by programs. The most common screening questions related to: a history of sexual offenses, violent crimes, or drug use; felony convictions; and operation of methamphetamine laboratories
b Health screening procedures included tuberculosis screenings and bed bug screenings. c For several programs, families had to earn less than 50 percent of the area median income or less than $36,000 per year to
qualify. d These percentages reflect the percent of families considered for random assignment to SUB who were screened for these
criteria. In fact, these are statutory eligibility requirements for SUB programs. The fact that these criteria are reported for fewer than 100 percent of families means that that public housing agency (PHA) did not ask the research team to screen on that basis, either due to unintentional omission or because they did not believe the criteria would be a barrier for families in shelter. Presumably each PHA subsequently screened for them at the time for formal intake.
e These criteria represent screening questions such as whether the family had previously been evicted from a federally funded housing program (for SUB programs) or whether the family had an acceptable level of credit to obtain housing.
f One SUB program that provided public housing assistance required screening questions to confirm that families would be able to pay the program’s required $1,000 security deposit.
Program rules in PBTH Once enrolled in a PBTH program, families remain eligible for assistance (up to the maximum length of stay) as long as they comply with program rules. As shown in Exhibit 2-12, 52 percent of PBTH families were referred to programs that impose curfews, and 42 percent of PBTH families were referred to programs that limit overnight visitors, even though most PBTH is provided in private apartment settings. Eighty-seven percent of families were referred to programs that explicitly required participation in
Chapter 2
Family Options Study Interim Report pg. 26
services or activities in order to remain in the program. For instance, PBTH programs often required participants to work with a case manager to develop goals and to identify and pursue actions needed to achieve them. Some programs also required participation in services such as a money management class, substance abuse assessment, or group counseling session.
Exhibit 2-12: Types of program rules in PBTH
Types of program rules
Percent of families referred to PBTH programs with these types of rules
(n=295) Weekday curfew 52% Weekend curfew 10 Limit on daytime visitors 9 Limit on overnight visitors 42 Compliance with mandatory service requirements 87
Source: Program data and random assignment records
2.4 Permanent housing subsidy intervention
The SUB intervention provides indefinite rental assistance, typically in a community-based housing setting, with possible housing placement assistance, but without ongoing dedicated services. SUB was available in 10 of the 12 study sites, provided by 17 public housing agencies (PHAs) and one city housing agency. A total of 604 families were assigned to the subsidy intervention, ranging from 32 in Louisville to 77 in Alameda County. All 18 programs provided program data used to describe the SUB intervention in this report. The specific program names, number of families referred to each, and type of housing assistance administered are listed in Appendices A and B.
Housing assistance in SUB In 8 of the 10 sites (comprising 92 percent of family referrals), the subsidy intervention was in the form of a tenant-based voucher provided by one or more local PHAs through the HCV program, as shown in Exhibit 2-13. One of the sites offered permanent housing subsidies through public housing (6 percent of family referrals), and another offered project-based vouchers (2 percent of family referrals).
Exhibit 2-13: Subsidy type provided by site
Type of subsidy
Number of participating subsidy programs with this
type of subsidy
Percent of families assigned to subsidy intervention of this type
(n=604)
Tenant-based voucher 16 92%
Project-based voucher 1 2
Public housing 1 6 Source: Program data and random assignment records.
The HCV program is the federal government’s largest housing assistance program, providing rental subsidies to more than 2 million households across the country.21 Participants in the study who were assigned to the subsidy intervention and who were accepted by the PHA and issued a voucher were free to use the HCV to rent a housing unit of their choice in the private rental market as long as it met HUD’s
21 HUD Fiscal Year 2013 Budget, Justifications for Estimates. Accessed July 26, 2012 at http://portal.hud.gov/hudportal/HUD?src=/program_offices/cfo/reports/2013/main_toc
Housing Quality Standards (HQS) and had a rent that was reasonable compared with the rents of unassisted units in the same housing market. The voucher assistance subsidized the monthly rent for the unit, and the value of the subsidy is the payment standard established by the PHA (or the unit’s actual rent, if lower) minus 30 percent of the family’s adjusted monthly income.22
In some sites, PHAs have residency requirements for the HCV program, so families who receive a voucher must use it in a designated jurisdiction for a specified period of time. For example, voucher recipients in the Oakland Housing Authority’s program can only use the voucher in the city of Oakland for the first year of assistance. After that time participants can port, or move, the voucher to another PHA jurisdiction.
In Honolulu, the subsidy intervention included 39 units of public housing provided by the State PHA and 5 units of tenant-based rental assistance provided by the city. Public housing units are owned and managed by the PHA. Like voucher program participants, tenants in public housing pay 30 percent of adjusted monthly income for rent. The city’s tenant-based rental assistance program operates much like the HCV program, but was funded with federal HOME Program dollars rather than HCV funds.
In Bridgeport, Connecticut, the subsidy intervention was provided through 15 units of project-based vouchers. Under the project-based voucher program, PHAs can use up to 20 percent of their housing choice vouchers for project-based assistance. Under the project-based program, a PHA enters into an assistance contract with a property owner for specified units and for a specified term. The PHA refers families from its waiting list to the owner to fill vacancies. Recipients of this type of assistance also pay 30 percent of monthly income for rent, with the remainder subsidized. Because the assistance is linked to the unit, a family who moves from the project-based unit does not have any right to continued housing assistance. However, they may be eligible for a tenant-based voucher when one becomes available. Instead of finding units of their choice, families are restricted to the units provided in the assisted household project.
All the housing included in the SUB intervention is considered permanent. That is, families can continue receiving housing assistance as long as they follow program rules such as living in housing that passes a housing quality inspection. In all sites, recipients of the subsidy were subject to annual recertification of income to determine the tenant’s share of the rent.
Supportive services in SUB The permanent subsidy intervention was intentionally selected to provide an intervention without ongoing, designated, intensive supportive services; however, up-front housing placement assistance was allowed. Of the 18 participating subsidy providers, eight PHAs (to which 177 study families were referred) indicated they conduct an assessment of family needs, but only two of the smallest programs—Honolulu’s public housing program and Bridgeport’s project-based voucher program—indicated they provide any case management services. These two represented only 4 percent of the study referrals. Only 20 percent of families were referred to PHAs that indicate that they help applicants locate qualified housing units, 20 percent of families were referred to PHAs that provide assistance resolving conflicts with landlords, and an even smaller percentage were referred to programs that provide moving assistance or help in learning how to maintain the unit. PHAs did not alter their usual practices for providing help to study families, but some did partner with other agencies to help families obtain funds that were not
22 Payment standards are adjusted for the number of bedrooms in the unit. The actual rent includes an estimate of the cost of utilities paid for by the tenant.
Chapter 2
Family Options Study Interim Report pg. 28
offered to typical voucher holders for paying PHA arrearages or required move-in costs. Families that receive voucher assistance can, of course, access any available services in the community on their own.
Eligibility criteria for SUB All the PHA-administered subsidy programs have statutory eligibility criteria that required prospective families to be able to document U.S. citizenship or legal status, absence of drug-related criminal convictions, lack of previous evictions from a federally funded housing program, and absence of arrearages to the PHA.23 In some cases, SUB programs asked the research team to add eligibility screening criteria beyond those statutorily required, such as a question related to whether the family had a consistent source of income (two SUB programs required this); willingness to reside within the PHA’s jurisdiction (two SUB programs required this); and ability to pay security deposits and other start-up costs (one SUB program required this). See Exhibit 2-11 for information on the percentage of families referred to SUB programs with these requirements. Thus, the subsidy programs are designed to serve families who are able to lease units in the private market and those Congress has deemed appropriate to serve on an indefinite basis—citizens and legal residents, and previous program participants who left the program on good terms.
Program rules in SUB Once enrolled in a SUB program, tenants remain eligible for the subsidy assistance as long as their incomes are low enough to qualify them for a subsidy amount greater than zero, they pay their share of the rent, they follow other program rules, and they cooperate with annual recertification requirements.
2.5 Usual care intervention
The final intervention included in the study is usual care (UC). All families were recruited for the study from emergency shelters. Since families assigned to UC were not explicitly provided other assistance, all UC families remained in emergency shelter until they navigated their way out with or without the assistance of the emergency shelter staff, or until they reached length of stay limits. A total of 754 families across all 12 study sites were randomly assigned to the UC intervention from 57 emergency shelters.
For the families assigned to UC, emergency shelters may have been the families’ only interaction with the homeless assistance system, or families may have found their way to other homeless programs, including CBRR or PBTH, or even a permanent subsidy if they managed to secure a voucher through the normal application process and the waiting list maintained by the PHA. From baseline data, it is impossible to know what combination of housing programs UC families will receive. This section describes the emergency shelter part of UC, referred to here as UC shelters, which all UC families received.24 Later stages of the study, including data from the tracking and follow-up surveys and from HUD administrative data, will enable the study to describe what other housing assistance UC families receive. Additional information describing the experience of UC will be included in later reports when follow-up survey data are available.
23 Although all SUB programs had these eligibility criteria, not all SUB programs asked us to screen for them, thus the discrepancy in Exhibit 2-11 and this statement.
24 Families assigned to other interventions also spent time in UC shelters for at least seven days.
Chapter 2
Family Options Study Interim Report pg. 29
Unlike the other three interventions, the study did not place explicit restrictions on emergency shelter programs. Instead, the research team tried to recruit from all emergency shelters that the community described as “entry points” into the homeless system for each site. Some programs call themselves emergency shelters but only recruit families from other shelters and therefore function more like transitional housing programs. We excluded these types of programs for purposes of recruiting families. We also avoided emergency shelters that exclusively provide domestic violence assistance, as most victim service providers did not feel that random assignment to non-specialized homeless assistance programs was appropriate for their clients. Thus, UC includes the gateway shelters, or primary entry points, into each site’s homeless system.
The number of UC shelters in each site reflects the organization of that community’s homeless system. For instance, we recruited from the single primary shelter in Salt Lake City, which has a largely centralized homeless system, whereas in Alameda, we recruited from nine shelters, reflecting the large geographic area covered by the county, the many cities and towns, and the homeless system’s general decentralization. Many UC shelters were part of agencies that operate other homeless programs. Outside of this study, these multi-service agencies would normally refer many families in shelter to their internal programs instead of referring them to externally operated programs.
Because of the way HUD prioritizes its funding for homeless assistance, very little HUD funding is used to support emergency shelters. As a result, emergency shelters typically rely on a broad range of other local private and public sources, and shelters do not have the same type of universal funding-related characteristics and requirements that CBRR, SUB, and, to some extent, PBTH programs have. Nonetheless, we found a great deal of similarity across communities in the types of assistance provided in emergency shelters, and there are many similarities between UC shelters and PBTH programs, except in relation to program eligibility criteria.
We were able to collect program information—the basis of the information reported in this section on UC shelters—from 51 of the 57 emergency shelter programs representing 739 families enrolled in the study. Details about each of these shelters are provided in Appendices A and B.
Housing assistance in UC shelters As shown in Exhibit 2-14, more than 80 percent of UC shelters provide housing assistance to families in congregate settings: dorm settings (35 percent of families), group living environments in which families have a private bedroom with shared bathrooms and kitchens (26 percent), and private bedrooms with bathrooms (23 percent) but shared kitchens and other common space. Thirteen percent of families stayed in various apartment-based settings, with 4 percent staying in other settings.
Exhibit 2-14: Type of emergency shelter housing
Type of housing Percent of families in shelters with this setting (n=720)
Congregate dorms (shared bedrooms or sleeping space) 35% Group homes (families have a private rooms but not private kitchen or bathroom) 26
Facilities (e.g., motels)—families have rooms and bathrooms but not kitchens 23 Facility-based apartments in complex reserved for program 8 Apartments clustered in larger building not owned or controlled by the program 5 Other settings 4
Source: Program data forms and random assignment records
Chapter 2
Family Options Study Interim Report pg. 30
Note: One provider (representing 19 study families) did not provide information on the housing setting and was excluded from this exhibit.
Duration of UC housing assistance
The maximum length of stay allowed in shelter programs varies by program. Forty-four percent of families were in shelters that limited stays to 90 days or less; another 17 percent were in shelters that limited stays to 6 months or less. Thirty percent were in shelters with unlimited stays. However, when asked about the expected length of stay in the program, program staff estimated that stays were typically shorter than the maximum allowed. The median expected length of stay for families in UC shelters was 30–90 days. Almost 70 percent of families were in shelters with expected lengths of stay of 90 days or less; another 15 percent were in shelters with expected stays of 3–6 months; and the remainder were in shelters with stays expected up to a year. None of the programs thought families would stay longer than a year. Exhibit 2-15 shows the distribution of families staying in shelters with maximum and expected lengths of stay.
Exhibit 2-15: Duration of UC housing assistance
Program features
Percent of families referred to UC
shelters with these maximum lengths of
stay (n=726)
Percent of families referred to UC
shelters with these expected lengths of
stay (n=726) Less than 30 days 1 6 30–90 days 43 65 More than 90 days, less than 6 months 9 11 6 months 8 2 7–12 months 6 14 More than 12 months 3 0 No limit/no maximum 30 2
Source: Program data forms and random assignment records
Note: Two providers (representing 13 families) did not provide information on length of stay and were excluded from this exhibit.
Family rent contributions and savings requirements in UC shelters
As shown in Exhibit 2-16, three-quarters of families were in shelters that allow families to stay in shelter without paying rent or a program fee, but more than half are in shelters that require them to save money while they are enrolled in the program. Of one-quarter that are required to pay a fee during their stay, most families (85 percent) are in shelters that require them to pay a flat amount (e.g., $7 per day), and 15 percent are in programs that determine the amount based on a percentage of a family’s income. UC programs typically provide food for families, but one-third of families were in programs that do not provide any food, and 16 percent of families were in programs that require them to provide at least some of their own food. Some program staff indicated that families receiving SNAP had to contribute a portion of their SNAP benefits to offset the cost of the food provided by the program.
Chapter 2
Family Options Study Interim Report pg. 31
Exhibit 2-16: Family rent contributions and savings requirements in UC shelters
UC shelter program features
Percent of families referred to UC programs with these characteristics (n=737)
Are families required to pay a program fee or rent? Yes 24% No 76
(If Yes) How is the program fee/rent determined? Percentage of income 15% Flat amount based on family or unit size 85
Does the program require families to save money while in the program? Yes 59% No 41
Who is responsible for food for participating families? Families provide own food 32% Program provides food 52 Both 16
Source: Program data forms and random assignment records
Note: One program (representing two families) did not provide this information and was excluded from this exhibit.
Assessment of families in UC shelters All 51 shelter programs indicate that they conduct a formal assessment of study families at the beginning of the program. The assessments are comprehensive. Almost all families assigned to UC were recruited from shelters that assess family needs related to housing, self-sufficiency, employment, health, mental health, substance abuse, and child-specific needs, and 50 percent of families assigned to UC were recruited from programs that indicated that they also assess life skills and 44 percent for parenting. Assessments typically result in a formal service plan (or equivalent) with goals for the adults in the household, designed to help families address their needs. Forty-two percent of families assigned to UC were in shelters that also work with families to develop goals for the children—a similar proportion to PBTH.
Supportive services in UC shelters In their role as the entry point to the homeless system, all the UC shelters offered families comprehensive client assessments, case management, direct provision of many supportive services, and referrals to mainstream programs or other programs to meet additional family needs. In many ways, the array of case management and services provided mirrors those offered in PBTH, with even lower case management ratios. While shelter programs indicated that case management emphasized placement in permanent housing, staff also indicated that case management is about more than housing—that it is about meeting client needs however clients define them. As a result, case managers appear to provide support and referrals to address a wide range of issues related to housing, employment, health, mental health, substance abuse, parenting, and children.
Exhibit 2-17 shows the array of services offered in UC shelters and the extent to which the service is provided through case management, by other program or agency staff beyond the case manager, or through a dedicated linkage with an external agency that was guaranteed to provide the service because of shelter enrollment. Some programs address a particular service through only one method while others use multiple methods. The second column of the exhibit shows the unduplicated percentage of families
Chapter 2
Family Options Study Interim Report pg. 32
referred to programs that offer each type of service. The subsequent columns report separately the percentage of families referred to programs that provide that service type through that specific means. In some cases, addressing a service through case management means provision of direct assistance by the case manager, whereas in other cases, addressing a service through case management means that the case managers provide referrals to other programs, advocate on behalf of the family to access care, help remove barriers to care, and coach or support a family as it attempts to complete its goals related to that service need.
The scope of needs addressed in UC shelters is very similar to those addressed in PBTH, although some services were slightly more prevalent in PBTH than in UC shelters. Essentially all of the shelter case managers worked with families on housing search and placement and self-sufficiency issues. In addition, case management was supplemented with other direct services in almost all programs. Eighty-seven percent of UC families were in shelters that provide access to physical health care, 77 percent in shelters that provide employment training, 76 percent in shelters offering child advocacy, 75 percent in shelters offering life skills, and almost as many were in shelters that offer access to mental health care and parenting services.
Exhibit 2-17: Types of supportive services offered in UC shelters and how they are delivered
Types of supportive services
Percent of families referred to UC shelters that offer these
services (n=737)
Percent of families in UC shelters that offer services of this type:
Through case management
By other program or agency staff
Through dedicated linkages with other
agencies Housing search and placement assistance 100% 99% 13% 0% Self-sufficiency (overall) 95 91 NA NA Childcare/after-school care 12 13 Financial management 5 6 Transportation 5 0 Help obtaining public benefits 1 0 Physical health care 87 73 7 40 Employment training 77 73 21 10 Child advocacy 76 76 2 0 Life skills 75 65 0 10 Mental health care 71 66 3 24 Parenting skills 66 66 5 14 Substance abuse 48 46 2 8 Family reunification 24 24 1 0
Source: Program data and random assignment records
Note: One program (representing two families) did not provide information on services and was excluded from this exhibit.
Case management in UC shelters
Case management is viewed as a core part of emergency shelter and the primary means of helping families to resolve the crises that resulted in homelessness. All but one shelter in this study provides case management to families. (The one shelter that does not is a crisis center that provides other direct supportive services and links families to other programs with case management.) Case management varies widely among the participating shelter programs, as shown in Exhibit 2-18, but the average case management ratio is 16 families per shelter case manager.
Chapter 2
Family Options Study Interim Report pg. 33
Exhibit 2-18: Case management intensity (ratio and frequency)
TOTAL 7 90 3 0 100 Source: Program data forms and random assignment records
Note: Four UC shelters (representing 31 families) did not provide complete information on case management intensity and were excluded from this exhibit. Some row and column totals may not equal sum of individual cells due to rounding.
More than one-third of UC families (37 percent) were in shelters with case managers who work with 10 or fewer families at a time, meeting with families weekly, if not daily. The same percentage of UC families was in shelters with case manager caseloads between 11 and 20 families, while just under one-quarter of families were in shelters with caseloads of more than 20 families. Ninety-eight percent of families were in shelters in which the case managers met weekly or more often (7 percent daily), and even in the programs with higher caseloads, case managers met with families biweekly. Families in emergency shelter most often met with their case managers for 30 45 minutes. Specific details are reported about each emergency shelter’s case management in Appendix B-7.
Case management is rarely offered after families move out of shelters. While some case managers keep an open door and may stay in touch with some families, most programs do not appear to provide a significant level of assistance after program participation.
Other supportive services in UC shelters
The primary service provided in shelter is case management, but shelters offer other direct services, by other staff within the program, by another program within the agency, or through dedicated linkages with other agencies. Exhibit 2-17 shows that the type of services offered varies from shelter to shelter, and that there are no services that are offered as universally as case management. The most common services offered outside of case management are physical health care, mental health care, employment training, childcare, and parenting classes. Almost half of the UC families were in shelters that offer direct health care services, most often through an on-site clinic operated by another agency or through a dedicated linkage to an outside clinic. Other types of services were formally offered at UC programs serving fewer than one-quarter of UC families. In addition to the services offered directly by the program or a formal partner, families are also routinely referred to other agencies to receive other types of services needed to address their needs.
Eligibility criteria for UC shelters In many cases, UC shelters have eligibility criteria that limit the types of families served by the program. Since all families in the study had to meet these criteria in order to be in shelter and recruited for the study in the first place, these criteria are explained in Chapter 4 as part of the baseline description of the families enrolled in the study. Program rules in UC shelters Families in UC had to comply with shelter rules in order to remain in shelter. As shown in Exhibit 2-19, 93 percent of UC families were in shelters with a curfew, 96 percent were in programs that limited
Chapter 2
Family Options Study Interim Report pg. 34
overnight visitors, 70 percent were in programs that limited daytime visitors, and 87 percent were in programs that explicitly required participation in services or activities in order to remain in the shelter. While more stringent in terms of curfews and visitors, the rules for families in shelter parallel the rules identified for PBTH programs. Exhibit 2-19: Types of program rules in UC shelters
Types of program rules Percent of families in UC shelters with these types of rules (n=737)
Weekday curfew 93 Weekend curfew 22 Limit on daytime visitors 70 Limit on overnight visitors 96 Compliance with mandatory service requirements 87
Source: Program data and random assignment records
Note: One program (representing two families) did not report information on program rules and was excluded from this exhibit.
2.6 Summary of the study interventions
This chapter describes each of the four interventions studied and the key differences between them. Although this study is not a demonstration project in which interventions were required to show fidelity to a specified program model, the data collected from the participating programs confirm that the interventions are distinct from each other in the ways intended by the study’s design, particularly in relation to the intensity of the housing assistance provided and the intensity of the services provided. Exhibit 2-20 provides a simple illustration of the comparisons expected through this study. The programs represent the types of programs that are available to homeless families across the 12 study sites. As a result, findings about their relative impacts are anticipated to be relevant to policymakers, practitioners, and researchers.
Exhibit 2-20: Summary of intervention features that will be compared through the Family Options Study
No/low service intensity Medium/high service intensity
Short-term housing assistance CBRR UC shelters
Medium-term/long-term housing assistance SUB PBTH
CBRR and SUB both place and subsidize families in community-based apartments or single-family homes, whereas PBTH and UC shelters primarily provide temporary housing assistance in project-based facilities. On average, UC shelters provided the shortest housing assistance (two-thirds of shelters estimated that families leave shelter within 90 days), followed by CBRR, for which 3–6 months of assistance is typical. PBTH is next, with a median expected stay of 13–18 months. Finally, SUB provides rental assistance for years, as long as tenants abide by the terms of their assistance. In terms of supportive services, SUB provides only very limited housing placement services and CBRR provides limited case management focused primarily on housing and income growth, with large family-to-case manager ratios. UC shelters and PBTH both provide comprehensive assessments with intensive case management and a wide array of direct services provided directly by agency staff or through formal linkages to external partners.
The research team also identified key differences in terms of how each of these intervention types selected families. PBTH programs impose the most restrictive eligibility requirements, whereas SUB programs have the least. Chapter 3 describes the implementation of the study and the implications of
Chapter 2
Family Options Study Interim Report pg. 35
these criteria for random assignment, and Chapter 6 includes some observations by the research team related to the effect of these criteria on the accessibility and responsiveness of these programs for homeless families.
Chapter 3
Family Options Study Interim Report pg. 36
Chapter 3: Implementing the study
This chapter describes the study’s implementation. It includes a description of the processes for recruiting and enrolling families in the study and for referring families to the assigned intervention after random assignment. Finally, the chapter discusses the conditions established for conducting random assignment to ensure that families would be assigned to available interventions for which the family appeared eligible. Throughout, the chapter highlights lessons that were learned about implementing a rigorous research study in the homeless assistance service setting.
3.1 Study design
The Family Options Study is conducted as a randomized experiment. From September 2010 through January 2012, the research team enrolled 2,307 homeless families into the study in 12 sites. Each family was randomly assigned to one of two, three, or four interventions.
In an effort to maximize the likelihood that families randomly assigned to the study interventions could actually receive the assigned intervention, the research team established conditions that had to be met for random assignment to proceed:
1. Families had to meet the basic eligibility requirements for participation in the study and had toconsent to enroll in the study.
2. Intervention slots25 had to be available at the time of random assignment or anticipated within30 days.
3. Families had to meet program eligibility criteria for at least one available slot in two ormore interventions.26
Enrollment in the study and conducting random assignment was a multi-step process, as shown in Exhibit 3-1.
25 Throughout this report we use the term slot to refer to opportunities for placement in a study intervention. For SUB intervention, a slot refers to a housing choice voucher or a unit in a public housing or project-based assisted development. For the PBTH intervention, a slot refers to a family’s housing unit or space at a transitional housing facility. For the CBRR intervention, a slot refers to rental assistance provided to the family to subsidize the rent of a housing unit in the community. When we refer to an intervention slot as available, we mean that there was an open space or opportunity for a family to be placed in that study intervention.
26 Initially, random assignment was contingent upon family eligibility for slots in at least three of the four interventions, but this condition was relaxed to two of the four interventions in August 2011 to maximize enrollment. Families were always assumed to be eligible for UC, so in practice this condition means that families initially had to meet eligibility screening for at least two of the three interventions beyond UC. This was later relaxed to one other intervention beyond UC.
Chapter 3
Family Options Study Interim Report pg. 37
Exhibit 3-1: Random assignment design
Eligibility for the study
To be considered for the study, families had to stay in a participating emergency shelter for seven days and include at least one child age 15 or younger living with the family. We excluded from the study families who left shelter after fewer than seven days because the more intensive interventions considered in this study may not be necessary for families who can resolve a housing crisis that quickly. During those first seven days, we expected shelters to continue to provide all services and referrals they ordinarily provide to help families leave shelter. The study population was further restricted to families who had at least one child 15 or younger. This requirement was imposed because measuring child outcomes is an important goal of the study and we wanted to make sure that the family would still have a child under the age of 18 at the time of follow-up data collection, 18 months after random assignment. Once deemed eligible for the study, program staff referred willing families to local site interviewers, who were part of the study team. The site interviewers met each family to explain how the study and random assignment
Chapter 3
Family Options Study Interim Report pg. 38
worked. Those who agreed to enroll provided informed consent.27 After obtaining informed consent, program staff determined whether the family was eligible for available intervention slots, and if so, administered the baseline survey. In families with only one adult present, that individual was interviewed. For families headed by couples, the research team interviewed women by preference, for two reasons. Some homeless assistance programs exclude men, and in cases of family separations the children are more likely to remain with the mother. In addition, some outcome measures such as psychological distress have different distributions for men and women in the population at large, so having greater homogeneity in the sample is desirable.
Availability of intervention slots
The research team contacted providers of programs participating in the study each week to ascertain current availability of intervention slots. The purpose of this regular monitoring of intervention availability was to ensure that families were randomly assigned to an intervention only when it would be possible for the family to enroll in that intervention. The UC intervention was always available in all sites, but other interventions were not always available. For example, PBTH was only available when a participating provider had a vacant unit that matched the size of the family. In some sites, CBRR was not always available because of funding limitations. PHAs that provided the SUB intervention through turnover in their regular voucher program only had a designated number of subsidy slots available each month. As a result, at some times vouchers were not available. Without weekly monitoring of availability, the team might have assigned families to interventions for which it would have taken several months for a slot to become open.
The PBTH intervention and, in some sites, the CBRR and the SUB interventions had multiple service providers in each site. An intervention was deemed “available” if at least one slot at one provider of that intervention in the site was currently available. Three of the 12 sites never were able to provide more than three of the four interventions.28 Section 3.2 discusses other implications of program availability for the study implementation and random assignment.
Eligibility of families for available slots
In an attempt to maximize the likelihood that families assigned to one of the interventions would be accepted by the intervention provider, the random assignment design was also conditioned on the specific eligibility requirements of each participating provider. Each provider of CBRR, PBTH, and SUB had its own eligibility requirements, with some providers having more stringent requirements than others.29 The study team collected the eligibility requirements of each participating provider, compiled them, and developed 100 separate eligibility screening questions. Families who consented to participate in the study were asked these eligibility screening questions to assess their eligibility for programs within their site.
27 The research team did not record information in the random assignment database about families who declined to provide informed consent. Across the 12 sites, 13 families declined to participate after hearing the explanation of the study. We do not have information about the characteristics of those who declined to participate because absent informed consent the team could not collect any information about these families.
28 Atlanta and Baltimore did not have subsidies (SUB) available for families in the study and Boston did not have providers of PBTH.
29 It was not necessary to screen for eligibility for UC since all families enrolled in the study were eligible for UC by definition (having stayed seven or more days in emergency shelter).
Chapter 3
Family Options Study Interim Report pg. 39
The household head was asked only the eligibility questions relevant to the providers that currently had slots available. Thus, eligibility for interventions and programs that did not have currently available slots was not assessed. A family was considered “eligible” for a particular intervention if the household head’s responses to the eligibility questions showed that the family met the eligibility requirements for at least one provider of that intervention that currently had an available slot.30 This process allowed families to understand the requirements of available programs and to remove themselves from consideration for programs for which they would likely not be eligible.
This pre-random assignment eligibility screening was not a formal eligibility determination process. Instead, the families’ reported responses to questions were used to indicate apparent satisfaction with specific eligibility requirements of the participating programs. An example of the type of question asked related to requirements for sobriety is:
Some programs will only accept families in which the head of household is clean and sober and who can demonstrate at least 30 days of sobriety. Would you like to be considered for programs with this requirement?
Upon random assignment to an intervention and referral to an intervention provider, families had to complete the program’s regular eligibility determination process, including, in some cases, criminal background checks, drug testing, and income verification. We found that in some cases families were determined ineligible for the program after completing the program’s eligibility determination process, despite having passed the pre-random assignment eligibility screening specific to the program (see Chapter 5 for more information about the experiences of families in enrolling in the assigned interventions).
Eligibility screening questions
The 100 eligibility screening questions can be grouped into 18 categories, including minimum income requirements, maximum income limits, and credit history to family composition, criminal history, and willingness to comply with mandatory service participation requirements. Exhibit 3-2 displays the categories of eligibility criteria the providers asked the research team to include in the pre-random assignment screenings and examples of the requirements. Typically, programs imposed eligibility requirements in multiple categories.
Exhibit 3-2: Categories of eligibility screening questions
Categories of eligibility requirements Some programs only allowed families…
Minimum income With a reliable and consistent source of income With incomes higher than minimum thresholds
(e.g., $500, $1,000, $1,200, $2,000) With at least one employed adult Willing and able to work
Maximum income With demonstrated substantial loss of income in the past 12 monthsRequired to pay some rent or program fee
Who agreed to pay a monthly fee or rent
30 The random assignment algorithm accessed through the website prompted the interviewer to ask only the questions relevant for each family at the time of random assignment, depending on programs with availability.
Chapter 3
Family Options Study Interim Report pg. 40
Categories of eligibility requirements Some programs only allowed families…
Credit and housing history Who met minimum credit requirements Who were able to secure utilities (no prior arrears and able to pay
deposit if required)Some programs did not allow families:
o With a history of evictionso With an eviction from a federally assisted housing program
Debt owed to housing authority
Who either did not owe arrears to a housing authority or who could payany debt immediately
Education or work experience
In which an adult member of the household had a high school diploma orGED or is pursuing further education or training
Family composition With single parent households With children under a specific age threshold With parents with demonstrated legal custody for children staying with
themSome programs did not allow families:
o With male household members over 18o With adolescent boyso With female heads of household under 21 years of age
Unit size In which the number of persons in the household can be accommodatedin the available unit
Health screening requirement
Who pass a TB test Who participate in a bed bug screening
Domestic violence Who are (or are not) victims of domestic violenceDisability requirement With a documented disability
With a woman in recovery from substance useSobriety or treatment With a period of sobriety before entry
That can demonstrate sobriety through drug and alcohol testingCriminal history In which adult members of the household pass criminal background
checkSome programs did not allow families:
o With an adult conviction for violent crime or sexual offenseo With a family member conviction for drug felony or sale or
manufacturing of drugsCitizenship status With proof of legal residency or citizenship
With state or federal-issued identification and Social Security cards forall members of the household
Mandatory service participation
Who agreed to participate in case management In which all children are enrolled in school or with appropriate child care
Geographic location Whose residence prior to emergency shelter was within city or municipallimits
Who have a previous connection (employment, family, or priorresidence) in area where program located
Housing stability history Who first became homeless in the past 12 monthsSome programs did not allow families:
o Who have been homeless multiple times or for extended periodsof time
Source: Eligibility requirements self-reported by study participating programs
Chapter 3
Family Options Study Interim Report pg. 41
Random assignment
The study will generate separate impact estimates for each pairwise comparison, including the six pairwise comparisons of a single intervention compared to another intervention, plus additional comparisons of pooled interventions compared to a single intervention. The details of the analysis are provided in the Revised Data Collection and Analysis Plan.31
The six pairwise comparisons that will be measured through this design are diagrammed in Exhibit 3-3 and can be stated as the following questions:
1. What is the impact of PBTH assistance for homeless families compared to UC offered in thecommunity?
2. What is the impact of SUB assistance for homeless families compared to UC offered inthe community?
3. What is the impact of CBRR assistance for homeless families compared to UC offered in thecommunity?
4. What is the impact of PBTH assistance for homeless families compared to SUB assistance?
5. What is the impact of PBTH assistance for homeless families compared to CBRR assistance?
6. What is the impact of SUB assistance for homeless families compared to CBRR assistance?
Exhibit 3-3: Contrasts among experimental interventions
The approach to random assignment for this study—conditioned on intervention availability and family eligibility—means that each family falls into a “randomization set.” This is the group of interventions to which it was possible for a family to be assigned based on the assessed eligibility of the family for at least one available program within an intervention. In the study, each family can be part of one of seven randomization sets. These sets are {CBRR, PBTH, SUB, and UC}, {PBTH, SUB, UC}, {CBRR, PBTH, UC}, {CBRR, SUB, UC}, {PBTH, UC}, {SUB, UC}, and {CBRR, UC}.
The randomization set of each family is important to the analysis because it determines the pairwise comparisons in which the family will be included (this is discussed further in Chapter 6).
31 Gubits et al. (2012), Family options study: Revised data collection and analysis plan.
Chapter 3
Family Options Study Interim Report pg. 42
The cumulative result of program availability and family eligibility is that most study families could not be considered for all four interventions at the time of random assignment. In other words, most families are in a randomization set with fewer than four interventions. Of the 2,307 families enrolled in the study, 477 had all four assignment options available to them at random assignment. Another 1,565 families had three assignment options, and 265 families had two assignment options (see Exhibit 3-4). In Section 3.2 we examine in more detail the role that program availability and family eligibility played in determining the random assignment options for families.
Exhibit 3-4: Number of families in each randomization circumstance
Randomization circumstance Number
of families Percent of families
enrolled Total number of families screened for random assignment 2,490 Total number of families determined ineligible for random assignment (because not eligible for available interventions)a
183
Assignment among four interventions 477 21% Assignment among three interventions 1,565 68% Assignment among two interventions 265 11% Total number of families enrolled 2,307
Source: Random assignment records
a Families who after responding to provider-specific eligibility questions were assessed as eligible for only two (initially three) interventions available to them were not enrolled in the study. In total, 183 families were not enrolled in the study for this reason.
Using randomization sets as a basis for the impact analysis ensures that comparisons are internally valid—that is, they use appropriately matched groups across interventions and, in expectation, any observed differences in outcomes are caused by the differential treatment families receive and not by any pre-existing differences among the families. An analysis of the equivalence of baseline characteristics in pairwise comparisons is provided in Chapter 4.
3.2 Role of program availability and family eligibility on the randomization options for families
Exhibit 3-5 displays the number of families enrolled in the study who were randomly assigned to one of four, three, or two interventions. This section explores further the extent to which program and intervention availability and family eligibility limited the randomization options available to the enrolled participants.
Ideally, all enrolled study participants would have had the opportunity to be randomized to any one of the four interventions. This was not possible because intervention slots were not always available and families were not always eligible for the available intervention slots. As shown in Exhibit 3-5, only 477 families had the opportunity to be randomized to any of the four interventions. The remaining 1,830 families in the study were randomly assigned to one of two or three interventions.
The bottom panel of Exhibit 3-5 shows the total effect of program availability and family eligibility on random assignment. Family eligibility restricted random assignment options for 463 families who enrolled in the study (20 percent). Family eligibility restrictions were most commonly associated with ineligibility for available PBTH programs. Indeed, nearly three-quarters of random assignment options that were lost due to eligibility (356 families) were prevented from assignment to PBTH. Corresponding numbers were 86 families for CBRR and 30 families for SUB.
Chapter 3
Family Options Study Interim Report pg. 43
Exhibit 3-5: Effect of program availability and family eligibility on random assignment options
Random assignment circumstance
Lost an intervention due to availability (in
a site where the intervention was
permanently unavailable)—number
of families
Lost an intervention due to availability (in a site where
the intervention was generally available, but not at time of RA)—number of
families
Lost an intervention due to eligibility—number of
families Total (percent of total enrollment)
Assigned among four interventions 0 0 0 477 (21%)
Assigned among three interventions: Lost one intervention
318 951 296 1,565 (68%)
Assigned among two interventions: Lost two interventions, solely due to program availabilitya
34 98 98 (4%)
Assigned among two interventions: Lost two interventions, solely due to family eligibility
9 9 (0%)
Assigned among two interventions: Lost one intervention due to program availability and one due to family eligibility
78 80 158 158 (7%)
Total effect on randomization 430 (19%) 1,129 (47%)
463 (20%) 2,307 (100%) 1,559 (68%)
Relative proportion of interventions lost
b PBTH 743 (46% of RA options lost to availability) CBRR 383 (24% of RA options lost to availability ) SUB 497 (31% of RA options lost to availability)
c PBTH 356 (75% of RA options lost to eligibility) CBRR 86 (18% of RA options lost to eligibility) SUB 30 (6% of RA options lost to eligibility)
Source: Random assignment records
a Note: Of the families who lost two interventions to program availability, 34 lost one intervention because it was permanently unavailable in the site and one because it was not available at the time of random assignment (but generally available in the site). Sixty-four families lost two interventions because neither was available at the time of random assignment (but both were generally available in the site).
b Note: This cell reports the number of random assignment options lost because of program unavailability. The 98 families who lost two interventions because of program availability are counted here in each of the interventions that were not included in their options for random assignment.
c Note: This cell reports the number of random assignment options lost because of family ineligibility. The nine families who lost two interventions because of family ineligibility are counted in each of the interventions that were not included in their options for random assignment.
Chapter 3
Family Options Study Interim Report pg. 44
Altogether, program availability limited the random assignment options for more than half of families who enrolled in the study (1,559, or 68 percent). Of those, 1,129 (47 percent of families enrolled) had random assignment options limited because the intervention was not available at the time of random assignment. A total of 430 families (19 percent of those enrolled) were restricted in their random assignment options because an intervention was not available at all in a site. Similar to eligibility, program unavailability was most common for PBTH programs (see final row of Exhibit 3-5). Altogether, 46 percent of families whose random assignment options were restricted due to program availability were unable to be assigned to the PBTH intervention. Restrictions in availability of SUB affected 31 percent of families unable to access an intervention for availability, and nearly one-quarter of families affected by program availability were unable to be considered for CBRR.
Using information about the specific screening questions posed to families and their responses, we can explore the types of eligibility requirements that were most prevalent in restricting families’ eligibility for PBTH programs.
The eligibility requirements that most frequently eliminated families from consideration for PBTH were:
Family was not eligible for the unit size available. Family did not meet minimum income or employment requirements. Family composition did not match program requirements.
The eligibility requirement that most frequently eliminated families from consideration for CBRR was:
Family did not meet minimum income requirement.
The requirements that most frequently eliminated families from consideration for SUB were:
Family owed arrears to a PHA or had previous evictions from a SUB program.
Family did not meet criminal background requirements.
As stated previously, the purpose of the pre-random assignment eligibility screening was to maximize the likelihood that families assigned to an intervention would be accepted by the intervention provider. The pre-random assignment eligibility screening was not foolproof, however. When some families contacted the provider to which they had been referred, the providers conducted their regular formal eligibility determination. Some families found out at that point that they were ineligible to receive assistance from the provider for one reason or another. The study collected information on these reasons why some families were deemed ineligible by providers (though this information is not available for all families). Chapter 5 discusses what these incomplete data show were the most common reasons that some families were found ineligible in provider screening and finds that they are consistent with the most common reasons found in the pre-random assignment eligibility screening.
Comparing the number of families that were not considered for an intervention, we see that intervention availability was more prevalent than family eligibility in preventing families from being randomly assigned to one of the four interventions.
Chapter 3
Family Options Study Interim Report pg. 45
3.3 Random assignment algorithm
The site interviewer conducted random assignment via a secure random assignment website, designed specifically for this study to manage information on program availability, eligibility questions, and family responses relative to the program eligibility. Using an algorithm that determined which interventions the family should be considered for, the website automatically assigned families at random to one of those interventions. The research team established random assignment probabilities at the outset of the study based on the estimated number of slots in each intervention and estimated take-up rates. The team monitored the probabilities over time and made adjustments when indicated. More information about the random assignment probabilities and adjustments made is provided in Appendix C.
3.4 Referral to the assigned intervention
After random assignment, families were referred to one of the providers in the assigned intervention among those with availability and for which the family appeared to be eligible. Although assignment to intervention types was at random, families were not assigned to service providers within that intervention type at random. If there was more than one option within the assigned intervention (given availability and eligibility), the study team referred families to programs by rotating through the list of available programs in the assigned interventions, unless the family indicated a preference for a specific location.
Chapter 3
Family Options Study Interim Report pg. 46
Chapter 4: Baseline characteristics of the study sample
This chapter describes the families that are participating in the Family Options Study. The information presented in this chapter was collected from study families in the baseline survey at the time of their enrollment into the study. The first section of the chapter reviews the eligibility rules in place at the emergency shelters where families were recruited into the study and suggests how those rules may have affected the characteristics of the study sample. The second section describes the characteristics of the families enrolled in the study and compares them to the characteristics of homeless families found in national estimates and other research. The third section presents the results of statistical tests performed to verify that families are well-matched on important characteristics in the six pairwise impact comparisons of the study.
4.1 Selection of the study sample
Families had to stay in a participating emergency shelter for seven days before being considered for enrollment in the study. Therefore, any eligibility requirements that emergency shelters placed on shelter entry also served to shape the sample of families that were included in the study. Most emergency shelter programs did have some eligibility requirements, as is common across the homeless services system nationally. Thus, this sample reflects the characteristics of sheltered homeless families, not of unsheltered homeless families or families in crisis who are unable to enter shelter.
The most common restrictions, implemented by emergency shelter programs in 9 of the 12 study sites, related to the composition of the family entering emergency shelter. Some programs were not able to accommodate adult men or married couples in their program because the shelters provided congregate living situations. Other programs served only families with children under the age of five or did not accept adolescent-aged children. Collectively, these eligibility requirements served to limit the number of men, couples, and older children in study families below what they might have been without the restrictions.
The second most common type of eligibility requirement, observed in emergency shelters in eight of the study sites, related to sobriety and recovery. Some emergency shelter programs required adults with a history of substance abuse to have a specified period of sobriety before program admittance. In other programs, adults had to pass a drug and alcohol screening as part of the application process. A subset of emergency shelter programs was designed to assist families facing substance abuse issues and thus targeted their services to families with this need. The presence of both restrictions and targeting related to substance abuse leaves us unsure as to whether the eligibility requirements for the emergency shelters from which we recruited the study sample led to a higher or a lower number of families with substance abuse problems than what we might have seen without these requirements.
A third type of eligibility requirement related to domestic violence. Some emergency shelter programs would not accept families facing domestic violence, as they had concerns about their ability to protect families from their abusers. We would expect that these requirements led to a lower number of families facing domestic violence at baseline than otherwise might have been the case. We did not attempt to recruit shelters that specialize in serving victims of domestic violence into the study if they were not part of the homeless service system. Those shelters are typically part of a separate system of care.
Chapter 3
Family Options Study Interim Report pg. 47
4.2 Characteristics of the study sample
To understand how the families in this study compare with the national homeless family population, we compare our sample with two national estimates of family homelessness. The best current source of that information is HUD’s Annual Homelessness Assessment Report (AHAR), which uses administrative data collected locally to produce national estimates of the number and characteristics of sheltered homeless families, as well as people who are in shelter as individuals. The most recent AHAR describes families in shelter in 2010.32 An older source of information on homeless families is the National Survey of Homeless Providers and Clients (NSHAPC.)33 Although less current, NSHAPC provides survey-based, nationally representative information that is not available in the AHAR on the characteristics and life histories of homeless families. NSHAPC also includes information on both sheltered and unsheltered families. We also attempt to compare some of the characteristics of our study sample with those of samples from studies that were not national in scope but provide additional information about some of the characteristics and experiences of homeless families.
According to the AHAR, in 2010 about 430,000 adults and children in 122,000 families used emergency shelter services across the country.34 When comparing the 2,307 families in this study with the national population of homeless families that use emergency shelters, it is important to consider that to enter our sample a family must have spent at least seven days in shelter, and that roughly 25 percent of families using emergency shelters nationally do so for fewer than seven days.35 The families who use shelter for less than seven days may have social supports or financial resources that help them to exit homelessness quickly. The families in the study, by comparison, had lived in emergency shelter for at least seven days and may have had fewer financial resources and current social supports. That could mean that the study sample’s characteristics differ from those found for all sheltered homeless families in the AHAR. However, with limited exceptions, the observed characteristics of the study families are very similar to those of all sheltered homeless families.
Family composition
Exhibits 4-1 through 4-6 provide information about many characteristics of the families in the study. As mentioned in Chapter 3, in families with one adult, that individual was interviewed as the adult respondent. For families headed by couples, women were interviewed by preference. As shown in Exhibit 4-1, a typical family in the study consists of a female adult about 29 years old who has one or two children with her in the shelter. Thirty percent of families had more than one adult present at baseline. In most cases (27 percent of all families), a second adult was the spouse or partner of the adult respondent.
32 U.S. Department of Housing and Urban Development (2011), The annual homeless assessment report to Congress, Washington, DC.
33 Burt et al. (2009), Homelessness: Programs and the people they serve: Summary report. Washington, DC: Urban Institute.
34 The number of adults and children in emergency shelters (433,243) is from U.S. Department of Housing and Urban Development (2011), Appendix D-5. The number of families (121,601) is from unpublished data collected for The Annual Homeless Assessment Report to Congress.
35 U.S. Department of Housing and Urban Development (2011), The annual homeless assessment report to Congress, Appendix D-12.
Chapter 3
Family Options Study Interim Report pg. 48
In most of the families where a spouse or partner was present, the spouse or partner was the second parent (in addition to the adult respondent) of at least one child with the family in shelter.
About half of adult respondents reported that they had never been married, more than one-quarter (28 percent) said that they were married or living in a marriage-like situation,36 and one-fifth were separated, divorced, or widowed. The NSHAPC found similar patterns: 41 percent of adults in families reported that they had never been married, and 23 percent reported that they were married at the time of the survey.37
Exhibit 4-1: Family composition
Family characteristic Percent of adult respondents/
Percent of families
Family composition Adults Adult respondent is female 91.6% Average age of adult respondent 31.0 years Median age of adult respondent 29.0 years Adult respondent 24 or younger 27.1% Male adult respondent with no female wife/partner present 3.9% Two or more adults present in shelter 29.7%
2nd adult: spouse or partner 27.4% Spouse/partner is parent of (at least one) child with family 22.7%
2nd adult: adult child (age 18 or over) 1.4% Age of adult respondent at RA
Less than 21 years old 8.1% 21–24 years 19.0% 25–29 years 23.7% 30–34 years 18.3% 35–44 years 22.5% 45 years and older 8.3%
Number of adults present in shelter 1 adult 70.3% 2 adults 28.9% 3 or more adults 0.8%
36 There was some inconsistency among responses to survey items that asked about marital status and family composition. In response to the marital status item, 28 percent of adult respondents said they were married or “living in a marriage-like situation.” In responses to items about adults in the family who were currently with or not with the family in shelter, 37 percent of adult respondents stated they had a spouse or a “lover or partner” in their family either currently with or not with the family. Survey respondents may have interpreted “marriage-like” more narrowly (for example, to mean a common-law marriage) in answer to the survey question about their marital status than when they responded “lover or partner” to questions about adults who were either with them in shelter or who were part of the family but not present in the shelter.
37 Burt et al., 1999, Table 2.1, p. 14.
Chapter 3
Family Options Study Interim Report pg. 49
Family characteristic Percent of adult respondents/
Percent of families
Marital status of adult respondent Never married 51.7% Married or marriage-like situation 28.0% Separated/divorced/widowed 20.4% Number of children present in shelter
1 child 43.7% 2 children 30.0% 3 children 15.2% 4 or more children 11.1%
At least one child under 3 49.9% Mother is pregnant 9.7%
Source: Family Options baseline survey
A plurality of families (44 percent) had just one child under 18 present, and another 30 percent had two children with them in the shelter. Half of families included a child under the age of three, and nearly 10 percent of adult respondents reported that they were pregnant at baseline.
Based on a comparison to AHAR data on families in 2010, the size of study families is virtually identical to the size of families in emergency shelter and transitional housing nationally. In the study, about 32 percent of families are made up of two people (one adult and one child) and approximately 32 percent of study families are made up of three people (either two adults and one child or one adult and two children). The remaining 36 percent of study families have four or more members. The average size of families in the study is 3.29 persons. This is very close to the average size of families with children in emergency shelters and transitional housing nationally (3.37 persons).38
The AHAR has shown that homeless families tend to be smaller than other poor families.39 Earlier research has shown that homeless mothers are often separated from some of their children, both in shelter and after leaving shelter.40 The baseline survey for this study asked detailed questions on each person the respondent (usually the mother) considered to be part of the family, and whether or not the person was present in the shelter. Exhibit 4-2 shows that in approximately one-quarter of families in the study at least one child was separated from the family (i.e., living with other relatives, friends, in foster care, or in another living situation). Compared with the findings of other studies, fewer of the missing children were reported to have been placed in foster care. Only 1 percent of families in this study’s sample reported a child in foster care, whereas Park et al., in a study of homeless children in emergency shelters in New
38 National figures are calculations based on counts from the 2010 AHAR, Appendix D-1. Although AHAR data allow for a calculation of average family size of families in both emergency shelters and transitional housing together, they do not permit a separate calculation of family size of families in emergency shelter only.
39 U.S. Department of Housing and Urban Development (2011). The annual homeless assessment report to Congress, Exhibit 3-5, p. 21.
40 See Cowal, K., et al. (October 2002), Mother-child separations among homeless and housed families receiving public assistance in New York City, American Journal of Community Psychology, 30:5, and Park, J. M., et al., Child welfare involvement among children in homeless families, Departmental Papers, University of Pennsylvania, School of Social Policy and Practice, 2004.
Chapter 3
Family Options Study Interim Report pg. 50
York City, found that about 6 percent of children had had some involvement with the child welfare system (either placed in out-of-home care or received preventive services without out-of-home placement) prior to their first shelter stay.41 Some of the difference may reflect differences in child welfare systems across jurisdictions. NSHAPC data suggest that perhaps as many as 9 percent of children of homeless women are in foster care while their parent is homeless.42
Exhibit 4-3 shows that older children are more likely than younger children to be separated from their parent in emergency shelter. This exhibit also shows the high number of children under age 6 with families in the study.
Exhibit 4-2: Family separation
Family characteristic Percent of adult respondents Family separation—members not with the adult respondent in the emergency shelter Child separations At least one child is not present 23.9% Two or more children are not present 9.9% A child younger than 3 is not present 2.5% A child aged 3–6 is not present 7.2% A child aged 7–12 is not present 10.7% At least one child is in foster care 0.7% Adult separations An adult partner is not present 10.1%
41 Park, et al., 2004. 42 Burt, M., Aron, L. Y., & Lee, E. E., with Valente, J. (2001). Helping America’s homeless: Emergency shelter or
affordable housing? Washington, DC: Urban Institute Press. Table 5.3, p. 146.
Chapter 3
Family Options Study Interim Report pg. 51
Exhibit 4-3: Number of children with and not with the family in shelter, by age
0
200
400
600
800
1000
1200
1400
1600
0 to 2 yearsold
3 to 5 yearsold
6 to 8 yearsold
9 to 11 yearsold
12 to 14 yearsold
Num
ber o
f chi
ldre
n in
stu
dy
Age of child
Children with parent Children not with parent
15 to 17 yearsold
Across all 12 study sites, the racial characteristics of families in the study sample are similar to those of homeless families nationally, with an overrepresentation of African-Americans when compared with the poverty population overall.43 Approximately 41 percent of study families are African American and not Hispanic or Latino, and 20 percent are Hispanic or Latino (all races). White families are slightly underrepresented among the study cohort compared to homeless families in emergency shelter nationally. About 21 percent of the study families identified as white, non-Hispanic/non-Latino, compared with 31 percent of people in families in emergency shelters nationwide.44 Racial characteristics of families varied widely among sites, however, as shown in Exhibit 4-4. For example, the percentage identifying themselves as African-American and not Hispanic ranges widely—86 percent in Atlanta, 41 percent in Boston, 25 percent in Phoenix, and 1 percent in Honolulu.
43 U.S. Department of Housing and Urban Development (2011), The annual homeless assessment report to Congress, Exhibit 3-1, p. 16.
44 Ibid, Appendix D-5. Calculation is based on the 91 percent of families for whom race and ethnicity information was available.
Chapter 4
Family Options Study Interim Report pg. 52
Exhibit 4-4: Family race/ethnicity, by site
Number of families in study sample
% Hispanic, all races
% White, non-Hispanic
% African-American,
non-Hispanic
% Asian/Pacific Islander,
non-Hispanic
% Mixed race, non-Hispanic,
and other
All sites 2307 20% 21% 41% 7% 11%
Alameda County 262 19% 12% 56% 5% 8%
Atlanta 191 6% 3% 86% 0% 4%
Baltimore 58 0% 10% 79% 2% 9%
Boston 181 43% 10% 41% 1% 6%
Connecticut 214 30% 13% 47% 0% 10%
Denver 172 38% 25% 26% 1% 9%
Honolulu 221 10% 4% 1% 61% 24%
Kansas City 179 6% 35% 54% 1% 5%
Louisville 110 5% 27% 55% 1% 13%
Minneapolis 182 5% 12% 64% 2% 17%
Phoenix 281 27% 33% 25% 1% 14%
Salt Lake City 256 28% 52% 6% 4% 11%
Source: Family Options baseline survey
Chapter 4
Family Options Study Interim Report pg. 53
Housing stability and history of homelessness
As shown in Exhibit 4-5, most families in the study were not homeless just prior to entering the shelter from which they were recruited into the study. Only 21 percent described their pre-shelter living situation in a way that would be defined by HUD as homelessness.45 This rate is similar to the national rate of 24 percent.46 Most families in the study entered shelter from housing—either their own housing unit or that of a friend or family member. About 26 percent rented or owned their own housing, identical to the national rate; 46 percent were living with family or friends, compared with 48 percent nationally.47
Exhibit 4-5: Housing stability and history of homelessness
Family characteristic Percent of adult respondents Housing instability and history of homelessness Housing just prior to shelter stay Owned or rented house or apartment 26.1% With friends or relatives, not paying rent 24.7% With friends or relatives, paying rent 20.9% Homelessa 20.5% Hotel or motel, paid by self 4.1% Partner’s place 3.0% Treatment or permanent housing program 1.0% Homeless history Time since last had regular housing median: 7 days Prior episode of homelessness 62.8% Total homelessness in life median: 6 months Doubled up history Doubled up as adult because couldn’t pay rent 84.6% Time doubled up last five yearsb median: 1 year Childhood instability Homeless as child 15.9% Foster care, group home, or institution as child 27.1%
Source: Family Options baseline survey
a Living situations included in the definition of homeless are other emergency shelter (6.8%), voucher hotel or motel (4.0%), car or vehicle (3.1%), transitional housing (2.8%), domestic violence shelter (1.9%), anywhere outside (1.6%), and abandoned building (0.2%).
b Time doubled up in last five years or time doubled up since age 18 for those ages 18–22.
45 Living situations considered literally homeless are emergency shelters, voucher hotel or motels, car or vehicle, transitional housing, domestic violence shelter, anywhere outside, and abandoned buildings. This is consistent with the current HUD definition of homelessness, which includes living in emergency shelters, transitional housing, or places not meant for human habitation.
46 Ibid, Exhibit 3-8, p. 23. 47 Ibid, Appendix D-9. Percentages reported here are based on the 94 percent of families for whom prior living
situation information was available.
Chapter 4
Family Options Study Interim Report pg. 54
Some of those who had been staying with family or friends had been paying part of the rent, but about 25 percent of study families said their previous living situation was living with family or friends and not paying rent. No national comparison statistic is available, as the administrative data used in the AHAR do not include information about rent payments by families in doubled-up situations.
For nearly two-thirds of the sample, this was not their first episode of homelessness. About 63 percent of adult respondents in the study had experienced homelessness at some other point in their lifetime, with about 16 percent of adult respondents having experienced homelessness as a child. For adult respondents with a history of homelessness, the median length of lifetime homelessness was six months. The rate of prior homelessness in the sample is greater than the rate for homeless adult respondent interviewed for NSHAPC, which was 50 percent.48 Part of the difference may be explained by the fact that the NSHAPC survey was conducted about 15 years earlier than this study’s baseline enrollment period. Many of the adults surveyed in NSHAPC had come of age at a time when homelessness was less common.
Twenty-seven percent of adult respondents in this study’s sample had lived in foster care, group homes, or some institutional setting as a child, and 85 percent indicated that they were doubled up at some point as an adult, defined as “staying with family or friends because you couldn’t find or afford a place of your own.”
NSHAPC showed very similar patterns of childhood housing instability among people who subsequently became homeless, with about 25 percent of the adults in homeless families reporting that they had been in foster care, a group home, or another institutional setting as a child.49
Income stability and disability
Study information on employment, income, and program participation of families in the study provide insight into the severity of income barriers currently faced by families in emergency shelters. As shown in Exhibit 4-6, most adult respondents in the study were not working at the time of enrollment (83 percent), and more than half had not worked for pay in the previous six months. Approximately 45 percent had not worked in more than a year, and 30 percent had not worked in the past two years. For the 17 percent that were working at the time of enrollment, median hours at their main job were 30 hours a week, and median annualized earnings were about $12,000 per year. Looking at the employment of all adults in the family, about 22 percent of families had one adult working (either the adult respondent or another adult family member), and about 2 additional percent of families had two adults working. The median household income of all families in this study was $7,440 at the baseline interview. Approximately one-fifth had incomes at or less than $2,880 per year and one-fifth had incomes at or greater than $15,000 per year. Data collected by NSHAPC some 15 years earlier show an average income for homeless families of $8,172 (in 2011 dollars)50 and that 71 percent had not worked in the previous month.51
48 Burt et al., 1999, Table 2.7, p. 31. 49 Burt et al., 2001, Table 3.8, p. 90. 50 The average income of NSHAPC homeless families in 1996 dollars is $5,700. This amount is adjusted to
2011 dollars using the Consumer Price Index for All Urban Consumers (CPI-U), ftp://ftp.bls.gov/pub/special.requests/cpi/cpiai.txt (accessed July 25, 2012).
Family characteristic Percent of adult respondents/
Percent of families
Income stability and disability Employment history of adult respondents No work past week 82.8% No work past 6 months 57.0% No work past 1 year 45.0% No work past 2 years 30.4% Job characteristics for 17% of adult respondents who are working Earnings at main job median: $11,856 Hours per week at main job median: 30.0 hours Employment of adults in family One adult working for pay 22.4% Two adults working for pay 2.1% Current family income 20th percentile $2,880 50th percentile (median) $7,440 80th percentile $15,000 Annual family income categories Less than $5,000 32.0% $5,000–$9,999 29.7% $10,000– $14,999 17.6% $15,000–$19,999 9.1% $20,000–$24,999 5.5% $25,000 or more 6.1% Public program participation SNAP (food stamps) receipt 87.8% TANF Receipt 41.2% SSI receipt 9.6% UI receipt 7.3% Child support receipt 14.2% WIC receipt 35.8% Medicaid receipt 60.0% State health insurance receipt 22.6% State children’s health insurance (SCHIP) receipt 32.2% At least one of Medicaid, state health insurance, or SCHIP 86.1% Disability status Disability and/or disabled family member 38.8% Adult respondent has disability that limits/prevents work 21.4% Non-head age 15+ has disability that limits/prevents work 7.1% Child under age 15 has disability 17.0% Educational attainment Less than high school diploma 36.5% High school diploma/GED 36.6% Greater than high school diploma 26.9%
Source: Family Options baseline survey
Chapter 4
Family Options Study Interim Report pg. 56
Most families in the study receive some form of public assistance. Eighty-eight percent of families in the study receive SNAP, and 10 percent receive Supplemental Security Income (SSI) for someone in the family. The percentage (41 percent) of families receiving Temporary Assistance to Needy Families (TANF) is somewhat higher than the national take-up rate for TANF of 36 percent.52 Many families in the study receive Medicaid benefits (60 percent), state health insurance benefits (23 percent), or State Children’s Health Insurance (32 percent). About 86 percent of families participated in at least one of these health insurance programs. Rates of receipt of SNAP were somewhat lower for adults in families interviewed for NSHAPC (71 percent), about the same for SSI (11 percent) and for Medicaid (61 percent), and higher for welfare (52 percent; at that time, Aid to Families with Dependent Children was still available).53
Families in this study have a high rate of self-reported disability. Thirty-nine percent of families have at least one family member with a self-reported disability. About 21 percent of adult respondents said that they have a disability that would limit or prevent them working, and 7 percent of families have a family member age 15 or older with a disability that limits or prevents him or her from working. Some 17 percent of families have at least one member of the family age 14 or younger who has a disability. Of adult respondents without a disability, about 7 percent said that caring for another disabled family member (adult or child) limited their ability to work. National health data show that only 4.5 percent of adults ages 18–44 and 11.3 percent of adults ages 45–64 have a disability that limits their ability to work at a job or business.54 National homeless data report on the disability status of adults in homeless families. Approximately 14 percent of families in emergency shelter identify an adult family member with a disability.55 The higher rate of disability among study families could be associated with disadvantages that cause them to stay in shelter for seven days or more or it could simply reflect the way in which disability status is collected for this study compared with the administrative data used for the AHAR.
Other barriers to increasing income or finding housing
Data on homeless survivors of domestic violence is both sensitive and uneven. Often emergency shelters serving families fleeing domestic violence do not identify as serving a homeless population or are not a part of the local Homeless Management Information System (HMIS) reporting on emergency shelter usage. As shown in Exhibit 4-7, 49 percent of adult respondents in this study reported that they have experienced physical abuse or been threatened with violence by a spouse or partner. Other studies have shown even higher rates of domestic violence. For example, Bassuk et al. (1996) report results of a study of homeless and housed mothers receiving public assistance in Worcester, Massachusetts, indicating that 63 percent of homeless mothers, and almost as high a percentage of those who had not become homeless
52 In 2007, the most recent year available, 36 percent of families eligible for TANF received TANF assistance. Loprest, P. (2012). How has the TANF caseload changed over time? Urban Institute Research Brief #08, p. 2.
53 Burt et al., 1999, Table 2.6, p. 29. 54 Survey of Income and Program Participation (SIPP), Prevalence and most common causes of disability among
adults–United States, 2005, Morbidity and Mortality Weekly Report, May 1, 2009, 58. (16), 421-426. 55 U.S. Department of Housing and Urban Development (2011), The annual homeless assessment report to
Congress, Appendix D-5. Percentage reported here is based on the 96 percent of families for whom disability information was available.
Chapter 4
Family Options Study Interim Report pg. 57
(58 percent), reported that they had been severely physically assaulted by an intimate partner as adults.56 The Worcester study asked a detailed series of questions about such incidents as being slapped repeatedly, hit with a fist, hit with an object, or threatened with a knife or gun, whereas the baseline survey for this study asked only one general question about physical abuse or threats of violence.
Exhibit 4-7: Barriers to increasing income or finding housing
Family characteristic Percent of adult respondents/
Percent of families
Barriers to increasing income or finding housing
Exposure to violence and mental health DV by spouse or partner 48.9% PTSD symptoms 21.6% Psychological distress 22.0% Prior housing history—problems finding housing History of evictiona 25.9% big or small problem Never a leaseholdera 34.6% big or small problem Other barriers to housing Felony conviction of at least one adult family member 14.1% Felony conviction of adult respondent 11.2% Felony conviction of non-head family member 4.7% Drug abuse 14.1% Alcohol abuse 11.2%
Source: Family Options baseline survey
a Information was only collected on history of eviction and never having been a leaseholder if the respondent thought these presented a problem in finding a place to live.
Mental health and substance use issues are frequently identified as barriers faced by people experiencing homelessness. These issues are more prevalent among homeless individuals than they are among homeless families. Employment status and broader economic challenges are more often identified as the central cause of family homelessness.57
A history of drug use within the past year was identified by 14 percent of the adult respondents, and 11 percent responded to survey questions in a way that suggested alcohol abuse within the past year.58 These are substantially lower rates than reported by homeless adults in families to NSHAPC (38 percent
56 Bassuk, E. L., et al., The characteristics and needs of sheltered homeless and low-income housed mothers, American Journal of the American Medical Association, 276, 1996, Table 3, p. 643.
57 Rog, D. J., & Buckner, J. C., Homeless families and children, in Toward Understanding Homelessness: The 2007 National Symposium on Homelessness Research. U.S. Department of Health and Human Services, Assistant Secretary for Planning and Evaluation and U.S. Department of Housing and Urban Development, Office of Policy Development and Research, 2007.
58 The baseline survey asked the four items in the Rapid Alcohol Problem Screen-4 (RAPS-4; Cherpitel 2000). An affirmative answer to any of the four items indicates an alcohol problem. The baseline survey also asked seven items regarding us of illegal drugs, six of which are included in the Drug Abuse Screening Tool (Skinner, 1982). An affirmative answer to any of these seven items indicates a drug problem.
Chapter 4
Family Options Study Interim Report pg. 58
for drug use problems and 18 percent for alcohol use problems within the past year).59 In another study of homeless families, Rog et al. report that 12 percent of adult respondents had used illicit drugs in the past year.60
Approximately 22 percent of adult respondents gave survey responses that indicate symptoms of post-traumatic stress disorder (PTSD), 22 percent reported symptoms of serious psychological distress, and 30 percent reported evidence of one or the other.61 Bassuk et al. report similar rates of current PTSD symptoms for both the homeless families (18 percent) and the housed welfare families (16 percent) in the Worcester study.62 The rates of PTSD and serious psychological distress for homeless families are substantially higher than national rates of PTSD (5.2 percent for women and 1.8 percent for men)63 and serious psychological distress (3.9 percent for women and 2.9 percent for men).64
The baseline survey asked families explicitly about factors that would affect their ability to find a place to live. Many reported that they either had a poor rental history (26 percent had been evicted) or that they had never been a leaseholder at all (35 percent).65 Some families (14 percent) reported that at least one adult in the family had been convicted of a felony for drugs or other offenses. In 11 percent of families, the adult respondent had a felony conviction.
4.3 Baseline equivalency testing
When random assignment is properly implemented, the families assigned to one intervention should not differ systematically from families assigned to other interventions in their background characteristics. In order to verify the integrity of the random assignment process, we conducted statistical tests on family background characteristics at random assignment for each pair of interventions to ensure that there were no systematic differences in family characteristics by intervention group.
59 Burt et al., 2001, Table 2.4, 24. 60 Debra Rog and John C. Buckner, 2007, 5-9. 61 About 14 percent of adult respondent have both PTSD symptoms and high psychological distress. 62 Bassuk et al., 1996, Table 4, 644. 63 The statistic for PTSD is the national 12-month prevalence rate as measured in the National Comorbidity
Survey–Replication (NCS-R), which was fielded in 2001–2002. The NCSR used a different instrument to measure PTSD than the Family Options Study. National Comorbidity Survey–Replication (NCS-R). (2005). http://www.hcp.med.harvard.edu/ncs/ftpdir/NCS-R_12-month_Prevalence_Estimates.pdf. Accessed July 16, 2012.
64 The statistic for national rate of serious psychological distress is from the 2011 National Health Interview Survey. This survey used the same measure of psychological distress as used in the Family Options Study. Centers for Disease Control and Prevention (2012), 2011 national health interview survey. http://www.cdc.gov/nchs/data/nhis/earlyrelease/earlyrelease201206_13.pdf. Accessed July 20, 2012.
65 These percentages are the percentages of respondents who reported that a past eviction or no rent history at all presented a “big” or “small” problem for them in finding a place to live. The survey items did not capture whether a respondent had a past eviction or had no rent history at all if the respondent did not think these were problems in finding a place to live. Therefore, these percentages are lower bounds on the proportions of the respondent sample who had a history of eviction and who had never been a leaseholder.
As discussed in Chapter 3, issues involving the availability of interventions and eligibility of families for interventions meant that many families in the study had a chance of being assigned to only three or two of the interventions rather than having a chance of assignment to any of the four interventions. These issues reduced the sample sizes that will be used in each pairwise impact comparison. A family will be included in a particular pairwise comparison if that family had a chance (i.e., a non-zero probability) of being assigned to each of the interventions in the pair and was actually assigned to one of the interventions in the pair. For instance, a family that had a chance of being assigned to any of the four interventions and was assigned to PBTH will be included in the pairwise comparisons of PBTH vs. UC, PBTH vs. SUB, and PBTH vs. CBRR. A family that had a chance of being assigned to SUB, CBRR, or UC and was assigned to SUB will be included in the pairwise comparisons of SUB vs. UC and SUB vs. CBRR. This family will not be included in the pairwise comparison of PBTH vs. SUB because it did not have a chance of being assigned to PBTH. Exhibit 4-8 shows the number of families that will be included in each pairwise impact comparison once restricted random assignment possibilities are reflected.
Exhibit 4-8: Sample sizes for six pairwise impact comparisons (number of families)
Pairwise impact comparison Sample size of
first intervention group Sample size of
second intervention group PBTH vs. UC 371 343 SUB vs. UC 604 548 CBRR vs. UC 578 580 PBTH vs. SUB 241 258 PBTH vs. CBRR 241 236 SUB vs. CBRR 439 387
Source: Random assignment records
Each pairwise baseline comparison examined the set of 15 characteristics listed in Exhibit 4-9. These characteristics were chosen because they are either major demographic characteristics or they are baseline measures in the study’s five outcome domains.66
66 The study’s five outcome domains are housing stability, self-sufficiency, adult well-being, child well-being, and family preservation.
Chapter 4
Family Options Study Interim Report pg. 60
Exhibit 4-9: Characteristics examined in baseline equivalency testing
Baseline characteristic at the time of random assignment
Age of household head
Gender
Marital status
Race/ethnicity
Educational attainment
Number of adults in family
Number of children in family
Worked for pay in last week
Previously convicted of a felony
Family annual income
Previously homeless (before current spell)
Previously lived in doubled-up housing
Number of barriers in finding housing67
Household head has a child under 18 livingelsewhere
Number of major life challenges faced68
Source: Family Options baseline survey
For each of these characteristics in each of the six comparisons, a statistical test was performed to determine if the two groups being compared differ on the characteristic. Then, for each of the six comparisons, we performed an omnibus statistical test of the null hypothesis that the two groups are the same on all 15 of the characteristics. This was done by estimating a regression model that predicts sample membership (e.g., PBTH vs. UC) using the 15 characteristics above as predictors. The F-test on the joint significance of all the regressors serves as our omnibus statistical test for differences between the two groups; rejection of the null means that the joint distributions of the 15 characteristics for the two groups differ in a manner that has no more than a 10 percent probability of occurring by chance.
67 Barriers to finding housing were reported by adult respondent as “big problems” in finding housing. The maximum number of barriers is 19. The 19 possible barriers are: not having enough income to pay rent, inability to pay a security deposit or first/last month’s rent, lack of transportation to look for housing, poor credit history, racial discrimination, not being currently employed, no rent history at all, recently moved to community and no local rent history, no reference from past landlords, a past eviction, problems with past landlords, past lease violations, having problems with police, having a criminal record or background, having a felony drug record, having three or more children in the household, having teenagers in the household, someone in the household under 21 years old, and someone in the household who has a disability.
68 The seven major life challenges measured are: psychological distress, PTSD, felony conviction, experience of domestic violence, childhood separation (foster care, group home, or institutionalization), self-reported medical condition, and substance abuse.
Chapter 4
Family Options Study Interim Report pg. 61
All of these test results are shown in Appendix D. In three of the six comparisons, we observed exactly one characteristic on which the two groups differed to a statistically significant degree (with alpha = 0.10), of the 15 tested. In the remaining three comparisons, none of the 15 characteristics differed to a statistically significant degree.
Exhibit 4-10: Equivalency comparisons
Pairwise impact comparison
Number of characteristics with significant differences
(out of 15; α = .10) Characteristic with
significant difference p-Value of
omnibus F-test
PBTH vs. UC 0 None 0.302 SUB vs. UC 1 Educational attainment 0.537 CBRR vs. UC 1 Educational attainment 0.045 PBTH vs. SUB 0 None 0.604 PBTH vs. CBRR 1 Age of household head 0.811 SUB vs. CBRR 0 None 0.818
Source: Family Options baseline survey
The most important statistical tests are the omnibus tests of all 15 characteristics at once. For five of the six pairwise comparisons, the differences between the joint distributions of these characteristics are far from being statistically significant. However, for the CBRR vs. UC comparison, the distributions differ significantly at the 5 percent level (p-value = 0.045). That is, the probability that differences as extreme as those observed would occur by chance is less than 5 percent. We interpret this result as indicating that we had an “unlucky” division of families into the CBRR and UC interventions for those families that could have been randomly assigned to either group. We note that, although the statistical test reveals an overall statistically significant difference, differences in means and percentage for the individual variables are not substantively large. Indeed, only one of the 15 characteristics (educational attainment) shows a statistically significant difference when the characteristics are considered separately. Based on this evidence, we conclude that random assignment was performed in a valid manner and can serve as a firm basis for the Family Options Study evaluation.
Chapter 5
Family Options Study Interim Report pg. 62
Chapter 5: Early information about intervention take-up This chapter describes what has been learned to date about families’ participation in the interventions to which the random assignment process assigned them, referred to as “take-up.” Technically, the random assignment process provides each study family with an offer of a particular type of housing assistance. Each intervention is voluntary, however, so there is no guarantee that a family will ultimately receive the housing assistance that it has been offered. As it is expected that only the receipt of housing assistance, rather than the offer by itself, will have an effect on families, the families’ take-up of the interventions, and our accounting for it, is crucial to the evaluation.69
It is important to examine the take-up of interventions: (1) to help interpret the impact results, and (2) to provide insight into how homeless service systems work. The research team will use the take-up information presented here, combined with other data sources described in the next section, to guide the impact analysis.70 We expect that the evaluation will produce stronger evidence about the impacts of an intervention when the percentage of families assigned to the intervention who actually receive it is high.
The information on take-up presented here may also provide a glimpse into how homeless services systems serve families. Choices made by families not to take up the interventions to which they have been assigned (i.e., the housing assistance they were offered) reflect the desirability of these interventions as seen by homeless families compared to other options available to them. Also, the study provides an “optimum” environment for families to be connected to housing assistance programs in the sense that referrals were only supposed to be made to a provider if a service slot was available; the family was likely eligible to be served by that provider; and the provider, by participating in the study and notifying researchers that the slot was open, was willing to take an eligible family from the study. Therefore, any difficulties that families had in navigating the system can be viewed as a lower bound on difficulties a family might have in navigating the system outside the context of the study.
5.1 Study data collection about intervention take-up
The study is collecting several types of information about take-up of the interventions to which families were assigned (and to which they were not assigned),71 including enrollment verification data, HUD administrative data, the tracking and follow-up surveys, and HMIS data. The information on take-up presented in this chapter draws upon the enrollment verification data only. In the future, more complete information about intervention take-up will be available.
69 The main set of impact results from the study will include all families in a pairwise comparison sample (shown in Exhibit 4-3) regardless of whether they have received housing assistance. Dropping families who have chosen not to receive their assigned intervention from the main analysis would introduce selection bias into the results.
70 A discussion of how take-up information will be used in the impact analysis can be found in Daniel Gubits et al. 2012, Chapter 3.
71 To detect instances when families “cross over” to interventions different from the one to which they were assigned, information will be collected about each family’s participation in any of the interventions.
Chapter 5
Family Options Study Interim Report pg. 63
To gather enrollment verification data, study team members made follow-up phone calls to service providers about every family assigned to one of the CBRR, SUB, or PBTH groups.72 These calls ascertain whether families contacted the provider to which they were referred; whether the family enrolled in the program was offered short-term rental assistance (CBRR) or was issued a voucher (SUB)73; whether families actually “moved in” (i.e., used the housing assistance); and various reasons why families did not move in. A small number of families who have not yet used the interventions to which they have been assigned may still do so. The study final report will draw upon survey and administrative data to report on final move-in rates.
Using housing assistance is a two-part process: first, the family must enroll in the program; 74 then the family must use the assistance or “move in.” Fall off in participation can occur at either stage. For PBTH, using the housing assistance meant moving into the transitional housing unit provided by the program and usually was synonymous with enrollment. For SUB and CBRR, using the housing assistance meant moving into the housing unit for which they would receive a subsidy, which usually was not synonymous with enrollment in the program. For the voucher form of SUB and for CBRR, the family must take further action to find the housing and move into it—commonly referred to as “leasing up.”
The main purpose of the enrollment verification data collection was to track which families ultimately used the housing assistance of the intervention to which they had been assigned. It was not intended to collect extensive information about families who did not end up using the assistance. A limitation of the verification data is that they do not always identify the point at which the family dropped out of the program—before or after enrollment—and, therefore, do not permit distinct counts of families who decided not to pursue their assigned assistance (“dropped out of program”) before enrolling vs. families who dropped out after contacting the program and enrolling. Instead, these two groups of families are combined into a single group that decided not to pursue assistance. Another limitation of the data is that explanations for why families chose not to take up an intervention were only collected for about 30 percent of the families who made this decision.
5.2 Take-up rates by intervention
Exhibit 5-1 shows the take-up rates according to the enrollment verification data as of September 1, 2012. The first row includes all families from the entire study, including those families assigned to UC. Families assigned to UC are considered to have received their assigned intervention by definition. As seen in the bottom three rows of the exhibit, the CBRR, PBTH, and SUB interventions have take-up rates considerably below 100 percent. Of these three, SUB has the highest take-up rate, at about 72 percent,
72 As of September 1, 2012, 93 percent of the families assigned to CBRR, PBTH, and SUB have had enrollment verification completed.
73 Thirty-four families were offered a public housing unit in Honolulu, and 15 families in Bridgeport, Connecticut, were offered a project-based assisted housing unit. All other families assigned to SUB were offered a voucher.
74 “Enrolling” signifies different events in the PBTH, SUB, and CBRR interventions. For PBTH, it means that the transitional housing provider has accepted the family into its program after a face-to-face meeting. For SUB, “enrolling in the program” means that a voucher has been issued to the family (or the family has been accepted into public housing in the case of one provider in Honolulu or project-based assisted housing in the case of Bridgeport). For CBRR, it means that the family has become an official client of the rapid re-housing program.
Chapter 5
Family Options Study Interim Report pg. 64
perhaps reflecting its desirability as a permanent subsidy that allowed a family to have its own place usually in a location of its own choice.
The take-up rate for the CBRR intervention, about 46 percent, is substantially less than that for the SUB intervention. Given that CBRR assistance is temporary while SUB assistance is permanent, we might hypothesize that SUB assistance is considerably more desirable than CBRR assistance from the families’ perspective. This is what was found through qualitative interviews of a sub-sample of 80 study families conducted by Abt Associates and analyzed by researchers at Vanderbilt University.75
PBTH’s take-up rate of 29 percent is considerably lower than both SUB and CBRR. The qualitative interviews show that the possibility of having one’s own place was an important consideration for families and it may explain at least some of the discrepancy in take-up rates between PBTH, on the one hand, and SUB and CBRR, on the other. Some families interviewed in the qualitative sub-study said that another important consideration for them was the location of housing relative to support networks, employment, transportation, and children’s schooling. SUB and CBRR assistance allow for some choice on the part of families as to where they will live, while families receiving PBTH assistance were locked in to the locations of the PBTH providers. Some families in the qualitative sample also mentioned that they decided not to accept PBTH services to which they were assigned because they viewed some of the neighborhoods where transitional housing units were located as undesirable.
Exhibit 5-1: Intervention take-up rates as of September 1, 2012
Sample Number of
families assigned
Number of families who have received assigned
intervention Take-up (move-in)
rate Full sample (CBRR, PBTH, SUB, and UC) 2,307 1,556a 67.4%a CBRR, PBTH, SUB combined 1,553 802 51.6% CBRR 578 263 45.5% PBTH 371 106 28.6% SUB 604 433 71.7%
Source: Enrollment verification data
a All families assigned to UC are considered to have received the UC intervention.
75 Mayberry, L. S. (2012), Family processes in the context of housing instability and intensive service use: Implications for parenting and caregiver well-being. PhD dissert. Vanderbilt University, 2012.
Chapter 5
Family Options Study Interim Report pg. 65
5.3 Take-up status of study families
Exhibits 5-2 through 5-4 provide additional detail about families’ statuses, as recorded in the random assignment records and the enrollment verification data. The random assignment records capture the interventions that were available at study enrollment and for which families appeared to be eligible in baseline eligibility screening. The enrollment verification data enables us to classify families as either “family enrolled in program and retained,” “family found ineligible,” or “family dropped out.” Families who dropped out either before or after enrolling in the program are included in the “family dropped out” box while, those who enrolled in the program and have not subsequently dropped out are included in the “family enrolled in program and retained” box. The families included in the “family found ineligible” box are families who did not enroll for reasons that were not in their control.76 As discussed in Chapter 3, the study only made a referral to a provider if a service slot was currently available with that provider and the family was likely eligible for service at that provider. An ideal referral procedure would have resulted in no families being found ineligible during the provider eligibility screening. Thus, the existence of the category “family found ineligible” is evidence that the study’s referral procedure did not always work as planned and sometimes that the program had eligibility criteria that it had not fully articulated to the researchers. The finding of program ineligibility after families were deemed eligible at random assignment must have occurred either because the study baseline eligibility screen did not include all applicable eligibility criteria for a provider77 or because families did not respond in a completely truthful manner to the baseline eligibility screen.
76 About 4 percent of families included in the “family is ineligible” box were not, in fact, ineligible, but rather the provider did not have the promised service slot available. This was the case for two families in PBTH, three families in SUB, and two families in CBRR. These families are included in the “family is ineligible” box because the unavailability, like ineligibility, was a reason for non-enrollment outside the control of the family.
77 Throughout the entire study enrollment period, questions were added to the screeners in many communities to include criteria that had that had not been specified initially but had resulted in program rejection of families the study thought should be eligible—for example, discrepancies between unit size and family size.
Chapter 5
Family Options Study Interim Report pg. 66
Exhibit 5-2: Status of families assigned to CBRR from enrollment verification data
Source: Enrollment verification phone calls made by study team members to intervention providers.
* Enrollment status is not verified as of September 1, 2012.
Chapter 5
Family Options Study Interim Report pg. 67
Exhibit 5-3: Status of families assigned to PBTH from enrollment verification data
Source: Enrollment verification phone calls made by study team members to intervention providers.
* Enrollment status is not verified as of September 1, 2012.
Chapter 5
Family Options Study Interim Report pg. 68
Exhibit 5-4: Status of families assigned to SUB from enrollment verification data
Source: Enrollment verification phone calls made by study team members to intervention providers.
* Enrollment status is not verified as of September 1, 2012.
Chapter 5
Family Options Study Interim Report pg. 69
The families included in the “family dropped out” box are those who made a decision not to pursue the housing assistance of the intervention to which they were assigned. We do not know the reasons why most of the “dropped out” families decided not to pursue their assigned intervention. For about 30 percent of the families who dropped out (of CBRR, PBTH, and SUB), however, providers relayed to us the reasons that families gave about why they decided not to pursue assistance.78 79 We list these reasons in the discussion below.
In some cases, the distinction between “family found ineligible” and “family dropped out” was blurred. For example, on learning that a provider with a sobriety requirement includes a drug test as part of the application process, the adult respondent might break off contact (e.g., she knew she would not pass), resulting in a “family dropped out” classification. However, the adult respondent could alternatively choose to take the test, and on the expected failure would then be counted as “family found ineligible.” Thus, the limited nature of the information collected in the enrollment verification process creates some difficulty in fully understanding participant take-up, particularly for families who did not take up the intervention. The follow-up tracking interviews should allow for a more in-depth exploration of participant take-up. Despite this ambiguity, the additional detail provided by the verification is informative.
The families who are included in the “family enrolled in program” box are further categorized as either “family moved into housing” or “enrolled, but not yet moved in.” Those families in the “enrolled, but not yet moved in” category will either eventually be included in the “family moved into housing” box (if they move into program-assisted housing) or be included in the “family dropped out” box (if they decide not to move into program-assisted housing).
Once a family is enrolled into a program, the family can complete the take-up process by moving into housing, but a small percentage of families do not do so. For CBRR and SUB programs, participants must find housing within a specified period of time once they have been accepted into a rapid re-housing program or the public housing agency has issued them a voucher, and some participants do not succeed in doing so. For CBRR, a few participants were initially accepted into programs but violated program requirements—for example, requirements related to seeking employment—and left the program before moving into housing.
78 The 30 percent of “dropped out” families for whom we have a reason for not pursuing their assigned intervention likely systematically differ from the 70 percent of “dropped out” families for whom we have no reason. This is because, generally, those families for whom we have a reason had some contact with the provider (and thus we were able to collect a reason), while those families for whom we have no reason had no contact with the provider at all.
79 Among the specific reasons collected in the enrollment verification data is anecdotal evidence of a small amount of “cross over,” meaning a family was assigned to one intervention but actually enrolled in another—for instance by being assigned to PBTH but being high up on the voucher waiting list and receiving a voucher before PBTH enrollment. The amount of cross over suggested in the data is on the order of about 2 percent of the families assigned to PBTH, SUB, and CBRR.
Chapter 5
Family Options Study Interim Report pg. 70
The top levels of Exhibits 5-2 through 5-4 show how intervention availability and baseline eligibility affected how many families had the opportunity to be randomly assigned to CBRR, PBTH, and SUB. As discussed in Chapter 3, the availability of program slots was an issue for all three non-UC interventions and was most limiting for the PBTH intervention. The pre-random assignment eligibility screening was also most limiting for the PBTH intervention, screening out four times as many families from PBTH as from CBRR, and 12 times as many families as from SUB.
The lower levels of Exhibits 5-2 through 5-4 show the statuses of families assigned to CBRR, PBTH, and SUB. In addition to the differences in the proportions of families that moved into housing noted in Section 5.2, differences in the proportions that enrolled in programs are apparent. SUB has the highest enrollment percentage at 76 percent, followed by CBRR at 52 percent and PBTH at 30 percent. As seen in Exhibit 5-3, enrollment and move-in are almost synonymous for PBTH, in contrast with SUB and CBRR where families need to locate appropriate rental housing before they can move in.
Chapter 3 discusses the pre-random assignment eligibility screening conducted by the study to maximize the likelihood that families assigned to an intervention would be accepted by the intervention provider. It also lists the most common reasons why some families were found ineligible in this screening conducted by the study. This chapter discusses the later eligibility screening conducted by providers themselves. The enrollment verification calls collected data on the reasons why most ineligible families were deemed ineligible by providers.80 These data suggest that the most common reasons why some families were found ineligible in provider screening (listed below) are consistent with the most common reasons found in the pre-random assignment eligibility screening.
The PBTH intervention has both the highest proportion of families found ineligible (16 percent) and the highest proportion of families who drop out (43 percent). Some of the reasons that families were found ineligible for PBTH include a mismatch between unit size and family size and failure to meet minimum income or employment requirements. We collected explanations for non-participation for 60 of the 161 “dropped out” families in PBTH. Some of the reasons for not pursuing PBTH as stated by these families (and relayed by providers) include enrollment in another program, finding their own housing, and moving out of town.
The SUB and CBRR interventions have almost equal proportions of families who were not enrolled in programs because of ineligibility, 11 percent and 9 percent. The most common reason that providers found families ineligible for SUB was having a criminal record. The most common reason that CBRR providers found families ineligible was that families failed to meet minimum income or employment requirements and so were deemed to have insufficient income for self-sufficiency to be a realistic option at the end of the temporary subsidy.81
80 The study collected explanations from providers for 78 percent of the CBRR, PBTH, and SUB families found ineligible by providers. In CBRR, we collected reasons for 85 percent of these families. The corresponding figures for PBTH and SUB are 79 percent and 70 percent.
81 This reason was especially prevalent in the Connecticut and Phoenix sites, where 30 of the 52 families found ineligible lived.
Chapter 5
Family Options Study Interim Report pg. 71
The proportion of families who dropped out of SUB (10 percent) was substantially lower than for CBRR (28 percent). This suggests that on average families viewed SUB as more desirable assistance than CBRR. The most common reason (from the 45 out of 163 “dropped out” families for whom a reason was collected) that families gave for not pursuing the CBRR intervention was enrollment in another program.
Voucher take-up and lease-up success rates
It is possible to compare the take-up rate for the SUB intervention with the take-up rate in other studies of housing vouchers. We might hypothesize that the take-up rate would be higher in this study because homeless families are in more desperate circumstances on average than the families in other studies and because homeless families do not have the option of staying where they currently are. On the other hand, we might hypothesize that the take-up rate would be lower in this study because homeless families on average may have more difficulty navigating the private rental market given the instability of their current situations than do families in other studies. Also, as pointed out in Chapter 4, more than one-third of the families in this study had never before been leaseholders.
The take-up rate for vouchers of 71 percent appears higher than in other experimental studies.82 For example, the study of the Effects of Housing Vouchers on Welfare Families found a 62 percent take-up rate after 15 months among families randomly assigned to receive a voucher83; and the group assigned a voucher without geographic restrictions (the “Section 8” group) in the Moving to Opportunity Demonstration had a 60 percent take-up rate.84 Jacob and Ludwig found a 50 percent take-up rate for families in the voucher treatment group in a study of the Chicago voucher lottery.85
82 We calculate the take-up rate for vouchers only (rather than for all of SUB) by excluding families assigned to the Bridgeport Housing Authority, which offered project-based Section 8 vouchers, and the Hawaii Public Housing Authority in Honolulu, which offered public housing units. The enrollment verification shows that out of 555 families offered vouchers in the study, 396 have leased-up.
83 Mill, G., et al. (2006). Effects of housing vouchers on welfare families: Final report. Prepared for the U.S. Department of Housing and Urban Development, Office of Policy Development and Research. Cambridge, MA: Abt Associates Inc. Exhibit 2.5, p. 44.
84 Orr, L., et al. (2003). Moving to opportunity interim impacts evaluation: Final report. Cambridge, MA: Abt Associates Inc. and National Bureau of Economic Research, p. 25.
85 Jacob, B. A., & Ludwig, J. (2002). The effects of housing assistance on labor supply: Evidence from a voucher lottery, American Economic Review, 102(1). 272–304, Table 2, p. 288. The somewhat lower take-up rate in this study may be partially explained by the fact that vouchers were issued to families over a six-year period.
Chapter 5
Family Options Study Interim Report pg. 72
Upon close inspection, the lease-up “success rate” for housing vouchers appears higher than in other studies of vouchers. As defined in Finkel and Buron (2001), the lease-up success rate is the “percentage of families who are provided vouchers and lease a housing unit that meets all program requirements within the time the PHA provides for search.”86 This rate differs from the take-up rate presented in Exhibits 5-1 and 5-4 for SUB in that the take-up rate includes all families assigned to the SUB intervention in its denominator, rather than restricting the denominator to only those families who have been issued a voucher. When the lease-up success rate is calculated for those families in this study who were issued vouchers,87 we find that the rate is about 94 percent. This is higher than both the 69 percent success rate found by Finkel and Buron for all households across the 48 sites in a study that focused explicitly on voucher success or lease-up rates. It also is higher than the 60 percent success rate for households in the Finkel and Buron study who received a voucher under a housing authority preference for serving homeless households.88 The take-up rates in the Effects of Housing Vouchers on Welfare Families and Moving to Opportunity studies mentioned above may also be considered lease-up success rates as essentially all families in the treatment groups were issued vouchers. The 94 percent success rate in this study is substantially higher than both the 62 percent rate at 15 months in the Effects of Housing Vouchers on Welfare Families study and the 60 percent rate for the “Section 8” group in the Moving to Opportunity Study.
Given the high lease-up success rate in this study, it is quite plausible that families were highly motivated to use the vouchers because of the difficult situations they were in at baseline and because of the temporary nature of emergency shelter housing. Anecdotal evidence suggests that another factor contributing to the high lease-up success rate may have been assistance and encouragement from emergency shelter caseworkers for families to pursue and utilize the housing vouchers.
5.4 Take-up over time
Exhibit 5-5 shows the percentage of families who have taken up housing assistance by weeks since random assignment for the SUB, CBRR, and PBTH interventions. Families assigned to CBRR and PBTH receive housing assistance somewhat faster than those assigned to SUB, and almost all assigned to CBRR and PBTH have moved in by 20 weeks after random assignment. In contrast, some families assigned to
86 Finkel, M., and Buron, L. (2001), Study on Section 8 voucher success rates: Vol. 1—Quantitative study of success rates in metropolitan areas. Washington, DC: Report prepared by Abt Associates, Inc. for the U.S. Department of Housing and Urban Development, p. 2-1.
87 We calculate this lease-up success rate by first excluding families assigned to the Bridgeport Housing Authority, which offered project-based Section 8 vouchers, and the Hawaii Public Housing Authority in Honolulu, which offered public housing units. We also exclude 36 of the 57 families who have dropped out of the interventions because it is clear from enrollment verification notes that these families were never issued a voucher. The other 21 families who have dropped out of the intervention may have been issued a voucher so they remain in the denominator along with the families in the “enrolled in program” box. The families in the “found ineligible or unit is not available” box are not included in the denominator of the lease-up success rate, as these families were never issued a voucher.
88 Some housing authorities gave priority to families who were homeless, resulting in shorter wait times for a voucher for these families. Administrative records identified the families who were issued a voucher under these preferences for homeless families.
Chapter 5
Family Options Study Interim Report pg. 73
SUB may take more than six months after random assignment to move into a rental unit. The final time-paths may change slightly from those presented here.
Exhibit 5-5: Percentage of families moved in, by weeks, since random assignment, by assignment group
Source: Enrollment verification phone calls made by study team members to intervention providers
0%
10%
20%
30%
40%
50%
60%
70%
80%
0 10 20 30 40 50 60 70
Perc
ent o
f fam
ilies
mov
ed-in
Weeks since random assignment
SUB
CBRR
PBTH
Chapter 6
Family Options Study Interim Report pg. 74
Chapter 6: Summary and next steps
The Family Options Study provides an unprecedented opportunity for HUD to understand the relative effects of four different interventions designed to help families experiencing homelessness.
From September 2010 through January 2012, 2,307 families were enrolled in the Family Options Study in 12 communities across the country. These families entered the study after spending at least seven days in emergency shelter. After providing informed consent and completing a baseline survey, the families were randomly assigned to one of four different housing and services interventions—distinguished by the duration of housing assistance and the type and intensity of social services offered in conjunction with housing assistance.
6.1 Summary
The platform in place for this study provides a strong basis for further research on homelessness and about highly vulnerable families, a population that has not been studied to this extent previously and is not readily found in other studies of low-income families. The participant baseline, tracking, and follow-up surveys will provide rich longitudinal data about a wide range of characteristics for families who enrolled in the study, including the children present and those not accompanying their parents at the time of enrollment. Supplemental funding from NICHD promises to yield important information about children’s outcomes that is unavailable from other sources.
We acknowledge that we will face challenges for the impact analysis—sample size and early indications of take-up rates—which may affect our ability to detect impacts for some of the pairwise comparisons, (especially those involving PBTH). At the same time, the random assignment design was implemented successfully, yielding well balanced groups for estimation of impacts, and presents the best opportunity to date to understand the effects of the interventions being studied.
These implementation challenges also point to early insights about how homeless assistance is currently delivered, relative to the needs of those who seek assistance.
1. Homeless system resources are highly constrained and are frequently unavailable to meet thedemand from the families in shelter. There are occasions when the system has excess capacity,yet systems do not have a ready way to conserve those resources for a time when there are surgesin demand. Project-based program models exacerbate these issues. They have fixed costs evenwhen vacant and fixed capacity that requires turnover to accommodate additional placement.
2. Homeless programs have imposed eligibility criteria that hamper their ability to serve the veryfamilies in shelter who need the assistance. Even when homeless programs have space available,the programs often screen out the families in shelter due to eligibility criteria such as insufficientincome, substance use, criminal histories, and other factors that presumably contributed to thefamilies’ homelessness. Project-based program models add another layer of screening related tothe constraints of unit size, as they are only able to house families whose size is compatible withthe number of rooms in the available units.
3. Families who are homeless do not always pursue the programs that are offered to them, whichsuggests that programs do not always deliver assistance that families perceive as more valuablethan other options available to them.
Chapter 6
Family Options Study Interim Report pg. 75
4. Families who are homeless are very interested in pursuing opportunities for permanent housingsubsidies and are successful in navigating the application processes and rules associated withthem.
The more limited opportunities to learn about the effects of project-based transitional housing reflect the fact that PBTH enrollment was constrained due to availability, eligibility, and family choice. Thus, while project-based transitional housing is a model commonly employed across the country, it does not seem to be accessible or attractive to families residing in shelter for more than seven days, who presumably are among those who need assistance the most. PBTH appears likely to screen out those families who have the highest needs and the greatest barriers to housing stability. Furthermore, families who are not screened out often do not appear willing to enroll in transitional housing, perhaps reflecting concerns about the location of the units, disinterest in the rules associated with PBTH, uncertainty about the PBTH model, or availability of other opportunities.
In contrast, permanent housing subsidy programs, usually a housing choice voucher, was the most accessible model. While the availability of the SUB intervention was an artifact of the study (the study negotiated access to SUB resources that homeless families would not ordinarily have access to), when SUB was presented as an option, a high percentage of families enrolled in the program and were able to use it.
6.2 Next steps
The study will continue to track the participating families within each of the interventions, and an 18-month follow-up survey will collect data on outcomes on participating families. The research team will use the data on family outcomes to estimate the impacts of the four interventions on five types of family outcomes:
Housing stability
Self-sufficiency
Family preservation
Adult well-being
Child well-being
When comparing effects of two interventions, only families considered for both interventions at the time of random assignment will be included in the pair-wise comparison. The impact analysis will rely on four types of data:
Surveys of participating families at several points
Random assignment records established at enrollment
Information about the intervention programs (structure, rules, characteristics of the housing andservices interventions provided to families, and program costs)
Administrative records from homeless assistance providers and HUD
As described in Chapter 1, this report is based on data from the survey of families conducted at baseline prior to random assignment, which documented family composition and characteristics, as well as information collected to support the process of implementing random assignment, such as data on
Chapter 6
Family Options Study Interim Report pg. 76
program availability, program eligibility criteria, and family eligibility for programs available at the time of random assignment. The report also presents data collected by the study team through on-site interviews with program staff to collect information about program structures and rules and on the characteristics of the housing assistance and services provided to participating families.
The impact analysis will rely on these sources as well as other survey and administrative data about families and program cost information. Surveys of participating families are being conducted at 6, 12, and 18 months after random assignment. The interviews conducted 6 and 12 months after random assignment are brief tracking interviews that collect updated contact information and information about family composition and housing situation; the survey conducted 18 months after random assignment is a much more comprehensive survey of families. In the 18-month survey, adult respondents provide information about the family as a whole and details for up to two focal children, including children who do not reside with the family. As part of the 18-month survey, the research team is also conducting assessments of children aged 3 to 8 and interviews with children between 8 and 17 years of age.89 The 18-month follow-up survey began in July 2012 and will continue through September 2013.
The two primary sources of administrative data that will support the impact analysis are (1) Homeless Management Information System (HMIS) records maintained by homeless assistance service providers will be used to measure housing stability and return to shelter, and (2) HUD records from the Public Housing Information Center (PIC) system and the Tenant Rental Certification System (TRACS) will measure receipt of housing assistance.90 HMIS and HUD data will be collected in 2012 and 2013. The site team will also interview program staff and review program records to collect program cost data in late 2012 and early 2013.
The research team will conduct the 18-month impact analysis in 2014 and will report on impacts and program costs in late 2014. The Revised Data Collection and Analysis Plan91 provides details about the impact analysis planned and how each data source will be employed. In addition to the 18-month impact report in late 2014, the team will also work closely with HUD to develop separate policy briefs on special topics. Since the research platform in place for the study provides a strong basis for continued study, the research team is also exploring options for continued data collection after the 18-month follow-up period. The primary options under consideration are a longer-term follow-up survey 36 months after random assignment and collection of additional sources of administrative data. This would allow for analysis of outcomes over a longer period of time.
89 The child data collection activities are supported with funding from NICHD. 90 HMIS data will supplement the participant surveys to measure returns to shelter. HUD administrative data will
measure receipt of housing assistance to indicate take up of assigned intervention for those assigned to SUB and the extent to which families assigned to other interventions end up receiving HUD assistance.
91 Gubits et al. (2012), Family options study: Revised data collection and analysis plan.
Appendix A
Family Options Study Interim Report pg. 77
Appendix A: Programs operating in study sites
Exhibit A: Programs operating in study sites
Community-based Rapid Re-housing (CBRR)
Project-based Transitional housing (PBTH) Subsidy (SUB) Usual Care (UC)
Alameda County Abode Services Rapid Re-housing
Anka Behavioral Health, Inc., Henry Robinson Multiservice
Housing Authority of Alameda County
Building Futures with Women & Children, Midway
Alameda Point Collaborative Berkley Housing Authority Building Futures with Women & Children, Sister Me
East Oakland Transitional Housing, Matilda Cleveland
Oakland Housing Authority Building Futures with Women & Children, San Leandro
Berkley Food & Housing, Independence House
East Oakland Community Project, Crossroads Emergency Shelter
Building Futures with Women and Children, Bessie Coleman
Emergency Shelter Program
Building Opportunities for Self- Sufficiency (BOSS), McKinley House and Sankofa House
Adobe Services, Sunrise Village
FESCO, Third Street Transitional Apartments and Banyon House Street
FESCO Emergency Shelter
Adobe Services Transitional Housing
Building Opportunities for Self Sufficiency, Harrison House
Berkley Food and Housing Shelter for Women and Children
Atlanta Salvation Army, Rapid Re-Housing
City of Refuge, Eden Village Gateway Homeless Services Center, Women and Children’s Assessment Center
Project Community Connections, Inc., Rapid Re-housing Program
Decatur Cooperative Ministry, Family Transitional Housing
Salvation Army Red Shield Lodge
Appendix A
Family Options Study Interim Report pg. 78
Community-based Rapid Re-housing (CBRR)
Project-based Transitional housing (PBTH) Subsidy (SUB) Usual Care (UC)
Rockdale–State of Georgia, HPRP
Nicholas House Decatur Cooperative Ministry, Hagar’s House
Gateway Homeless Services Center, Rapid Re-housing
SHARE House Transitional Housing
Share House Emergency Shelter
Sound Landing Transitional Housing Salvation Army Transitional Housing HOPE Atlanta
Odyssey III
Baltimore
St. Vincent’s de Paul, Front Door Rapid Re-housing
Volunteers of America, Pratt House
Baltimore Outreach Services, Christ Lutheran Place
Catholic Charities of Baltimore, My Sister's Place Rapid Re-housing
YWCA, Druid Heights Transitional Housing
Salvation Army, Booth House Emergency Shelter
Salvation Army, Booth House Transitional Housing
St. Vincent de Paul, Sarah’s Hope
Supportive Housing Group, Lanvale Institute
Dayspring Programs, Inc., Dayspring Village
Marian House
St. Vincent de Paul, Cottage Avenue
Boston
Homebase Boston Housing Authority Crossroads Family Shelter
Flex Funds Little Sisters of the Assumption, Project Hope
St. Mary’s Emergency Shelter
Appendix A
Family Options Study Interim Report pg. 79
Community-based Rapid Re-housing (CBRR)
Project-based Transitional housing (PBTH) Subsidy (SUB) Usual Care (UC)
Action for Boston Community Development (ABCD)
Children’s Service of Roxbury
Crittendon Women's Union
Heading Home
YMCA of Greater Boston
Connecticut
State of Connecticut Department of Social Services Rapid Re-housing
St. Luke’s Lifeworks, New Beginnings Transitional Housing
Housing Authority of the City of Bridgeport
St. Luke’s Lifeworks – New Beginnings Emergency Shelter
New Haven Home Recovery HPRP
Central Connecticut Coast YMCA, Alpha Community Services, Jean Wallace Program
State of Connecticut Department of Social Services
Central Connecticut Coast YMCA, Alpha Community Services (Brooks Street and Clinton Avenue)
Christian Community Action, Stepping Stone Transitional Housing Program
New Haven Housing Authority Domestic Violence Crisis Center, Norwalk and Stamford Safe Houses
Homes with Hope/Interfaith Housing Association, Bacharach Community
Operation Hope, Family Shelter Readiness Program
Open Door Shelter
Life Haven, Inc.
New Haven Home Recovery, Martha’s Place and CareWays Shelter
Christian Community Action, Hillside Family Shelter
Denver
The Family Tree Rapid Re-housing–HPRP
Colorado Coalition, Transitional Housing
Denver Housing Authority Samaritan House
Appendix A
Family Options Study Interim Report pg. 80
Community-based Rapid Re-housing (CBRR)
Project-based Transitional housing (PBTH) Subsidy (SUB) Usual Care (UC)
Colorado Coalition, Rapid Re-housing
The Family Tree, Brookview House
Lakewood Housing Authority Family Tree, House of Hope
Warren Village Colorado Coalition Family Support Services
Access Housing
Interfaith Hospitality Network of Greater Denver, Emergency Shelter
Honolulu
Catholic Charities of Hawaii, Rapid Re-housing
HSI, Loliana City and County of Honolulu, Department of Community and Social Services
Family Promise of Hawaii, Windward
Institute for Human Services, Rapid Re-housing
HSI, Vancouver House Hawaii Public Housing Authority
Family Promise of Hawaii, Honolulu
Helping Hands of Hawaii, Rapid Re-housing
KOHOW Transitional Shelter H-5 Hawaii, Next Step Shelter
Kalihi-Palama Health Center, Rapid Re-housing
Onemalu Transitional Housing (Holomua Nā ‘Ohana)
IHS – Ka’ahi Women and Families Shelter
Waikki Health Center, Care a Van Program Rapid Re-housing
Weinberg Village Waimanalo (Holomua Nā ‘Ohana)
Waianae Civic Center
Wainae Coast Comprehensive Health Center, Rapid Re-housing
ASI, Village of Ma'ili Waianae Community Outreach
Catholic Charities of Hawaii, Ma'ili Land
Kansas City
Don Bosco Rapid Re-housing Community LINC Housing Authority of Kansas City
Salvation Army, Crossroads Emergency Shelter
Community LINC Sheffield Place reStart, Inc. Emergency Shelter
Salvation Army, Northland, Rapid Re-housing
reStart, Inc., Transitional Living City Union Mission, Family Shelter
NCSD Rapid Re-housing
reStart, Inc. Rapid Re-housing
Appendix A
Family Options Study Interim Report pg. 81
Community-based Rapid Re-housing (CBRR)
Project-based Transitional housing (PBTH) Subsidy (SUB) Usual Care (UC)
Louisville
Louisville HPRP Salvation Army Transitional Housing
Louisville Metro Housing Authority
Salvation Army Emergency Shelter
Volunteers of America, Transitional Housing Program
Volunteers of America Emergency Shelter
Wayside Christian Mission Transitional Housing
Wayside Christian Mission Emergency Shelter
New Directions Transitional Housing
Minneapolis
Hennepin County Rapid Exit Simpson Housing Services, Passage Community
Minneapolis Public Housing Authority
People Serving People Emergency Shelter
Perspectives, Inc.
Elim Transitional Housing, Inc.
Phoenix
City of Phoenix, HPRP Homeward Bound Transitional Housing
City of Phoenix Housing Authority
UMOM
Labor’s Community Service Agency, Transitional Housing
Maricopa County Housing Authority
Central Arizona Shelter Services, Vista Colina
UMOM Transitional Housing New Leaf, La Mesita Emergency Shelter
Save the Family Salvation Army, Kaiser Family Center
Watkins
Salt Lake City
The Road Home Rapid Re-housing
The Road Home Transitional Shelter
Salt Lake City Housing Authority
The Road Home Emergency Shelter
Housing Authority of Salt Lake County
Appendix B
Family Options Study Interim Report pg. 82
Appendix B: Participating program characteristics
This appendix provides information about the programs that operated the interventions in the study sites and that provided program to the research team during site visits to each participating community.
Exhibit B-1: Permanent housing subsidy (SUB) intervention: Subsidy type provided, by site
Site name Provider(s) of subsidy Number of families referred to program Type of subsidy
Alameda County
Housing Authority of Alameda County 12 Tenant-based voucher
Berkley Housing Authority 16 Tenant-based voucher
Oakland Housing Authority 49 Tenant-based voucher
Atlanta
Baltimore
Boston Boston Housing Authority 64 Tenant-based voucher
Connecticut
Housing Authority of the City of Bridgeport 15 Project-based voucher
New Haven Housing Authority 17 Tenant-based voucher
State of Connecticut Department of Social Services 15 Tenant-based voucher
State of Connecticut Department of Social Services Rapid Re-housing
32 4–6 months (security deposit)
Fixed monthly subsidy (not formula)
Appendix B
Family Options Study Interim Report pg. 84
CBRR program name Number of families
referred to the program
Type of assistance
Subsidy calculation Rental
assistance Payment of
arrears Start-up costs
New Haven Home Recovery HPRP
41 6–12 months Combination: For some families assistance is calculated by formula based on tenant contribution of 30% of income. But in some cases subsidy is adjusted if income is very low or utilities are high.
Denver
The Family Tree Rapid Re-housing–HPRP
8 6–18 months Combination: For some families assistance is calculated by formula based on tenant contribution of 30% of income. But in some cases subsidy is adjusted if income is very low or utilities are high.
Honolulu
Catholic Charities of Hawaii, Rapid Re-housing
16 4–6 months Fixed monthly subsidy (not formula)
Kansas City
Community LINC 12 Up to 12 months
(rent only)
(security deposit only)
Fixed monthly subsidy (not formula)
Don Bosco Rapid Re-housing 12 6–12 months (rent only)
(security deposit only)
Fixed monthly subsidy (not formula)
Louisville
Louisville HPRP 19 6 months (utilities only)
Fixed subsidy (lump sum payment based on household size)
Salt Lake Cityc 9/30/2010 6/18/2011 0.300 0.150 0.300 0.250
Salt Lake Cityc 6/22/2011 10/25/2011 0.250 0.250 0.250 0.250 Source: Random assignment records
a Random assignment probabilities are the probabilities that applied to a family if all of the interventions offered by the site were available at the time the family was randomly assigned and if the family passed the baseline eligibility screen for at least one provider in each available intervention. When interventions were taken out of consideration for random assignment due to unavailability of slots or baseline ineligibility, probabilities were rescaled to omit the interventions taken out of consideration. For instance, if a site had equal probabilities of 0.250 to each of the four interventions, then when one intervention was removed from consideration because of unavailability or ineligibility, the probabilities of the remaining three interventions would be 0.333 each.
b The random assignment probabilities were altered for Louisville on July 22, 2011. There were 37 families assigned under the first set of probabilities and 73 families assigned under the second set of probabilities.
c The random assignment probabilities were altered for Salt Lake City on June 21, 2011. There were 213 families assigned under the first set of probabilities and 43 families assigned under the second set of probabilities.
Appendix D
Family Options Study Interim Report pg. 107
Appendix D: Equivalency of baseline characteristics
Exhibit D-1: Family Options Study—baseline equivalency check, PBTH vs. UC
Characteristic PBTH UC Difference Significance
level Stars Number of families 371 343 Age of household head at RA (percent)
Less than 21 years old 0.09 0.06 0.03 0.388 21–24 years 0.15 0.17 -0.02 25–29 years 0.25 0.22 0.03 30–34 years 0.21 0.19 0.02 35–44 years 0.21 0.25 -0.04 45 years and older 0.09 0.10 -0.01 Mean age (years) 31.05 32.25 -1.19 0.631
Marital status (percent) Single (never married/wid./sep./div.) 0.67 0.67 0.01 0.780 Married or marriage-like situation 0.33 0.33 -0.006
Race/ethnicity (percent) Black/African American, not Hispanic 0.40 0.40 0.00 0.996 White, not Hispanic 0.20 0.20 0.01 Hispanic 0.15 0.16 0.00 Other 0.25 0.25 0.00
Educational attainment (percent) Less than high school diploma 0.36 0.43 -0.07 0.173 High school diploma/GED 0.36 0.31 0.05 More than high school diploma 0.27 0.25 0.02
Appendix D
Family Options Study Interim Report pg. 108
Characteristic PBTH UC Difference Significance
level Stars Number of adults in family (percent)
1 adult 0.63 0.62 0.02 0.505 2 adult 0.28 0.27 0.02 3 or more adults 0.08 0.11 -0.02
Number of children in family (percent)
1 child 0.40 0.42 -0.01 0.968 2 children 0.29 0.28 0.00 3 children 0.19 0.18 0.01 4 children or more 0.12 0.11 0.01
Worked for pay last week (percent) 0.19 0.21 -0.02 0.536 Ever convicted of a felony (percent) 0.12 0.14 -0.02 0.323 Family annual income (percent)
Less than $5,000 0.29 0.31 -0.02 0.622 $5,000–9,999 0.26 0.24 0.01 $10,000–14,999 0.18 0.16 0.02 $15,000–19,999 0.12 0.10 0.02 $20,000–24,999 0.06 0.07 -0.02 $25,000 or more 0.05 0.07 -0.02
Ever been homeless before (percent) 0.60 0.62 -0.02 0.664 Ever been doubled up before (percent) 0.82 0.84 -0.01 0.598 Number of barriers to finding housing1 4.22 4.27 -0.06 0.97 Child under 18 living elsewhere (percent) 0.24 0.24 0.01 0.84 Number of major life challenges2 2.07 2.08 -0.01 0.77 F-test on all characteristics except site F value = 1.112 F-test p-value = 0.302
Note: Chi-square tests used to test the difference between groups for all characteristics except mean age. t-test used for mean age.
* =0.10 level, **=0.05 level, ***=0.01 level 1 Barriers to finding housing were reported by adult respondents as “big problems” in finding housing. The maximum number of barriers is 19. 2 The seven major life challenges measured are: psychological distress, PTSD, felony conviction, experience of domestic violence, childhood separation (foster care, group home,
or institutionalization), medical condition, and substance abuse.
Appendix D
Family Options Study Interim Report pg. 109
Exhibit D-2: Family Options Study—baseline equivalency check, SUB vs. UC
Characteristic SUB UC Difference Significance level Stars Number of families 604 548 Age of household head at RA (percent)
Less than 21 years old 0.08 0.08 0.00 0.781 21–24 years 0.21 0.21 0.00 25–29 years 0.23 0.25 -0.02 30–34 years 0.19 0.16 0.03 35–44 years 0.20 0.22 -0.01 45 years and older 0.08 0.09 0.00 Mean age (years) 30.57 30.97 -0.40 0.574
Gender (percent)
Female 0.93 0.92 0.00 0.801 Male 0.07 0.08 -0.004
Marital status (percent)
Single (never married/wid./sep./div.) 0.74 0.70 0.04 0.154 Married or marriage-like situation 0.26 0.30 -0.038
Race/ethnicity (percent)
Black/African American, not Hispanic 0.35 0.37 -0.02 0.530 White, not Hispanic 0.22 0.23 -0.01 Hispanic 0.24 0.23 0.00 Other 0.19 0.16 0.03
Educational attainment (percent)
Less than high school diploma 0.35 0.42 -0.06 0.084 * High school diploma/GED 0.39 0.34 0.05 More than high school diploma 0.26 0.24 0.01
Number of adults in family (percent)
1 adult 0.71 0.67 0.04 0.343 2 adult 0.26 0.29 -0.03 3 or more adults 0.03 0.04 -0.01
Number of children in family (percent)
Appendix D
Family Options Study Interim Report pg. 110
Characteristic SUB UC Difference Significance level Stars 1 child 0.45 0.43 0.02 0.847 2 children 0.30 0.32 -0.01
3 children 0.15 0.15 0.00 4 children or more 0.09 0.10 -0.01
Worked for pay last week (percent) 0.13 0.16 -0.02 0.312 Ever convicted of a felony (percent) 0.11 0.11 0.01 0.645 Family annual income (percent)
Ever been homeless before (percent) 0.61 0.63 -0.02 0.737
Ever been doubled up before (percent) 0.84 0.86 -0.02 0.364 Number of barriers to finding housing1 4.41 4.26 0.15 0.496 Child under 18 living elsewhere (percent) 0.25 0.23 0.02 0.432 Number of major life challenges2 2.13 2.12 0.02 0.818 F-test on all characteristics except site F value = 0.958 F-test p-value = 0.541
Note: Chi-square tests used to test the difference between groups for all characteristics except mean age. t-test used for mean age.
* =0.10 level, **=0.05 level, ***=0.01 level1 Barriers to finding housing were reported by adult respondents as “big problems” in finding housing. The maximum number of barriers is 19.2 The seven major life challenges measured are: psychological distress, PTSD, felony conviction, experience of domestic violence, childhood separation (foster care, group home,
or institutionalization), medical condition, and substance abuse.
Appendix D
Family Options Study Interim Report pg. 111
Exhibit D-3: Family Options Study—baseline equivalency check, CBRR vs. UC
Characteristic CBRR UC Difference Significance level Stars Number of families 578 580 Age of household head at RA (percent)
Less than 21 years old 0.09 0.08 0.01 0.103
21–24 years 0.19 0.20 -0.02 25–29 years 0.23 0.23 -0.01 30–34 years 0.19 0.15 0.04 35–44 years 0.25 0.23 0.01 45 years and older 0.06 0.10 -0.04 Mean age (years) 30.79 31.34 -0.54 0.414
Marital Status (percent) Single (never married/wid./sep./div.) 0.74 0.73 0.00 0.830 Married or marriage-like situation 0.26 0.27 -0.004
Race/ethnicity (percent) Black/African American, not Hispanic 0.46 0.43 0.03 0.486 White, not Hispanic 0.19 0.21 -0.01 Hispanic 0.18 0.21 -0.03 Other 0.16 0.15 0.01
Educational attainment (percent) Less than high school diploma 0.33 0.39 -0.06 0.063 * High school diploma/GED 0.39 0.33 0.06 More than high school diploma 0.28 0.28 0.00
Number of adults in family (percent) 1 adult 0.69 0.70 -0.01 0.802 2 adult 0.25 0.24 0.01
3 or more adults 0.06 0.05 0.01
Appendix D
Family Options Study Interim Report pg. 112
Characteristic CBRR UC Difference Significance level Stars Number of children in family (percent)
1 child 0.43 0.43 0.00 0.292 2 children 0.30 0.30 0.00 3 children 0.13 0.16 -0.03 4 children or more 0.13 0.10 0.03
Worked for pay last week (percent) 0.19 0.19 -0.01 0.785 Ever convicted of a felony (percent) 0.11 0.10 0.01 0.617 Family annual income (percent)
Less than $5,000 0.29 0.32 -0.03 0.150 $5,000–9,999 0.31 0.25 0.06 $10,000–14,999 0.18 0.16 0.02 $15,000–19,999 0.09 0.10 -0.01 $20,000–24,999 0.04 0.06 -0.02 $25,000 or more 0.07 0.08 -0.01
Ever been homeless before (percent) 0.63 0.62 0.01 0.697 Ever been doubled up before (percent) 0.86 0.86 0.00 0.952 Number of barriers to finding housing1 4.24 4.41 -0.18 0.448 Child under 18 living elsewhere (percent) 0.23 0.24 -0.01 0.763 Number of major life challenges2 2.04 2.17 -0.12 0.367 F-test on all characteristics except site F value = 1.446 F-test p-value = 0.038 **
Note: Chi-square tests used to test the difference between groups for all characteristics except mean age. t-test used for mean age.
* =0.10 level, **=0.05 level, ***=0.01 level 1 Barriers to finding housing were reported by adult respondents as “big problems” in finding housing. The maximum number of barriers is 19. 2 The seven major life challenges measured are: psychological distress, PTSD, felony conviction, experience of domestic violence, childhood separation (foster care, group home,
or institutionalization), medical condition, and substance abuse.
Appendix D
Family Options Study Interim Report pg. 113
Exhibit D-4: Family Options Study—baseline equivalency check, PBTH vs. SUB
Characteristic PBTH SUB Difference Significance level Stars Number of families 241 258 Age of household head at RA (percent)
Less than 21 years old 0.08 0.07 0.02 0.303 21–24 years 0.17 0.24 -0.07 25–29 years 0.27 0.21 0.06 30–34 years 0.21 0.19 0.02 35–44 years 0.18 0.20 -0.02 45 years and older 0.08 0.10 -0.02 Mean age (years) 30.50 30.80 -0.30 0.660
Gender (percent)
Female 0.88 0.92 -0.04 0.144 Male 0.12 0.08 0.039
Marital status (percent)
Single (never married/wid./sep./div.) 0.68 0.70 -0.02 0.660 Married or marriage-like situation 0.32 0.30 0.021
Race/ethnicity (percent)
Black/African American, not Hispanic 0.34 0.32 0.02 0.386 White, not Hispanic 0.25 0.22 0.03 Hispanic 0.15 0.21 -0.06 Other 0.25 0.24 0.01
Educational attainment (percent)
Less than high school diploma 0.32 0.31 0.00 0.913 High school diploma/GED 0.40 0.41 -0.02 More than high school diploma 0.29 0.27 0.01
Number of adults in family (percent)
1 adult 0.64 0.64 0.00 0.880 2 adult 0.31 0.29 0.02 3 or more adults 0.05 0.06 -0.01
Appendix D
Family Options Study Interim Report pg. 114
Characteristic PBTH SUB Difference Significance level Stars Number of children in family (percent)
1 child 0.40 0.43 -0.04 0.398
2 children 0.30 0.32 -0.02 3 children 0.20 0.17 0.03 4 children or more 0.10 0.07 0.03
Worked for pay last week (percent) 0.16 0.18 -0.02 0.626 Ever convicted of a felony (percent) 0.12 0.13 -0.01 0.689 Family Annual income (percent)
Less than $5,000 0.30 0.31 -0.01 0.181 $5,000–9,999 0.27 0.31 -0.04 $10,000–14,999 0.18 0.16 0.02 $15,000–19,999 0.12 0.06 0.06 $20,000–24,999 0.06 0.06 0.00 $25,000 or more 0.03 0.05 -0.02
Ever been homeless before (percent) 0.60 0.62 -0.02 0.537 Ever been doubled up before (percent) 0.81 0.85 -0.04 0.290 Number of barriers to finding housing1 4.27 4.18 0.08 0.762 Child under 18 living elsewhere (percent) 0.22 0.27 -0.05 0.179 Number of major life challenges2 2.15 2.10 0.04 0.886 F-test on all characteristics except site F value = 0.911 F-test p-value = 0.619
Note: Chi-square tests used to test the difference between groups for all characteristics except mean age. t-test used for mean age.
* =0.10 level, **=0.05 level, ***=0.01 level1 Barriers to finding housing were reported by adult respondents as “big problems” in finding housing. The maximum number of barriers is 19.2 The seven major life challenges measured are: psychological distress, PTSD, felony conviction, experience of domestic violence, childhood separation (foster care, group home,
or institutionalization), medical condition, and substance abuse.
Appendix D
Family Options Study Interim Report pg. 115
Exhibit D-5: Family Options Study—baseline equivalency check, PBTH vs. CBRR
Characteristic PBTH CBRR Difference Significance level Stars Number of families 241 236 Age of household head at RA (percent)
Less than 21 years old 0.08 0.05 0.03 0.399 21–24 years 0.14 0.16 -0.02 25–29 years 0.24 0.27 -0.03 30–34 years 0.23 0.21 0.02 35–44 years 0.22 0.25 -0.03 45 years and older 0.09 0.06 0.03 Mean age (years) 31.59 31.16 0.43 0.067 *
Gender (percent)
Female 0.89 0.89 0.00 0.936 Male 0.11 0.11 -0.002
Marital status (percent)
Single (never married/wid./sep./div.) 0.71 0.65 0.06 0.158 Married or marriage-like situation 0.29 0.35 -0.057
Race/ethnicity (percent)
Black/African American, not Hispanic 0.43 0.44 0.00 0.904 White, not Hispanic 0.20 0.17 0.02 Hispanic 0.14 0.13 0.01 Other 0.24 0.26 -0.02
Educational attainment (percent)
Less than high school diploma 0.39 0.32 0.07 0.137 High school diploma/GED 0.31 0.39 -0.08 More than high school diploma 0.30 0.30 0.01
Number of adults in family (percent)
1 adult 0.66 0.58 0.08 0.240 2 adult 0.24 0.28 -0.04 3 or more adults 0.10 0.13 -0.03
Appendix D
Family Options Study Interim Report pg. 116
Characteristic PBTH CBRR Difference Significance level Stars Number of children in family (percent)
1 child 0.41 0.42 0.00 0.879 2 children 0.28 0.30 -0.02 3 children 0.17 0.14 0.03 4 children or more 0.14 0.14 0.00
Worked for pay last week (percent) 0.22 0.25 -0.03 0.375 Ever convicted of a felony (percent) 0.12 0.11 0.01 0.726 Family annual income (percent)
Less than $5,000 0.25 0.26 -0.01 0.958 $5,000–9,999 0.27 0.29 -0.02 $10,000–14,999 0.19 0.19 0.00 $15,000–19,999 0.13 0.11 0.02 $20,000–24,999 0.06 0.06 0.00 $25,000 or more 0.06 0.07 -0.01
Ever been homeless before (percent) 0.59 0.61 -0.02 0.632 Ever been doubled up before (percent) 0.84 0.86 -0.03 0.417 Number of barriers to finding housing1 4.17 3.92 0.26 0.443 Child under 18 living elsewhere (percent) 0.24 0.28 -0.04 0.329 Number of major life challenges2 2.02 1.85 0.17 0.073* F-test on all characteristics except site F value = 0.786 F-test p-value = 0.803
Note: Chi-square tests used to test the difference between groups for all characteristics except mean age. t-test used for mean age.
* =0.10 level, **=0.05 level, ***=0.01 level 1 Barriers to finding housing were reported by adult respondents as “big problems” in finding housing. The maximum number of barriers is 19. 2 The seven major life challenges measured are: psychological distress, PTSD, felony conviction, experience of domestic violence, childhood separation (foster care, group home,
or institutionalization), medical condition, and substance abuse.
Appendix D
Family Options Study Interim Report pg. 117
Exhibit D-6: Family Options Study—baseline equivalency check, SUB vs. CBRR
Characteristic SUB CBRR Difference Significance level Stars Number of families 439 387 Age of household head at RA (percent)
Less than 21 years old 0.08 0.11 -0.03 0.388
21–24 years 0.20 0.18 0.01 25–29 years 0.24 0.22 0.02 30–34 years 0.20 0.20 0.00 35–44 years 0.19 0.22 -0.03 45 years and older 0.09 0.06 0.03 Mean age (years) 30.70 30.39 0.32 0.263
Marital status (percent) Single (never married/wid./sep./div.) 0.74 0.73 0.01 0.697 Married or marriage-like situation 0.26 0.27 -0.014
Race/ethnicity (percent) Black/African American, not Hispanic 0.37 0.40 -0.02 0.815 White, not Hispanic 0.23 0.24 -0.01 Hispanic 0.23 0.20 0.02 Other 0.17 0.16 0.01
Educational attainment (percent) Less than high school diploma 0.36 0.35 0.02 0.882 High school diploma/GED 0.39 0.40 -0.01 More than high school diploma 0.24 0.25 -0.01
Number of adults in family (percent) 1 adult 0.72 0.69 0.03 0.280 2 adult 0.26 0.26 0.00
3 or more adults 0.02 0.04 -0.02
Appendix D
Family Options Study Interim Report pg. 118
Characteristic SUB CBRR Difference Significance level Stars Number of children in family (percent)
1 child 0.46 0.45 0.01 0.226
2 children 0.31 0.30 0.00 3 children 0.13 0.11 0.03 4 children or more 0.09 0.13 -0.04
Worked for pay last week (percent) 0.13 0.16 -0.03 0.174 Ever convicted of a felony (percent) 0.12 0.12 0.00 0.994 Family annual income (percent)
Ever been homeless before (percent) 0.62 0.65 -0.03 0.438 Ever been doubled up before (percent) 0.84 0.86 -0.02 0.358 Number of barriers to finding housing1 4.50 4.32 0.18 0.711 Child under 18 living elsewhere (percent) 0.26 0.22 0.04 0.183
Number of major life challenges2 2.14 2.07 0.06 0.098
F-test on all characteristics except site F value = 0.785 F-test p-value = 0.818
Note: Chi-square tests used to test the difference between groups for all characteristics except mean age. t-test used for mean age.
* =0.10 level, **=0.05 level, ***=0.01 level1 Barriers to finding housing were reported by adult respondents as “big problems” in finding housing. The maximum number of barriers is 19.2 The seven major life challenges measured are: psychological distress, PTSD, felony conviction, experience of domestic violence, childhood separation (foster care, group home,
or institutionalization), medical condition, and substance abuse.
References
Family Options Study Interim Report pg. 119
References
Bassuk, E. L., Weinreb, L. F., Buckner, J. C., Browne, A., Salomon, A., & Bassuk, S. S. (1996). The characteristics and needs of sheltered homeless and low-income housed mothers. American Journal of the American Medical Association, 276(8): 640-646.
Burt, M. R., Aron, L. Y., Douglas, T., Valente, J., Lee, E., & Iwen, B. (2009). Homelessness: Programs and the people they serve: Summary report. Washington, DC: Urban Institute.
Burt, M., Aron, L., & Lee, E. E., with Valente, J. (2001). Helping America’s homeless: Emergency Shelter or Affordable Housing? Washington, DC: Urban Institute Press.
Centers for Disease Control and Prevention. 2011 national health interview survey. Accessed July 20, 2012, at http://www.cdc.gov/nchs/data/nhis/earlyrelease/earlyrelease201206_13.pdf.
Cherpitel, C. J. (2000). A brief screening instrument for problem drinking in the emergency room: The RAPS-4. Journal of Studies on Alcohol, 61(3): 447-449.
Cowal, K., Shinn, M., Weitzman, B. C., Stojanovic, D., & Labay, L. (2002). Mother-child separations among homeless and housed families receiving public assistance in New York City. American Journal of Community Psychology, 30:5.
Finkel, M., & Buron, L. (2001). Study on Section 8 voucher success rates: Vol. 1—Quantitative study of success rates in metropolitan Areas. Washington, DC: Report prepared by Abt Associates, Inc. for the U.S. Department of Housing and Urban Development.
Gubits, D., Spellman, B., McInnis, D., Bell, S., & Wood, M. (2012). Family options study: Revised data collection and analysis plan. Prepared for the U.S. Department of Housing and Urban Development, Office of Policy Development and Research. Bethesda, MD: Abt Associates, Inc.
Institute for Children and Poverty, (2010). National survey of programs and services for homeless families. Accessed July 19, 2012, at http://www.icphusa.org/PDF/reports/ICP_Massachusetts_Brief.pdf
Jacob, B. A., & Ludwig, J. (2012). The effects of housing assistance on labor supply: Evidence from a voucher lottery. American Economic Review, 102(1): 272–304.
Loprest, P. (2012). How has the TANF caseload changed over time? Urban Institute Research Brief #8.
Mayberry, L. S. (2012). Family processes in the context of housing instability and intensive service use: Implications for parenting and caregiver well-being. PhD Diss., Vanderbilt University.
Mills, G., Gubits, D., Orr, L., Long, D., Feins, J., Kaul, B., Wood, M., Jones, A.., & Associates, Cloudburst Consulting, and the QED Group (2006). Effects of housing vouchers on welfare families: Final report. Prepared for the U.S. Department of Housing and Urban Development, Office of Policy Development and Research. Cambridge, MA: Abt Associates Inc.
National Comorbidity Survey–Replication (NCS-R), (2005). Accessed July 16, 2012, at http://www.hcp.med.harvard.edu/ncs/ftpdir/NCS-R_12-month_Prevalence_Estimates.pdf
Orr, L., Feins, J., Jacob, R., Beecroft, E., Sanbonmatsu, L., Katz, L., Liebman, J., and Kling, J. (2003). Moving to opportunity interim impacts evaluation: Final report. Cambridge, MA: Abt Associates Inc. and National Bureau of Economic Research.
Park, J. M., Metraux, S., Broadbar, G., & Culhane, D. (2004). Child welfare involvement among children in homeless families. Departmental Papers, University of Pennsylvania, School of Social Policy and Practice.
Rog, D. J., & Randolph, F. L. (2002). A multisite evaluation of supported housing: Lessons learned from cross-site collaboration. New Directions for Evaluation, 94: 61-72.
Rog, D. J., & Buckner, J. C. “Homeless Families and Children. (2007). Toward understanding homelessness: The 2007 national symposium on homelessness research. U.S. Department of Health and Human Services, Assistant Secretary for Planning and Evaluation and U.S. Department of Housing and Urban Development, Office of Policy Development and Research.
Skinner, H. A. (1982). The drug abuse screening test. Addictive Behavior, 7(4): 363-371.
Survey of Income and Program Participation (SIPP) (2009). Prevalence and most common causes of disability among adults–United States, 2005. Morbidity and Mortality Weekly Report, May 1, 2009, 58 (16), 421-426. Accessed July 20, 2012, at http://www.cdc.gov/mmwr/preview/mmwrhtml/mm5816a2.htm
U.S. Department of Housing and Urban Development (2103). HUD Fiscal Year 2013 budget: Justifications for estimates. Accessed July 26, 2012 at http://portal.hud.gov/hudportal/HUD?src=/program_offices/cfo/reports/2013/main_toc
U.S. Department of Housing and Urban Development (2011). The annual homeless assessment report to Congress. Washington, DC.
U.S. Department of Housing and Urban Development (2009). Notice of allocations, application procedures, and requirements for homelessness prevention and rapid re-housing program grantees under the American Recovery and Reinvestment Act of 2009.
U.S. Department of Housing and Urban Development, Office of Policy Development & Research (2011). Worst case housing needs: 2009 report to Congress.