1 CHOOSING AN UNDERGRADUATE STEM MAJOR: FAMILY SOCIOECONOMIC STATUS, INDIVIDUAL, AND INSTITUTIONAL FACTORS By LIAN NIU A DISSERTATION PRESENTED TO THE GRADUATE SCHOOL OF THE UNIVERSITY OF FLORIDA IN PARTIAL FULFILLMENT OF THE REQUIREMENTS FOR THE DEGREE OF DOCTOR OF PHILOSOPHY UNIVERSITY OF FLORIDA 2013
Transcript
1
CHOOSING AN UNDERGRADUATE STEM MAJOR: FAMILY SOCIOECONOMIC STATUS, INDIVIDUAL, AND INSTITUTIONAL FACTORS
By
LIAN NIU
A DISSERTATION PRESENTED TO THE GRADUATE SCHOOL OF THE UNIVERSITY OF FLORIDA IN PARTIAL FULFILLMENT
OF THE REQUIREMENTS FOR THE DEGREE OF DOCTOR OF PHILOSOPHY
Problem Statement ................................................................................................. 12Purpose of the Study .............................................................................................. 19Research Questions ............................................................................................... 22Definition of Terms .................................................................................................. 23
STEM Majors .................................................................................................... 23Socioeconomic Status ...................................................................................... 23
Significance of the Study ........................................................................................ 24
REVIEW OF LITERATURE ........................................................................................... 25
College Student Decision Making ........................................................................... 25Holland’s Vocational Choice Theory ................................................................. 27Rational Choice Theory .................................................................................... 31St. John’s Student-Choice Construct ................................................................ 33Human Capital Theory ..................................................................................... 36
STEM Education in College .................................................................................... 43The Choice of College Major ............................................................................ 44Research on STEM Education in College ........................................................ 46
Socioeconomic Status and College Education ....................................................... 52Low-Income Students in Higher Education ....................................................... 53SES and College Decision Making ................................................................... 56
Conceptual Model for this Study ............................................................................. 61Research Direction Pointed by Current Research ............................................ 61Conceptual Model of This Study ....................................................................... 64
Education Longitudinal Study of 2002 (ELS: 2002) .......................................... 68Advantage of the dataset ........................................................................... 69Sampling design ........................................................................................ 70
Integrated Postsecondary Education Data System (IPEDS): Institutional Characteristics and Completions ................................................................... 70
Advantage of the dataset ........................................................................... 71Data sample ............................................................................................... 72
5
Survey of Graduate Students and Postdoctorates in Science and Engineering (GSS) ........................................................................................ 72
Advantage of the dataset ........................................................................... 73Data sample ............................................................................................... 74
Combination of Data Sources and Selection of Cases ..................................... 74Variables ................................................................................................................. 75
Analytic Methods .................................................................................................... 86Statistical Model ............................................................................................... 87Regression Diagnostics .................................................................................... 89Missing Data ..................................................................................................... 91
Missing data of this study ........................................................................... 94Software and auxiliary variables ................................................................ 94Results of imputation ................................................................................. 96
Model Estimation .............................................................................................. 98Limitations of the Study ......................................................................................... 100
DATA ANALYSIS AND RESULTS .............................................................................. 101
Preliminary Data Analysis ..................................................................................... 101Descriptive Statistics ...................................................................................... 101Group Differences on Independent Variables ................................................. 107
Inferential Analysis ................................................................................................ 109Summary of Results .............................................................................................. 126
DISCUSSION AND CONCLUSION ............................................................................. 128
Discussion of Findings .......................................................................................... 128Family SES and STEM Enrollment ................................................................. 130College Investment Level and STEM Enrollment ........................................... 134STEM Offering and STEM Enrollment ............................................................ 136Predictors of STEM Enrollment and Insignificant Variables ............................ 138
Implications for Practice ................................................................................. 150Guidance for parents ............................................................................... 150Guidance for high school students ........................................................... 151Guidance for college students .................................................................. 152
Implications for Future Research .................................................................... 153Qualitative research and causal research design .................................... 153Impact of family SES on STEM education ............................................... 155
6
Comparison of Enrollment of STEM and Other Majors .................................. 155Conclusion ............................................................................................................ 156
STEM CATEGORIZATION AND MAJOR FIELDS OF STUDY ................................... 159
LIST OF REFERENCES ............................................................................................. 164
7
LIST OF TABLES
Table
page
3-1 Dependent and independent variables ............................................................... 80
3-3 Correlation coefficients of STEMSCAU with other independent variables .......... 91
3-4 Correlation coefficients of STEMSCAG with other independent variables .......... 92
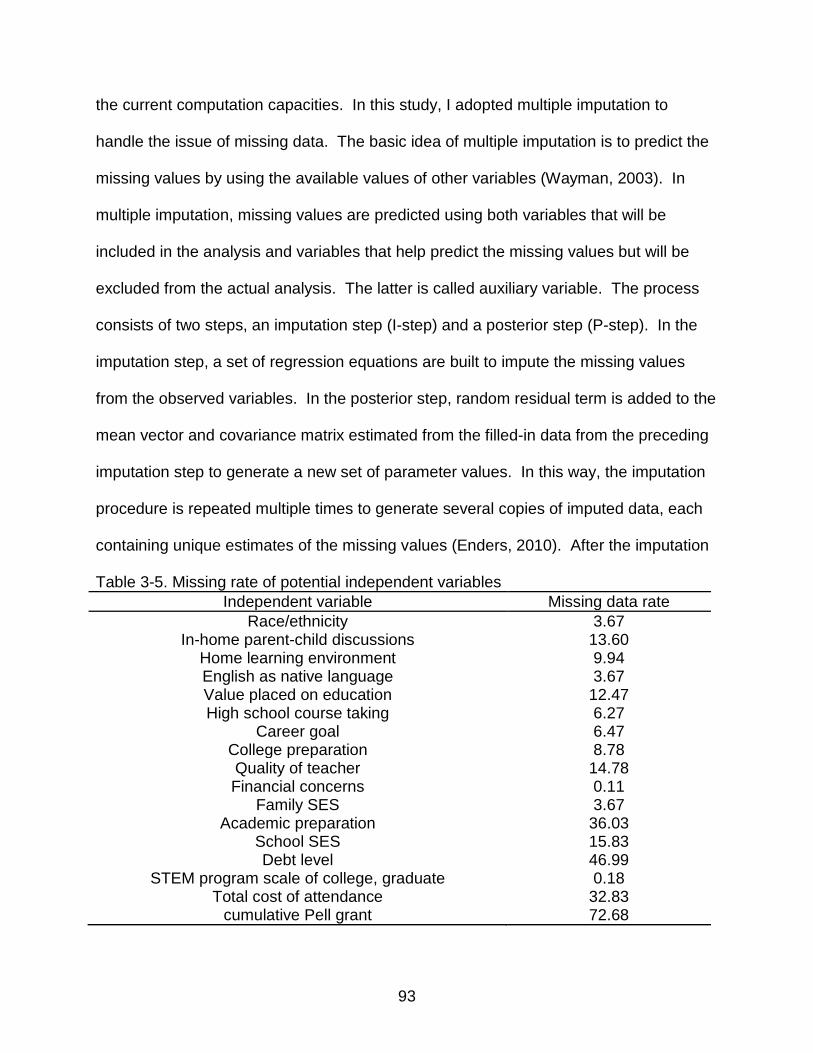
3-5 Missing rate of potential independent variables .................................................. 93
4-1 Demographics of analyses sample by major choice (N=4,500) ........................ 101
4-2 Percentage/mean (standard deviation) of individual context independent variables by major choice ................................................................................. 103
4-3 Percentage/mean (standard deviation) of pre-college context independent variables by major choice ................................................................................. 104
4-4 Percentage/mean (standard deviation) of college context independent variables by major choice ................................................................................. 105
4-5 Chi-squared tests for STEM and non-STEM student groups ............................ 107
4-6 Independent samples t-tests for non-STEM and STEM student groups ........... 108
4-9 Logistic regression results: individual context, pre-college context, and college context variables .................................................................................. 113
4-10 Logistic regression results: individual context, pre-college context, college context variables, and interaction terms ........................................................... 116
4-11 Test for simple slopes for gender, race (Black), highest STEM level offered by institution (Master’s), and SAT math score .................................................. 120
4-12 Test for simple slopes for family SES with SAT math score as moderator variable: female ................................................................................................ 122
4-13 Test for simple slopes for family SES with SAT math score as moderator variable: male ................................................................................................... 124
8
4-14 Pseudo R-squared (Cox-Snell’s) for four logistic regression models ................ 125
A-1 STEM categorization and major fields of study ................................................. 159
9
LIST OF FIGURES
Figure
page
3-1 Structure of student context ................................................................................ 78
3-2 Distribution of variable CNSOWED before and after imputation ......................... 97
3-3 Distribution of variable PELLCUM before and after imputation ........................... 98
4-1 STEM and non-STEM majors by gender .......................................................... 102
4-2 STEM and non-STEM majors by race .............................................................. 102
4-3 STEM and non-STEM majors by native language ............................................ 103
5-1 Hypothesized interaction between family SES and human capital investment . 129
10
Abstract
Promoting STEM enrollment in higher education has been a focus of national
educational discussion and policy. This study examined an important yet understudied
part of the STEM pipeline in college, namely factors that impact the decision making in
STEM enrollment. Adopting the theories of human capital and rational choice, this study
investigated the STEM enrollment pattern with a focus on students’ family
socioeconomic background. The purpose of the study was to examine whether STEM
enrollment is systematically correlated to students’ family SES background. The
following questions guided the study: 1) Is students’ family SES related to their decision
of whether to enroll in a STEM major in college? 2) Does the enrollment decision in
STEM fields vary for students with different college investment levels? 3) Does the
enrollment decision in STEM fields vary at institutions with different scales and levels of
STEM major offerings? It was hypothesized that STEM enrollment probability is
negatively correlated to family SES, positively correlated to college investment, and
varies with the level and scale of STEM offering at the institution where students enroll.
Results show that family SES by itself is not statistically significantly correlated to
STEM enrollment. College cost is negatively correlated to STEM enrollment. STEM
enrollment does vary with the level and scale of STEM offering at the institution one is
enrolled at. The assumptions based on the conceptual framework are not supported by
the findings. However, family SES does interact with gender, race, academic
preparation, and STEM offering level at institution in correlation with STEM enrollment.
Lower SES students tend to make STEM decisions that are not aligned with their
academic preparation level. Overall, family SES strengthens the magnitude of the
11
factors that are positively correlated with STEM enrollment, and reduces the magnitude
of those that are negatively correlated with STEM enrollment.
Findings show that lower SES students are disadvantaged in STEM enrollment in
college, even after controlling for important predictors of STEM enrollment such as
academic preparation and demographic characteristics. Educators should provide
lower SES students with more information about STEM majors in order to improve
STEM enrollment in higher education.
12
CHAPTER 1 INTRODUCTION
Problem Statement
Educating a strong workforce in science, technology, engineering, and math
(STEM) fields is considered crucial for the United States to retain its global leadership
position in a science and technology dominated global economy (Committee on Equal
Opportunities in Science and Engineering, 2004). The country’s strengths in STEM
education in postsecondary settings have propelled strong economic performance, led
to the development of innovative industries, and produced good jobs for its people
(President's Council of Advisors on Science and Technology, 2012). Training STEM
professionals not only benefits the economy; it also has important bearings on literacy
and democracy (President's Council of Advisors on Science and Technology, 2012).
An examination of college enrollment statistics in STEM majors shows that the
current enrollment level may be insufficient to meet the nation’s human resource needs
in STEM fields. If the current rate of STEM degree production continues, predictions
suggest that there will be a gap of 1 million STEM professionals between what the
nation’s economy needs and what the colleges and universities deliver over the next
decade (President's Council of Advisors on Science and Technology, 2012).
Exemplifying this dilemma, it has been shown that the employment in STEM fields
increased 23 percent between 1994 and 2003, while college graduates in STEM fields
increased only eight percent from academic year 1994-1995 to 2002-2003 (United
States Government Accountability Office, 2005). From academic year 1995-1996 to
2003-2004, the percentage of students in STEM majors increased only 2 percent, from
21 to 23 percent, while from academic year 1994-1995 to 2002-2003, the number of
13
graduates in non-STEM fields increased 30 percent (United States Government
Accountability Office, 2005). From academic year 1995-1996 to 2003-2004, the
numbers of international students in STEM fields on the Bachelor’s level increased 339
percent (United States Government Accountability Office, 2005). International students’
share in Master’s and doctoral degree continues to increase from academic year 1994-
1995 to 2002-2003. These students earned more than 30 percent of Master’s degrees
in engineering, mathematics/computer sciences, and physical sciences and more than
30 percent of doctoral degrees in all STEM fields except for agricultural/biological
sciences and psychology (United States Government Accountability Office, 2005).
Thus, there is a need to improve the production of STEM majors among domestic
students’.
Numerous studies have investigated students’ enrollment and success in STEM
Home learning environment 9.94 English as native language 3.67 Value placed on education 12.47 High school course taking 6.27
Career goal 6.47 College preparation 8.78 Quality of teacher 14.78 Financial concerns 0.11
Family SES 3.67 Academic preparation 36.03
School SES 15.83 Debt level 46.99
STEM program scale of college, graduate 0.18 Total cost of attendance 32.83
cumulative Pell grant 72.68
94
of several sets of data, regular analyses are performed using each of the datasets and
the results are pooled to yield final results.
Compared to traditional methods and maximum likelihood methods, multiple
imputation has several strengths. It produces estimates that are consistent and efficient.
It can be used with any kind of data and model, and does not necessarily require
specialized software to be carried out. To maintain a sample size as large as possible, I
used multiple imputation to fill in the missing values in this study. .
Missing data of this study
This study merged the data from three large scale national datasets, the ELS:
2002, IPEDS, and GSS. Missing data were not exceptional in these datasets, resulting
in incomplete analysis data. Of the 22 potential independent variables, only five
variables had complete data. The missing data rate of the other 17 variables ranged
from 0.11% to 73%. Four of the variables had missing data rate above 30%. While
such missing rate is considered high, literature suggests that multiple imputation could
yield more accurate estimates than traditional methods of missing data when the
missing rate is moderate to high (Choi, Nam, & Kwak, 2004). Table 3-5 shows the
missingness of these variables.
Software and auxiliary variables
Many standard statistical softwares, such as SAS and SPSS, have developed
the function of multiple imputation. For example, the SAS procedure Proc MI, can
perform multiple imputation by drawing from a multivariate normal distribution of all the
variables in the imputation model (Little & Rubin, 2002). This method is suitable for
both continuous and categorical variables with missing values to be imputed; however,
the way it handles categorical variables is ad hoc, namely to round the imputed value of
95
categorical variables (Allison, 2002). With the development of statistical methods and
computer capacities, it is now recommended to avoid this method when handling
categorical variables (Enders, 2010). Instead, multiple imputation by chained equations
(MICE) is advocated to be more suitable for this purpose. This method is also called
sequential regression multiple imputation or fully conditional specification. Instead of
fitting one large multivariate normal imputation model for all variables, this method
builds a series of univariate regression models based on the type of the variable to be
imputed (Raghunathan, Lepkowski, Hoewyk, & Solenberger, 2001). When the dataset
includes many categorical variables, the chained equations approach is more appealing
than the standard imputation method.
Since ten of the independent variables with missing data were categorical, the
chained equations approach was used rather than the method available in SAS Proc MI.
IVEware was used to conduct the multiple imputation. IVEware is the imputation and
variance estimation software developed at the University of Michigan’s Survey
Research Center (University of Michigan, 2011). It imputes missing data using the
sequential regression imputation method. Typically, a total of five imputations would be
sufficient, although it is preferable to perform a larger number of imputations, especially
when it is relatively easy to implement with advanced computing techniques (Allison,
2002). For this study, a total of ten imputations were performed.
One of the advantages of multiple imputation is that it not only uses information
from variables to be included in the analyses, but also uses information from variables
that are not of interest to the researcher but are predictive of the variables to be imputed.
Therefore, selecting a set of auxiliary variables is important to the multiple imputation
96
process (Enders, 2010). The datasets used in this study are longitudinal, providing
sources of variables that are correlated to the independent variables to be included in
the analyses. I selected a set of auxiliary variables using the following principles: that
the auxiliary variable measures the same content as the independent variable or the
auxiliary variable is conceptually related to the independent variable; that the auxiliary
variable has fewer missing data than the independent variable or has a different missing
pattern than the independent variable. The number of auxiliary variables included in the
imputation was not limited, as there is no disadvantage of including as many auxiliary
variables as possible (Rubin, 1996).
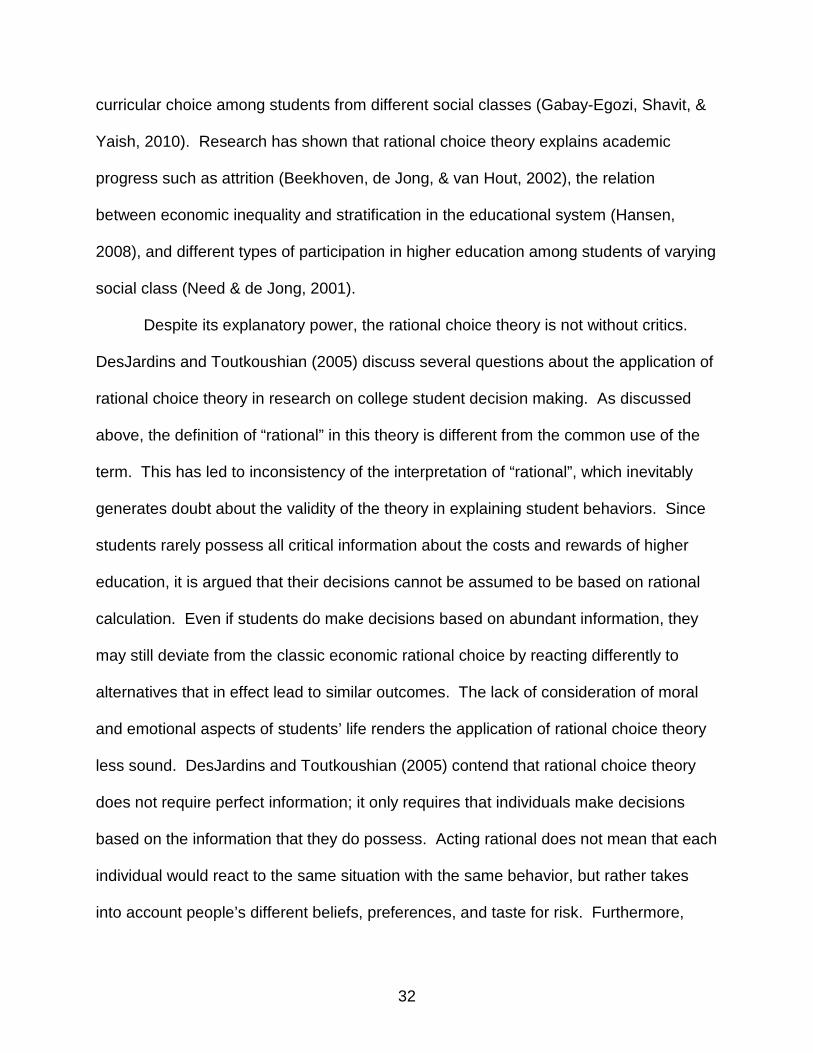
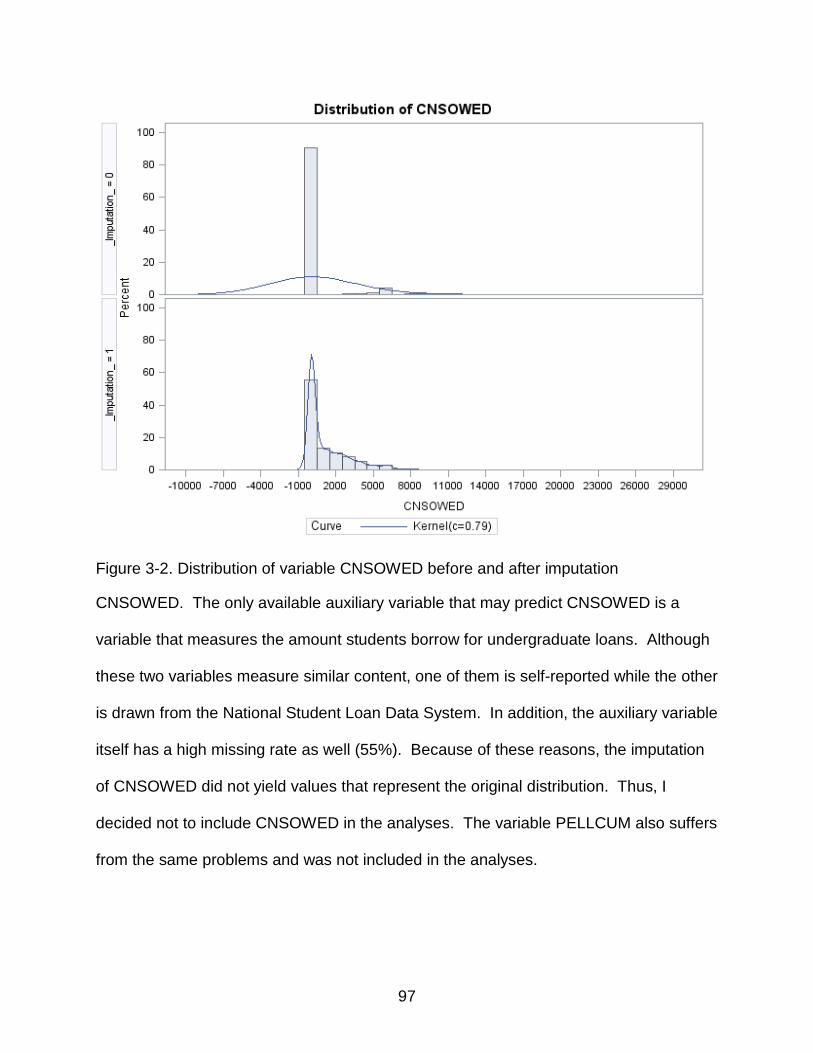
Results of imputation
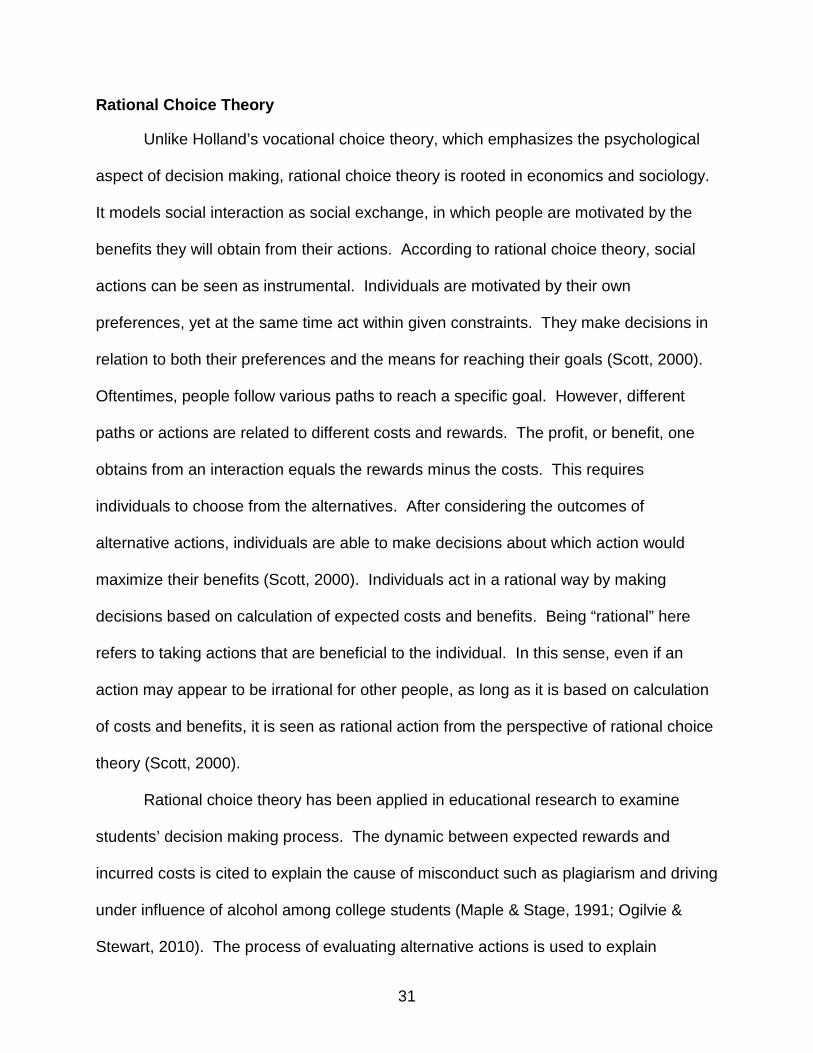
The distribution of variables with missing values was compared before and after
the imputation. The imputed data represent the original distribution of all variables
except for PELLCUM (cumulative Pell grant received) and CNSOWED (consolidated
loan: amount owed). The missing rate of PELLCUM is 73%. The mean is 5358, the
standard deviation is 3316, and the median is 5150. The imputed data has a different
distribution. For one of the imputations, the variable PELLCUM has a mean of 4780, a
standard deviation of 3022, and a median of 4400. The missing rate of CNSOWED is
46.99%. The mean is 597, the standard deviation is 2054, and the median is 0. The
imputed data has a different distribution. For one of the imputations, the variable
CNSOWED has a mean of 1269, a standard deviation of 1956, and a median of 139.
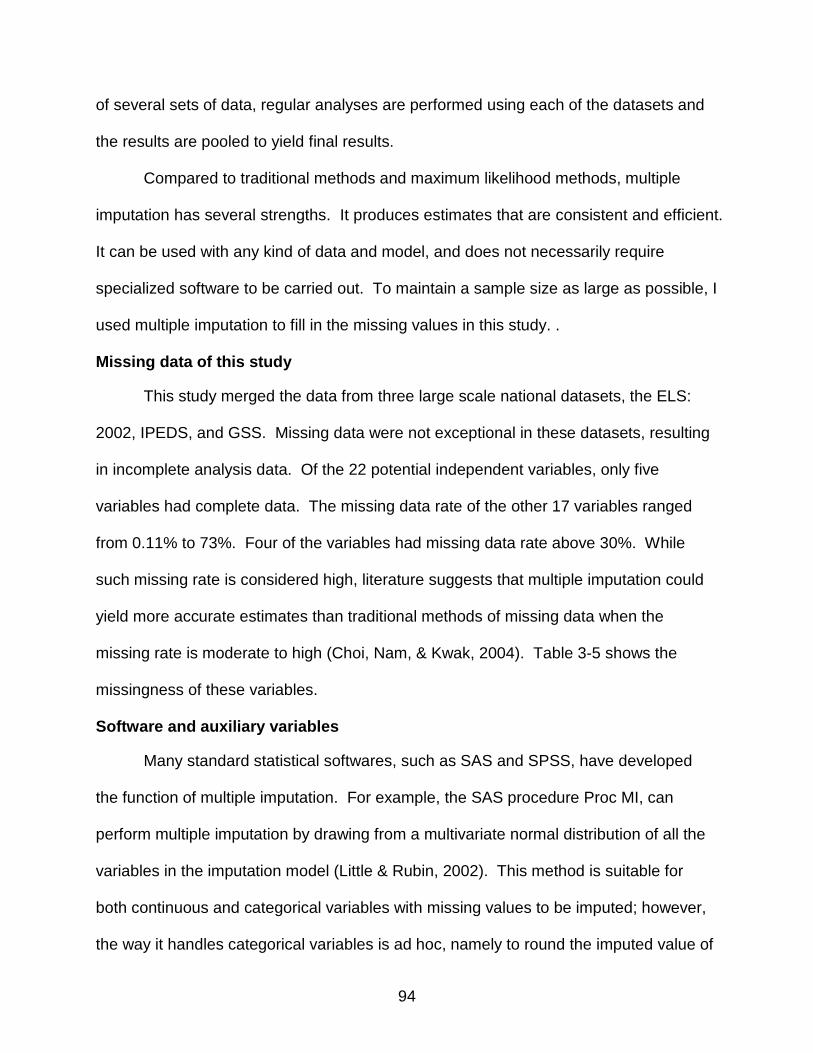
Figure 3-2 and figure 3-3 show the distributions of the original and the imputed variables.
As can be seen from Figure 3-2, it is clear that the imputed variable has a
different distribution compared to the variable before imputation. This is likely because
of the high missing rate of the variable and because of the lack of strong predictor(s) of
97
Figure 3-2. Distribution of variable CNSOWED before and after imputation
CNSOWED. The only available auxiliary variable that may predict CNSOWED is a
variable that measures the amount students borrow for undergraduate loans. Although
these two variables measure similar content, one of them is self-reported while the other
is drawn from the National Student Loan Data System. In addition, the auxiliary variable
itself has a high missing rate as well (55%). Because of these reasons, the imputation
of CNSOWED did not yield values that represent the original distribution. Thus, I
decided not to include CNSOWED in the analyses. The variable PELLCUM also suffers
from the same problems and was not included in the analyses.
98
Figure 3-3. Distribution of variable PELLCUM before and after imputation
Model Estimation
The ELS data are collected using complex survey methods. Thus, I needed to
consider the survey design when analyzing the data in order to compensate for effects
such as unequal probability of selection and stratification. Ignoring the design effects
would lead to inconsistent estimation of parameters and/or standard errors and
consequently erroneous inferential conclusions (Wang, Yu, & Lin, 1997). For the
analysis of complex survey data, two types of methods could be used. Design based
methods account for the effect of complex survey design such as stratification and
clustering by adjusting the standard errors. Common design based methods include
Taylor-series approximation, bootstrapping, jackknife repeated replication, and design
effects. Model based methods incorporate the complex survey design effects in the
99
statistical model in order to obtain unbiased standard errors. The most common model
based methods are hierarchical linear models and multilevel structural equation models.
Research has shown that results obtained from design based methods and model
based methods are highly comparable (Ghoshl & Pahwa, 2006).
In this study, design based method was adopted with the weight variable. This
method removes bias, which is the main concern for complex survey data. The main
analyses were performed using SAS. The survey design effects were accounted for by
using the SAS procedure surveylogistic. This procedure performs logistic regression
while taking into account the design effects common to large scale survey data. Taylor-
series linearization is used by this procedure to obtain unbiased standard errors.
Information about the stratum, cluster, and weight is provided in the ELS data user’s
manual (Ingels et al., 2007). The weight provided in the user’s manual was normalized
in order for the sum of the weight to equal the sample size rather than the population
size.
In ordinary linear regression, the primary measure of model fit is R2, which
measures the percentage of variance in the dependent variable that is explained by
fitting the model. In logistic regression, several measures can be used to assess the
goodness of fit of the model. These include classification tables, Hosmer-Lemeshow
test, and pseudo R2s. Hosmer-Lemeshow test is a significance test, which only reveals
whether the model fits but does not reveal the extent of the fit. In this study, the
generalized pseudo R2 reported by the SAS procedure surveylogistic was used to
assess the goodness of fit of the models (Nagelkerke, 1991).
100
Limitations of the Study
The first limitation of this study was that certain key measures are not available
from the data sources. In order to calculate the individual investment level, information
of students’ family income and grant amount is crucial. Because these measures are
not available with acceptable quality, it was not impossible to calculate the college cost
as a proportion of family income, which would yield more accurate information than the
amount of college attendance cost itself. The second limitation was related to the self-
reported variables, such as frequency of parent-child discussion. While such
information could only be obtained from individuals, their responses are subject to
inaccurate recall of facts or influence of social desirability (Marlowe & Crowne, 1961).
This limitation was mainly related to the variables that measure students’ individual
context.
101
CHAPTER 4 DATA ANALYSIS AND RESULTS
In this chapter, I discuss the findings related to each of the research questions.
First, I present the descriptive statistics and preliminary analyses that examine the
independent variables and group differences. Next I present the logistic regression
analyses and model results. I conclude the chapter with a summary of the findings.
Preliminary Data Analysis
In this section, I present descriptive statistics of the analyses sample. Next I
present the findings from the statistical tests used to examine group differences on
independent variables.
Descriptive Statistics
Table 4-1. Demographics of analyses sample by major choice (N=4,500) Non-STEM major STEM major
Gender Male 37.72% 62.13% Female 62.28% 37.87% Race White 67.93% 60.08% Black 10.11% 10.91% Hispanic 8.03% 6.78% Asian 9.35% 17.70% Other (American Indian/Alaska Native,
non-Hispanic, more than one race, non-Hispanic, Native Hawaii/Pacific Islander, non-Hispanic)
4.58% 4.51%
Native language English 88.81% 80.73% Non-English 11.19% 19.27%
Table 4-1 presents the demographics of the analyses sample by college major
choice. Male students (62.13%) are more likely to choose STEM major than female
students (37.87%). Asian students’ share in STEM majors (17.70%) is higher than their
share in non-STEM majors (9.35%), while the opposite holds for white students
102
(67.93% in non-STEM majors and 60.08% in STEM majors) and Hispanic students
(8.03% in non-STEM majors and 6.78% in STEM majors). Students whose native
language is not English have a larger share in STEM majors (19.27%) than in non-
STEM majors (11.19%). These findings are consistent with prior findings that male,
Asian, and students who lack cultural capital tend to be more likely to choose STEM
major in college (Xie & Goyette, 2003). Figures 4-1 to 4-3 show the distribution of major
groups by gender, race, and native language, respectively.
Figure 4-1. STEM and non-STEM majors by gender
Figure 4-2. STEM and non-STEM majors by race
103
Figure 4-3. STEM and non-STEM majors by native language
Table 4-2. Percentage/mean (standard deviation) of individual context independent variables by major choice
Non-STEM major STEM major Family SES 0.42 (0.68) 0.48 (0.71) Parental expectation Lower than college 0.73% 0.65% College, 4 year or lower 43.16% 33.78% Graduate school 56.11% 65.58% In-home parent-child discussions Never 10.16% 11.53% Sometimes 51.20% 47.03% Often 38.64% 41.43% Home learning environment More than 50 books at home 91.33% 90.71% No more than 50 books at home 8.67% 9.29% Student expectation High school or lower 0 0 College, 4 or 2 years 32.93% 26.12% Graduate school 64.99% 71.46% Not clear 2.07% 2.43% Value placed on education
Never or rarely given special privileges for good grades 32.31% 36.88%
Sometimes given special privileges for good grades 35.41% 36.32%
Often given special privileges for good grades 32.28% 26.80%
Table 4-2 shows the percentage/mean (standard deviation) of individual context
independent variables by major choice. As can be seen, the average family SES is
higher for students who choose STEM majors (0.48) than those who choose non-STEM
104
majors (0.42). Students whose parents expect them to attend graduate school have a
larger share in STEM majors (65.58%) than in non-STEM majors (56.11%). Students
who expect themselves to attend graduate school also have a larger share in STEM
majors (71.46%) than in non-STEM majors (64.99%). Students who expect themselves
to attend no higher than undergraduate college have a smaller share in choosing STEM
majors (26.12%) than choosing non-STEM majors (32.93%). Students who are often
given special privileges for good grades have a smaller share in choosing STEM majors
(26.80%) than choosing non-STEM majors (32.28%), while students who are never or
rarely given special privileges have a larger share in choosing STEM majors (36.88%)
than choosing non-STEM majors (32.31%). Students who often discuss school courses
with parents have a larger share in choosing STEM majors (41.43%) than choosing
non-STEM majors (38.64%), while the opposite holds for students who only sometimes
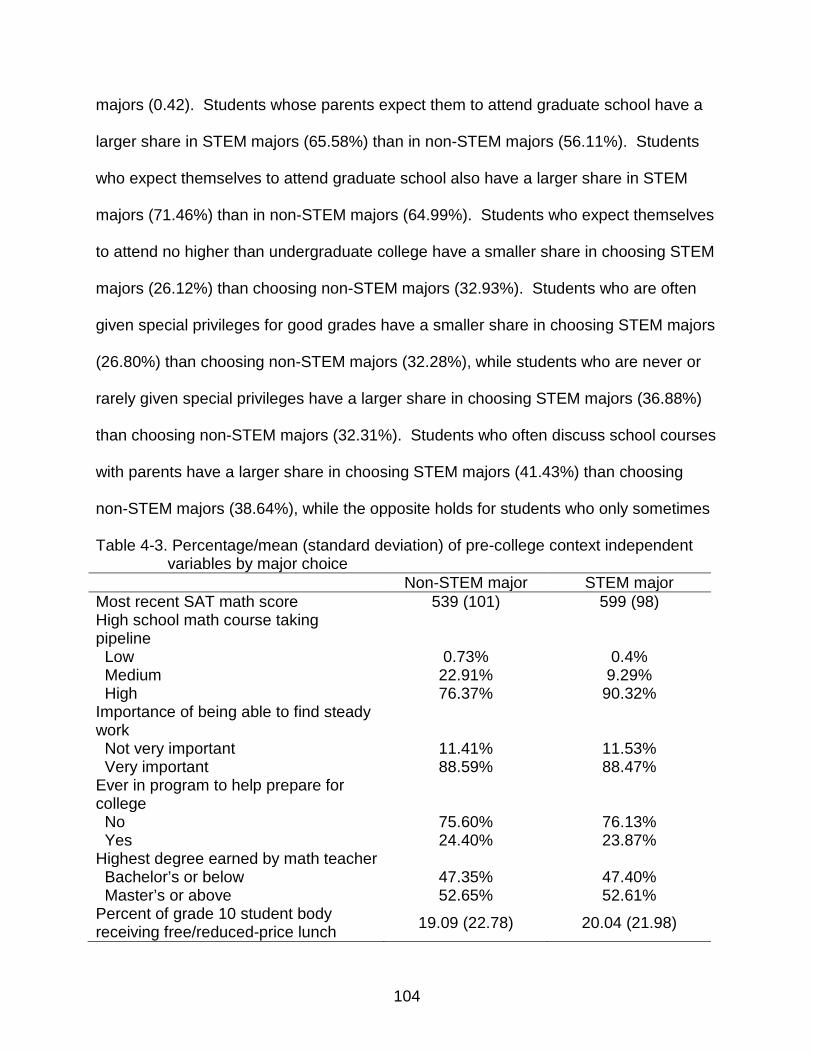
Table 4-3. Percentage/mean (standard deviation) of pre-college context independent variables by major choice
Non-STEM major STEM major Most recent SAT math score 539 (101) 599 (98) High school math course taking pipeline
Low 0.73% 0.4% Medium 22.91% 9.29% High 76.37% 90.32% Importance of being able to find steady work
Not very important 11.41% 11.53% Very important 88.59% 88.47% Ever in program to help prepare for college
No 75.60% 76.13% Yes 24.40% 23.87% Highest degree earned by math teacher Bachelor’s or below 47.35% 47.40% Master’s or above 52.65% 52.61% Percent of grade 10 student body receiving free/reduced-price lunch 19.09 (22.78) 20.04 (21.98)
105
discuss school courses with parents (47.03% in choosing STEM majors and 51.20% in
choosing non-STEM majors). Students’ major choice does not seem to differ by the
amount of books at home.
Table 4-3 shows the percentage/mean (standard deviation) of pre-college
context independent variables by major choice. As can be seen, students who choose
STEM majors have an average SAT score (599) much higher than those who choose
non-STEM majors (539). Among those who major in STEM fields, 90.32% of the
students have finished high level math course in high school, while only 76.37% of the
students who choose non-STEM majors have finished such courses. The percentage
of students across different levels of career goal, college preparation program
participation, and highest degree earned by math teacher are very similar for students
majoring in STEM and non-STEM fields. In addition, students with different major
choices come from high schools with similar average SES level.
Table 4-4. Percentage/mean (standard deviation) of college context independent variables by major choice
Non-STEM major Stem major Total cost of attendance 20,832 (9,564) 20,011 (8,792) Chose school for cost No 50.42% 47.61% Yes 49.58% 52.39% Selectivity of college Not classified 5.34% 4.57% Inclusive 10.57% 7.74% Moderately selective 46.92% 38.53% Highly selective 37.17% 49.16% Graduate enrollment in STEM fields 727 (1,075) 1,184 (1,334) Highest degree in STEM fields offered by institute
college, 4 year or lower -0.04 0.53 -0.08 0.94 0.96
parental expectation: graduate school 0.26 0.54 0.48 0.63 1.30
discussion of course work: sometimes 0.07 0.18 0.39 0.70 1.07
discussion of course work: often 0.32 0.19 1.68 0.10 1.37
student expectation: college -0.34 0.31 -1.12 0.26 0.71
student expectation: graduate school -0.06 0.30 -0.22 0.83 0.94
special privileges given for good grades: sometimes -0.17 0.11 -1.5 0.14 0.85
special privileges given for good grades: often -0.46 0.14 -3.33 0.001 0.63
English is native language -0.39 0.19 -2.08 0.04 0.68 family has more than 50
books -0.03 0.17 -0.15 0.88 0.98 Note. “Other racial groups” refer to American Indian/Alaska Native, non-Hispanic, more than one race, non-Hispanic, Native Hawaii/Pacific Islander, and non-Hispanic.
110
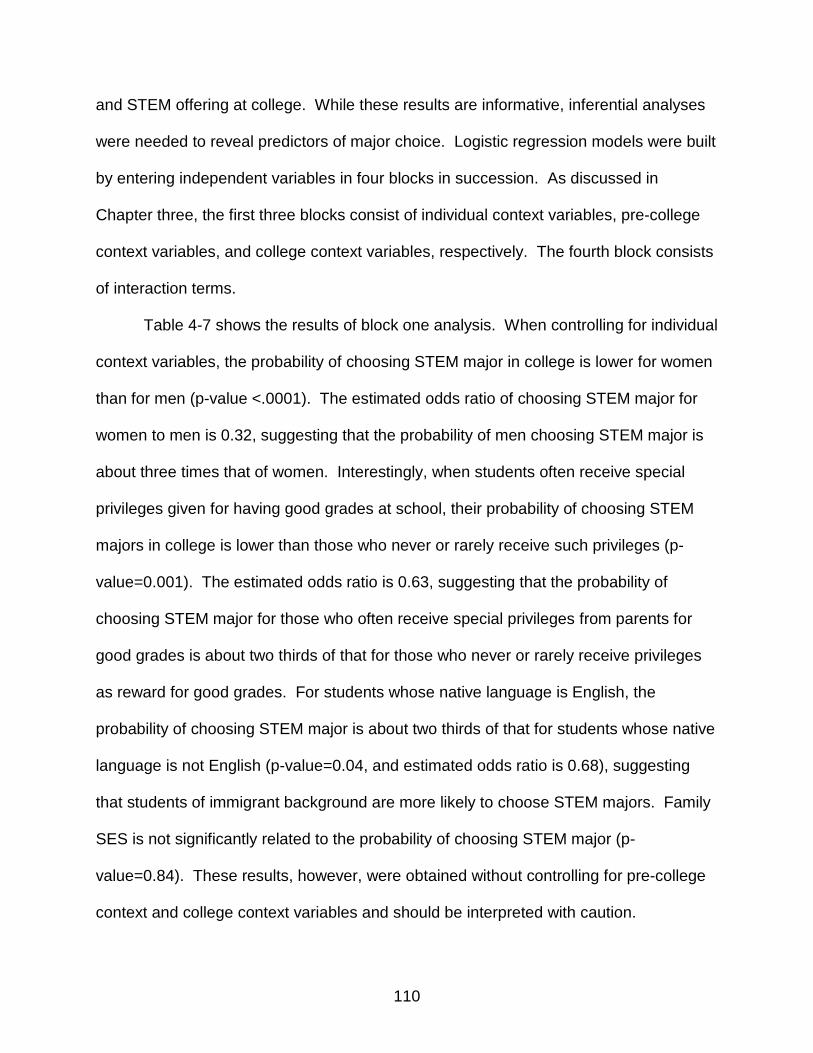
and STEM offering at college. While these results are informative, inferential analyses
were needed to reveal predictors of major choice. Logistic regression models were built
by entering independent variables in four blocks in succession. As discussed in
Chapter three, the first three blocks consist of individual context variables, pre-college
context variables, and college context variables, respectively. The fourth block consists
of interaction terms.
Table 4-7 shows the results of block one analysis. When controlling for individual
context variables, the probability of choosing STEM major in college is lower for women
than for men (p-value <.0001). The estimated odds ratio of choosing STEM major for
women to men is 0.32, suggesting that the probability of men choosing STEM major is
about three times that of women. Interestingly, when students often receive special
privileges given for having good grades at school, their probability of choosing STEM
majors in college is lower than those who never or rarely receive such privileges (p-
value=0.001). The estimated odds ratio is 0.63, suggesting that the probability of
choosing STEM major for those who often receive special privileges from parents for
good grades is about two thirds of that for those who never or rarely receive privileges
as reward for good grades. For students whose native language is English, the
probability of choosing STEM major is about two thirds of that for students whose native
language is not English (p-value=0.04, and estimated odds ratio is 0.68), suggesting
that students of immigrant background are more likely to choose STEM majors. Family
SES is not significantly related to the probability of choosing STEM major (p-
value=0.84). These results, however, were obtained without controlling for pre-college
context and college context variables and should be interpreted with caution.
parental expectation: graduate school 0.04 0.56 0.07 0.95 1.04
discussion of course work: sometimes -0.01 0.19 -0.03 0.97 0.99
discussion of course work: often 0.27 0.19 1.4 0.16 1.30 student expectation: college -0.17 0.35 -0.49 0.63 0.84
student expectation: graduate school -0.07 0.35 -0.21 0.84 0.93
special privileges given for good grades: sometimes -0.05 0.12 -0.38 0.70 0.96
special privileges given for good grades: often -0.32 0.15 -2.13 0.04 0.73
English is native language -0.21 0.20 -1.06 0.29 0.81 family has more than 50 books -0.26 0.19 -1.35 0.18 0.77 most recent SAT math score 0.01 0.0008 6.38 <.0001 1.01 highest level of mathematics
parental expectation: graduate school 0.17 0.55 0.31 0.76 1.18
discussion of course work: sometimes -0.01 0.19 -0.04 0.97 0.99
discussion of course work: often 0.27 0.19 1.4 0.16 1.31 student expectation: college -0.21 0.34 -0.61 0.54 0.81
student expectation: graduate school -0.09 0.33 -0.28 0.78 0.91
special privileges given for good grades: sometimes -0.05 0.12 -0.43 0.67 0.95
special privileges given for good grades: often -0.31 0.15 -2.11 0.04 0.74
English is native language -0.23 0.20 -1.16 0.25 0.79 family has more than 50 books -0.26 0.19 -1.37 0.17 0.77 most recent SAT math score 0.004 0.0009 5.13 <.0001 1.004 highest level of mathematics
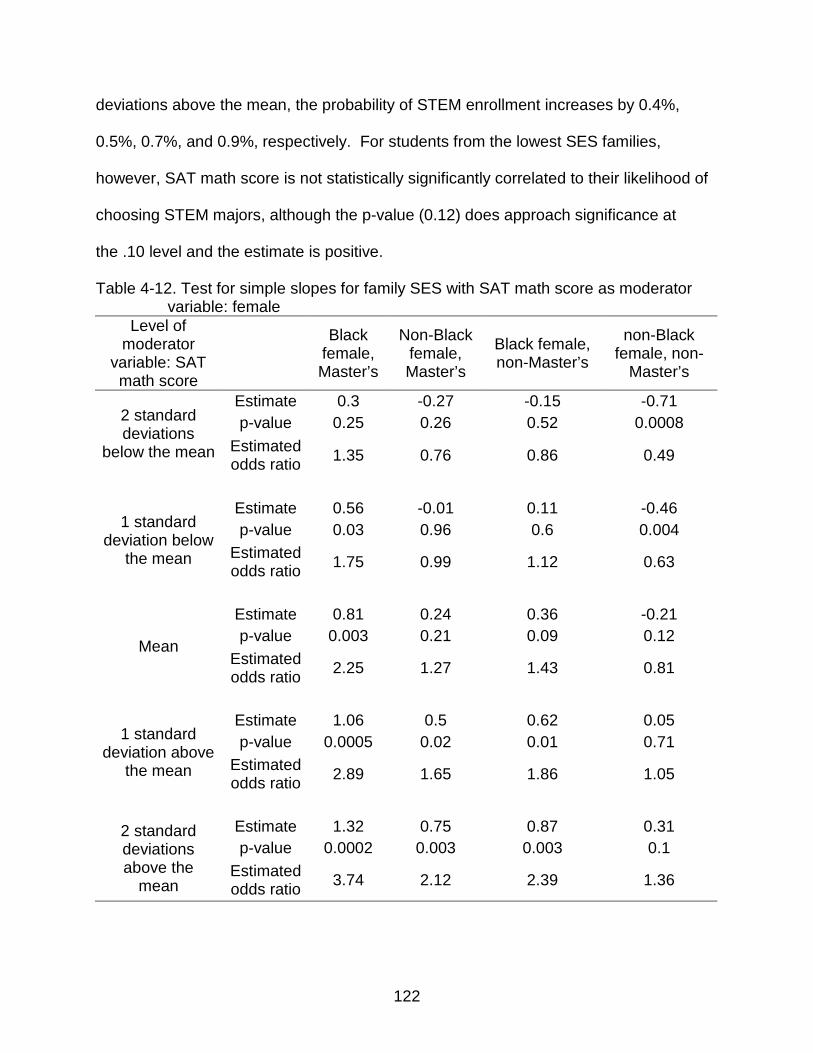
is below the mean, family SES does not play a role in the probability of STEM
enrollment.
Table 4-13 shows the simple slope estimates for family SES for male. For male
students, when SAT math score is very high (two standard deviations above the mean),
family SES is positively related to STEM enrollment except for non-Black students
attending non-Master’s institutions. When SAT math score is one standard deviation
above the mean, the positive association only holds for Black male students attending
Master’s institutions. When SAT math score is at the mean, the positive association still
holds for this subgroup. However, for another subgroup, the correlation becomes
negative. For non-Black male students attending non-Master’s institutions, when SAT
math score is at the mean, family SES is negatively correlated to STEM enrollment (p-
value=0.0002, estimated odds ratio=0.64). Such negative correlation also holds for this
subgroup when SAT math score is below the mean. When SAT math score is very low
(two standard deviations below the mean), the negative correlation holds for all male
students except for Black male students attending Master’s institutions. For both the
positive and negative correlations, the more extreme the SAT math score, the stronger
is the correlation between family SES and STEM enrollment probability.
Table 4-14. Pseudo R-squared (Cox-Snell’s) for four logistic regression models Model Cox-Snell’s R-squared
Block 1: individual context variables 0.08 Block 1 and 2: individual and pre-college
context variables 0.13
Block 1- 3: individual, pre-college, and college context variables 0.14
Block 1 - 4: individual, pre-college, college context variables and interaction terms 0.15
126
Table 4-14 shows the Cox-Snell’s R-squared for the four logistic regression
models with block entry. As can be seen, the Cox-Snell’s R-squared increases with the
increase of number of independent variables entered in the model. Pseudo R-squared
of logistic regression, such as the Cox-Snell’s R-squared reported here, measures the
improvement from the null model with no predictors to fitting the model with certain
independent variables, rather than the variance explained by the model. Although the
values of the R-squared are small, the constant increase suggests that entering
additional predicators and interaction terms did improve the model.
Summary of Results
This chapter presented results from the preliminary and advanced analyses.
Descriptive statistics, chi-squared tests, and independent sample t-tests were used to
describe the analysis sample and examine group differences between STEM and non-
STEM students on independent variables. Results show that STEM and non-STEM
students differ on factors including family SES, gender, race, parental expectation,
native language, whether receive special privileges for good grades, math preparation
level, selectivity of institution, STEM offering scale and level at institution, as well as
total cost of college attendance. On average, STEM students have higher family SES,
higher math preparation level, and attend colleges with larger STEM enrollment and
lower cost. STEM students receive special privileges for good grades less frequently,
more often choose college for financial concerns, and have higher educational
expectations from both parents and themselves.
Results from logistic regression analyses with block entry of independent
variables show that gender and whether given special privileges for good grades are
consistently correlated to STEM enrollment probability, with female and those who often
127
receive such privileges disadvantaged in terms of choosing STEM majors. Having a
native language other than English is positively correlated to STEM enrollment without
controlling for pre-college and college context variables. After controlling for such
factors, the correlation between native language and STEM enrollment disappeared.
After controlling for pre-college variables, race (being Black) is positively correlated to
STEM enrollment. Not surprisingly, SAT math score is positively related to choosing
STEM majors. Interestingly, although independent t-test show that STEM and non-
STEM students do not differ significantly on the SES level of the high school they attend
(as measured by the percentage of student body receiving free/reduced-price lunch),
logistic regression analyses show consistent significant negative correlation between
high school SES and STEM enrollment. Institutional selectivity is negatively correlated
to STEM enrollment, while STEM major enrollment scale on the graduate level is
positively correlated to choosing STEM major. Enrolling in Master’s institution
(institutions where the highest degree conferred in STEM fields is Master’s degree) is
negatively correlated to the probability of choosing STEM majors. While family SES
itself is not statistically significantly correlated with STEM enrollment, it does interact
with several factors including gender, race, STEM degree level, and math preparation.
After entering interaction terms, the total cost of college attendance is negatively related
to STEM enrollment. In the next chapter, I interpret these findings in more detail,
answer the research questions, compare the findings to existing research literature, and
discuss implications for practice and future research.
128
CHAPTER 5 DISCUSSION AND CONCLUSION
In this chapter, I discuss the findings related to the research questions and their
congruence with previous research findings. Then I describe the implications of the
findings for practice and future research, followed by the conclusion of this study.
Discussion of Findings
In the previous chapter, the analyses results were presented and described. In
this subsection, I discuss the findings in detail by relating them to the research
questions, the theoretical framework, and existing research literature. I start with a
review of the purpose of the study, the theoretical framework, the research questions,
and the proposed hypotheses.
The purpose of this study was to examine college students’ enrollment pattern in
STEM majors with a focus on students’ family SES. I examined whether students’
enrollment in STEM majors is systematically related to their family SES and if so, what
the direction and magnitude of such association is. The following research questions
were investigated:
• Research question 1: Is students’ family SES related to their decision of whether to enroll in a STEM major in college?
• Research question 2: Does the enrollment decision in STEM fields vary for students with different college investment levels?
• Research question 3: Does the enrollment decision in STEM fields vary at institutions with different scales and levels of STEM major offerings?
To answer these questions, I adopted the theories of human capital and rational
choice. Students were assumed to be rational actors in their decision of major choice
and it was assumed that they have weighed the potential gains of certain college majors
against the monetary and non-monetary investments they and their families make in
129
their own human capital. While students are confined in their individual and
environmental contexts when they make educational decisions, economic factors and
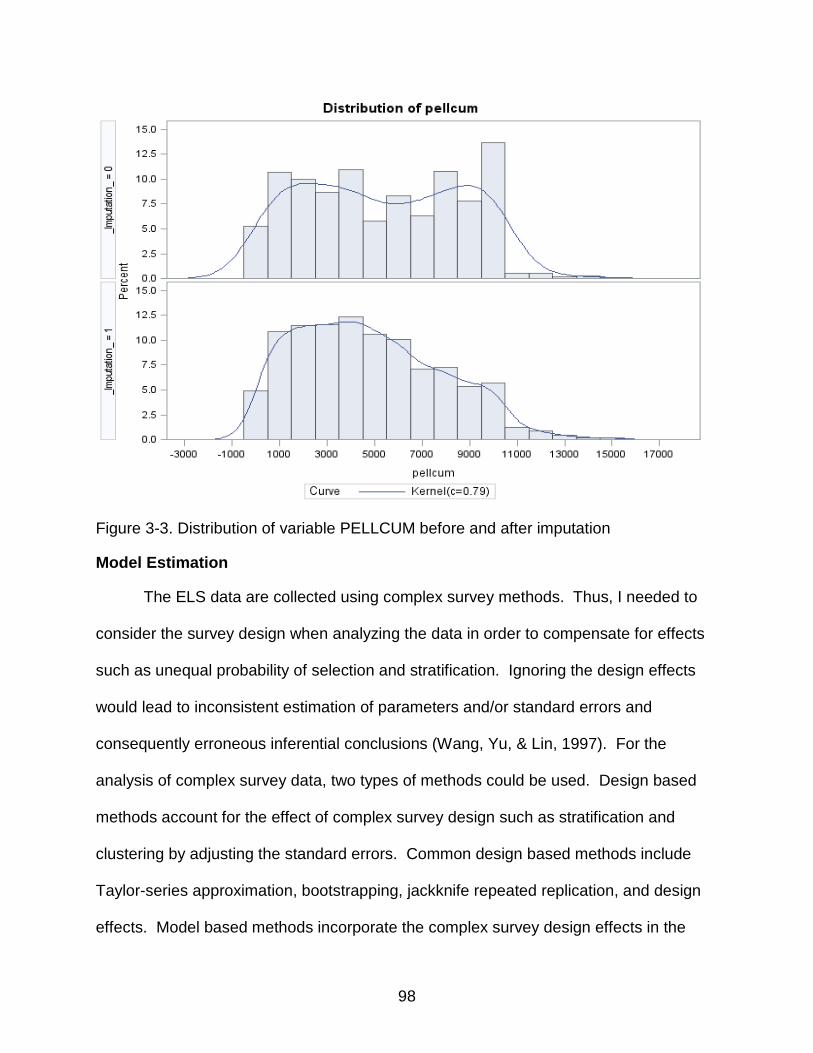
family SES were hypothesized to play a role in their major choice decisions. Figure 5-1
shows the hypothesized interaction of family SES and human capital investment
through higher education under the assumption of rational actors. Based on the
theoretical framework, which mainly takes an economic perspective, the following
hypotheses were proposed:
• Hypothesis 1: College students’ family SES is negatively correlated to enrolling in STEM majors, controlling for individual, pre-college, and college context factors.
• Hypothesis 2: Students’ college investment level is positively related to enrolling in STEM majors.
• Hypothesis 3: The scale and level of STEM major offerings at an institution are correlated to students’ decision of STEM major enrollment.
Figure 5-1. Hypothesized interaction between family SES and human capital investment
In the following subsections, I discuss whether the analyses findings support
these hypotheses and whether they are consistent with existing research literature.
130
Family SES and STEM Enrollment
When controlling for individual, pre-college, and college context factors, I
hypothesized that students’ family SES would be negatively correlated to enrolling in
STEM majors. Logistic regression analyses results show that when controlling for
individual, pre-college, and college context variables, the estimate of family SES is
negative (-0.11). However, the p-value is insignificant (0.16), suggesting that family
SES by itself is not significantly correlated with STEM enrollment for the whole sample.
Further analyses show that family SES interacts with several variables including gender,
race (Black), highest level of STEM degree at institution (Master’s), and SAT math
score.
The examination of the simple slope for family SES show interesting findings.
Although family SES is not significant for the whole sample, the results show that it is
significant for several subgroups and the direction of the correlation is different for
different subgroups. For some students whose SAT math score is low, the relationship
between family SES and STEM enrollment is negative, as hypothesized. For example,
for non-Black students with low SAT math score who attend institutions where the
highest level of STEM degree is either Bachelor’s, doctoral, or professional, family SES
is negatively related to STEM enrollment. When SAT math score is very low (two
standard deviations below the mean), for all male students except Black males
attending Master’s degree institutions, family SES is negatively related to STEM
enrollment. On the contrary, for students with high SAT math score, family SES is
positively related to STEM enrollment, which is the opposite of the hypothesis. For
example, when SAT math score is very high (two standard deviations above the mean),
family SES is positively related to STEM enrollment for all students except non-Black
131
students attending non-Master’s institutions. For female students, such association
holds when SAT math score is one standard deviation above the mean. Even when
SAT math score is only at the mean, Black female students’ family SES is still positively
related to their STEM enrollment.
While the trend does not hold for every subgroup of students, the results show
that for most students, when SAT math score falls below the mean, significant
correlation between family SES and STEM enrollment, if any, is negative. When SAT
math score is at the mean or above the mean, significant correlation between family
SES and STEM enrollment, if any, is positive. The only exception is for Black female
students attending Master’s institutions. Even when SAT math score is one standard
deviation below the mean, family SES is still positively related to STEM enrollment.
These findings suggest that family SES is related to STEM enrollment only for some
students. Among the students whose family SES does relate to STEM enrollment, the
direction of the correlation is negative mainly for those with low math preparation level
and positive mainly for those with average or high math preparation level. Regardless
of the direction of the correlation, the more extreme the SAT math score, the stronger
the association between family SES and STEM enrollment.
Ma (2009) concludes that students from lower SES families tend to choose major
fields that yield higher financial rewards upon college graduation, such as technical and
life/health sciences. Findings from this study show that negative correlation between
family SES and STEM enrollment does exist for some students. However, it is
necessary to examine this correlation more closely before concluding that lower SES
students prefer STEM majors more than their higher SES peers and that the
132
assumptions of this study are supported by empirical evidence. First, it should be
noticed that the negative correlation exists only for some subgroups of the students
rather than the whole sample. For example, for Black students attending Master’s
institutions, all significant correlations between family SES and STEM enrollment are
positive. For female students, negative correlation only exists for non-Black students
attending non-Master’s institutions.
Second, it should be noticed that lower SES students are more likely to choose
STEM majors than higher SES students only when the math preparation is poor. When
math preparation is average or high, all correlations are positive except for one. In
other words, for some students (for example, non-Black students attending non-
Master’s institutions) who are poor at math, those from higher SES families are less
likely to enroll in STEM majors while those from lower SES families are more likely to do
so. Also, for some students who are average or good at math, those from higher SES
families are more likely to enroll in STEM majors while those from lower SES families
are less likely to do so. If the assumptions of this study accurately explain students’
major choice, then empirical evidence should show that negative correlation between
family SES and STEM enrollment exists for the whole sample regardless of the level of
math preparation. The opposite directions of the correlations for students with different
math preparation suggest that students’ behavior is not in accordance with the
hypotheses.
Why does this happen? When examining the correlation between math
preparation level and STEM education in college, it can be seen that math preparation
is one of the most important predictors of STEM enrollment and retention. Students
133
with higher math preparation level have higher chance of succeeding in STEM majors
while those with poor math preparation are more likely to leave STEM fields (Seymour &
Hewitt, 1997). Choosing a major that matches one’s academic preparation will increase
one’s probability of succeeding in college. Therefore, an informed decision regarding
STEM enrollment should be based on one’s math preparation among other factors. In
other words, if a student chooses STEM major despite very low math preparation level,
it should be questioned whether his or her decision is a sound one in terms of the
chance to succeed.
Knowing that STEM enrollment decision should be based partly on one’s math
achievement level, the face value of the negative correlations detected from the
analyses is questioned. Is the negative association the result of students’ economic
and human capital concerns, or is it rather the result of uninformed decision making? If
the former holds, then the positive correlation between family SES and STEM
enrollment among high math achievement students cannot be explained. The latter, on
the other hand, is in accordance with the observed trends. Higher SES students know
better when to choose STEM majors (when their math level is high) and when to avoid
them (when math level is low), while lower SES students do not. Literature has shown
that family SES influences students’ navigation through the higher education system
and their chance to succeed in college (McDonough, 1997). In terms of STEM
enrollment, the influence of family SES on students’ knowledge of the system and skills
of information collection and decision making seem to affect students’ STEM decision
as well. One possible explanation for the observed correlations is that students from
lower SES families lack knowledge about STEM majors, about the demanding nature of
134
study in STEM, and the potential career perspectives in STEM fields. As a result, lower
SES students may choose STEM majors without measuring their chance of success, or
ignore STEM majors without even knowing what STEM majors have to offer upon
graduation. In sum, the results appear to be partially consistent with existing findings
and the first hypothesis seems to be partially supported. However, after examining the
findings closer, it can be seen that the first hypothesis is in fact not supported and the
results are inconsistent with existing findings (Ma, 2009).
College Investment Level and STEM Enrollment
The second hypothesis stated that students’ college investment level is positively
related to STEM enrollment. College investment level was measured by the total cost
of attendance for each student. The reasoning behind this hypothesis was again based
on the framework of human capital investment. Since students were assumed to be
rational actors, it was assumed that the higher the cost of college attendance, the more
students will take into consideration the potential financial reward of college education
and as a result, prefer study areas with better career perspectives such as STEM
majors. Results show that the total cost of college attendance is, however, negatively
correlated to STEM enrollment probability. This suggests that the higher the cost of
attending college, the lower the probability of choosing STEM majors.
Research has revealed that the expected earning is significantly correlated to
students’ major choice in college (Montmarquette, Cannings, & Mahseredjian, 2002).
However, not much research has examined the association between college cost and
major choice. Shin and Milton (2008) conclude that students’ enrollment in college is
correlated to tuition level and the correlation differs by discipline. Their findings show
that tuition level is negatively correlated to enrollment in physics, biology, and business
135
and tuition level is not correlated to enrollment in engineering. This study’s finding of
negative correlation between total cost and STEM enrollment is partly inconsistent with
Shin and Milton’s (2008) findings. However, it is noteworthy that in Shin and Milton’s
(2008) study, the analyses focus on the institutional level rather than on the individual
level. As a result, individual characteristics are not controlled in their study. St. John
(1994b) concludes that debt burden is not significantly associated with major choice in
college, implying that college investment that exceeds students’ financial means does
not influence the choice of study field in college. In other words, paying a price that is
not easily affordable for college does not significantly influence students’ decision about
college major. The finding of negative correlation from this study is again inconsistent
with the finding by St. John (1994b).
While it is not clear why college cost is negatively correlated with STEM
enrollment, we can see that the second hypothesis is not supported by the findings.
One possible explanation is that the measurement of college investment level is not
ideal in this study. Due to the lack of continuous variable of family income and the high
missing rate of financial aid and debt variables, it is impossible to calculate college
investment level as the ratio of actual cost of college to one’s family income. While
such calculation would have revealed more information about the difficulty level of
paying for college, the measurement used in this study only reveals the sticker price of
college. This limitation may have masked the correlation between college investment
and STEM enrollment.
Given the above consideration, perhaps the main reason for the disagreement
between the second hypothesis and the finding is that the assumptions of this study are
136
not supported by the findings. If economic considerations are not the main factors
influencing informed decision making regarding STEM enrollment, the proposed
correlation between college investment and STEM enrollment will not hold either. As a
result, it is not surprising to see that college cost is not positively related to STEM
enrollment probability. In other words, the first two hypotheses are based on the same
reasoning, which assumes that students make informed decisions of college major by
prioritizing economic considerations. The disagreement of the second hypotheses and
the finding reaffirms that the proposed assumptions do not hold.
STEM Offering and STEM Enrollment
The third hypothesis stated that the scale and level of STEM major offerings at
an institution are correlated to students’ decision of STEM enrollment. Results show
that graduate enrollment in STEM majors is positively correlated with STEM enrollment
probability. The level of the highest degree conferred at an institution in STEM
(Master’s) interacts with family SES in its correlation with STEM enrollment. While the
hypothesis appears to be supported by the findings, the interpretation of the observed
correlations is not obvious. One possible explanation of the correlation between
graduate STEM enrollment and undergraduate STEM enrollment probability is the
increased exposure to STEM fields. Students at institutions where graduate STEM
enrollment is large may be exposed more to STEM fields through interaction with STEM
faculty members and students. They may also have access to more information about
STEM fields through campus news, personal contact, and/or academic counseling
services. Institutions with large graduate enrollment in STEM fields may also have
campus culture of pursuing STEM studies and good academic reputation of STEM
137
fields. Being exposed to people and news in STEM fields may help students gain better
understanding of STEM programs and career prospective.
The competing explanation for this correlation is that students who are more
likely to enroll in STEM majors choose to enroll at institutions with large STEM offerings.
Research has shown that many students choose a certain college because they find it
to be a good place to pursue the major field they are interested in (Cabrera & La Nasa,
2000; Hossler, Schmit, & Vesper, 1999; Maltese & Tai, 2011; Martin & Dixon, 1991).
Since this study is correlational rather than causal, a simple interpretation of the
correlation between graduate STEM enrollment and undergraduate STEM enrollment
probability cannot be reached. A causal research design or a qualitative study would be
more likely to shed light on this aspect.
Little research has been conducted on the correlation between STEM offering
level of institution and students’ probability of STEM enrollment. Results of this study
show that when enrolling at institutions where Master’s degree is the highest STEM
degree conferred, students from lower SES families are less likely to choose STEM
majors compared to those enrolling at institutions where Bachelor’s degree is the
highest STEM degree conferred. This may be the result of characteristics of Master’s
institutions, or the result of choosing college for major. In other words, students from
lower SES families may tend to choose Master’s institutions for non-STEM majors.
Again, causal research design or qualitative study on this topic may reveal the
mechanism behind the observed decision making behaviors.
138
Predictors of STEM Enrollment and Insignificant Variables
Predictors
In addition to the main findings discussed above, the analyses results also
revealed several other predictors of STEM enrollment. Percentage of free/reduced-
price lunch program participation at the high school one attended is one of the variables
that are significantly correlated to STEM enrollment probability. The positive correlation
suggests that other factors being held equal, students whose high schools have higher
percentage of students receiving free/reduced-price lunch are more likely to choose
STEM majors in college. Percentage of free/reduced-price lunch program participation
is an important measurement of school’s SES composition, which is defined as the
aggregate of the individual students’ family SES (Cowan et al., 2012). This finding
suggests that other factors being equal, students who come from lower SES high
schools are more likely to choose STEM major in college than those who attended
higher SES high schools.
In the American K-12 education system, students typically attend schools in their
neighborhood while schools are largely funded locally (U.S. Department of Education,
2005). Consequently, schools in lower SES neighborhood tend to be underfunded and
their educational quality tends to be lower than schools in more affluent neighborhoods
(Cunningham & Sanzo, 2002). In this sense, the quality of the schools students attend
depend on the neighborhood SES. In general, the lower the neighborhood SES, the
lower is the quality of its schools (Mackenzie, 2010). Low SES students tend to attend
high schools in low SES neighborhoods, receive lower quality teaching and student
services, and have fewer chance of being successful academically (Cowan et al., 2012;
Darling-Hammond, 2004).
139
The positive correlation between percentage of free/reduced-price lunch
participation at high school and STEM enrollment suggests that students from
disadvantaged educational background tend to prefer STEM majors more than their
counterparts from advantaged educational background. One possible explanation is
that for students who attend lower SES high schools to achieve the same academic
level as their counterparts who attend higher SES high schools, more efforts from the
students are needed in order to overcome the disadvantage of lower quality teaching
and other educational components (Wyner, Bridgeland, & DiIulio, 2007). Therefore,
students who do achieve the same academic preparation level despite the
disadvantage of attending lower quality high schools may have compensated for the
disadvantage through desirable personal characteristics. Students' compensatory
efforts might have been the result of high motivation for academic success, good study
skills and/or cognitive skills, high self-efficacy in study, and good self-regulation. These
factors have been identified as important predictors of better academic performance
2001). The quality of teaching and academic counseling services of the schools
students attend is likely to impact their skills of information collection, interpretation of
own strengths and weaknesses, and educational decision making (McDonough, 2005).
The results of this study show that while family SES matters in STEM decision making,
it is not functioning through the economic mechanism. Rather, it may be functioning
through the less easily measureable social and cultural resources decided by parents’
education and occupation, the neighborhood SES, and school SES.
Implications
In this section, I discuss the implications of the findings of this study for practice
and future research. Although this study is not causal, the findings reveal important
150
correlations between individual, pre-college, and institutional characteristics and STEM
enrollment in college. Student decision making is a complex process, which is a result
of impacts from all aspects of the living and learning environment. In this sense, STEM
decisions are made by all actors in students’ lives, including parents, family members,
teachers, peers, college administrators, and education policy makers. Promoting STEM
enrollment in college is unlikely to be a solo task completed by students themselves.
Implications for Practice
Findings of this study have several implications for practice both in high school
and in college. The finding that lower SES students tend to make STEM decisions that
do not align with their academic preparation level suggests that efforts should be made
to help these students make decisions that maximize their opportunity to succeed in
college. The first recommendation is that parents of all social classes be given
guidance on interaction modes with children. The second recommendation is that
college recruitment teams should collaborate with high schools in providing lower SES
students with more information about STEM majors. The third recommendation
suggests that colleges take steps to recruit their lower SES students for STEM majors.
Guidance for parents
The findings suggest that students who receive special privilege for good grades
are less likely to choose STEM majors. Although this issue is specific to the dynamic of
family interactions, school educators can in fact play a role in improving the way parents
involve in students’ academic performance. Researchers have argued that parental
involvement is to certain extent shaped by the school context (Rowan-Kenyon, Bell, &
Perna, 2008). School teachers could provide parents with suggestions on how to
effectively promote students’ academic performance and encourage them to strengthen
151
students' intrinsic rather than extrinsic motivation . While many parents expect good
performance from their children, they may not understand that rewarding for good
grades could lead to undesirable side effects such as reduced intrinsic interest in study
(Gneezy, Meier, & Rey-Biel, 2011). Through communication with parents, school
teachers could help parents develop better skills of parent children interaction. This is
not limited to high school teachers, since good interaction mode between parents and
children should be established as early as possible (Spera, 2005).
Guidance for high school students
The findings of this study suggest that lower SES students may lack
understanding of the nature of STEM majors, STEM career perspectives, and how to
prepare themselves for college study in these fields. Collaboration between college
recruitment and high school could provide students, especially lower SES students, with
information about STEM majors. College knowledge is crucial for students to gain
access to higher education (McDonough, 2005). Preparation for college is mainly done
in high school, where students develop aspirations, prepare academically, and take
steps to apply for college admission (Carnevale & Desrochers, 2003). Providing
students with proper college counseling could be a deciding factor for students’ pathway
to higher education, especially for lower SES students, whose family and living
environment may not be able to provide sufficient information and guidance in this
aspect (Hossler, Schmit, & Vesper, 1999). Since college counseling service at lower
SES high schools tend to be insufficient (McDonough, 2005), outreach efforts made by
colleges could be helpful in providing disadvantaged students with the information and
guidance they need. Collaboration between college and high school, for example the
distribution of college admission information, financial aid opportunities, and college
152
programs could be accomplished under the lead of colleges, where resources are more
available. Focus of such collaboration could be placed on high schools in lower SES
neighborhoods in order to utilize resources in the most efficient way.
Guidance for college students
Once students are enrolled in college, academic counselors could provide lower
SES students with special services to help them explore STEM study possibilities. One
successful example of promoting lower SES students’ performance and persistence in
STEM fields is UCLA’s Program for Excellence in Education and Research in the
Sciences (PEERS). In this program, the institution identifies lower SES students once
they are admitted, and selects certain students to participate in a program that provides
support for them to persist in STEM fields. Results show that lower SES students who
participate in this program are more likely to persist in STEM fields than those who do
not participate (Toven-Lindsey, Hasson, & Levis-Fitzgerald, 2013). Similar programs
developed by the institutions could help recruit more qualified lower SES students who
are not predetermined about their study fields. Such programs could help lower SES
students interpret their educational needs and academic preparation before choosing
major. For those who are academically well-prepared for STEM fields but are not sure
what study to pursue, freshman academic counseling program designed specifically for
lower SES students could help students explore various majors and find a good fit. For
those who are interested in pursuing STEM studies but lack proper academic
preparation, such programs could either provide students with guidance on how to
maximize the chance of succeeding in STEM, or point them to another study path that
best suits their academic level and education needs.
153
In order for such programs to be successful, college academic counselors need
to understand the educational background, needs, and expectations of lower SES
students. Conducting freshman survey could provide relevant information in this aspect
and provide counselors with a greater clarity regarding their lower SES students.
Implications for Future Research
While this study reveals many interesting findings regarding college students’
decisions of STEM majors, it must be noticed that correlations do not reveal causal
effects or explain why the observed behaviors happen. The findings of this study
suggest further research from various perspectives on the topic of STEM education in
college. These include qualitative research on the mechanism of STEM major choice,
causal research design, the mechanism of how family SES influences STEM enrollment,
and comparison of enrollment in STEM and other majors.
Qualitative research and causal research design
This study used quantitative methods to summarize large amount of data and
find the underlying trend of STEM enrollment. While it does reveal important findings,
many questions remain unanswered. Why are students who attend more expensive
colleges less likely to choose STEM majors? Why do higher SES students with high
math preparation level prefer STEM majors? To answer these questions, qualitative
research is needed.
Quantitative research emphasizes experimental examination or measurement in
terms of quantity (Denzin & Lincoln, 2000). It does not examine process or experiences
directly, but seek to find out relationship between variables by summarizing large
number of cases. Because quantitative research does not address social constraints
directly, it loses the richness and depth of study participants’ personal experiences and
154
perspectives (Newman & Benz, 1998). As a result, quantitative research does not
reveal detailed explanations of social interaction. On the topic of college major choice,
quantitative research shows what decisions are made, but does not reveal why such
decisions are made.
Qualitative research, on the other hand, addresses personal experiences and
interactions. Patton (1990) defines qualitative data as detailed description of behaviors,
events, interactions, and quotations from people about their personal experiences,
beliefs, perspectives, and attitudes, as well as excerpts from documents and records.
Qualitative research emphasizes meaning, process, and description (Denzin & Lincoln,
2000). Due to its descriptive nature, qualitative research is able to record detailed
personal experiences, perspectives, and thoughts. It can also directly examine the
complexity of social life. As Becker (1996) points out, qualitative researchers are more
interested in understanding individual cases and how general laws and statements are
reflected in each case. In educational research, these characteristics make qualitative
research suitable for answering questions of “how” and “why”. To understand the
mechanisms of STEM decision making, qualitative research is necessary. Case study,
for example, could reveal how and why a student makes his/her STEM decision. While
the findings will not be generalizable, they will provide valuable information for
educators and policy makers to improve practice and policy making.
Similar to qualitative research, causal research design is another methodological
necessity in the research of STEM decision making and college major choice.
Correlational studies only show associations between variables, but do not reveal
causal relationship (Guo & Fraser, 2010). To understand which predictors of STEM
155
enrollment are deciding factors, research such as quasi-experimental study or structural
equation modeling design are needed (Guo & Fraser, 2010; Kline, 2011). As discussed
earlier, although the findings suggest that college selectivity is correlated to STEM
enrollment, since the research is correlational rather than causal, it is not clear whether
the correlation is due to institutional characteristics, or due to students’ interest in
certain majors that is formed before they enter college. To fully understand how major
decisions are made, research designs that reveal causal relationships are necessary.
Impact of family SES on STEM education
The findings of this study suggest that family SES does matter in STEM
enrollment in college, but not through the economic perspective as assumed. Further
research is needed to explore which component(s) of family SES systematically
influence students’ STEM decision making and how the mechanism functions. Without
better understanding of how family SES influences educational decision making, the
efforts to compensate for low SES through targeted academic programs by both high
schools and colleges will not be effective. Concepts including social capital and cultural
capital may be useful in this line of research (Dumais, 2002; Portes, 1998; Sullivan,
2001). While the findings of this study show that economic concerns are not the
deciding factors of STEM enrollment, further research is needed to better understand
the role played by financial factors in STEM education.
Comparison of Enrollment of STEM and Other Majors
This study examines whether students’ family SES is systematically related to
STEM enrollment in college. While results suggest that economic concern is not the
deciding factor in students’ decision making, further investigation is needed to reveal the
role played by financial factors in general college major choice. For this purpose,
156
comparison of the enrollment preference in STEM and other majors will be necessary.
Such research will reveal the role played by financial factors, whether interest in STEM
majors is the main reason for enrollment, and how students compare STEM majors to
other majors with comparable financial rewards.
Conclusion
Promoting STEM enrollment and success is a national mission. This study used
a national representative sample of high school students to examine whether family
SES is systematically related to students’ STEM enrollment in college. Findings
suggest that lower SES students are disadvantaged in STEM education, even after
controlling for academic preparation. This is reflected in the fact that lower SES
students’ STEM decisions tend to be less aligned with their academic preparation level
than those of higher SES students. This may lead to lower chance of success in STEM
for lower SES students, which turns into persistence issue. One widely cited
explanation of why disadvantaged students are underrepresented in STEM fields is that
due to the demanding study requirements of these majors, students from disadvantaged
educational background tend to lack the necessary academic preparation to enroll in
STEM fields. The findings of this study show that even when academic preparation
level is held equal, lower SES students are still less likely to choose STEM majors in
college even when they do have good chance of being successful. Policy makers and
educators at both the K-12 and higher education level should be alerted by the fact that
STEM fields are losing talent from lower SES background. This is especially relevant
given the fact that lower SES students may benefit more from STEM education than
higher SES students (Brand & Xie, 2010). Policy makers should also pay attention to
157
the fact that the social and economic stratifications among student groups are being
reinforced through the enrollment in STEM majors in college.
While it is discouraging to see that lower SES students are disadvantaged in
STEM education, the findings do reveal some encouraging trends regarding
underrepresented student groups. Black students, although overall underrepresented in
the higher education system (Kim, 2011), are found to be more likely to choose STEM
majors in college when other factors are equal. Other minority groups are not less likely
to enroll in STEM majors than white students, when other factors are equal. This
means that the current gap between racial groups in STEM education is not due to
differences in students’ preference by racial group. Rather, the question should be how
to help underrepresented minority students reach academic status comparable to white
students.
Although family SES by itself is not significantly correlated to STEM enrollment, it
should be noticed that it does act as a mediating force for factors that are significantly
related to STEM enrollment. For factors that lower the STEM enrollment likelihood,
family SES reduces the magnitude of the negative correlation. For example, although
females are less likely than males to choose STEM majors, the gender gap is smaller
among high SES students than among low SES students. For factors that increase the
likelihood of STEM enrollment, family SES strengthens the positive correlation. For
example, while higher math score is related to higher likelihood of STEM enrollment, the
likelihood is even higher among high SES students. In other words, higher family SES
makes students advantaged in STEM education.
158
The findings of this study reveal several important trends in STEM enrollment in
college. It should also be noticed that many questions on this topic still warrant further
research. For example, what are the deciding factors for higher SES students to prefer
STEM majors when academic preparation level is above average? What make STEM
majors attractive for them? Do students from different family SES background choose
STEM majors for the same reason(s)? Answers to these questions will be the key to
promote access to and success in STEM education for the increasingly diverse student
body.
159
APPENDIX STEM CATEGORIZATION AND MAJOR FIELDS OF STUDY
Table A-1. STEM categorization and major fields of study STEM Categorization Major Field of Study CIP Major List
Mathematics Mathematics and statistics - Mathematics; - Applied Mathematics; - Statistics; - Mathematics and Statistics, Other;
Natural sciences Agriculture, agriculture
operations, and related sciences
- Agriculture, General; - Agricultural Business and Management; - Agricultural Mechanization; - Agricultural Production Operations; - Agricultural and Food Products Processing; - Agricultural and Domestic Animal Services; - Applied Horticulture and Horticultural Business Services; - International Agriculture; - Agricultural Public Services; - Animal Sciences; - Food Science and Technology; - Plant Sciences; - Soil Sciences; - Agriculture, Agriculture Operations, and Related Sciences, Other;
Natural resources and
conservation
- Natural Resources Conservation and Research; - Natural Resources Management and Policy; - Fishing and Fisheries Sciences and Management; - Forestry; - Wildlife and Wildlands Science and Management; - Natural Resources and Conservation, Other;
160
Table A-1. Continued STEM Categorization Major Field of Study CIP Major List
Biological and biomedical sciences
- Biology, General; - Biochemistry, Biophysics and Molecular Biology; - Botany/Plant Biology; - Cell/Cellular Biology and Anatomical Sciences; - Microbiological Sciences and Immunology; - Zoology/Animal Biology; - Genetics; - Physiology, Pathology and Related Sciences; - Pharmacology and Toxicology; - Biomathematics, Bioinformatics, and Computational Biology; - Biotechnology; - Ecology, Evolution, Systematics, and Population Biology; - Molecular Medicine; - Neurobiology and Neurosciences; - Biological and Biomedical Sciences, Other;
Physical sciences - Physical Sciences;
- Astronomy and Astrophysics; - Atmospheric Sciences and Meteorology; - Chemistry; - Geological and Earth Sciences/Geosciences; - Physics; - Materials Sciences; - Physical Sciences, Other;
Table A-1. Continued STEM Categorization Major Field of Study CIP Major List
Engineering and engineering technologies
Engineering - Engineering, General; - Aerospace, Aeronautical and Astronautical Engineering; - Agricultural Engineering; - Architectural Engineering; - Biomedical/Medical Engineering; - Ceramic Sciences and Engineering; - Chemical Engineering; - Civil Engineering; - Computer Engineering; - Electrical, Electronics and Communications Engineering; - Engineering Mechanics; - Engineering Physics; - Engineering Science; - Environmental/Environmental Health Engineering; - Materials Engineering - Mechanical Engineering; - Metallurgical Engineering; - Mining and Mineral Engineering; - Naval Architecture and Marine Engineering; - Nuclear Engineering; - Ocean Engineering; - Petroleum Engineering; - Systems Engineering; - Textile Sciences and Engineering; - Polymer/Plastics Engineering; - Construction Engineering; - Forest Engineering; - Industrial Engineering; - Manufacturing Engineering; - Operations Research; - Surveying Engineering;
162
Table A-1. Continued STEM Categorization Major Field of Study CIP Major List
Engineering and engineering technologies
Engineering - Geological/Geophysical Engineering; - Paper Science and Engineering; - Electromechanical Engineering; - Mechatronics, Robotics, and Automation Engineering; - Biochemical Engineering; - Engineering Chemistry; - Biological/Biosystems Engineering; - Engineering, Other;
Engineering technologies
and engineering-related fields
- Engineering Technology, General; - Architectural Engineering Technologies/Technicians; - Civil Engineering Technologies/Technicians; - Electrical Engineering Technologies/Technicians; - Electromechanical Instrumentation and Maintenance Technologies/Technicians; - Environmental Control Technologies/Technicians; - Industrial Production Technologies/Technicians; - Quality Control and Safety Technologies/Technicians; - Mechanical Engineering Related Technologies/Technicians; - Mining and Petroleum Technologies/Technicians; - Construction Engineering Technologies; - Engineering-Related Technologies; - Computer Engineering Technologies/Technicians; - Drafting/Design Engineering Technologies/Technicians; - Nuclear Engineering Technologies/Technicians; - Engineering-Related Fields; - Nanotechnology; - Engineering Technologies/Technicians, Other;
163
Table A-1. Continued STEM Categorization Major Field of Study CIP Major List
Computer and information sciences
Computer and information sciences and support services
- Computer and Information Sciences, General; - Computer Programming; - Data Processing; - Information Science/Studies; - Computer Systems Analysis; - Data Entry/Microcomputer Applications; - Computer Science; - Computer Software and Media Applications; - Computer Systems Networking and Telecommunications; - Computer/Information Technology Administration and Management; - Computer and Information Sciences and Support Services, Other;
164
LIST OF REFERENCES
Agresti, A., & Finlay, B. (2009). Statistical methods for the social sciences. Upper Saddle River, NJ: Pearson Education.
Alexander, K. L., Entwisle, D. R., & Bedinger, S. D. (1994). When expectations work:
Race and socioeconomic differences in school performance. Social Psychology Quarterly, 57(4), 283-299.
Alexander, F. K., Harnisch, T., Hurley, D., & Moran, R. (2010). Maintenance of effort: An
evolving federal-state policy approach to ensuring college affordability. Journal of Education Finance, 36(1), 76-87.
Allison, P. D. (1999). Logistic regression using SAS: Theory and application. Cary, NC:
SAS Institute Inc. Allison, P. D. (2002). Missing data. Thousand Oaks, CA: SAGE. Anderson, M., & Hearn, J. (1992). Equity issues in higher education outcomes. In W.
Becker & D. Lewis (Eds.), The economics of American higher education (pp. 301-334). Boston: Kluwer.
Anderson, E. L., & Kim, D. (2006). Increasing the success of minority students in
science and technology. Washington, D.C.: American Council on Education. Angle, J., & Wissmann, D. A. (1981). Gender, college major, and earnings. Sociology of
Education, 54, 25-33. Arcidiacono, P. (2004). Ability sorting and the returns to college major. Journal of
Econometrics, 121, 343-375. Arcidiacono, P., Hotz, V. J., & Kang, S. (2012). Modeling college major choices using
elicited measures of expectations and counterfactuals. Journal of Econometrics, 166, 3-16.
Ashworth, J., & Evans, J. L. (2001). Modeling student subject choice at secondary and
tertiary level: A cross-section study. Journal of Economic Education, 32(4), 311-320.
Baum, S., Ma, J., & Payea, K. (2010). Education pays 2010: The benefits of higher
education for individuals and society. New York: The College Board. Becker, G. S. (1993). Human capital: A theoretical and empirical analysis, with special
reference to education. Chicago, IL: The University of Chicago Press.
165
Becker, H. S. (1996). Epistemology of Qualitative Research. In R. Jessor, A. Colby, & R. A. Shweder (Eds.), Ethnography and human development: Context and meaning in social inquiry (pp. 53-72). Chicago: University of Chicago Press.
Becker, W. E. (1992). Why go to college? The value of an investment in higher
education. In W. Becker & D. Lewis (Eds.), The economics of American higher education (pp. 91-120). Boston: Kluwer.
Bedard, K., & Herman, D. A. (2008). Who goes to graduate/professional school? The
importance of economic fluctuations, undergraduate field, and ability. Economics of Education Review, 27, 197-210.
Beecher, M., & Fischer, L. (1999). High school courses and scores as predictors of
college success. Journal of College Admission, 163, 4-10. Beede, D., Julian, T., Langdon, D., McKittrick, G., Khan, B., & Doms, M. (2011). Women
in STEM: A gender gap to innovation. Washington, D.C.: U.S. Department of Commerce.
Beekhoven, S., de Jong, U., & van Hout, H. (2002). Explaining academic progress via
combining concepts of integration theory and rational choice theory. Research in Higher Education, 43(5), 577-600.
Berger, M. C. (1988). Predicted future earnings and choice of college major. Industrial
and Labor Relations Review, 41(3), 418-429. Berger, M. C. (1992). Private returns to specific college majors. In W. Becker & D. Lewis
(Eds.), The economics of American higher education (pp. 141-171). Boston: Kluwer.
Berkowitz, D., & Hoekstra, M. (2011). Does high school quality matter? Evidence from
admissions data. Economics of Education Review, 30, 280-288. doi:10.1016/j.econedurev.2010.10.001
Betz, N. E. & Hackett, G. (1983). The relationship of mathematics self-efficacy
expectations to the selection of science-based college majors. Journal of Vocational Behavior, 23, 329-345.
Black, D. A., Sanders, S., & Taylor, L. (2003). The economic reward for studying
economics. Economic Inquiry, 41(3), 365-377. Blau, P. M., & Duncan, O. D. (1967). The American occupational structure. New York:
John Wiley & Sons.
166
Borges, N. J., Savickas, M. L., & Jones, B. J. (2004). Holland’s theory applied to medical specialty choice. Journal of Career Assessment, 12(2), 188-206. doi: 10.1177/1069072703257755
Brackney, K. S. (1993). A follow-up study investigating the relationships between
Holland’s personality types and selected career choice variables (Doctoral dissertation). Retrieved from ProQuest Dissertations & Theses database. (ProQuest document ID: 9319028)
Bradley, R. H., & Corwyn, R. F. (2002). Socioeconomic status and child development.
Annual Review of Psychology, 53(1), 371-399. doi: 0084-6570/02/0201-0371 Brand, J. E., & Xie, Y. (2010). Who benefits most from college? Evidence for negative
selection in heterogeneous economic returns to higher education. American Sociological Review, 75(2), 273-302.
Braxton, J. M., & Hargens, L. L. (1996). Variation among academic disciplines:
Analytical frameworks and research. In J. C. Smart (Ed.), Higher education: Handbook of theory and research (pp. 1-46). New York: Agathon Press.
Bucher, R. (1979). Social structural constraints in career decision making occupational
hurdles. In A. M. Mitchell, G. B. Jones, & J. D. Krumboltz (Eds.), Social learning and career decision making (pp. 116-133). Cranston, RI: Carroll Press.
Cabrera, A. F., & La Nasa, S. M. (2000). Understanding the college-choice process.
New Directions for Institutional Research, 27(3), 5-22. Cameron, J., & Pierce, W. D. (1994). Reinforcement, reward, and intrinsic motivation: A
meta-analysis. Review of Educational Research, 64(3), 363-423. Carnevale, A. P., & Desrochers, D. M. (2003). Standards for what? The economic roots
of K-16 reform. Princeton, NJ: Educational Testing Service. Carnevale, A. P., & Rose, S. J. (2004). Socioeconomic status, race/ethnicity, and
selective college admissions. In R. D. Kahlenberg (Ed.), America’ s untapped resource: Low-income students in higher education (pp. 101-156). New York: The Century Foundation Press.
Cates, J. T., & Schaefle, S. E. (2011). The relationship between a college preparation
program and at-risk students' college readiness. Journal of Latinos & Education, 10(4), 320-334.
Cebula, R. J., & Lopes, J. (1982). Determinants of student choice of undergraduate
major field. Educational Research, 19(2), 303-312.
167
Chapman, D. W. (1981). A model of student college choice. The Journal of Higher Education, 52(5), 490-505.
Chen, X., & Weko, T. (2009). Students who study science, technology, engineering, and
mathematics (STEM) in postsecondary education. Washington, D.C.: U.S. Department of Education.
Choi, K. H., Raley, R. K., Muller, C., & Riegle-Crumb, C. (2008). A longitudinal analysis
of contextual exposure to peers with college educated parents and students' college enrollment. Social Science Quarterly, 89(4), 846-866.
appropriateness ratings in cataract surgery. Yonsei Medical Journal, 45(5), 829-837.
Cohen, J., & Hanno, D. M. (1993). An analysis of underlying constructs affecting the
choice of accounting as a major. Issues in Accounting Education, 8(2), 219. Cole, D., & Espinoza, A. (2008). Examining the academic success of Latino students in
science technology engineering and mathematics (STEM) majors. Journal of College Student Development, 49(4), 285-300.
Cole, J. R., & Cole, S. (1973). Social stratification in science. Chicago: University of
Chicago Press. Committee on Equal Opportunities in Science and Engineering. (2004). Broadening
participation in America’s science and engineering workforce: The 1994–2003 decennial and 2004 biennial reports to congress. Arlington, VA: National Science Foundation.
Correll, S. J. (2001). Gender and the career choice process : The role of biased self-
assessments. American Journal of Sociology, 106(6), 1691-1730. Corrigan, M. E. (2003). Beyond access: Persistence challenges and the diversity of low-
income students. In J. E. King, E. L. Anderson, & M. E. Corrigan (Eds.), Changing student attendance patterns: Challenges for policy and practice (pp. 25-49). San Francisco: Jossey-Bass.
Cowan, C. D., Hauser, R. M., Kominski, R. A., Levin, H. M., Lucas, S. R., Morgan, S.
L., ... Chapman, C. (2012). Improving the measurement of socioeconomic status for the National Assessment of Educational Progress: A theoretical foundation. Washington, D.C.: National Center for Education Statistics.
Crane, J. (1996). Effects of home environment, SES, and maternal test scores on
mathematics achievement. The Journal of Educational Research, 89(5), 305-314.
168
Crisp, G., Nora, A., & Taggart, A. (2009). Student characteristics, pre-college, college, and environmental factors as predictors of majoring in and earning a STEM degree: An analysis of students attending a Hispanic serving institution. American Educational Research Journal, 46(4), 924-942.
Crosnoe, R. (2009). Low-income students and the socioeconomic composition of public
high schools. American Sociological Review, 74(5), 709-730. Cunningham, W. G., & Sanzo, T. D. (2002). Is high-stakes testing harming lower
socioeconomic status schools? NASSP Bulletin, 86, 62. doi: 10.1177/019263650208663106
Darling-Hammond, L. (2004). Inequality and the right to learn: Access to qualified
teachers in California's public schools. Teachers College Record, 106(10), 1936-1966.
Davis, K. D., Winsler, A., & Middleton, M. (2006). Students' perceptions of rewards for
academic performance by parents and teachers: Relations with achievement and motivation in college. Journal of Genetic Psychology, 167(2), 211-220.
Davies, S. & Guppy, N. (1997). Fields of study, college selectivity, and student
inequalities in higher education. Social Forces, 75(4), 1417-1438. Davis-Kean, P. E. (2005). The influence of parent education and family income on child
achievement: The indirect role of parental expectations and the home environment. Journal of Family Psychology, 19(2), 294-304.
Dawson-Threat, J., & Huba, M. E. (1996, April). Choice of major and clarity of purpose
among college seniors. Paper presented at the annual meeting of the American Educational Research Association, New York, NY.
Daymont, T. N., & Andrisani, P. J. (1984). Job preferences, college major, and the
gender gap in earnings. The Journal of Human Resources, 19(3), 408-428. DeBerard, M. S., Spielmans, G. I., & Julka, D. C. (2004). Predictors Of academic
achievement and retention among college freshmen: A longitudinal study. College Student Journal, 38(1), 66-80.
Deci, E. L., Koestner, R., & Ryan, R. M. (1999). A meta-analytic review of experiments
examining the effects of extrinsic rewards on intrinsic motivation. Psychological Bulletin, 125(6), 627-668.
De Graff, N. K., De Graaf, P. M., & Kraaykamp, G. (2000). Parental cultural capital and
educational attainment in the Netherlands: A refinement of the cultural capital perspective. Sociology of Education, 73(2), 92-111.
169
Dennis, J. M., Phinney, J. S., & Chuateco, L. I. (2005). The role of motivation, parental support, and peer support in the academic success of ethnic minority first-generation college students. Journal of College Student Development, 46(3), 223-236. doi: 10.1353/csd.2005.0023
Denzin, N. K., & Lincoln, Y. S. (2000). Introduction: The discipline and practice of
qualitative research. In N. K. Denzin & Y. S. Lincoln (Eds.), Handbook of qualitative research (pp. 1-28). Thousand Oaks, CA: SAGE.
Department of Labor. (2007). The STEM workforce challenge: The role of the public
workforce system in a national solution for a competitive Science, Technology, Engineering, and Mathematics (STEM) workforce. Washington, D.C.
Deresiewicz, W. (2008). The disadvantages of an elite education: Our best universities
have forgotten that the reason they exist is to make minds, not careers. American Scholar, 77(3), 20-31.
Desforges, C., & Abouchaar, A. (2003). The impact of parental involvement, parental
support and family education on pupil achievements and adjustment: A literature review. Nottingham, UK: DfES Publications.
DesJardins, S. L., Dundar, H., & Hendel, D. D. (1999). Modeling the college application
decision process in a land-grant university. Economics of Education Review, 18, 117-132.
DesJardins, S. L., & Toutkoushian, R. K. (2005). Are students really rational? The
development of rational thought and its application to student choice. In J. C. Smart (Ed.), Higher education: Handbook of theory and research (pp. 191-240). Dordrecht, Netherlands: Springer.
DeYoung, A. (1989). Economics and American education: A historical and critical
overview of the impact of economic theories on schooling in the United States. New York: Longman.
Dickson, L. (2010). Race and gender differences in college major choice. In M. C. Long,
M. Tienda, & P. Kaniss (Eds.), Beyond admissions: Re-thinking college opportunities and outcomes (pp. 108-124). Thousand Oaks, CA: SAGE.
Dresch, S. P. (1979). A quasi-economic view of the career formation process. In A. M.
Mitchell, G. B. Jones, & J. D. Krumboltz (Eds.), Social learning and career decision making (pp. 134-159). Cranston, RI: Carroll Press.
Dubow, E. F., Boxer, P., & Rowell, L. (2009). Long-term effects of parents' education on
children's educational and occupational success. Merrill-Palmer Quarterly, 55(3), 224-249.
170
Dumais, S. A. (2002). Cultural capital, gender, and school success: The role of habitus. Sociology of Education, 75(1), 44-68.
Dynan, K. E., & Rouse, C. E. (1997). The underrepresentation of women in economics:
A study of undergraduate economics students. The Journal of Economic Education, 28(4), 350-368.
Eagan, M. K., & Newman, C. B. (2010, May). Investing in human capital:
Underrepresented racial minorities' intentions to attend graduate school in STEM fields. Paper presented at the annual meeting of the American Educational Research Association, Denver, CO.
Easterlin, R. A. (1995). Preferences and prices in choice of career: The switch to
business, 1972-87. Journal of Economic Behavior and Organization, 27, 1-34. Eccles, J. S. (1994). Understanding women's educational and occupational choices:
Applying the Eccles et al. model of achievement-related choices. Psychology of Women Quarterly, 18, 585-609.
Eccles, J. S., & Jacobs, J. E. (1986). Social forces shape math attitudes and
performance. Signs, 11(2), 367-380. Economics and Statistics Administration. (2011). STEM: Good jobs now and for the
future. Washington, D.C.: U.S. Department of Commerce. Edwards, J. R. (2008). Person-environment fit in organizations: An assessment of
theoretical progress. In J. P. Walsh & A. P. Brief (Eds.), The Academy of Management Annals (pp. 167-230). Hillsdale, NJ: Erlbaum.
Eide, E. (1994). College major choice and changes in the gender wage gap.
Contemporary Economic Policy, 12(2), 55-64. Eide, E., & Waehrer, G. (1998). The role of the option value of college attendance in
college major choice. Economics of Education Review, 17(1), 73-82. Enders, C. K. (2010). Applied missing data analysis. New York: Guilford. Espinosa, L. L. (2009). Pipelines and pathways: Women of color in STEM majors and
the experiences that shape their persistence. (Doctoral dissertation). Retrieved from ProQuest Dissertations & Theses database. (ProQuest No. 3394926).
Espinosa, L. L. (2011). Women of color in STEM fields. Diverse Issues in Higher
Education, 28(16), 9-10.
171
Ethington, C. A., & Wolfle, L. M. (1988). Women's selection of quantitative undergraduate fields of study: Direct and indirect influences. American Educational Research Journal, 25(2), 157-175.
Farmer, H., Rotella, S., Anderson, C., & Wardrop, J. (1998). Gender differences in
science, math, and technology careers: Prestige level and Holland interest type. Journal of Vocational Behavior, 53, 73-96.
Federman, M. (2007). State graduation requirements, high school course taking, and
choosing a technical college major. The B.E. Journal of Economic Analysis & Policy, 7(1), 1-32.
Ferry, T. R., Fouad, N. A., & Smith, P. L. (2000). The role of family context in a social
cognitive model for career-related choice behavior: A math and science perspective. Journal of Vocational Behavior, 57, 348-364.
Fletcher, J., & Tienda, M. (2010). Race and ethnic differences in college achievement:
Does high school attended matter? The ANNALS of the American Academy of Political and Social Science, 627, 144-166. doi: 10.1177/0002716209348749
Flores, A. (2007). Examining disparities in mathematics education: Achievement gap or
opportunity gap? The High School Journal, 91(1), 29-42. Flores, L. Y., Robitschek, C., Celebi, E., Andersen, C., & Hoang, U. (2010). Social
cognitive influences on Mexican Americans’ career choices across Holland’s themes. Journal of Vocational Behavior, 76, 198-210.
Foster, M. A., Lambert, R., Abbott-Shim, M., McCarty, F., & Franze, S. (2005). A model
of home learning environment and social risk factors in relation to children's emergent literacy and social outcomes. Early Childhood Research Quarterly, 20(1), 13-36.
Frehill, L. M. (1997). Education and occupational sex segregation: The decision to major
in engineering. The Sociological Quarterly, 38(2), 225-249. Gabay-Egozi, L., Shavit, Y., & Yaish, M. (2010). Curricular choice: A test of a rational
choice model of education. European Sociological Review, 26(4), 447-463. Gamoran, A. (1987). The stratification of high school learning opportunities. Sociology
of Education, 60, 135-155. Gandara, P., Rumberger, R., Maxwell-Jolly, J., & Callahan, R. (2003). English learners
in California schools: Unequal resources, unequal outcomes. Education Policy Analysis Archives, 11(36), 36-90.
172
Geiger, M. A., & Ogilby, S. M. (2000). The first course in accounting: Students' perceptions and their effect on the decision to major in accounting. Journal of Accounting Education, 18, 63-78.
Ghoshl, S., & Pahwa, P. (2006, May). Design-based versus model-based methods: A
comparative study using longitudinal survey data. Paper presented at the Statistical Society of Canada annual meeting, London, Ontario, Canada.
Gladieux, L. E. (2004). Low-income students and the affordability of higher education. In
R. D. Kahlenberg (Ed.), America’ s untapped resource: Low-income students in higher education (pp. 17-57). New York: The Century Foundation Press.
Gliner, J. A., & Morgan, G. A. (2000). Research methods in applied settings: An
integrated approach to design and analysis. Mahwah, NJ: Lawrence Erlbaum Associates.
Gneezy, U., Meier, S., & Rey-Biel, P. (2011). When and why incentives (don't) work to
modify behavior. The Journal of Economic Perspective, 25(4), 191-209. Gorard, S., See, B. H., & Davies, P. (2012). The impact of attitudes and aspirations on
educational attainment and participation. York, U.K.: Joseph Rowntree Foundation.
Goyette, K. A., & Mullen, A. L. (2006). Who studies the arts and sciences? Social
background and the choice and consequences of undergraduate field of study. The Journal of Higher Education, 77(3), 497-538.
Greenberger, E., Lessard, J., Chen, C., & Farruggia, S. P. (2008). Self-entitled college
students: Contributions of personality, parenting, and motivational factors. Journal of Youth and Adolescence, 37(10), 1193-1204.
Griffith, A. L. (2010). Persistence of women and minorities in STEM field majors: Is it the
school that matters? Economics of Education Review, 29, 911-922. Gross, E. (1969). Change in technological and scientific developments and its impact
upon the occupational structure. In R. Perrucci & J. E. Gerstl (Eds.), The engineers and the social system (pp.17-50). New York: John Wiley & Sons.
Guo, S., & Fraser, M. W. (2010). Propensity score analysis: Statistical methods and
applications. Thousand Oaks, CA: SAGE. Hackett, G. (1985). Role of mathematics self-efficacy in the choice of math-related
majors of college women and men: A path analysis. Journal of Counseling Psychology, 32(1), 47-56.
173
Hackett, G. (1989). The relationship of role model influences to the career salience and educational and career plans of college women. Journal of Vocational Behavior, 35, 164-180.
Hansen, M. N. (2008). Rational action theory and educational attainment. Changes in
the impact of economic resources. European Sociological Review, 24(1), 1-17. doi:10.1093/esr/jcm029
Harackiewicz, J. M., Barron, K. E., Tauer, J. M., & Elliot, A. J. (2002). Predicting
success in college: A longitudinal study of achievement goals and ability measures as predictors of interest and performance from freshman year through graduation. Journal of Educational Psychology, 94(3), 562-575. doi: 10.1037/0022-0663.94.3.562
Harper, S. R. (2010). An anti-deficit achievement framework for research on students of
color in STEM. New Directions for Institutional Research, 148, 63-74. Hauser, R. M. (1993). Trends in college entry among Whites, Blacks, and Hispanics,
1972–1988. In C. T. Clotfelter & M. Rothschild (Eds.), Studies of Supply and Demand in Higher Education (pp. 61-120), Chicago: University of Chicago Press.
Hazari, Z., Sonnert, G., Sadler, P.M., & Shanahan, M. (2010). Connecting high school
physics experiences, outcome expectations, physics identity, and physics career choice: A gender study. Journal of Research in Science Teaching, 47(8), 978-1003.
Hearn, J. C. (1984). The relative roles of academic, ascribed, and socioeconomic
characteristics in college destinations. Sociology of Education, 57(1), 22-30. Hill, C., Corbett, C., & St. Rose, A. (2010). Why so few? Women in Science, Technology,
Engineering, and Mathematics. Washington, D.C.: The American Association of University Women.
Holland, J. L. (1966a). A psychological classification scheme for vocations and major
fields. Journal of Counseling Psychology, 13(3), 278-288. Holland, J. L. (1966b). The psychology of vocational choice: A theory of personality
types and model environments. Waltham, MA: Blaisdell. Holland, J. L. (1997). Making vocational choices: A theory of vocational personalities
and work environments. Odessa, FL: Psychological Assessment Resources. Horn, L., & Carroll, C. D. (2006). Placing college graduation rates in context: How 4-
year college graduate rates vary with selectivity and the size of low-income enrollment. Washington, D.C.: National Center for Education Statistics.
174
Horn, L. J., Chen, X., & Chapman, C. (2003). Getting ready to pay for college: What students and their parents know about the cost of college tuition and what they are doing to find out. Washington, D.C.: National Center for Education Statistics.
Hosmer, D. W., & Lemeshow, S. (1989). Applied logistic regression. New York: John
Wiley & Sons. Hossler, D., Schmit, J., & Vesper, N. (1999). Going to college: How social, economic,
and educational factors influence the decisions students make. Baltimore, MD: John Hopkins University Press.
House, J. D. (2000). Academic background and self-beliefs as predictors of student
grade performance in science, engineering and mathematics. International Journal of Instructional Media, 27(2), 207-220.
Huang, G., Taddese, N., Walter, E., & Peng, S. S. (2000). Entry and persistence of
women and minorities in college science and engineering education. Washington, D.C.: U. S. Department of Education.
Huang, Y., & Healy, C. C. (1997). The relations of Holland-typed majors to students’
freshman and senior work values. Research in Higher Education, 38(4), 455-477. Hull-Blanks, E., Kurpius, S. E. R., Befort, C., Sollenberger, S., Nicpon, M. F., & Huser, L.
(2005). Career goals and retention-related factors among college freshmen. Journal of Career Development, 32(1), 16-30.
Hurtado, S., Newman, C. B., Tran, M. C., & Chang, M. J. (2010). Improving the rate of
success for underrepresented racial minorities in STEM fields: Insights from a national project. New Directions for Institutional Research, 148, 5-15.
Ingels, S. J., Pratt, D. J., Wilson, D., Burns, L. J., Currivan, D., Rogers, J. E., &
Hubbard-Bednasz, S. (2007). Education Longitudinal Study of 2002: Base-year to second follow-up data file documentation (NCES2008-347). Washington, D.C.: National Center for Education Statistics.
Kahlenberg, R. D. (2004). Introduction. In R. D. Kahlenberg (Ed.), America’ s untapped
resource: Low-income students in higher education (pp. 1-16). New York: The Century Foundation Press.
Kamens, D. H. (1971). The college "charter" and college size: Effects on occupational
choice and college attrition. Sociology of Education, 44, 270-296. Karen, D. (2002). Changes in access to higher education in the United States: 1980-
1992. Sociology of Education, 75(3), 191-210.
175
Kelly, S. (2009). The black-white gap in mathematics course taking. Sociology of Education, 82, 47-69.
Kim, Y. M. (2011). Minorities in higher education: Twenty-fourth status report 2010,
2011 supplement. Washington, D.C.: American Council on Education. Kincheloe, J. L., & Steinberg, S. R. (2007). Cutting class: Socioeconomic status and
education. Lanham, MD: Rowman & Littlefield. Kinzie, J., Palmer, M., Hayek, J., Hossler, D., Jacob, S. A., & Cummings, H. (2004).
Fifty years of college choice: Social, political and institutional influences on the decision-making process. Indianapolis, IN: Lumina Foundation for Education.
Kirby, E., White, S., & Aruguete, M. (2007). Predictors of white and minority student
success at a private women's college. College Student Journal, 41(2), 460-465. Kitsantas, A., Winsler, A., & Huie, F. (2008). Self-regulation and ability predictors of
academic success during college: A predictive validity study. Journal of Advanced Academics, 20(1), 42-68.
Kline, R. B. (2011). Principles and practice of structural equation modeling. New York:
Guilford. Knowles, J. (1997, September). The influence of socio-economic status on aspirations
to enter higher education: School pupils' awareness, understanding and expectations of higher education. Paper presented at the British Educational Research Association annual conference, York, North Yorkshire, U.K.
Kurlaender, M. (2006). Choosing community college: Factors affecting Latino college
choice. New Directions for Community colleges, 133, 7-16. doi: 10.1002/cc.223 Langdon, D., McKittrick, G., Beede, D., Khan, B., & Doms, M. (2011). STEM: Good jobs
now and for the future. Washington, D.C.: U.S. Department of Commerce. Langelett, G. (2002). Human capital: A summary of the 20th century research. Journal
of Education Finance, 28, 1-24. Lee, E. S., & Forthofer, R. N. (2006). Analyzing complex survey data. Thousand Oaks,
CA: SAGE. Lee, J. B. (2002). An issue of equity. In D. E. Heller (Ed.), Condition of access: Higher
education for lower income students (pp. 25-41). Westport, CT: Praeger Publishers.
176
Lent, R. W., Lopez, F. G., & Bieschke, K. J. (1993). Predicting mathematics-related choice and success behaviors: Test of an expanded social cognitive model. Journal of Vocational Behavior, 42, 223-236.
Leong, F. T. L., Austin, J. T., Sekaran, U., & Komarraju, M. (1998). An evaluation of the
cross-cultural validity of Holland’s theory: Career choices by workers in India. Journal of Vocational Behavior, 52(3), 441-455.
Leppel, K., Williams, M. L., & Waldauer, C. (2001). The impact of parental occupation
and socioeconomic status on choice of college major. Journal of Family and Economic Issues, 22(4), 373-394.
Leslie, L., & Brinkman, P. (1988). The economic value of higher education. New York:
Macmillan. Leslie, L. L., Johnson, G. P., & Carlson, J. (1977). The impact of need-based student
aid upon the college attendance decision. Journal of Education Finance, 2, 269-285.
Li, Y., Alfeld, C., Kennedy, R. P., & Putallaz, M. (2009). Effects of summer academic
programs in middle school on high school test scores, course-taking, and college major. Journal of Advanced Academics, 20(3), 404-436.
Little, R. J. A., & Rubin, D. B. (2002).Statistical analysis with missing data. Hoboken, NJ:
Wiley. Lopez, G. R. (2001). The value of hard work: Lessons on parent involvement from an
(im)migrant household. Harvard Educational Review, 71(3), 416-437. Ma, Y. (2009). Family socioeconomic status, parental involvement, and college major
Mackenzie, J. (2010). Public school funding and performance (Working Paper).
Retrieved from http://www.udel.edu/johnmack/research/school_funding.pdf Malcom, L. E. (2010). Charting the pathways to STEM for Latina/o students: The role of
community college. New Directions for Institutional Research, 148, 29-40. Malcom, L. E., & Dowd, A. C. (2012). The impact of undergraduate debt on the
graduate school enrollment of STEM baccalaureates. The Review of Higher Education, 35(2), 265-305. doi: 10.1353/rhe.2012.0007
Malgwi, C. A., Howe, M. A., & Burnaby, P. A. (2005). Influences on students' choice of
college major. Journal of Education for Business, 80(5), 275-282.
177
Maltese, A. V., & Tai, R. H. (2011). Pipeline persistence: Examining the association of educational experiences with earned degrees in STEM among U.S. students. Science Education, 95, 877-907. doi: 10.1002/sce.20441
Manski, C. F., & Wise, D. A. (1983). College choice in America. Cambridge, MA:
Harvard University Press. Maple, S. A., & Stage, F. K. (1991). Influences on the choice of math/science major by
gender and ethnicity. American Educational Research Journal, 28(1), 37-60. Marlowe, D., & Crowne, D. P. (1961). Social desirability and response to perceived
situational demands. Journal of Consulting Psychology, 25(2), 109-115. Martin, N. K., & Dixon, P. N. (1991). Factors influencing students' college choice.
Journal of College Student Development, 32, 253-257. Mason, A., & Monk-Turner, E. (2010). Factors shaping the decision of college students
to walk or drive under the influence of alcohol: A test of rational choice theory. Drugs: Education, Prevention and Policy, 17(5), 560-572.
Mattila, J. P. (1982). Determinants of male school enrollments: A time series analysis.
Review of Economics and Statistics, 64, 242-251. Mayer, D. P., Mullens, J. E., & Moore, M. T. (2001). Monitoring school quality: An
indicators report. Education Statistics Quarterly, 3(1), 38-44. Menard, S. W. (2002). Applied logistic regression analysis. Thousand Oaks, CA: SAGE. McDonough, P. M. (1997). Choosing colleges: How social class and schools structure
opportunity. Albany, NY: State University of New York Press. McDonough, P. M. (2005). Counseling and college counseling in America's high schools.
Alexandria, VA: National Association for College Admission Counseling. McMahon., W. W., & Wagner, A. P. (1981). Expected returns to investment in higher
education. The Journal of Human Resources, 16(2), 274-285. Mitchell, C., Kimball, M., Thornton, A., & Young-DeMarco, L. (2008). The reciprocal
relationship between college major and values: Family, careers and society. Unpublished manuscript, Department of Sociology and Institute for Social Research, University of Michigan, Ann Arbor, MI.
Mixon, N. (2007). Exploring critical theory and critical ethnography in the context of the
production and reproduction of social class. In J. L. Kincheloe & S. R. Steinberg (Eds.), Cutting class: Socioeconomic status and education (pp. 71-93). Lanham, MD: Rowman & Littlefield.
178
Mobley, M., & Slaney, R. B. (1996). Holland's theory: Its relevance for lesbian women and gay men. Journal of Vocational Behavior, 48, 125-135.
Montmarquette, C., Cannings, K., & Mahseredjian, S. (2002). How do young people
choose college majors? Economics of Education Review, 21, 543-556. Mullen, A. L. (2010). Degrees of inequality: Culture, class, and gender in American
higher education. Baltimore, MD: Johns Hopkins University Press. Mullis, R. L., Rathge, R., & Mullis, A. K. (2003). Predictors of academic performance
during early adolescence: A contextual view. International Journal of Behavioral Development, 27(6), 541-548.
Nagelkerke, N. J. D. (1991). A note on a general definition of the coefficient of
determination. Biometrika, 78, 691–692. National Center for Public Policy and Higher Education (2008). Measuring up 2008: The
national report card on higher education. San Jose, CA: The National Center for Public Policy and Higher Education.
National Science Board. (2012). Science and engineering indicators 2012. Arlington, VA:
National Science Foundation. National Science Foundation. (2007). Women, Minorities, and Persons with Disabilities
in Science and Engineering: 2007. Arlington, VA: National Science Foundation. National Science Foundation. (2010). Guide to public use data files: Survey of Graduate
Students and Postdoctorates in Science and Engineering: Fall 2010. Arlington, VA.
National Science Foundation. (2011). STEM education data and trends. Retrieved from
http://www.nsf.gov/nsb/sei/edTool/edTool.html Need, A., & de Jong, U. (2001). Educational differentials in the Netherlands: Testing
rational action theory. Rationality and Society, 13(1), 71-98. doi: 10.1177/104346301013001003
Newman, I., & Benz, C. R. (1998). Qualitative-quantitative research methodology:
Exploring the interactive continuum. Carbondale, Il: Southern Illinois University Press.
Nicholls, G. M., Wolfe, H., Besterfield-Sacre, M., Shuman, L. J., & Larpkiattaworn, S.
(2007). A method for identifying variables for predicting STEM enrollment. Journal of Engineering Education, 96(1), 33-44.
179
Norvilitis, J. M., & Reid, H. M. (2012). Predictors of academic and social success and psychological well-being in college students. Educational Research International, 2012, 1-6. doi: 10.1155/2012/272030
Ogilvie, J., & Stewart, A. (2010). The integration of rational choice and self-efficacy
theories: A situational analysis of student misconduct. The Australian and New Zealand Journal of Criminology, 43(1), 130-155.
Ong, A. D., Phinney, J. S., & Dennis, J. (2006). Competence under challenge: Exploring
the protective influence of parental support and ethnic identity in Latino college students. Journal of Adolescence, 29, 961-979.
Osipow, S. H., & Fitzgerald, L. F. (1996). Theory of career development. Needham
Heights, MA: Allyn & Bacon. Parker, J. D. A., Creque, R. E., Barnhart, D. L., Harris, J. I., Majeski, S. A., Wood, L.
M., ...Hogan, M. J. (2004). Academic achievement in high school: Does emotional intelligence matter? Personality and Individual Differences, 37, 1321-1330.
Pascarella, E., & Terenzini, P. (1991). How college affects students. San Francisco:
Jossey-Bass. Patton, M. Q. (1990). Qualitative evaluation and research methods. Newbury Park, CA:
SAGE. Paulsen, M. B., & St. John, E. P. (1997). The financial nexus between college choice
and persistence. New Directions for Institutional Research, 95, 65-82. Paulsen, M. B., & St. John, E. P. (2002). Social class and college costs: Examining the
financial nexus between college choice and persistence. The Journal of Higher Education, 73(2), 189-236.
Peard, R. F. (2004). School mathematical achievement as a predictor of success in a
first year university mathematics foundations unit. In I. Putt, R. Faragher, & M. McLean (Eds.), Proceedings MERGA 2004 (pp. 422-429). Townsville, Qld, Australia.
Pearson, C. (1997). Parental influence on a student's selection of a college major.
College Student Journal, 31(3), 301-313. Pender, M., Marcotte, D. E., Domingo, M. R. S., & Maton, K. I. (2010). The STEM
pipeline: The role of summer research experience in minority students' Ph.D. aspirations. Education Policy Analysis Archives, 18(30), 1-39.
180
Perna, L. W. (2005). The benefits of higher education: Sex, racial/ethnic, and socioeconomic group differences. The Review of Higher Education, 29(1), 23-52.
Perna, L. W. (2006). Student college access and choice: A proposed conceptual model. In J. C. Smart (Ed.), Higher education: Handbook of theory and research (pp. 99-157). Dordrecht, Netherlands: Springer.
Perna, L. W., Gasman, M., Gary, S., Lundy-Wagner, V., & Drezner, N. D. (2010).
Identifying strategies for increasing degree attainment in STEM: Lessons from minority-serving institutions. New Directions for Institutional Research, 148, 41-51.
Perna, L. W., & Titus, M. A. (2004). Understanding differences in the choice of college
attended: The role of state public policies. The Review of Higher Education, 27(4), 501-525. doi: 10.1353/rhe.2004.0020
Pike, G. R. (2007, June). Using weighting adjustments to compensate for survey
nonresponse. Paper presented at the annual meeting of the Association for Institutional Research, Kansas City, MO.
Pike, G. R., & Saupe, J. L. (2002). Does high school matter? An analysis of three
methods of predicting first-year grades. Research in Higher Education, 43(2), 187-207. doi: 0361-0365/02/0400-0187/0
Pitre, P. E. (2006). College choice: A study of African American and white student
aspirations and perceptions related to college attendance. College Student Journal, 40(3), 562-574.
Porter, S. R., & Umbach, P. D. (2006). College major choice: An analysis of person-
environment fit. Research in Higher Education, 47(4), 429-449. Portes, A. (1998). Social capital: Its origins and applications in modern sociology.
Annual Review of Sociology, 24, 1-24. President's Council of Advisors on Science and Technology. (2012). Engage to excel:
Producing one million additional college graduates with degrees in science, technology, engineering, and mathematics. Washington, D.C.
Price, J. (2010). The effect of instructor race and gender on student persistence in
STEM fields. Economics of Education Review, 29(6), 901-910. Pryor, J. H., Hurtado, S., DeAngelo, L., Blake, L. P., & Tran, S. (2009). The American
freshman: National norms fall 2009. Los Angeles: Higher Education Research Institute, UCLA.
181
Qian, Y., & Zafar, B. (2010, January). Do female faculty influence female students' choice of college major, and why? Paper presented at the Allied Social Sciences Association annual meeting, Atlanta, GA.
Raghunathan, T. E., Lepkowski, J. M., Hoewyk, J. V., & Solenberger, P. (2001). A multivariate technique for multiply imputing missing values using a sequence of regression models. Survey Methodology, 27(1), 85-95.
Rampell, C. (2011). The college majors that do best in the job market. Retrieved from
Rask, K. (2010). Attrition in STEM fields at a liberal arts college: The importance of
grades and pre-collegiate preferences. Economics of Education Review, 29, 892-900.
Rask, K. N., & Bailey, E. M. (2002). Are faculty role models? Evidence from major
choice in an undergraduate institution. The Journal of Economic Education, 33(2), 99-124.
Rask, K., & Tiefenthaler, J. (2008). The role of grade sensitivity in explaining the gender
imbalance in undergraduate economics. Economics of Education Review, 27, 676-687.
Rice, J. K. (2003). Teacher quality: Understanding the effectiveness of teacher
attributes. Washington, D.C.: Economic Policy Institute. Riegle-Crumb, C., & King, B. (2010). Questioning a white male advantage in STEM:
Examining disparities in college major by gender and race/ethnicity. Educational Researcher, 39(9), 656-664.
Rothstein, H. R., Sutton, A. J., & Borenstein, M. (2005). Publication bias in meta-
analysis: Prevention, assessment and adjustments. Hoboken, NJ: Wiley. Rowan-Kenyon, H. T. (2007). Predictors of delayed college enrollment and the impact
of socioeconomic status. The Journal of Higher Education, 78(2), 188-214. Rowan-Kenyon, H. T., Bell, A. D., & Perna, L. W. (2008). Contextual influences on
parental involvement in college going: Variations by socioeconomic class. The Journal of Higher Education, 79(5), 564-586.
Rubin, D. B. (1996). Multiple imputation after 18+ years. Journal of the American
Statistical Association, 91, 473-489. Rumberger, R. W. (1984). The changing economic benefits of college graduates.
Economics of Education Review, 3(1), 3-11.
182
Rumberger, R. W., & Palardy, G. J. (2005). Does segregation still matter? The impact of student composition on academic achievement in high school. Teachers College Record, 107(9), 1999-2045.
Rumberger, R. W., & Thomas, S. L. (1993). The economic returns to college major, quality and performance: A multilevel analysis of recent graduates. Economics of Education Review, 12(1), 1-19.
Sanderson, M. (1993). Vocational and liberal education: A historian's view. European
Journal of Education, 28(2), 189-196. Schreiber, J. B. (2002). Institutional and student factors and their influence on advanced
mathematics achievement. The Journal of Educational Research, 95(5), 274-286. Schultz, T. W. (1961). Investment in human capital. The American Economic Review,
51(1), 1-17. Scott, J. (2000). Rational choice theory. In G. Browning, A. Halcli, & F. Webster (Eds.),
Understanding contemporary society: Theories of the present (pp. 126-138). Thousand Oaks, CA: SAGE.
Seymour, E., & Hewitt, N. M. (1997). Talking about leaving: Why undergraduates leave
the sciences. Boulder, CO: Westview. Shieh, Y.-Y. (2003, November). Imputation methods on general linear mixed models of
longitudinal studies. Paper presented at the Federal Committee on Statistical Methodology Research Conference, Arlington, VA.
Shin, J. C., & Milton, S. (2008). Student response to tuition increase by academic
majors: Empirical grounds for a cost-related tuition policy. Higher Education, 55, 719-734.
Sianou-Kyrgiou, E. (2010). Stratification in higher education, choice and social
inequalities in Greece. Higher Education Quarterly, 64(1), 22-40. doi: 10.1111/j.1468-2273.2009.00427.x
Simpson, J. C. (2001). Segregated by subject: Racial differences in the factors
influencing academic major between European Americans, Asian Americans, and African, Hispanic, and native Americans. The Journal of Higher Education, 72(1), 63-100.
Singh, K., Bickley, P. G., Keith, T. Z., Keith, P. B., Trivette, P., & Anderson, E. (1995).
The effects of four components of parental involvement on eighth grade student achievement: Structural analysis of NELS-88 data. School Psychology Review, 24(2), 299-317.
183
Smith, J. A. (2010). Differences in personality factors and college major choice (Master’s Thesis). Retrieved from ProQuest Dissertations & Theses database. (ProQuest document ID: 1508158).
Smith, F. M., & Hausafus, C. O. (1998). Relationship of family support and ethnic minority students’ achievement in science and mathematics. Science Education, 82(1), 111-125.
Smyth, F. L., & McArdle, J. J. (2004). Ethnic and gender differences in science
graduation at selective colleges with implications for admission policy and college choice. Research in Higher Education, 45(4), 353-381.
Solmon, L. C. (1981). New findings on the links between college education and work.
Higher Education, 10(6), 615-648. Song, C., & Glick, J. E. (2004). College attendance and choice of college majors among
Asian-American students. Social Science Quarterly, 85(5), 1401-1421. Spera, C. (2005). A review of the relationship among parenting practices, parenting
styles, and adolescent school achievement. Educational Psychology Review, 17(2), 125-146. doi: 10.1007/s10648-005-3950-1
St. John, E. P. (1994a). Prices, productivity, and investment: Assessing financial
strategies in higher education. Washington, D.C.: The George Washington University.
St. John, E. P. (1994b). The influence of debt on choice of major. Journal of Student
Financial Aid, 24(1), 5-12. St. John, E. P., Asker, E. H., & Hu, S. (2001). The role of finances in student choice: A
review of theory and research. In M. B. Paulsen & J. C. Smart (Eds.), The finance of higher education: Theory, research, policy, and practice (pp. 419-438). New York: Agathon.
St. John, E. P., Hu, S., Simmons, A., Carter, D. F., & Weber, J. (2004). What difference
does a major make? The influence of college major field on persistence by African American and white students. Research in Higher Education, 45(3), 209-232.
St. John, E. P., Paulsen, M. B., & Carter, D. F. (2005). Diversity, college costs, and
postsecondary opportunity: An examination of the financial nexus between college choice and persistence for African Americans and whites. The Journal of Higher Education, 76(5), 545-569.
St. John, E. P., Paulsen, M. B., & Starkey, J. B. (1996). The nexus between college
choice and persistence. Research in Higher Education, 37(2), 175-220.
184
Staniec, J. F. O. (2004). The effects of race, sex, and expected returns on the choice of college major. Eastern Economic Journal, 30(4), 549-562.
Sullivan, A. (2001). Cultural capital and educational attainment. Sociology, 35(4), 893-
912. doi: 10.1177/0038038501035004006 Sullivan, A. (2006). Students as rational decision-makers: The question of beliefs and
attitudes. London Review of Education, 4(3), 271-290. Swail, W. S. (2000). Preparing America's disadvantaged for college: Programs that
increase college opportunity. New Directions for Institutional Research, 27(3), 85-101.
Swail, W. S., Cabrera, A. F., Lee, C., & Williams, A. (2005). Latino students & the
educational pipeline. Part III: Pathways to the bachelor's degree for Latino students. Washington, D.C.: Educational Policy Institute.
Tannen, M. B. (1978). The investment motive for attending college. Industrial and Labor
Relations Review, 31(4), 489-497. Tate, W. F. (1997). Race-ethnicity, SES, gender, and language proficiency trends in
mathematics achievement: An update. Journal for Research in Mathematics Education, 28(6), 652-679.
Teachman, J. D. (1987). Family background, educational resources, and educational
attainment. American Sociological Review, 52(4), 548-557. Terenzini, P. T., Cabrera, A. F., & Bernal, E. M. (2001). Swimming against the tide: The
poor in American higher education. New York: College Entrance Examination Board.
Thomas, G. E. (1985). College major and career inequality: Implications for black
students. The Journal of Negro Education, 54(4), 537-547. Thompson, J. S. (2003). The effect of single-sex secondary schooling on women's
choice of college major. Sociological Perspectives, 46(2), 257-278. Tornatzky, L. G., Cutler, R., & Lee, J. (2002). College knowledge: What Latino parents
need to know and why they don't know it. Claremont, CA: Tomas Rivera Policy Institute.
Toven-Lindsey, B., Hasson, T., & Levis-Fitzgerald, M. (2013, May). Academic support
for underrepresented STEM students: Satisfaction and impact. Paper presented at the Association for Institutional Research annual forum, Long Beach, CA.
185
Trusty, J. (2002). Effects of high school course-taking and other variables on choice of science and mathematics college majors. Journal of Counseling and Development, 80(4), 464-474.
Trusty, J., & Ng, K. (2000). Longitudinal effects of achievement perceptions on choice of
postsecondary major. Journal of Vocational Behavior, 57, 123–135. doi:10.1006/jvbe.1999.1735.
Trusty, J., Ng, K., & Ray, D. (2000). Choice of Holland’s social type college majors for
U.S. racial/ethnic groups. Journal of Career Development, 27(1), 49-64. Trusty, J., Robinson, C. R., Plata, M., & Ng, K.-M. (2000). Effects of gender,
socioeconomic status, and early academic performance on postsecondary educational choice. Journal of Counseling & Development, 78, 463-472.
Turner, S. E., & Bowen, W. G. (1999). Choice of major: The changing (unchanging)
gender gap. Industrial and Labor Relations Review, 52(2), 289-313. Tyson, W., Lee, R., Borman, K. M., Hanson, M. A. (2007). Science, technology,
engineering, and mathematics (STEM) pathways: High school science and math coursework and postsecondary degree attainment. Journal of Education for Students Places at Risk, 12(3), 243-270.
United States Department of Education. (2005). 10 facts about K-12 education funding.
Washington, D.C. United States Government Accountability Office. (2005). Federal Science, Technology,
Engineering, and Mathematics Programs and Related Trends. Washington, D.C. Retrieved from http://www.gao.gov/new.items/d06114.pdf
University of Michigan. (2011). IVEware: Imputation and variance estimation version 0.2
users guide. Ann Arbor, MI: University of Michigan. Unruh, W. R. (1979). Career decision making: Theory construction and evaluation. In A.
M. Mitchell, G. B. Jones, & J. D. Krumboltz (Eds.), Social learning and career decision making (pp. 5-18). Cranston, RI: Carroll Press.
Van de Werfhorst, H. G. (2002). A detailed examination of the role of education in
intergenerational social-class mobility. Social Science Information, 41, 407-438. doi: 10.1177/0539018402041003004
Walpole, M. (2003). Socioeconomic status and college: How SES affects college
experiences and outcomes. The Review of Higher Education, 27(1), 45-73.
186
Walpole, M. (2008). Emerging from the pipeline: African American students, socioeconomic status, and college experiences and outcomes. Research in Higher Education, 49, 3, 237-255.
data using inappropriate analysis and software computing packages. Public Health, 111, 259-262.
Ware, N. C., & Lee, V. E. (1988). Sex differences in choice of college science majors.
American Educational Research Journal, 25(4), 593-614. Watson, C. N. (2012). Using factors of socioeconomic status, family support, and
academic preparation to explain the black-white gap in mathematics achievement and participation (Doctoral dissertation). Retrieved from ProQuest Dissertations & Theses database. (ProQuest document ID: 3512366).
Wayman, J. C. (2003, April). Multiple imputation for missing data: What is it and how
can I use it? Paper presented at the annual meeting of the American Educational Research Association, Chicago, IL.
Wayne, A. J., & Youngs, P. (2003). Teacher characteristics and student achievement
gains: A review. Review of Educational Research, 73(1), 89-122. White, K. R. (1982). The relation between socioeconomic status and academic
achievement. Psychological Bulletin, 91(3), 461-481. Willis, R. J., & Rosen, S. (1979). Education and self-selection. Journal of Political
Economy, 87(5), S7-S36. Worthington, A. C., & Higgs, H. (2003). Factors explaining the choice of a finance major:
The role of students’ characteristics, personality and perceptions of the profession. Accounting Education, 12(3), 261-281. doi:10.1080/0963928032000088831.
Wyner, J. S., Bridgeland, J. M., & DiIulio, J. J. (2007). Achievementrap: How America is
failing millions of high-achieving students from lower-income families. Washington, D.C.: Civic Enterprises.
Xie, Y., & Goyette, K. (2003). Social mobility and the educational choices of Asian
Americans. Social Science Research, 32, 467-498. Young, H. (2005). Secondary education systemic issues: Addressing possible
contributors to a leak in the science education pipeline and potential solutions. Journal of Science Education and Technology, 14(2), 205-216. doi: 10.1007/s10956-005-4422-6
187
Zimmerman, B. J., Bandura, A., & Martinez-Pons, M. (1992). Self-motivation for academic attainment: The role of self-efficacy beliefs and personal goal setting. American Educational Research Journal, 29(3), 663-676.