25
FAO GLOBAL INFORMATION AND EARLY WARNING SYSTEM ON FOOD AND AGRICULTURE WORLD FOOD PROGRAMME SPECIAL REPORT FAO/WFP CROPAND FOOD SUPPLY ASSESSMENT MISSION TO SWAZILAND 28 July 2004
FAO GLOBAL INFORMATION ANDEARLY WARNING SYSTEM ON FOOD
AND AGRICULTUREWORLD FOOD PROGRAMME
SPECIAL REPORT
FAO/WFP CROP AND FOOD SUPPLYASSESSMENT MISSION TO SWAZILAND
28 July 2004
TABLE OF CONTENTS
MISSION HIGHLIGHTS....................................................................................................... 1
1. OVERVIEW .............................................................................................................. 1
2. SOCIO-ECONOMIC CONTEXT ........................................................................... 32.1 General ........................................................................................................................ 32.2 Recent macroeconomic developments ........................................................................ 32.3 Population estimates.................................................................................................... 42.4 HIV/AIDS.................................................................................................................... 4
3. AGRICULTURAL PRODUCTION IN 2003/04 .................................................... 53.1 Agro-meteorological conditions.................................................................................. 63.2 Supply of agricultural inputs ....................................................................................... 73.3 Planted areas................................................................................................................ 83.4 Yields........................................................................................................................... 93.5 Overall production..................................................................................................... 103.6 Other crops ................................................................................................................ 113.7 Livestock situation..................................................................................................... 12
4. FOOD SUPPLY AND DEMAND SITUATION................................................... 124.1 Current market situation ............................................................................................ 124.2 Cereal supply/demand balance, 2004/05 (April/March) ........................................... 14
5. FOOD SECURITY AND VULNERABILITY ASSESSMENT .......................... 155.1 Food security background ......................................................................................... 155.2 Methodology of assessment ...................................................................................... 165.3 Vulnerability and coping mechanisms ...................................................................... 165.4 Estimation of population in need and emergency food aid requirements ................. 195.5 Possible strategies for food assistance....................................................................... 20
APPENDIX............................................................................................................................. 22
ENDNOTES ........................................................................................................................... 23
1
MISSION HIGHLIGHTS
• Poor agro-climatic conditions characterized by late onset of the rainy season andbelow-average cumulative rainfall have undermined Swaziland’s cereal harvest forthe fourth consecutive year.
• Maize production in 2003/04 is estimated at about 64 000 tonnes, 13 percent belowlast year and about 30 percent below the average for the previous five years.
• Cereal import requirement in the 2004/05 marketing year (April/March) isestimated at about 132 000 tonnes, of which 100 000 tonnes are expected to beimported commercially.
• With about 10 000 tonnes of food aid in stocks and in the pipeline as of April 2004,the uncovered deficit, for which international assistance is needed, is estimated at22 000 tonnes.
• Early drought conditions caused some loss of livestock, but late rains improvedpastures and animal condition in most parts of the country. Livestock production isexpected to help offset, to some extent, the impact of crop failure.
• The continuing spread of HIV/AIDS is further exacerbating the already severeimpact of adverse weather through high unemployment, income inequality andpoverty.
• A targeted approach for food aid is required, focused primarily on mitigating theeffect of HIV/AIDS, and on direct support to households with no access toavailable food and agricultural inputs.
• A total of 262 000 people will face food/income deficits of varying amounts, andapproximately 28 355 tonnes of food (or income equivalent) will be needed to meetthe deficit for the entire year.
1. OVERVIEW
During the past three years, Swaziland has suffered below-average and declining cerealproduction because of erratic rainfall patterns, which are exacerbating the impact of risingunemployment and increased poverty. The continued spread of HIV/AIDS has compoundedthe threat to the country’s overall food security. Towards the end of last year, theGovernment declared a state of national disaster and appealed for international assistance.
Against this background, an FAO/WFP Crop and Food Supply Assessment Mission visitedSwaziland from 1 to 13 May 2004 to estimate the 2003/04 cereal harvest and importrequirements – including food assistance – for the 2004/05 marketing year (April/March).The Mission received full cooperation from the Deputy Prime Minister’s Office, Ministry ofAgriculture and Cooperatives (MoAC), Central Statistical Office (CSO) of the Ministry ofEconomic Planning and Development, the National Disaster Task Force (NDTF) and theNational Early Warning Unit. Ministry of Agriculture officials as well as food aid monitorsaccompanied the Mission on field visits.

2
The Mission’s findings are based on discussions held with government officials, staff fromUnited Nations agencies, multilateral and bilateral donors and staff of local and internationalNGOs. Field visits were conducted to all districts and agro-ecological zones of the country.Discussions were also held with the Swazi Vulnerability Assessment Committee (VAC),National Maize Corporation (NMC), Ngwane Milling, Universal Milling Company and theNational Agricultural Marketing Board. Available relevant reports and documents werereviewed, and satellite-based normalized difference vegetation indices (NDVI) wereanalysed. Pre-harvest data on area and yield were provided by the Central Statistical Office(CSO) and the
National Early Warning Unit (NEWU), respectively. The Mission cross-checked and adjusteddata where necessary, following field inspections, interviews with farmers and districtextension officers and spot-check crop measurements where possible.
The Mission found that the 2003/04 agricultural season was characterized by erratic rainfall(started late with unusually heavy rains later in the season) and a below-average cumulativerainfall. In some potentially high-producing areas, precipitation problems caused plantings tobe made twice. In addition, a significant decline in the use of agricultural inputs, mainlyfertilizer and improved seed, was observed, due to diminished farmers’ purchasing power,removal of subsidies and risk aversion following the late rains and governmentpronouncements advising caution.
Overall, the Mission has estimated the 2003/04 maize production at 64 108 tonnes, which isabout 13 percent below last year’s crop and 30 percent under the average for the previous fiveyears.
Other important crop sources of food and cash such as cabbage, beans, potatoes, cotton andsugar cane were also observed in farmers’ fields. However, with the exception of vegetablesin places where late rains encouraged production, the area planted to these other crops hasalso declined.
Early drought conditions caused some loss of livestock, but late rains improved pastures andanimal condition in most parts of the country. Livestock production is expected to help offset,to some extent, the impact of crop failure.
The cereal import requirement in 2004/05 marketing year (April/March) is estimated at132 000 tonnes, of which an estimated 100 000 tonnes are expected to be importedcommercially. With food aid in stock and in the pipeline estimated at about 10 000 tonnes,the uncovered deficit for which international assistance is required is estimated at 22 000tonnes.
Prices of major cereals were relatively stable during most of 2003 but started to creep upfrom the beginning of 2004. The upward trend is expected to continue during the rest of thisyear as supplies from domestic and regional sources may be rather limited.1
The spread of HIV/AIDS in Swaziland has continued unabated over the past decade. Thestatistics paint a grim picture: the HIV/AIDS prevalence rate among 15–49 year-olds hasincreased ten-fold between 1992 and 2002, from 3.9 percent to 38.6 percent. In addition tohumanitarian and social consequences, HIV/AIDS brings severe economic costs in its wake,as it constrains output growth, eliminates work skills and knowledge, shrinks the tax base,raises health-related costs, reduces disposable incomes and increases the financial imbalancein the public pension funds. The national response in tackling the pandemic is being

3
coordinated through the National Emergency Response Commission on HIV/AIDS(NERCHA).
Based on the VAC analysis, verified by field work carried out during the mission, thecumulative affect of these factors results in a projection that a total of 262 000 people willface food/income deficits of varying amounts and that approximately 28 355 tonnes of food(or income equivalent) will be needed to meet the deficit for the entire year.
2. SOCIO-ECONOMIC CONTEXT
2.1 General
Swaziland’s economy is based on agriculture and agro-industry, mainly sugar, citrus andwood pulp. Growth sectors include soft-drink concentrates, food products, textiles and paperproducts. Coal is the major mineral resource. The main merchandise exports are sugar andsugar derivatives, consumer goods and pulpwood. Imports include mainly capital andintermediate goods, manufactured goods, machinery and transport equipment, agriculturaland farming goods, and energy.
Swaziland is classified as a lower middle-income country with a per capita income ofUS$1 245 in 2002. However, per capita income of the poorest 40 percent of the population isonly US$230, and 66 percent of the population live below the poverty line. The incomedistribution is skewed, as about 43 percent of the total income is received by only 10 percentof the population.
2.2 Recent macroeconomic developments
Official estimates put real GDP growth rate at 2.9 percent in 2003, well below the 3.6 percentestimated for 2002. This reflects declining rates in foreign direct investment, the slowdown inmanufacturing output and low agricultural productivity from drought. Growth inmanufacturing output slowed in 2003 following the closing of some major companies anddepressed world demand for the country’s primary commodities. The slowdown in 2003 inSouth Africa’s economic growth, Swaziland’s largest export market, was mainly responsiblefor the undermined demand. The loss in momentum in the expansion of economic activity isexpected to continue, and this factor is reflected in the 2004 GDP forecast of less than 2percent, partly because of the effect of drought in the 2003/04 cropping season.
Average annual inflation fell to 7.4 percent in 2003, compared with 11.8 percent in 2002. InJanuary 2004, the annual inflation rate dipped further to 4.1 percent, helped by a slowdown infood price rises (food items constitute nearly one-quarter of the consumer price index).However, inflation rose in subsequent months and is expected to rise further, in line withforecast trends in South Africa, whose economic situation has a major influence on inflationin Swaziland. The forecast trends in South Africa average at 5.4 percent in 2004 and 5.8percent in 2005.
The budget for fiscal year 2004/05 projects a deficit of Emalangeni 221 million comparedwith E445 million in 2003/04 and E593 million in 2002/03.2 The country’s balance ofpayments estimates indicate an overall deficit for the third consecutive year in 2003. Theoverall deficit in 2003 stood at E128 million compared to E307 million in 2002. The currentaccount deficit is expected to widen to 5 percent of GDP in 2004, as the trade deficit widensfrom lower export earnings caused by lower sugar and textile exports and an expectedweakening of the currency. Import growth of consumer goods will be sluggish, in line with

4
weak real GDP growth, but food imports will increase to offset the impact of droughtconditions.
The public debt level at the end of December 2003 was E4.4 billion (31 percent of GDP),compared to E3.5 billion at the end of March 2002. This level takes into account theappreciation of the local currency against major currencies at 17 percent. Nonetheless,Swaziland’s debt/GDP and debt-service ratios are considered low by developing countrystandards, reflecting a history of cautious government borrowing.
Swaziland’s foreign reserves have remained relatively stable in the last decade at aboutUS$300 million. However, in the last couple of years, the loss of competitiveness in theexport sector, the appreciation of the exchange rate, and relatively higher governmentspending have negatively affected the country’s foreign reserves. In February 2004, netforeign reserves reflected a substantial decline of more than 23 percent year-on-year. At thislevel the reserves were sufficient to cover 2.5 months of estimated imports, slightly below theminimum cover of 3 months recommended for developing countries.
2.3 Population estimatesAccording to the 1997 census, the total resident population was estimated at 930 000 with anannual rate of growth of 2.9 percent. However, the forecast population growth rate has fallenrapidly since then and now stands at about 2.2 percent.3 Current CSO estimates put the totalpopulation in 2004 at 1.1 million compared to 1.08 million in 2003.4 The average lifeexpectancy has also fallen from 56.4 in 1997 to 41.4 in 2004. A continued decline in averagelife expectancy is projected until 2009, when it will reach its lowest level at 34.9.
2.4 HIV/AIDSThe spread of HIV/AIDS in Swaziland has continued unabated over the past decade;Swaziland is the third-most affected country in the world following Botswana andZimbabwe. The statistics paint a grim picture: HIV/AIDS prevalence rates among the 15–49year-olds has increased ten-fold between 1992 and 2002, from 3.9 percent to 38.6 percent.This age-group forms a large proportion of the economically productive population. AIDS-related deaths are estimated at 8 000 people in 2001, and projections indicate that by 2009they will have risen to 24 000 per annum. The most at-risk groups created by the pandemicinclude orphans and vulnerable children (OVCs), who are currently estimated at more than60 000 in the country (with a projected rise to 120 000 by 2010).
In addition to its humanitarian and social consequences, HIV/AIDS costs countries severelyin economic terms, as it constrains output growth, eliminates work skills and knowledge,shrinks the tax base, raises health-related costs, reduces disposable incomes, and increasesfinancial imbalance in the public pension funds.
The national response in tackling the pandemic is being coordinated through the NationalEmergency Response Commission on HIV/AIDS (NERCHA). A three-pronged NationalStrategic Plan was established to deal with the crisis with the following actions:
• Mitigation allows for decentralization of activities such as food distribution andinformation centres to regions.
• A prevention programme aims at reducing the risk of infection throughbehavioural change. This was motivated by the observation that despite a high
5
level of awareness of HIV/AIDS in the country, this has not been translated intopositive changes in behaviour.
• A care and support programme has set up additional centres that assist in thedistribution of antiretroviral (ARVs) drugs, which have already reached about1 300 people, with a further 10 000 people to have access to the drugs by 2005.
The Indlunkhulu project aims to ensure food security for orphans and vulnerable childrenwithin communities. This project, implemented by NERCHA with support from WFP, FAOand the Ministry of Agriculture and Cooperatives, aims at providing support for farm inputsto all Chiefdoms in the country to enable communities to plough the Indlunkhulu fields,thereby providing a sustainable source of food for HIV/AIDS-affected households.
3. AGRICULTURAL PRODUCTION IN 2003/04The agricultural sector in Swaziland contributes to the livelihoods of the majority of thepopulation and provides raw materials for the largely agro-based industries. Maize remainsthe staple food and is grown by the vast majority of rural households, accounting forapproximately 86 percent of the entire land cropped on communal Swazi National Land(SNL) (2004 Agricultural Sector Policy Report). The remaining SNL area is cropped torelatively small amounts of cotton, groundnuts, pumpkins and sweet potatoes. In terms ofcontribution to GDP, however, irrigated sugar cane production dominates the agriculturalsector, providing approximately 60 percent of agriculture’s 13 percent contribution to GDP.Sugar cane dominates agricultural production on the roughly 31 percent of the totalgeographic area of Swaziland held by individuals and companies as Title Deed Land (TDL).Much of TDL is planted to commercial forests in the Highveld and is used for grazing, but asmall proportion is used for the production of citrus, pineapples, vegetables, maize andfodder.
In recent years the land and inputs allocated to sugar cane production have shown a slow andsteady increase, whereas the area planted to maize has remained fairly constant (Figure 1).The Government of Swaziland has encouraged sugar cane production on irrigated TDL inorder to improve its foreign exchange earnings through exports of sugar-based products.Meanwhile the production of maize remains mostly on non-irrigated SNL. However, withrecent changes in weather patterns that have severely affected grain production on rainfedlands, the country’s ability to meet its cereal requirements through commercial imports isbeing taxed.

6
Figure 1: Swaziland: area planted to maize and sugar cane (1998/99–2002/03)
Source: CSO and Swaziland Sugar Association.
3.1 Agro-meteorological conditionsThe 2003/04 agricultural season was the second consecutive year of well–below-averagecumulative rainfall, and was the fourth consecutive year in which erratic rainfall patterns ledto below-average national maize production. The 2003/04 rainfall pattern was particularlydevastating because the rainy season started significantly later than normal (October) and wasfollowed by a dry spell throughout much of December (Figure 2). However, there wereadequate planting rains in late October and November in all agro-ecological zones except theLowveld. The January through April rains were generally good across the country. Despitethe favourable ending to the season, yields and the area planted to maize were adverselyaffected in all but limited areas of the Highveld and moist Middleveld. Many farmers whoplanted early during the period of limited soil moisture, experienced delayed and spotty cropemergence and reduced numbers of plants. In many areas of the Lubombo Plateau andLowveld, early rainfall was insufficient for farmers to even attempt planting, especially giventhe normal insufficiency of rainfall for good maize production in these areas. In addition tothe detrimental effects of this year’s rainfall pattern on crop area and yields, the heavy rainfallin February and March led to significant amounts of crop loss in some areas from ear rot.
Vegetation for livestock was adversely affected by the poor rainfall through the end ofDecember 2003, but made a strong recovery from January to April 2004. Monthly satellitevegetation data indicate below-average vegetative index values for the months of Octoberthrough December, the beginning of a recovery in most agro-ecological zones in January, andgenerally average to above-average values in March and April.

7
Figure 2: Swaziland: Actual (2003/04) vs. normal rainfall, by agro-ecologicalzone
Source: Meteorology Department, Swaziland.
3.2 Supply of agricultural inputsFertilizer use for food crop production (excluding commercial farming) ranged from 14 000–17 000 tonnes during the period from 1995/96 to 1998/99, and fell to 13 500 tonnes in2001/2002. Fertilizers, which are no longer subsidized, are traded by the private sector andfarmer cooperatives through national networks. However, farmers are becoming less able toafford the cost of fertilizers. Though no hard data are available, indications from suppliersand farmers show that fertilizer use during 2003/04 season was even lower than before. Themajor commercial supplier indicated that this year’s fertilizer use may have been down to aslow as 9 000 tonnes nationally from a high of nearly twice that figure ten years ago. Sales bythe Farmers Cooperative Union (FCU) through their 24 depots positioned around Swazilandindicate that by the end of March only 70 percent of expected fertilizer use for the 2003/04cropping season had been reached. In addition, farmers interviewed by the Mission generallyindicated that high fertilizer prices, late rains and limited opportunities for credit had led themto cut back or eliminate fertilizer use on this year’s crop.
Similar to the situation with fertilizer use, hybrid seed use took another precipitous decline in2003/04. Hybrid maize seed use went down from 4 000 tonnes in 1995/96 to 1 183 tonnes in2000/01 and to 1 153 tonnes in 2001/02. This decline followed a government decision to stopproviding free seeds to farmers; seeds are now supplied at market prices by the private sectorand cooperatives. The major hybrid seed supplier for the country estimated that sales mayhave been as low as 600 tonnes as opposed to nearly double that quantity last year. Farmers
8
also indicated to the Mission that they were using various strategies for decreasing the use ofnewly purchased hybrids, including mixing hybrids with their saved open-pollinatedvarieties, buying locally re-packaged hybrids of unknown origin and even sowing grainharvested from last year’s crop that was sown with hybrid seed.
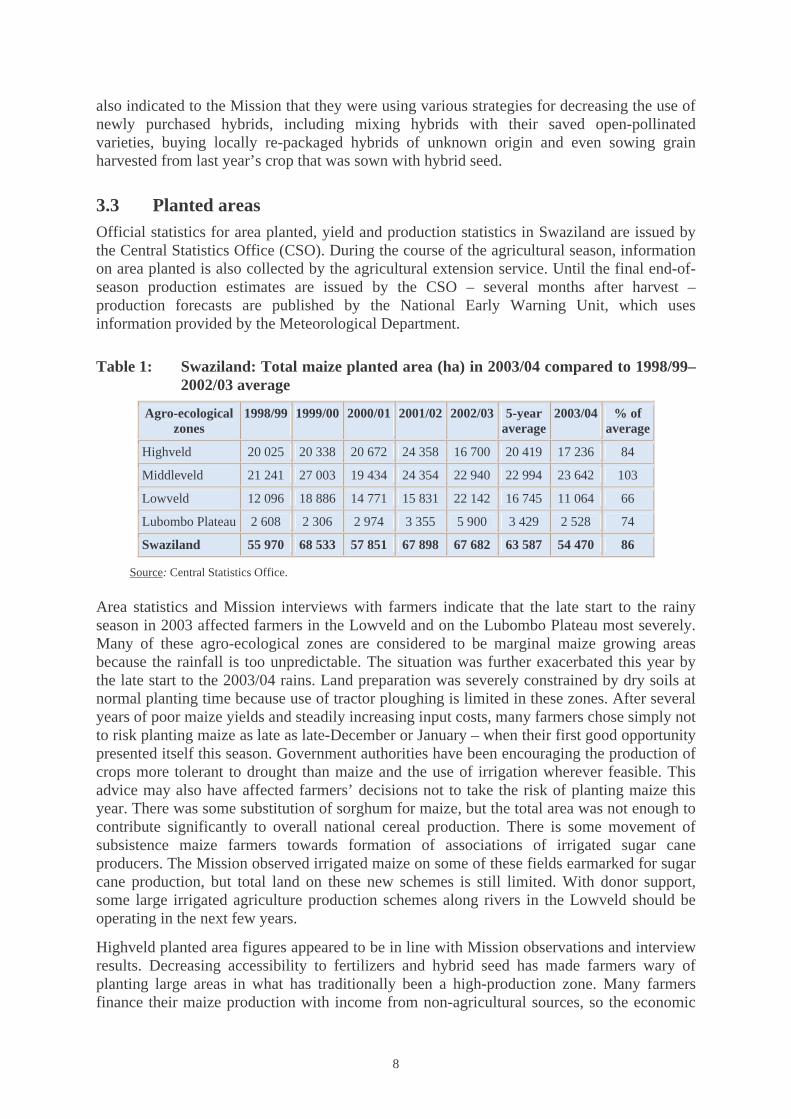
3.3 Planted areasOfficial statistics for area planted, yield and production statistics in Swaziland are issued bythe Central Statistics Office (CSO). During the course of the agricultural season, informationon area planted is also collected by the agricultural extension service. Until the final end-of-season production estimates are issued by the CSO – several months after harvest –production forecasts are published by the National Early Warning Unit, which usesinformation provided by the Meteorological Department.
Table 1: Swaziland: Total maize planted area (ha) in 2003/04 compared to 1998/99–2002/03 average
Agro-ecologicalzones
1998/99 1999/00 2000/01 2001/02 2002/03 5-yearaverage
2003/04 % ofaverage
Highveld 20 025 20 338 20 672 24 358 16 700 20 419 17 236 84
Middleveld 21 241 27 003 19 434 24 354 22 940 22 994 23 642 103
Lowveld 12 096 18 886 14 771 15 831 22 142 16 745 11 064 66
Lubombo Plateau 2 608 2 306 2 974 3 355 5 900 3 429 2 528 74
Swaziland 55 970 68 533 57 851 67 898 67 682 63 587 54 470 86
Source: Central Statistics Office.
Area statistics and Mission interviews with farmers indicate that the late start to the rainyseason in 2003 affected farmers in the Lowveld and on the Lubombo Plateau most severely.Many of these agro-ecological zones are considered to be marginal maize growing areasbecause the rainfall is too unpredictable. The situation was further exacerbated this year bythe late start to the 2003/04 rains. Land preparation was severely constrained by dry soils atnormal planting time because use of tractor ploughing is limited in these zones. After severalyears of poor maize yields and steadily increasing input costs, many farmers chose simply notto risk planting maize as late as late-December or January – when their first good opportunitypresented itself this season. Government authorities have been encouraging the production ofcrops more tolerant to drought than maize and the use of irrigation wherever feasible. Thisadvice may also have affected farmers’ decisions not to take the risk of planting maize thisyear. There was some substitution of sorghum for maize, but the total area was not enough tocontribute significantly to overall national cereal production. There is some movement ofsubsistence maize farmers towards formation of associations of irrigated sugar caneproducers. The Mission observed irrigated maize on some of these fields earmarked for sugarcane production, but total land on these new schemes is still limited. With donor support,some large irrigated agriculture production schemes along rivers in the Lowveld should beoperating in the next few years.
Highveld planted area figures appeared to be in line with Mission observations and interviewresults. Decreasing accessibility to fertilizers and hybrid seed has made farmers wary ofplanting large areas in what has traditionally been a high-production zone. Many farmersfinance their maize production with income from non-agricultural sources, so the economic

9
downturn appears to be affecting their willingness to sow large areas, especially when theseason begins poorly and production returns are not guaranteed.
Planted area statistics showing a slight increase over the five-year average for the Middleveldare more difficult to explain. The increase is likely to be a statistical anomaly, as low areaswere reported for the 1998/99 and 2000/01 seasons. These low values have brought down thefive-year average. Many parts of the Middleveld are among the highest maize yield potentialareas in the country because of their generally good rainfall distribution. Also, these areas areless likely to experience the excessive rainfall and cold temperatures found in some Highveldareas.
3.4 YieldsThe yield forecasts for each agro-ecological zone are presented in Table 2. The Missioncarried out over 100 interviews with farmers, extension workers, district agricultural officersand other government and NGO personnel during the course of the field trips to all four agro-ecological zones. In addition, the Mission sampled crop yields on randomly selected farms ofdifferent sizes and production levels to verify farmers’ reported yields. As with previousMissions, this year’s team found that yield forecasts reported in NEWU bulletins throughoutthe season did not adequately reflect the large variations in rainfall and maize productionsystems between agro-ecological zones. NEWU estimates are based on a Water RequirementSatisfaction Index (WRSI), which was designed as a preliminary indication of potential yield,based on satellite information. The Mission used data that combined farmer interviews,historical yields and current agro-climatic information to estimate yields for each zone; thefindings were well below the figures indicated by the WRSI.
Table 2: Swaziland: Estimated area, yield and production of maize in 2003/04, byagro-ecological zone
Zone Planted area(ha)
Yield*(tonne/ha)
Production(tonnes)
Total SNL1/ 54 470 1.11 60 608
Highveld 17 236 1.73 29 767
Middleveld 23 642 1.06 25 061
Lowveld 11 064 0.43 4 746
Lubombo Plateau 2 528 0.41 1 034
TDL2/ 1 000 3.50 3 500
Swaziland 55 470 1.16 64 108
*Yields are Mission estimates.1/ Swaziland National Land – State Land.2/ Title-Deed Land – Commercial farmers' land (Mission estimates).
Highveld
Maize yields for farms visited throughout the Highveld were highly variable, ranging fromapproximately 0.2–5 t/ha, but with most yields in the 1–3 t/ha range. The relatively high levelof input use and generally reliable rainfall, even during the 2003/04 season, make this thehighest-yielding agro-ecological zone. Despite the generally dry conditions throughout thecountry, most farmers in the Highveld reported planting only a few weeks later than normaland having experienced few adverse effects from the December dry period. There were,
10
however, localized pockets with poor plant emergence problems and December drought.These generally good yields in the Highveld mean that production is likely to approach thefive-year average and will probably be better than the two previous drought-proneagricultural seasons.
Middleveld
Yields for farmers visited in this zone were consistent within the dry Middleveld, averagingnearly 0.5 t/ha, and were also consistent within the moist Middleveld, averaging around 1.3t/ha. Despite the high planted area figures reported for the Middleveld, an average yieldfigure of 1.06 t/ha means that production for the zone will be lower than last year and belowthe five-year average. These data are consistent with the highly variable localized dry periodsexperienced throughout the Middleveld.
Lowveld
In addition to a decrease in the area planted to maize in the Lowveld, yields were alsoextremely low. This can be attributed to very late planting (January for many households),poor seedbed preparation (reliance on animal traction), relatively low use of fertilizers, andthe cessation of rains with crops drying up before they had reached physiological maturity.Some farmers took the risk of planting maize in January although they knew that the normalend of rains would not allow them to harvest a high-yielding crop, and thus prevented theLowveld from experiencing a complete agricultural production disaster.
Lubombo Plateau
Maize yields in the Lubombo Plateau, like the rainfall, were the most variable of the fouragro-ecological zones. Many households reported losing their entire crops during theDecember dry period, while others, whose fields received localized showers, were able toobtain yields of up to 1 t/ha. Farmers on the Plateau are being encouraged to diversify intomore drought-resistant crops and a few successful fields of sorghum and millet wereobserved. However, the change of crops is tentative and the effect on overall cerealproduction is negligible.
Title-Deed Land
Large, highly mechanized commercial farms on title-deed land (TDL) using high levels ofinputs can obtain yields on the order of 6 t/ha; this contributes approximately 5 percent to thetotal national maize crop. In some cases they have access to supplemental irrigation tominimize the yield-depressing effects of dry spells. The two largest commercial farms arelocated in the moist Middleveld; they were affected by this year’s slow start to the rainyseason. However, the largest of these farms was able to minimize production losses by usingsupplemental irrigation and by rapidly preparing land for sowing when soil moistureconditions were good. As a result, average yields for these farms are estimated to be on theorder of 3.5 t/ha.
3.5 Overall productionThe figures presented in Table 3 indicate that estimated national maize production, excludingTDL production, is 60 608 tonnes, 69 percent of the five-year average. This figure alsorepresents only 87 percent of last year’s drought-affected production. Production was belowaverage across all agro-ecological zones, but continually declining production in the recent

11
drought-affected years in the Lowveld accounts for much of this shortfall. Low yields thisseason in the Middleveld, along with a decrease in the area planted in the Highveld, wereother major contributing factors to this year’s production deficit. The poor start to the rainyseason and December dry spells were responsible for most of this year’s lowered maizeproduction, but the decreasing willingness of many households to invest in tractor ploughingservices, fertilizers and hybrid seed also contributed.
Table 3: Swaziland: Total maize production (tonnes) in 2003/04 compared to1998/99–2002/03 average1/
Agro-ecologicalzones
1998/99 1999/00 2000/01 2001/02 2002/03 5-yearaverage
2003/04 % ofaverage
Highveld 45 486 38 721 33 493 25 567 22 078 33 069 29 767 90
Middleveld 39 939 43 514 28 995 24 693 32 722 33 973 25 061 74
Lowveld 17 358 27 627 16 861 14 545 9 462 17 170 4 746 28
Lubombo Plateau 4 557 2 917 3 187 2 834 5 011 3 701 1 034 28
Swaziland 107 340 112 779 82 536 67 639 69 273 87 913 60 608 69
Source: CSO; Mission yield estimates for 2003/04.1/ Does not include 3 500 tonnes of estimated production on the Title-Deed Land.
3.6 Other cropsSugar cane is cultivated on 48 307 ha according to 2002/03 figures, and the area probablyincreased in 2003/04. Raw and refined sugar, sugar products and ethanol now constitute themain agricultural exports and an important source of foreign currency. Areas of irrigatedsugar cane are being developed continuously, as this commodity has earned good exportprices over the years. However, recent price declines may be altering the profitability of sugarproduction and the balance of crops being produced in sugar-cane growing areas. The loss of15 000 tonnes of Swaziland’s share of the Special Preferential Sugar Quota in the EU to leastdeveloped countries has worsened the situation.
According to the CSO, cotton, one of the major cash crops, was planted on 6 665 ha in2002/03, down from 11 082 ha in 2001/02 and 35 000 ha in 1998/99. The only ginnery in theLowveld, which had closed, has been sold and is expected to re-open in 2004. Cotton stillplays a role in the food security of some households, particularly in the dry Middleveld andLowveld, but production is on the decline. Some farmers interviewed in the Lowveld wouldlike to return to cotton production, but credit is required for inputs. Often, this needed creditis not being offered, or else requires that old debts from poor production/low-producer-priceyears be cleared before credit can be re-established.
Grapefruit, oranges, soft citrus and lime provide important nutritional elements in the diet andare another source of foreign currency. According to CSO data for 2002/03, groundnuts,sweet potatoes, pumpkins and beans are other important food crops with planted areas of5 683 ha, 3 301 ha, 2 493 ha and 1 567 ha, respectively. These crops are generally moredrought tolerant, or are grown on less drought-prone land or in non-drought croppingsystems; thus they generally fared better than maize this year.

12
3.7 Livestock situationLivestock production is a major agricultural activity in Swaziland, with small farmers owningabout 77 percent of the total cattle population. The number of livestock has been declining inrecent years from a contraction of the country’s rangelands as a result of allocating more landfor human settlements. The cattle population which comprises the largest component of thecountry’s livestock industry fell to 522 260 in 2002 from a revised figure of 588 288 in 2000– a drop of 11 percent.
The condition of pastures and livestock across the country had begun to deteriorate withsuccessive years of low rainfall and the early season drought. The recent Swazi VAC reportindicates that there were high numbers of animal deaths in the dry Middleveld, LubomboPlateau and Lowveld areas towards the end of 2003. Cattle condition in December 2003 wasreported to be the worst since 1995. However, heavy February/March rains regeneratedpasture. At the time of the Mission, livestock condition and prices were generally stable.
Goat and sheep are also important in many Swazi farming systems, as sources of both foodand income. The 2002/03 CSO data indicate that goat numbers over the last 5 years havedeclined by 19 percent to 273 576. By contrast, sheep numbers, while fluctuating over thepast five years, were 29 percent higher than in 1997. Mission field interviews did not indicateany alarming trends in sales or loss of goats and sheep during the 2003/04 agricultural season.
4. FOOD SUPPLY AND DEMAND SITUATION
4.1 Current market situationIn a normal year, roughly 60 percent of the food consumed in the country is imported. Figure3 indicates annual maize imports (including yellow maize) as recorded by the NationalAgricultural Marketing Board (Namboard).5 From a macroeconomic point of view, the directconvertibility of the Lilangeni into the South African Rand means that availability of foreignexchange is not a constraint to commercial imports from South Africa. Commercial foodimports appear to have been quite responsive to fluctuations in national production. However,the severe impact of drought over the past three years combined with declining off-farmincomes and remittances have rendered large number of households dependent on foodassistance.

13
Figure 3: Swaziland: Annual commercial maize imports (1996/97–2003/04)
Source: National Maize Corporation (NMC) and National Agricultural Marketing Board (includes yellowmaize).
About 10 percent of domestic production is marketed in normal years, mostly through theNational Maize Corporation (NMC) and Ngwane Mills. NMC, a parastatal entity establishedin 1985, is the sole licensed importer of maize grain, and it seeks to act as a buyer of lastresort for domestic production. However, NMC local purchases have fallen markedly overthe past decade from around 10 percent to around 6 percent.
The dual role of NMC as the sole importer as well as the competitor in the domestic marketgives it an unfair advantage over its competitors, thus creating market imperfections thatdistort producer and consumer incentives. It may be more efficient to liberalize the imports ofmaize, as has been done for other food commodities, while still requiring import permits fromNamboard. However, Namboard itself needs to be restructured to address current problems ofunder-reporting of imports, issuance of new import permits without accounting for previousactivities, and extremely low fines in cases of non-compliance.6
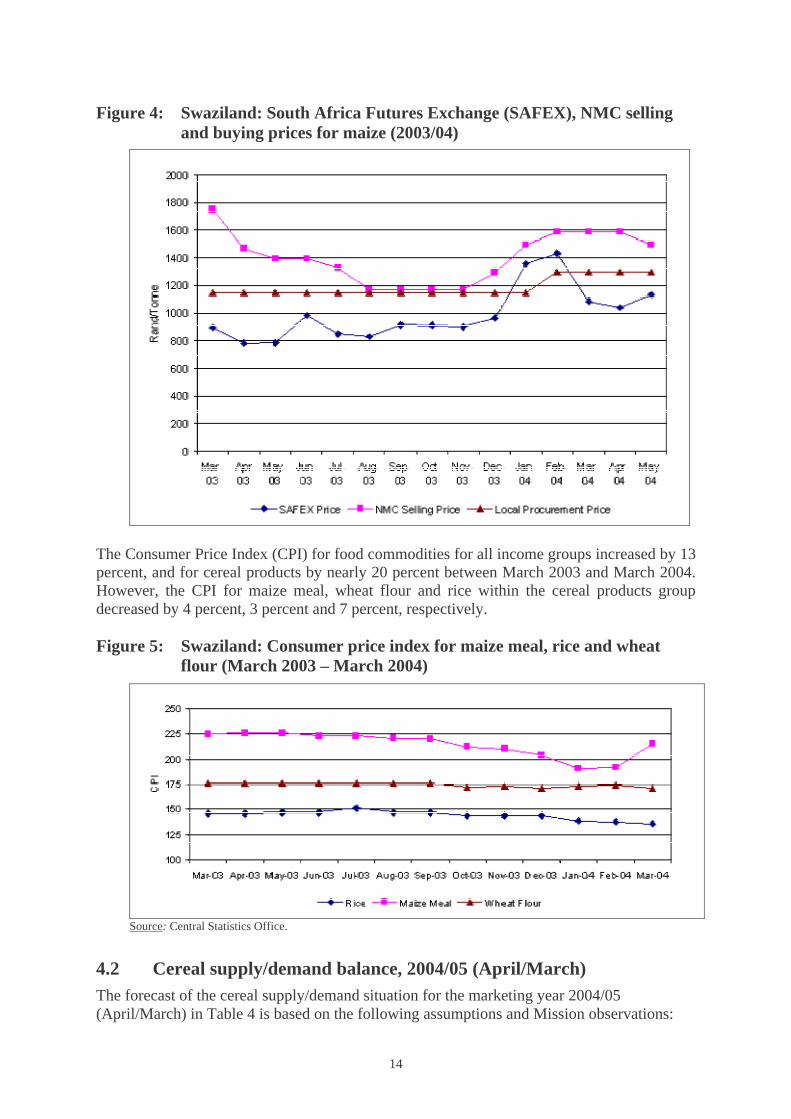
As a net importer of food commodities, prices in Swaziland’s domestic market are heavilyinfluenced by prices of imports from South Africa (Figure 4). The NMC has sought to recoupits overhead costs by maintaining some margin between its buying prices (both domestic andimported) and the prices that it charges millers.
14
Figure 4: Swaziland: South Africa Futures Exchange (SAFEX), NMC sellingand buying prices for maize (2003/04)
The Consumer Price Index (CPI) for food commodities for all income groups increased by 13percent, and for cereal products by nearly 20 percent between March 2003 and March 2004.However, the CPI for maize meal, wheat flour and rice within the cereal products groupdecreased by 4 percent, 3 percent and 7 percent, respectively.
Figure 5: Swaziland: Consumer price index for maize meal, rice and wheatflour (March 2003 – March 2004)
Source: Central Statistics Office.
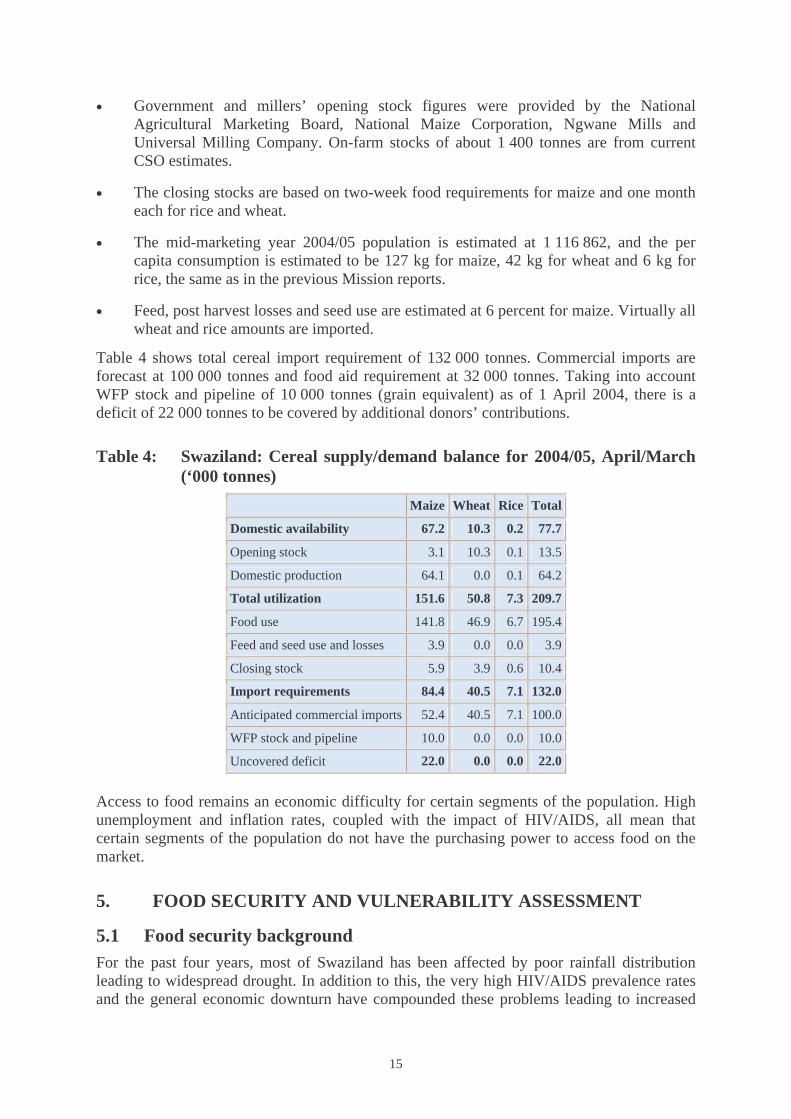
4.2 Cereal supply/demand balance, 2004/05 (April/March)The forecast of the cereal supply/demand situation for the marketing year 2004/05(April/March) in Table 4 is based on the following assumptions and Mission observations:
15
• Government and millers’ opening stock figures were provided by the NationalAgricultural Marketing Board, National Maize Corporation, Ngwane Mills andUniversal Milling Company. On-farm stocks of about 1 400 tonnes are from currentCSO estimates.
• The closing stocks are based on two-week food requirements for maize and one montheach for rice and wheat.
• The mid-marketing year 2004/05 population is estimated at 1 116 862, and the percapita consumption is estimated to be 127 kg for maize, 42 kg for wheat and 6 kg forrice, the same as in the previous Mission reports.
• Feed, post harvest losses and seed use are estimated at 6 percent for maize. Virtually allwheat and rice amounts are imported.
Table 4 shows total cereal import requirement of 132 000 tonnes. Commercial imports areforecast at 100 000 tonnes and food aid requirement at 32 000 tonnes. Taking into accountWFP stock and pipeline of 10 000 tonnes (grain equivalent) as of 1 April 2004, there is adeficit of 22 000 tonnes to be covered by additional donors’ contributions.
Table 4: Swaziland: Cereal supply/demand balance for 2004/05, April/March(‘000 tonnes)
Maize Wheat Rice Total
Domestic availability 67.2 10.3 0.2 77.7
Opening stock 3.1 10.3 0.1 13.5
Domestic production 64.1 0.0 0.1 64.2
Total utilization 151.6 50.8 7.3 209.7
Food use 141.8 46.9 6.7 195.4
Feed and seed use and losses 3.9 0.0 0.0 3.9
Closing stock 5.9 3.9 0.6 10.4
Import requirements 84.4 40.5 7.1 132.0
Anticipated commercial imports 52.4 40.5 7.1 100.0
WFP stock and pipeline 10.0 0.0 0.0 10.0
Uncovered deficit 22.0 0.0 0.0 22.0
Access to food remains an economic difficulty for certain segments of the population. Highunemployment and inflation rates, coupled with the impact of HIV/AIDS, all mean thatcertain segments of the population do not have the purchasing power to access food on themarket.
5. FOOD SECURITY AND VULNERABILITY ASSESSMENT
5.1 Food security backgroundFor the past four years, most of Swaziland has been affected by poor rainfall distributionleading to widespread drought. In addition to this, the very high HIV/AIDS prevalence ratesand the general economic downturn have compounded these problems leading to increased

16
levels of food insecurity. As a result of this, in July 2002, Swaziland was included in theWFP Regional Emergency Operational Plan (EMOP) which is currently still in operation. Atthe beginning of the EMOP in July 2002 144 000 beneficiaries were targeted for food aidincreasing to 265 000 at peak periods of food shortages in 2003.
The institution responsible for the coordination of emergency assistance is the NationalDisaster Task Force (NDTF), which comes directly under the Deputy Prime Ministers Office.To date, the Disaster Bill has not been ratified by parliament; there is thus no “official”government policy. Despite this, NDTF plays a key role in mobilizing resources andimplementing a coordinated response to the emergency by engaging in a dialogue withdonors and other senior members of the government.
In response to the drought at the beginning of the agricultural season, the governmentdeclared the situation a “National Disaster”. The consequence of this declaration and theoverall response among donors is not entirely clear at this point in time.
As part of the government’s response, the NDTF signed a bilateral agreement with WFP forthe donation of 4 491 tonnes of white maize, 343 tonnes of pulses, 200 tonnes of vegetableoil and US$963 225 for the purchase, transport and monitoring of 331 tonnes of pulses, 25tonnes of vegetable oil and 562 tonnes of corn-soya blend (CSB). Some 57 750 beneficiariesper month were assisted from October to December 2003 and 67 000 beneficiaries per monthfrom January to March 2004.
5.2 Methodology of assessmentThis assessment used a range of different sources of primary and secondary data. Primarydata was gathered when the mission (which included government and NGO staff) made a fiveday field visit to both high and low production areas. During this field visit, extensive semistructured interviews were carried with different members of the community which included,farmers, private traders, hospitals, government officials.
Secondary data was taken from a variety of sources, which included government reports fromdifferent ministries, UN agencies, and NGO reports. Mission members also had formal andinformal meetings with government officers, UN/NGO staff, private trading companies andmembers of the Swazi VAC.
The VAC exercise was still in process at the time of the mission and there was theopportunity to cross check and verify preliminary VAC information. Final findings from theVAC assessment were available only after the mission had left the country. The results of thefood gap analysis undertaken by the VAC are the basis of the food aid requirements in thismission report.
5.3 Vulnerability and coping mechanismsThere is no doubt that food insecurity in Swaziland is the result of long-term chronicstructural decline; the situation is not transitory and is not likely to disappear after one or twoseasons of favourable rainfall. Economic decline has locked large sections of the populationof Swaziland into a downward spiral of poverty and food insecurity for the long term.
A combination of different but interrelated factors are increasing the vulnerability to foodinsecurity for large groups of Swazis. The underlying cause of this “creeping vulnerability” isgeneral poverty, which continuously erodes livelihoods and the capacity of households tocope with the frequency of shocks such as drought and higher prices. Poverty results from a

17
combination of factors such as the overall decline in cereal production, reduced employmentopportunities, both domestically and in neighbouring South Africa (in particular in themining sector), inflation and the impact of the HIV/AIDS pandemic. In some areas there islittle diversity in agricultural production and income sources, which further increases the riskto shocks and reduces the households ability to cope.
Some of the main issues related to general poverty vis-à-vis food insecurity are outlinedbelow.
Income-earning opportunities
There is no doubt that the lack of income-earning opportunities is probably the biggest factorfor the increasing vulnerability to food insecurity. Although there is some variation betweendifferent agro-ecological zones, the vast majority of the rural poor gain access to food byearning income. Depressed domestic and foreign (South Africa) labour markets haveseriously eroded purchasing power for basic food needs in Swaziland. For example, the 2004VAC reports that from 1995 to 2001 employment was reduced by 54 percent in the SouthAfrican mining sector. The vast majority of the poorer Swazis earn income from farm labour.With the overall decline in agricultural production of both food and cash crops, employmenthas shrunk, thereby reducing income levels. The impact of the depressed labour market hasbeen the greatest in the Lowveld areas, which rely more on buying power for food supplies incomparison with the other, more fertile areas where food can be grown.
The recent 2004 VAC also identified stress in the labour market in the traditionally morewell-to-do areas of the Highveld, with increasing unemployment in the timber and textilesectors, leading to loss livelihoods in these areas. The Mission also learned of possible layoffsin the textile sector, which could number 30 000 people; however, at the time of writing thiscannot be confirmed.
The livestock sector has been hard hit by prolonged drought which had diminished the qualityof pastures at the end of 2003. According to the VAC, the MoAC Veterinary department setsthe mortality figure at 4 260 head between late 2003–early 2004. The loss of livestock hasbeen more severe in the Lowveld and dry Middleveld than in other zones. The MoACstatistics show long-term losses of both cattle and goats in the Lowveld areas. For example,the number cattle fell 27 percent between 2001 and 2002, These losses affect households inthe Lowveld areas more, because they are depend more on livestock sales and other productsthan do the other zones. In addition, the poor condition of draught animals during the land-preparation period (October to December) reduced the availability of animal traction. Againthis would have affected the poorer households in the Low Veld areas as they have fewerresources for hiring tractors. In support of the depressed livestock situation, the VAC alsoreports that milk deliveries are down about 30 percent and the average weight of cattleslaughtered is the second lowest since1995.
Prices
The impact of price rises in staples (maize) contributes significantly to access to food at ahousehold level, especially the poor. Maize meal prices during 2002/3 were 45 percent higherthan the 5 year average. Recent SVAC analysis has shown that prices for maize meal arehigher in the areas that have been hit by lower production, such as the Lowveld, than in themore productive areas of the Highveld.
There has been a significant price differential between the formal and informal market and ithas meant farmers who produced a surplus from the 2003 harvest have also been negatively

18
affected by the low prices offered by the National Maize Cooperation (NMC), which isbuying maize at prices below the informal market value. The Mission found manyhouseholds in the Highveld and Wet Middleveld with maize stocks from last year’sproduction. The CSO has estimated carryover stocks of 14 000 tonnes at the national level,although this figure remains unconfirmed. It is likely that these stocks belong to the better offhouseholds and not those who are vulnerable to the shocks of poor production and higherprices and therefore carry over stocks from last year would be ‘speculative’ in the hope ofbetter prices.
Coping strategies
Although vulnerability to food insecurity is increasing, there are no obvious signs of the moretraditional coping strategies being employed. Indeed, rather than disposing of key assets,households are maintaining their asset base. For example, although there is a generalreduction in livestock numbers at the household level, the livestock market appears stable,with the price of livestock rising in different areas of the country. From interviews anddiscussions it was acknowledged the role of food aid has contributed to this stability.
“Gifts” and other community support play an important role in the ability of households tocope with falling livelihoods. It is important to mention that this type of coping strategy isincreasingly growing scarcer. The 2004 SVAC reports that there is only 30–40 percent of thenormal amount of gift-giving across the different livelihood zones, indicating that the normalredistribution process on which communities rely is under stress.
Permanent migration rates are also stable. Although there are some anecdotal reports ofhouseholds moving to the Highveld areas in search of better land, these are negligible and itappears that the overall the population is remaining in place.
The mission was also made aware of the increasing burden on families to pay for school feesand the high cost of health care. In the case of orphans the burden is on the extended family.The average school fee per child is around E300, which, for a poor family in the worseaffected areas is a considerable outlay. Where school feeding programmes have beeninitiated, some of the financial responsibility has been alleviated with the result that schoolattendance has increased.
HIV/AIDS
As mentioned in the previous sections, HIV/AIDS is affecting food security at the householdlevel in different ways. However, just how and to what extent it is affecting agriculturalproduction is difficult to gauge. An SVAC study to assess the demographic impact ofHIV/AIDS in Swaziland carried out in 2003 concluded that it was difficult to determinestrong connections between household with people living with AIDS and reduction in areaplanted, inputs used and yields achieved. However, there was a tendency to be more“protective” of tubers as households tended to shift away from cash crop production into lesslabour-intensive types of cultivation. In contrast, a recent study carried out by the SwazilandMinistry of Agriculture and Cooperatives (MOAC et. al., 2003), reported that area undercultivation was reduced by an average 51 percent for a households with an AIDS-relateddeath as opposed 15.8 percent for a non-AIDS-related death.
From Mission observations, it is very difficult to disentangle the impact of HIV/AIDS onfood security with other livelihood issues. While many households visited acknowledged theprevalence of chronic illness, no household explicitly claimed that illness was a major cause

19
for reduced crop production. Instead they accused the drought and low producer prices asmajor causes of reduced crop production.
Brief description of the main vulnerability indicators/findings by agro-ecological zone ispresented in the Appendix.
5.4 Estimation of population in need and emergency food aidrequirements
CFSAM estimates of food aid requirements for 2004/5 are based on the VAC analysis andverified by field work carried out during the mission. The key findings of the VAC across themost affected livelihood zones are summarised as
• Food crop production is between 30-60 percent of normal
• Grazing and livestock condition is 60-90 percent of normal
• Cash crop production is 20-60 percent of normal
• Employment opportunities are 25-75 percent of normal and
• Food price is 25 percent above normal
The cumulative affect of these factors results in a projection that a total of 262 000 peoplewill face food/income deficits of varying amounts and that approximately 28 355 tonnes offood (or income equivalent) will be needed to meet the deficit for the entire year. Table 5shows the number of “poor” people estimated as having a deficit and therefore requiringassistance by zone.
Table 5: Food aid requirements by livelihood zones
Livelihood zone Affected ‘poor’ population Tonnes
Highveld 12 312 342
Timber Highlands 28 050 7178
Periurban 22 010 1907
Wet Middleveld 60 480 3620
Dry Middleveld 64 800 4991
Lowveld Cattle, Cotton and Maize 45 530 7464
Lowveld Cattle and Cotton 21 120 1710
Lomahasha Trading 7 260 1112
Lubombo Plateau 644 12
TOTAL 262 226 28 335
Target population
It should be noted that these are annual needs and therefore further monitoring and analysis isrequired to identify the target populations in the geographic areas as well as socioeconomic orspecific vulnerable groups. The Swazi VAC has developed profiles of the poor householdsand these should be used to better identify the poor households, and households in the other
20
wealth groups which have also been affected, and to determine appropriate rations and /ortiming of an intervention to address the deficit. These are:
• households which have been affected by the poor agricultural season, have noemployment and no livestock.
• Households with chronically ill members in the family, child or female-headedhouseholds should be selected for assistance.
• households that have been forced or will be forced to sell crucial assets (tools, takingchildren out of school, etc.) in return for food, which will leave them more vulnerableand less equipped to confront crises in the future. The intention will be to preservehouseholds’ livelihoods.
5.5 Possible strategies for food assistanceIt has been widely acknowledged that the two most recent EMOPS in Swaziland have avertedmajor catastrophe, providing an immediate source of food that helped preserve livelihoodassets and kept the situation stable. As reflected elsewhere in the report, the overall foodsecurity situation is more precarious now than last year, and to that end targeted reliefassistance will be necessary in the foreseeable future. The distribution of food throughgeneral, or free, distributions should be limited where ever possible. A more targetedapproach, for example for specific vulnerable groups and households, should be adoptedinstead. At the same time, food aid could be used to encourage more development-typeactivities to help contribute to the restoration of livelihoods. The Protracted Relief andRehabilitation Operation due to start in January provides an excellent opportunity andframework for undertaking these types of initiatives.
Targeting
On the whole, the Mission observed that the targeting of relief assistance was adequate.However, the common understanding between different stakeholders is that there is room forimprovement. From field observations during the Mission, there some cases of inclusivity(people received food when they did not need it) and exclusivity (people with needs for fooddid not receive any. Well-established, gender-balanced relief committees need to bestrengthened with more training and awareness regarding their roles and responsibilities withregard to targeting to reduce targeting error. Food-for-work activities can help create asituation of “self-targeting”.
Necessity for a participatory approach
All activities should be based on as much community participation as possible. Communitiesshould be fully aware from the start that they are undertaking activities for a developmentalpurpose. Participatory monitoring approaches should also be developed wherebycommunities scrutinize their own activities and help plan the future of the project.
Types of activities
• The Indlunkhulu, supported by NERCHA, WFP and FAO (technical assistance), is asuccessful example of sustainable approaches to assisting orphan-headed householdsand other labour-stressed households with PLWA. This project could be replicated inother Chiefdoms with additional support from the FAO through emergency funding.
21
The Mission observed some good examples of Indlunkhulu chiefdom fields in theSipofaneni areas.
• Selective feeding for specific vulnerable groups, including provision of food to childrenunder five who are malnourished; HIV-positive pregnant and lactating women for theprevention of mother-to-child HIV transmission; home-based care for HIV/AIDSpatients receiving or about to receive anti-retroviral treatment.
• School-feeding programmes, with the provision of high-energy foods such as corn-soyablend (CSB) in the most food insecure areas are recommended as a form of targetedassistance. However, in addition to nutritional support, the schools can also be involvedin launching school gardens. As the number of orphans who head households as a resultof HIV/AIDS deaths of adults is extremely high, generations of children are growing upwithout having learned the agricultural experience and skills of their parents.Development of good quality school gardens and plant nurseries can be a way for thesechildren to learn the necessary techniques of good agriculture.
• Conservation farming for dry-land areas is an intervention that uses food-for-work asan incentive. It has been successful in other parts of the sub region, such as Zambia. Inthis integrated approach to farming, farmers are encouraged to prepare land for plantinga mixture of cereal, legume and cash crops that not only provides income but alsoincreases yields and soil fertility. In Swaziland, FAO has been supporting these types ofactivities through the COSPE project. Linkages and experiences from these types ofprogrammes from different areas should be disseminated widely.
• Food-for-training is a very useful entry point into communities. As was recommendedin the 2003 FAO/WFP CFSAM to Swaziland, food can be provided as an incentive forfarmers to attend training programmes that encourage a wide range of improvedagricultural practices. These could include the promotion of sorghum for drier areas,cultivation of multi purpose legume crops such as cow pea and pigeon pea, andencouraging improved post-harvest crop storage practices.

22
APPENDIX
Main Vulnerability Indicators/Findings by agro-ecological zone
Highveld
Lubombo PlateauLivelihood patterns: Although this zone is located close to the Mozambique border,livelihoods are based around casual employment and cash crop production of cotton andother root crops such as sweet potato. The poorer groups are highly dependant on cashpurchase to meet food needs, while the more wealthy groups produce about 50 percent oftheir food needs.
Current season status: Although rainfall is above average, very poor production expected inthis area due to delayed planting. Food prices have also risen by about 20 percent. Lateseason flooding has effected the legume production considerably. Traditional root crops havealso been affected by the erratic nature of the rainfall High levels of unemployment at 50-75percent in the agricultural sector; in particular sugar and cotton have reduced income levelsfor poorer groups. Prices of food and livestock have risen by 20 and 40 percent.
This report has been prepared by Shukri Ahmed and Noel Beninati,Alex Carr and Owen Calvert under the responsibility of the FAO andWFP Secretariats with information from official and other sources.Since conditions may change rapidly, please contact the undersignedfor further information if required.
Henri JosserandChief, GIEWS, FAO
Fax: 0039-06-5705-4495E-mail: [email protected]
Mike SackettRegional Director, ODJ, WFP
Fax: 0027-11-5171642E-mail [email protected]
Please note that this Special Report is also available on the Internetas part of the FAO World Wide Web (www.fao.org) at the followingURL address: http://www.fao.org/giews/
The Special Alerts/Reports can also be received automatically by E-mail as soon as they are published, by subscribing to theGIEWS/Alerts report ListServ. To do so, please send an E-mail to theFAO-Mail-Server at the following address:[email protected], leaving the subject blank, with thefollowing message:
subscribe GIEWSAlertsWorld-L
To be deleted from the list, send the message:
unsubscribe GIEWSAlertsWorld-L
Please note that it now possible to subscribe to regional lists to onlyreceive Special Reports/Alerts by region: Africa, Asia, Europe orLatin America (GIEWSAlertsAfrica-L, GIEWSAlertsAsia-L,GIEWSAlertsEurope-L and GIEWSAlertsLA-L). These lists can besubscribed to in the same way as the worldwide list.

23
ENDNOTES
1 South Africa’s maize crop is expected to fall to 7.9 million tonnes in 2004/05 from the 9.7 million tonnesreached in 2003/04 due to a reduction in planted area.
2 Swaziland’s currency, the Lilangeni – pegged at par with the South African Rand – was trading as of early-June 2004 at US$ 1 = E6.5.
3 The US Census Bureau forecasts zero population growth in 2004.4 Based on recent demographic survey carried out by CSO and partners.5 The National Agricultural Marketing Board (Namboard) is a government authority whose main function is to
control the quantity imported of selected agricultural products through the issuing of permits.6 In this year’s Budget Speech (March 2004), the Government announced that Namboard is in the process of
being restructured by leasing out its business units, whilst retaining the statutory division as its corebusiness.


