Market summaries FOOD OUTLOOK MAY 2014 World oilseed production is forecast to rise to an all-time high in 2013/14, allowing output of meals and oils to expand at above-average rates. An important exception is palm oil, which may be subject to a significant slowdown in production growth. With regard to domestic availabilities, most of the key producing/exporting countries are forecast to see significant year-on-year improvements, except the United States, where supply is constrained by low carry- in stocks. Global consumption of both oils and meals is set to continue expanding, stimulated by higher supplies and driven by growing demand in developing countries in Asia. However, global meal consumption could grow less than anticipated, given unexpectedly firm international meal prices and improved global availability of maize. As for vegetable oils, additional demand from the biodiesel sector is expected to contribute to consumption growth. As the world supply and demand situation improves, world stocks, especially of oilmeals, are expected to be replenished. However, this will not apply to soymeal inventories in the United States, which are projected to continue falling, dragging the country’s stock-to- use ratio to an all-time low. As for oils/fats, the global stock-to-use ratio is estimated to recover only partially from last season’s low level. The recent appreciation of vegetable oil prices and the continued firmness in meal values have to be seen against this background. Concerning trade, global transactions in oils/fats are expected to grow only moderately, while trade in meals/ cakes is set to increase sharply. With South America’s record soybean crop finally entering the market and a likely slowdown in China’s import demand, the global supply and demand situation for oilseed and meals should ease substantially in the coming months. By contrast, the outlook for vegetable oil markets remains mixed. OILCROPS Contact: [email protected]FAO - Trade and Markets Division Food Outlook May 2014
Transcript
Market sum
maries
FOOD OUTLOOKMAY 2014
World oilseed production is forecast to rise to an all-time high in 2013/14, allowing output of meals and oils to expand at above-average rates. An important exception is palm oil, which may be subject to a significant slowdown in production growth.
With regard to domestic availabilities, most of the key producing/exporting countries are forecast to see significant year-on-year improvements, except the United States, where supply is constrained by low carry-in stocks.
Global consumption of both oils and meals is set to continue expanding, stimulated by higher supplies and driven by growing demand in developing countries in Asia. However, global meal consumption could grow less than anticipated, given unexpectedly firm international meal prices and improved global availability of maize. As for vegetable oils, additional demand from the biodiesel sector is expected to contribute to consumption growth.
As the world supply and demand situation improves, world stocks, especially of oilmeals, are expected to be replenished. However, this will not apply to soymeal inventories in the United States, which are projected to continue falling, dragging the country’s stock-to-use ratio to an all-time low. As for oils/fats, the global stock-to-use ratio is estimated to recover only partially from last season’s low level. The recent appreciation of vegetable oil prices and the continued firmness in meal values have to be seen against this background. Concerning trade, global transactions in oils/fats are expected to grow only moderately, while trade in meals/cakes is set to increase sharply.
With South America’s record soybean crop finally entering the market and a likely slowdown in China’s import demand, the global supply and demand situation for oilseed and meals should ease substantially in the coming months. By contrast, the outlook for vegetable oil markets remains mixed.
FAO - Trade and Markets DivisionFood Outlook May 2014
31FOOD OUTLOOKMAY 2014
OILC
RO
PS, O
ILS AN
D M
EA
LS
1 Almost the entire volume of oilcrops harvested worldwide is crushed to obtain oils and fats for human nutrition or industrial purposes, and to obtain cakes and meals which are used as feed ingredients. Therefore, rather than referring to oilseeds, the analysis of the market situation is mainly undertaken in terms of oils/fats and cakes/meals. Hence, production data for oils (cakes) derived from oilseeds refer to the oil (cake) equivalent of the production estimates for the relevant oilseeds, i.e. they do not reflect the outcome of actual oilseed crushing. Furthermore, the data on trade in and stocks of oils (cakes) refer to the sum of trade in and stocks of oils (cakes) plus the oil (cake) equivalent of oilseed trade and stocks.
2 For details on prices and corresponding indices, see Statistical Tables section, table 24.
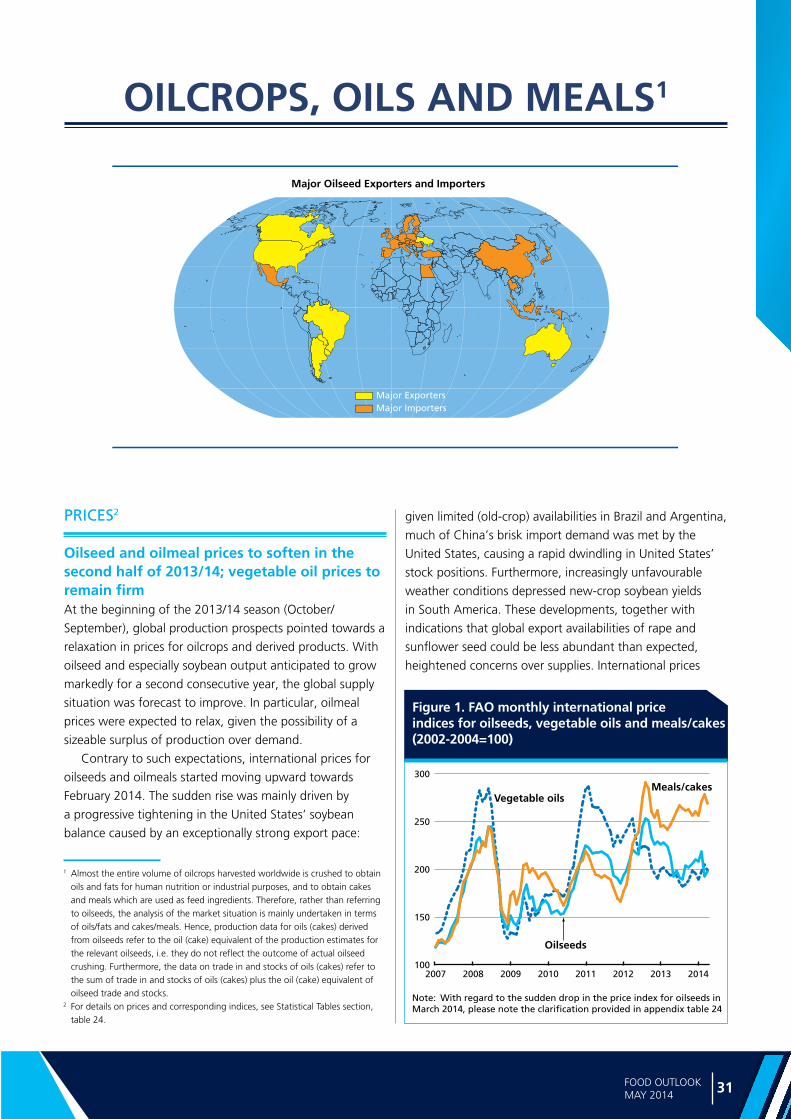
Major Oilseed Exporters and Importers
Major ExportersMajor Importers
Figure 1. FAO monthly international price indices for oilseeds, vegetable oils and meals/cakes (2002-2004=100)
100
150
200
250
300
20142013201220112010200920082007
Meals/cakesVegetable oils
Oilseeds
Note: With regard to the sudden drop in the price index for oilseeds inMarch 2014, please note the clarification provided in appendix table 24
OILCROPS, OILS AND MEALS1
PRICES2
Oilseed and oilmeal prices to soften in the second half of 2013/14; vegetable oil prices to remain firmAt the beginning of the 2013/14 season (October/
September), global production prospects pointed towards a
relaxation in prices for oilcrops and derived products. With
oilseed and especially soybean output anticipated to grow
markedly for a second consecutive year, the global supply
situation was forecast to improve. In particular, oilmeal
prices were expected to relax, given the possibility of a
sizeable surplus of production over demand.
Contrary to such expectations, international prices for
oilseeds and oilmeals started moving upward towards
February 2014. The sudden rise was mainly driven by
a progressive tightening in the United States’ soybean
balance caused by an exceptionally strong export pace:
given limited (old-crop) availabilities in Brazil and Argentina,
much of China’s brisk import demand was met by the
United States, causing a rapid dwindling in United States’
in South America. These developments, together with
indications that global export availabilities of rape and
sunflower seed could be less abundant than expected,
heightened concerns over supplies. International prices
Ma
rke
t a
sse
ssm
en
ts
32 FOOD OUTLOOKMAY 2014
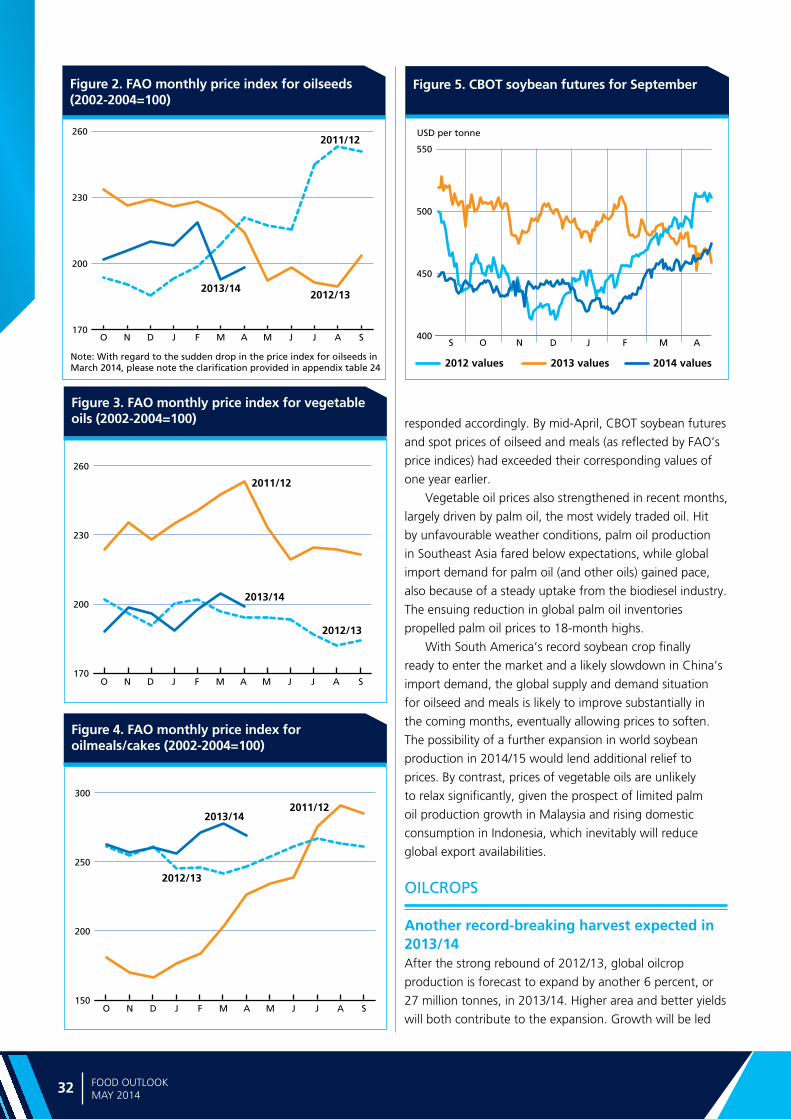
Figure 5. CBOT soybean futures for SeptemberFigure 2. FAO monthly price index for oilseeds (2002-2004=100)
Figure 3. FAO monthly price index for vegetable oils (2002-2004=100)
Figure 4. FAO monthly price index for oilmeals/cakes (2002-2004=100)
170
200
230
2602011/12
2012/132013/14
Note: With regard to the sudden drop in the price index for oilseeds inMarch 2014, please note the clarification provided in appendix table 24
SAJJMAMFJDNO
170
200
230
260
2012/13
2011/12
2013/14
SAJJMAMFJDNO
150
200
250
300
2011/12
2012/13
2013/14
SAJJMAMFJDNO
400
450
500
550
USD per tonne
S O N D J F M A
2012 values 2013 values 2014 values
responded accordingly. By mid-April, CBOT soybean futures
and spot prices of oilseed and meals (as reflected by FAO’s
price indices) had exceeded their corresponding values of
one year earlier.
Vegetable oil prices also strengthened in recent months,
largely driven by palm oil, the most widely traded oil. Hit
by unfavourable weather conditions, palm oil production
in Southeast Asia fared below expectations, while global
import demand for palm oil (and other oils) gained pace,
also because of a steady uptake from the biodiesel industry.
The ensuing reduction in global palm oil inventories
propelled palm oil prices to 18-month highs.
With South America’s record soybean crop finally
ready to enter the market and a likely slowdown in China’s
import demand, the global supply and demand situation
for oilseed and meals is likely to improve substantially in
the coming months, eventually allowing prices to soften.
The possibility of a further expansion in world soybean
production in 2014/15 would lend additional relief to
prices. By contrast, prices of vegetable oils are unlikely
to relax significantly, given the prospect of limited palm
oil production growth in Malaysia and rising domestic
consumption in Indonesia, which inevitably will reduce
global export availabilities.
OILCROPS
Another record-breaking harvest expected in 2013/14After the strong rebound of 2012/13, global oilcrop
production is forecast to expand by another 6 percent, or
27 million tonnes, in 2013/14. Higher area and better yields
will both contribute to the expansion. Growth will be led
33FOOD OUTLOOKMAY 2014
OILC
RO
PS, O
ILS AN
D M
EA
LS
Note: The split years bring together northern hemisphere annual crops harvested in the latter part of the first year shown, with southern hemisphere annual crops harvested in the early part of the second year shown. For tree crops, which are produced throughout the year, calendar year production for the second year shown is used.
2011/12 2012/13estim.
2013/14 f’cast
Change 2013/14
over 2012/13
million tonnes %
Soybeans 240.0 267.2 281.3 +5.3
Rapeseed 61.7 64.3 71.5 11.3
Cottonseed 47.6 45.6 44.1 -3.3
Groundnuts (unshelled) 37.1 38.1 39.4 3.6
Sunflower seed 39.0 35.6 41.3 15.9
Palm kernels 13.3 13.9 14.5 4.6
Copra 6.0 5.9 5.6 -4.5
Total 444.8 470.6 497.9 5.8
Table 1. World production of major oilcrops
by soybeans, the production of which is forecast rise by 5
percent compared to 2012/13. In the Northern Hemisphere,
where the 2013/14 season crops were harvested in
calendar 2013, aggregate soybean output has risen by
about 5 million tonnes, under the lead of the United States,
which remains the world’s top producer. In the United States, soy plantings dropped slightly, but yields soared
to record levels thanks to beneficial weather conditions,
thus allowing production to recover from the last two
season’s poor levels. In China, production continued to
shrink following additional cuts in area planted. India’s production declined despite record plantings, as excessive
monsoon rains slashed yields. In the Southern Hemisphere,
notably South America, the soybean harvest is now in full
swing. Thanks to a further expansion in area harvested,
the region’s total production should climb to a new record.
During the growing season, production forecasts for the
region went through several downward corrections, as
crops suffered from poor weather, which pushed yields
below potential. Still, Brazil and Argentina are both set
to harvest record crops, with aggregated output up 8–9
million tonnes from last year. In Paraguay and Uruguay,
however, prolonged spells of dry weather may lead to a
slight drop in production.
Significant improvements are also expected for
rapeseed and sunflowerseed. Global rapeseed production
is estimated to expand by an above-average 11 percent,
following near-ideal weather conditions in several key
producing countries, especially in Canada, the United States, Ukraine and the Russian Federation, but also
in the EU, India and China. While higher plantings in
some countries also contributed to the rise in production,
the area harvested in Canada actually dropped compared
to the previous year. By contrast, Australia reported
a reduction in both area and yields. Sunflowerseed is
expected to see a steep recovery in global production
(up 16 percent year-on-year), as countries hit by adverse
weather conditions last season – notably Ukraine, the
Russian Federation and the EU – benefitted from very
good growing conditions this season, allowing production
to rise to all-time highs, especially in the Black Sea region.
By contrast, Argentina reported a third consecutive drop in
sunflowerseed output on account of both lower plantings
and adverse weather. World groundnut output is also
expected to expand, owing to a strong rebound in India and additional production gains in China, which should
offset a drop in the United States. Further growth is also
expected in palmkernel, reflecting continued expansion
in mature oil palm area in Southeast Asia, particularly in
Indonesia.
By contrast, cottonseed and copra production are both
set to fall by 3–4 percent this season. For cottonseed, a
higher outturn in India will not be sufficient to compensate
for marked declines in the United States and China. As
for copra, this year’s global output is set to fall as a result
of Typhoon Haiyan, which inflicted serious damage on
coconut palms in the Philippines.
OILS AND FATS3
Growth in global oils/fats supplies to rebound Current crop forecasts for 2013/14 should translate into
a 6-percent increase in global oils/fats production after
two seasons of below-average growth. The expected rise
is mostly driven by the good outturn of several high oil-
yielding crops (rapeseed, sunflowerseed and groundnut),
in addition to the all-time record in soybeans. Production
of palm and palmkernel oil, which together account for
about one-third of global oil supplies, is also anticipated to
expand, although this year’s growth rate could fall behind
that of recent years. In Malaysia, where prolonged dry
weather has stressed oil palms, possibly affecting their
productivity in the forthcoming months, production is
tentatively forecast to rise by some 300 000 tonnes, or 2
percent, compared to over 4 percent on average during
the last three years. By contrast, in Indonesia, production
looks set to rise by at least 2 million tonnes, or 7 percent,
primarily on further growth in mature palm oil area.
Global oils/fats supplies (comprising 2013/14 production
and 2012/13 ending stocks) are forecast to increase by
3 This section refers to oils from all origins, which – in addition to products derived from the oil crops discussed under the section on oilseeds – include palm oil, marine oils as well as animal fats.
Ma
rke
t a
sse
ssm
en
ts
34 FOOD OUTLOOKMAY 2014
1 Refer to footnote 1 on page 31 for overall definitions and methodology.2 Includes oils and fats of vegetable, animal and marine origin.3 Production plus opening stocks.4 Residual of the balance.5 Trade data refer to exports based on a common October/September
marketing season.6 Major exporters include Argentina, Brazil, Canada, Indonesia,
Malaysia,Ukraine and the United States.7 All meal figures are expressed in protein equivalent; meals include all meals
and cakes derived from oilcrops as well as meals of marine and animal origin.8 Major exporters include Argentina, Brazil, Canada, India, Indonesia, Malaysia,
Paraguay, Ukraine and the United States.
Table 2. World oilcrops and product market ata glance1
2011/12 2012/13 estim.
2013/14 f’cast
Change: 2013/14
over 2012/13
million tonnes %
TOTAL OILCROPS
Production 455.9 481.9 509.4 5.7
OILS AND FATS 2
Production 184.6 189.4 201.1 6.2
Supply 3 216.0 221.6 232.7 5.0
Utilization 4 184.1 189.4 198.0 4.6
Trade 5 98.2 102.3 105.4 3.1
Global stock-to-use ratio (%) 17.5 16.7 17.3
Major exporters stock-to-disappearance ratio (%) 6
10.3 9.0 9.6
MEALS AND CAKES 7
Production 111.3 119.6 126.9 6.1
Supply 3 132.4 137.2 145.0 5.7
Utilization 4 116.4 117.8 121.9 3.4
Trade 5 72.9 73.3 79.8 8.8
Global stock-to-use ratio (%) 15.2 15.4 18.0
Major exporters stock-to-disappearance ratio (%) 8
5.9 7.9 9.6
FAO PRICE INDICES (Oct/Sept) (2002-2004=100)
2011/12 2012/13 2013/14 Oct-Apr
Change: Oct-Apr 2013/14
overOct-Apr 2012/13
%
Oilseeds 214 213 205 -9.2
Oilmeals/cakes 219 255 265 5.5
Vegetable oils 232 193 196 -0.6
5 percent year-on-year – about double the rate achieved
last season. Thanks to record crops, domestic availability
of oils/fats is expected to improve strongly in several major
producing countries, notably Canada, Ukraine and the
Russian Federation, but also in Argentina, Brazil, China, the EU, India and Indonesia. By contrast, domestic
supplies may shrink in Malaysia and the Philippines. In
the United States, due to extremely low opening stocks,
total supplies are estimated to increase by merely 2 percent,
recovering only partially from the exceptional drop of the
last two seasons.
Biodiesel industry to contribute to growth in global oils/fats consumptionAfter last season’s poor growth, a rebound in global oils/fats
consumption is forecast for 2013/14. Relatively low prices,
continued economic growth in several countries in Asia and
rising use of oils/fats as biodiesel feedstock are expected to
stimulate demand. Total consumption is currently estimated
to expand by nearly 9 million tonnes, or 5 percent.
With regard to individual oils/fats, palm oil should
contribute less than usual to total expansion in utilization,
mirroring the modest growth in supplies, which has led to a
lower than usual price discount of palm oil relative to other
vegetable oils. Conversely, soy, rape and sunflowerseed oil
are expected to play a more important role in this year’s
consumption rise.
Country-wise, developing nations in Asia are again set
to drive global consumption growth, in particular, China,
India and Indonesia. While in China, oils/fats consumption
growth could slow down compared to past years, in
Indonesia, it is forecast to surge by 2.3 million tonnes,
as more palm oil is absorbed by the country’s biodiesel
industry following the introduction of ambitious mandatory
consumption targets. Demand in Malaysia is also likely
to strengthen, following a nationwide implementation
of higher biodiesel blending rates starting in July 2014.
In the EU, the world’s second largest consumer after
China, a rebound in oils/fats consumption seems likely,
underpinned by higher demand from biofuel producers,
as overseas biodiesel purchases remain constrained by
anti-dumping duties. By contrast, in the United States,
continued tightness in domestic soybean supplies and a
possible stagnation in demand from the biodiesel sector
are expected to limit year-on-year growth in oils/fats
consumption to 1 percent. Demand from the United States
biodiesel producers will depend on the final decision on
this year’s mandatory blending volumes and on whether
or not the blender’s tax credit is going to be renewed.
In Argentina, biodiesel production – and thus demand
for soyoil as fuel feedstock – could shrink for the second
consecutive year as the country’s biodiesel exports continue
to be hindered by the EU’s import restrictions. The impact
of the recently raised domestic blending mandates on
Argentina’s consumption might also be limited because,
at the prevailing government-set prices, production of
biodiesel for the domestic market is said to be unprofitable.
Similarly, in Brazil, demand from the biodiesel sector is not
expected to expand significantly this season, given that the
government again postponed the shift to higher mandatory
blending rates.
35FOOD OUTLOOKMAY 2014
OILC
RO
PS, O
ILS AN
D M
EA
LS
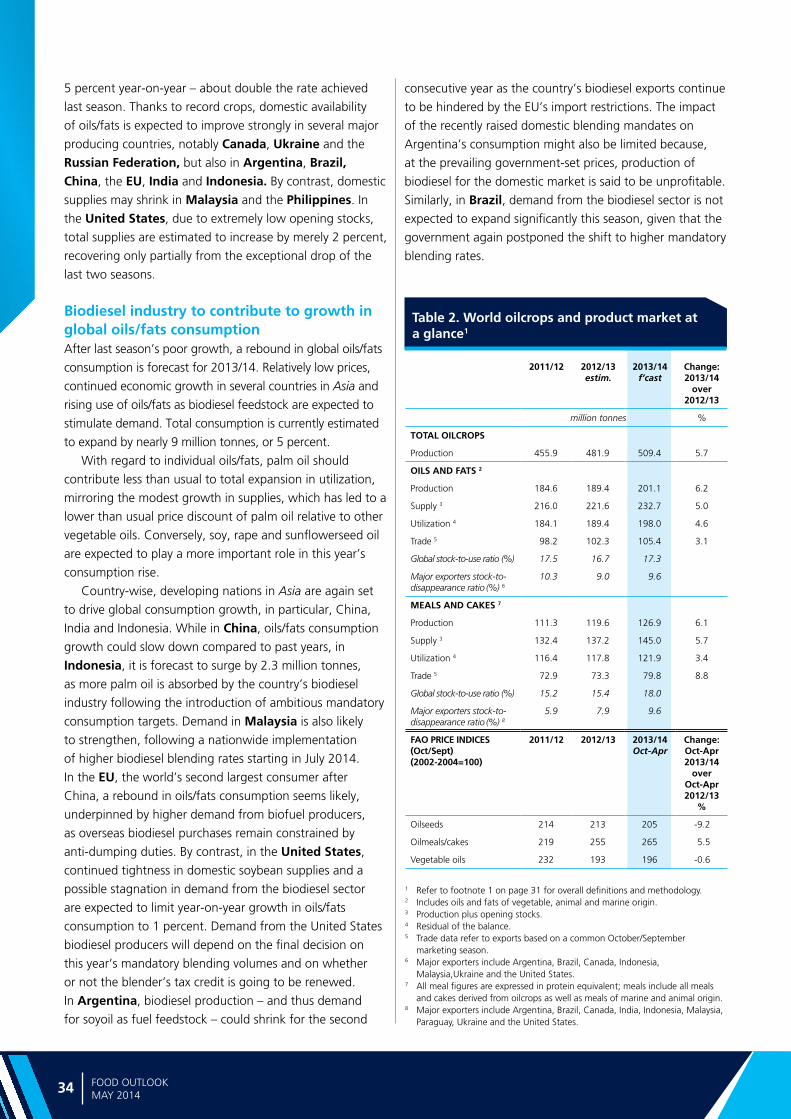
Figure 7. World stocks and ratios of oils/fats (including the oil contained in seeds stored)
0
10
20
30
40
2013/142012/132011/122010/112009/106
9
12
15
18
Million tonnes Percent
Major Exporters Rest of the World
World Stock-to-use ratioStock-to-disappearance ratio of Major Exporters
estim. f’cast
Figure 6. Global production and utilizationof oils/fats
-6
-3
0
3
6
165
175
185
195
205
2013/142012/132011/122010/112009/10
Million tonnes Million tonnes
estim. f’cast
Balance (production minus utilization, right axis)
Production (left axis) Utilization (left axis)
Stock-to-use ratio to recover in 2013/14 Based on the above supply and demand forecasts,
global 2013/14 closing stocks (which comprise oils/fats
inventories plus the oil contained in stored oilseeds) are
forecast to grow by about 9 percent – making up for last
season’s decrease. Larger global inventories of soybean,
rape and sunflowerseed (and their respective oils) should
more than offset a likely reduction in palm oil stocks.
Rapeseed oil inventories are expected to swell to an all-time
high, with Canada and China recording the strongest
rises. In Canada, the pile-up is related to bottlenecks in
the country’s rail transportation, which have seriously
hampered export flows. Regarding soy, the projected rise
in global inventories concerns principally China, Argentina
and Brazil. In the United States, where efforts have
Figure 8. Oil/fat imports by region or major country (including the oil contained in seed imports)
0
10
20
30
40
2013/142011/122009/102007/082005/06
Latin America
Asia excl. China (total) Europe
China (total)
Million tonnes
United States & Canada Africa
f’cast
concentrated on meeting exports demand, inventories
should remain close to last season’s depressed level. In the
case of palm oil, the anticipated shortfall in production is
likely to result in a drawdown in stocks in Indonesia and
Malaysia.
Despite the projected sizeable increase in global
inventories, the world stock-to-use ratio for oils/fats may
recover only partially from the low level recorded last
season. An even more modest recovery is expected in
the stock-to-disappearance ratio of the major exporting
countries4, which helps explain why international prices for
oils/fats trended upward in recent months.
Trade in oils/fats to expand moderatelyExpansion in global oils/fats trade (including the oil
contained in traded oilseeds) should be limited to 3 percent
this season. Sluggish consumption growth in a number
of key importing countries and the possibility of firming
international oil and oilseed prices foreshadow a slow
expansion in trade. Falling import requirements in the EU
and slower expansion of imports by China and India –
the world’s three leading importers – are mostly behind
the anticipated deceleration in world trade. In all three
destinations, abundant domestic supplies are foreseen to
weaken import demand.
With respect to exports, large availabilities of soy,
sunflower and rapeseed oil should make up for a
reduction in global shipments of coconut, palmkernel
4 Argentina, Brazil, Canada, Indonesia, Malaysia, Ukraine and the United States.
Ma
rke
t a
sse
ssm
en
ts
36 FOOD OUTLOOKMAY 2014
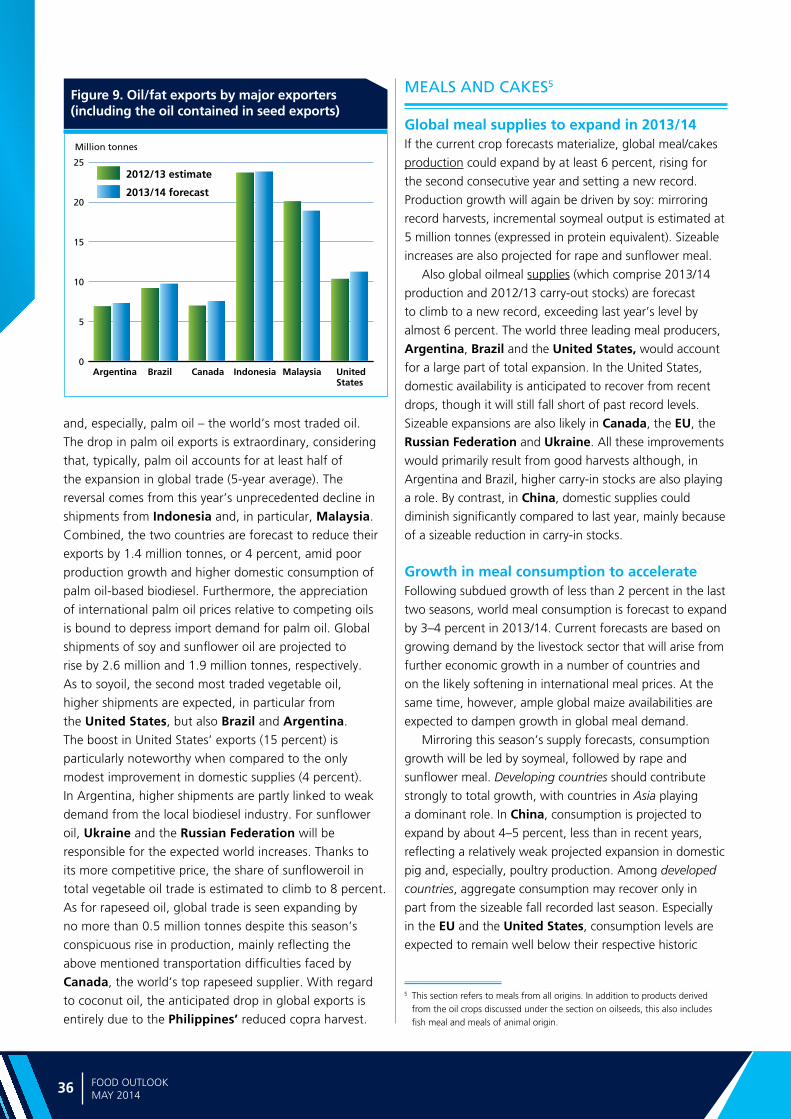
Figure 9. Oil/fat exports by major exporters (including the oil contained in seed exports)
0
5
10
15
20
252012/13 estimate
2013/14 forecast
Million tonnes
UnitedStates
IndonesiaCanada MalaysiaArgentina Brazil
and, especially, palm oil – the world’s most traded oil.
The drop in palm oil exports is extraordinary, considering
that, typically, palm oil accounts for at least half of
the expansion in global trade (5-year average). The
reversal comes from this year’s unprecedented decline in
shipments from Indonesia and, in particular, Malaysia.
Combined, the two countries are forecast to reduce their
exports by 1.4 million tonnes, or 4 percent, amid poor
production growth and higher domestic consumption of
palm oil-based biodiesel. Furthermore, the appreciation
of international palm oil prices relative to competing oils
is bound to depress import demand for palm oil. Global
shipments of soy and sunflower oil are projected to
rise by 2.6 million and 1.9 million tonnes, respectively.
As to soyoil, the second most traded vegetable oil,
higher shipments are expected, in particular from
the United States, but also Brazil and Argentina.
The boost in United States’ exports (15 percent) is
particularly noteworthy when compared to the only
modest improvement in domestic supplies (4 percent).
In Argentina, higher shipments are partly linked to weak
demand from the local biodiesel industry. For sunflower
oil, Ukraine and the Russian Federation will be
responsible for the expected world increases. Thanks to
its more competitive price, the share of sunfloweroil in
total vegetable oil trade is estimated to climb to 8 percent.
As for rapeseed oil, global trade is seen expanding by
no more than 0.5 million tonnes despite this season’s
conspicuous rise in production, mainly reflecting the
above mentioned transportation difficulties faced by
Canada, the world’s top rapeseed supplier. With regard
to coconut oil, the anticipated drop in global exports is
entirely due to the Philippines’ reduced copra harvest.
MEALS AND CAKES5
Global meal supplies to expand in 2013/14If the current crop forecasts materialize, global meal/cakes
production could expand by at least 6 percent, rising for
the second consecutive year and setting a new record.
Production growth will again be driven by soy: mirroring
record harvests, incremental soymeal output is estimated at
5 million tonnes (expressed in protein equivalent). Sizeable
increases are also projected for rape and sunflower meal.
Also global oilmeal supplies (which comprise 2013/14
production and 2012/13 carry-out stocks) are forecast
to climb to a new record, exceeding last year’s level by
almost 6 percent. The world three leading meal producers,
Argentina, Brazil and the United States, would account
for a large part of total expansion. In the United States,
domestic availability is anticipated to recover from recent
drops, though it will still fall short of past record levels.
Sizeable expansions are also likely in Canada, the EU, the
Russian Federation and Ukraine. All these improvements
would primarily result from good harvests although, in
Argentina and Brazil, higher carry-in stocks are also playing
a role. By contrast, in China, domestic supplies could
diminish significantly compared to last year, mainly because
of a sizeable reduction in carry-in stocks.
Growth in meal consumption to accelerateFollowing subdued growth of less than 2 percent in the last
two seasons, world meal consumption is forecast to expand
by 3–4 percent in 2013/14. Current forecasts are based on
growing demand by the livestock sector that will arise from
further economic growth in a number of countries and
on the likely softening in international meal prices. At the
same time, however, ample global maize availabilities are
expected to dampen growth in global meal demand.
Mirroring this season’s supply forecasts, consumption
growth will be led by soymeal, followed by rape and
sunflower meal. Developing countries should contribute
strongly to total growth, with countries in Asia playing
a dominant role. In China, consumption is projected to
expand by about 4–5 percent, less than in recent years,
reflecting a relatively weak projected expansion in domestic
pig and, especially, poultry production. Among developed
countries, aggregate consumption may recover only in
part from the sizeable fall recorded last season. Especially
in the EU and the United States, consumption levels are
expected to remain well below their respective historic
5 This section refers to meals from all origins. In addition to products derived from the oil crops discussed under the section on oilseeds, this also includes fish meal and meals of animal origin.
37FOOD OUTLOOKMAY 2014
OILC
RO
PS, O
ILS AN
D M
EA
LS
Figure 11. World stocks and ratios of meals/cakes (in protein equivalent and including the meal contained in seeds stored)
0
7
14
21
28
2013/142012/132011/122010/112009/100
5
10
15
20
Million tonnes Percent
Major Exporters Rest of the World
World Stock-to-use ratioStock-to-disappearance ratio of Major Exporters
estim. f’cast
Figure 10. Global production and utilization of meals/cakes (in protein equivalent)
-8
-4
0
4
8
90
100
110
120
130
2013/142012/132011/122010/112009/10
Million tonnes Million tonnes
estim. f’cast
Balance (production minus utilization, right axis)
Production (left axis) Utilization (left axis)
peaks. Given record high export commitments, a further
fall in the United States domestic consumption seems likely.
Strong recovery in meal inventories possibleGlobal meal production is forecast to surpass consumption
by 5 million tonnes (in protein equivalents), or 4 percent,
as opposed to only 1 percent last season. Such production
surplus would facilitate a pronounced replenishment of
inventories, with global meal stocks (including the meal
contained in stored oilseeds) increasing by a whopping
21 percent. The build-up in inventories is to be attributed
partly to the large availability of maize, which competes
with oilmeals in the international market. The stock build-
Figure 12. Meals/cake imports by region or major country (in protein equivalent and including the meal contained in seed imports)
0
7
14
21
28
2013/142011/122009/102007/082005/06
Latin America Asia excl. China (total) Europe
China (total)
Million tonnes
United States & Canada Africa
f’cast
up will be concentrated in selected exporting countries,
especially Argentina and Brazil, but also Canada and
the Russian Federation. In Argentina, the surge in
stocks is partly related to the farmers’ tendencies to store
a significant portion of their crop on-farm as a hedge
against rising inflation and currency instability. Conversely,
in the United States, the world’s second most important
supplier of meals, inventories could shrink despite improved
domestic production, given the country’s record export
commitments.
Based on the current estimates, both the global stock-
to-use ratio and the major exporters stock-to-disappearance
ratio would improve significantly in 2013/14. In fact, the
global stock-to-use ratio is to rise to a 3-year high, which
should provide scope for international meal prices to
soften. However, prices will likely begin relaxing only after
the South American soybean crops become available in the
market, i.e. from April/May onward. Until then, the United
States’ tight supply situation is likely to keep prices under
upward pressure.
Global meal trade expected to resume growthAfter last season’s dismal growth, world trade in meals/
cakes – including the meal contained in traded oilseeds – is
projected to rise to an all-time high in 2013/14, exceeding
last season’s level by about 9 percent.
Similar to past years, much of the expansion in
world imports of meals will originate in China and other
developing countries in Asia. After last season’s exceptional
slowdown, China’s imports are estimated to rise by a
stunning 16 percent, underpinned by a further expansion
Ma
rke
t a
sse
ssm
en
ts
38 FOOD OUTLOOKMAY 2014
Figure 13. Meal/cake exports by major exporters (in protein equivalent and including the meal contained in seed exports)
0
5
10
15
20
252012/13 estimate
2013/14 forecast
Million tonnes
UnitedStates
Canada India ParaguayArgentina Brazil
in local crushing capacity. With soybean imports tentatively
estimated at a record 69 million tonnes (the equivalent of
54 million tonnes of soymeal), China remains the world’s
top meal buyer. In the rest of Asia, aggregate imports are
seen expanding by 5–6 percent. EU meal imports could
resume growth after two successive years of decline,
although ample supplies of attractively priced feed grains
are likely to dampen the increase in import demand for
oilmeals.
Export growth will be concentrated in the United
States and South America and primarily concern soybean
meal. In the United States, where shipments have
advanced at a record pace, total exports could exceed
last season’s level by 5.8 million tonnes (including the
meal contained in oilseed sales). In order to meet internal
demand, the United States may even have to resort to
importing an unprecedented level of 1.7–1.8 million
tonnes of soybeans. Exports by Argentina and Brazil are
projected to expand by about 2.9 million tonnes each.
In Brazil, record shipments – made possible by improved
port logistics – may confirm the country as the leading
supplier in global trade, whereas, in Argentina, exports
could fall short of past records, given farmers’ slower than
usual release of soybeans into the market. In Paraguay,
an only modest expansion in shipments is expected due
to recent downward adjustments in harvest estimates.
Global exports of sunflower meal are set to climb to a new
record, boosted by increased availabilities in Ukraine and
the Russian Federation. By contrast, global shipments of
rapeseed meal should expand less than originally forecast
because of the logistical difficulties encountered in Canada
and because of Australia’s poor crop outturn.
2014/15 PRODUCTION OUTLOOK
With the 2013/14 season still on-going, it is too early to
draw world supply and demand projections for 2014/15.
The only preliminary, incomplete information that can
be provided concerns planting intentions in the Northern
Hemisphere, where preparations for the next campaign are
about to start.
In general, relatively firm oilseed prices should underpin
plantings of crops for collection in 2014/15. In particular,
continued tightness in the United States’ soybean balance
is likely to stimulate global soybean sowings. First estimates
for the United States point to a further expansion in
soybean cultivation, mostly at the expense of maize. With
the soybean/maize price ratio (CBOT September contract)
ranging between 2.3 and 2.5 since the end of last year,
farmers expect better returns from soybeans than maize.
A tentative 6.5 percent increase in area planted, together
with on-trend yield levels, would lift the United States’
soybean production to almost 97 million tonnes, 8 percent
above the current season’s estimate. Elsewhere, a recovery
in production seems likely in India, assuming normal
weather conditions, whereas China’s gradual production
decline is expected to continue. Later this year, a further
increase in plantings appears probable in South America,
although rising expenses for plant protection could lower
the rate of expansion below last year’s. Overall, another
sizeable increase in global soybean output of about 5
percent could be achieved.
With regard to rapeseed, a contraction in production
appears inevitable in both Canada and India, unless last
year’s optimal weather conditions recur. In Australia,
the latest reported planting and yield estimates point to
Figure 14. Soybean/maize price ratio (CBOT September 2014 futures contract)
2.1
2.2
2.3
2.4
2.5
2.6
2.1
2.2
2.3
2.4
2.5
2.6
J A OS N D J F M A2013 2014
From a historical perspective, in the USA, whenever the ratioenters the 2.3–2.5 range, the general bias favours soybean overmaize, resulting in a shift of planted area from maize to soybeans.
39FOOD OUTLOOKMAY 2014
OILC
RO
PS, O
ILS AN
D M
EA
LS
a further slide in rapeseed production. Global production
may still turn out close to this season’s record level, thanks
to above-average plantings and mostly favourable weather
conditions prevailing in the EU, China and Eastern Europe.
For sunflowerseed, production could increase again this
year, with a further expansion in plantings boosting
production in Ukraine and the Russian Federation,
provided weather conditions remain favourable and barring
further escalation in the ongoing geopolitical conflicts. Also
in the United States and Argentina, prospective yield
recoveries could lead to higher production. By contrast in
the EU, production may fall. The global production outlook
for palm oil remains uncertain, given the possible prolonged
effects of unfavourable weather conditions earlier this year
on the performance of palm trees in Southeast Asia. The
possibility of an El Niño weather event developing during
the second half of this year creates additional uncertainty.
Together, the above forecasts point to a further, albeit
more moderate, rise in total production of oilseeds and
oilcrop products in 2014/15, which could pave the way for
an increasingly comfortable supply and demand situation –
including in the United States.
Ma
jor p
olicy d
eve
lop
me
nts
82 83FOOD OUTLOOKMAY 2014
OIL
CRO
PS:
MA
JOR
POLI
CY D
EVEL
OPM
ENTS
: OCT
OBE
R 20
13 -
APR
IL 2
014
*
CO
UN
TRY
PRO
DU
CT
DA
TEPO
LIC
Y C
ATE
GO
RY
/INST
RU
MEN
TD
ESC
RIP
TIO
N
Arg
enti
na
Soyb
ean
sFe
b-1
4St
ock
rel
ease
Rea
ched
ag
reem
ent
wit
h p
riva
te s
ecto
r to
rel
ease
so
ybea
ns
into
th
e m
arke
t, t
o a
dd
ress
do
mes
tic
sup
ply
sh
ort
age.
Bio
die
sel
Mar
-14
Trad
e p
olic
yR
equ
este
d t
he
Wo
rld
Tra
de
Org
aniz
atio
n's
Dis
pu
te S
ettl
emen
t B
od
y to
est
ablis
h a
pan
el a
dd
ress
ing
th
e EU
an
ti-d
um
pin
g m
easu
res
for
Arg
enti
nia
n b
iod
iese
l.
Au
stra
liaA
ll ve
get
able
oils
Mar
-14
Bila
tera
l tra
de
agre
emen
tSi
gn
ed t
rad
e ag
reem
ent
wit
h J
apan
, in
clu
din
g im
po
rt t
arif
f el
imin
atio
n f
or
Au
stra
lian
rap
esee
d o
il en
teri
ng
Jap
an.
Bra
zil
All
oils
eed
sO
ct-1
3Pu
blic
sto
rag
eEx
pan
ded
sto
rag
e ca
pac
ity
of
Bra
zil's
sta
te-r
un
fo
od
su
pp
ly c
om
pan
y (C
ON
AB
) in
an
eff
ort
to
allo
w
bet
ter
do
mes
tic
sup
ply
co
ntr
ol,
thu
s p
reve
nti
ng
loca
l pri
ce h
ikes
.
Gra
ins/
oils
eed
sN
ov-
13Pe
st c
on
tro
l D
ecla
red
sta
te o
f em
erg
ency
du
e to
late
st o
utb
reak
of
cate
rpill
ar h
elo
cove
rpa
arm
iger
a in
fo
ur
cen
tral
st
ates
, en
taili
ng
tem
po
rary
per
mis
sio
n t
o p
erm
it im
po
rt o
f a
po
wer
ful p
esti
cid
e.
Soyb
ean
sFe
b-1
4En
viro
nm
enta
l po
licy
An
no
un
ced
th
at t
he
8-ye
ar o
ld m
ora
tori
um
on
tra
din
g o
f ill
egal
ly g
row
n s
oyb
ean
s w
ill b
e re
pla
ced
by
a n
ew s
et o
f st
rin
gen
t co
ntr
ol m
easu
res
at t
he
end
of
2014
.
Soyb
ean
sFe
b-1
4Se
cto
r d
evel
op
men
tG
ran
ted
co
nce
ssio
n f
or
op
erat
ion
of
a co
re t
ran
spo
rt r
ou
te s
o a
s to
en
han
ce t
he
ship
men
t o
f g
rain
s/o
ilsee
ds.
Soyb
ean
sFe
b-1
4A
gri
cult
ura
l p
rod
uct
ion
Sup
po
rted
th
e p
rom
oti
on
of
no
n-G
M s
oyb
ean
s in
Mat
o G
ross
o s
o a
s to
pro
vid
e fa
rmer
s w
ith
an
al
tern
ativ
e to
on
ly g
row
ing
GM
O m
ater
ial.
Can
ada
Rap
esee
dO
ct-1
3B
ilate
ral t
rad
e ag
reem
ent
Ob
tain
ed e
limin
atio
n o
f EU
imp
ort
tar
iffs
on
Can
adia
n r
apes
eed
oil
un
der
bila
tera
l Co
mp
reh
ensi
ve
Eco
no
mic
an
d T
rad
e A
gre
emen
t (C
ETA
).
Soyb
ean
sD
ec-1
3Ex
po
rt p
rom
oti
on
Gra
nte
d f
eder
al f
un
din
g f
or
the
pro
mo
tio
n o
f fo
od
-gra
de
soyb
ean
exp
ort
s.
Gra
ins/
oils
eed
sFe
b-1
4Se
cto
r d
evel
op
men
tTo
ok
acti
on
to
so
lve
log
isti
cal b
ott
len
ecks
fac
ed b
y p
rod
uce
rs m
ovi
ng
gra
ins/
oils
eed
s to
po
rt lo
cati
on
s.
Soyb
ean
s, r
apes
eed
Mar
-14
Bila
tera
l tra
de
agre
emen
tO
bta
ined
pre
fere
nti
al a
cces
s fo
r ex
po
rts
of
Can
adia
n a
gri
cult
ura
l pro
du
cts
to t
he
Rep
ub
lic o
f K
ore
a –
incl
ud
ing
so
ybea
ns
and
rap
esee
d –
un
der
new
ly s
ign
ed b
ilate
ral f
ree
trad
e ag
reem
ent.
Flax
seed
Mar
-14
Mar
ket
reg
ula
tio
nA
llow
ed f
oo
d p
roce
sso
rs t
o u
se h
ealt
h c
laim
s lin
kin
g t
he
use
of
flax
seed
to
low
er le
vels
of
cho
lest
ero
l in
h
um
an d
iets
.
Ch
ina
Soyb
ean
sO
ct-1
3St
ate
pro
cure
men
tSu
spen
ded
pu
blic
sal
es in
pre
par
atio
n o
f st
ate
pro
cure
men
t o
per
atio
ns
fro
m t
he
new
har
vest
.
Rap
esee
dO
ct-1
3Im
po
rt r
estr
icti
on
sR
elax
ed r
estr
icti
on
s o
n im
po
rtat
ion
of
rap
esee
d f
rom
Ru
ssia
.
Rap
esee
d o
ilN
ov-
13St
ate
rese
rves
Det
ecte
d im
po
rted
pro
du
ce in
th
e st
ate’
s te
mp
ora
ry r
apes
eed
oil
rese
rves
, wh
ich
was
den
ou
nce
d a
s fr
aud
.
Soyb
ean
sN
ov-
13Im
po
rt p
olic
yB
arre
d im
po
rted
so
ybea
ns
fro
m e
nte
rin
g N
ort
hea
st C
hin
a an
d In
ner
Mo
ng
olia
wit
h v
iew
to
sh
ield
loca
l p
rod
uct
ion
.
Soyb
ean
sN
ov-
13St
ate
rese
rves
Rel
ease
d s
tate
res
erve
s w
ith
a v
iew
to
eas
e su
pp
ly t
igh
tnes
s, t
hu
s ch
ecki
ng
th
e ri
se in
do
mes
tic
oil/
mea
l p
rice
s.
Soyb
ean
sN
ov-
13St
ate
rese
rves
Co
nti
nu
ed p
rocu
rem
ent
of
soyb
ean
s to
co
nst
itu
te s
tate
res
erve
s fo
r fu
ture
mar
ket
inte
rven
tio
ns
and
to
su
pp
ort
do
mes
tic
farm
gat
e p
rice
s.
Soyb
ean
sD
ec-1
3Im
po
rt p
olic
ySi
gn
ed b
ilate
ral p
roto
col t
hat
allo
ws
soyb
ean
s fr
om
Ukr
ain
e to
en
ter
Ch
ina.
Soyb
ean
sJa
n 1
4St
ate
pro
cure
men
t/re
serv
esD
ecid
ed t
o a
ban
do
n t
he
pu
blic
pro
cure
men
t an
d s
tock
pili
ng
sch
eme
for
soyb
ean
s in
201
4, r
epla
cin
g it
w
ith
dir
ect
sub
sid
ies
to f
arm
ers.
Rap
esee
dFe
b-1
4A
gri
cult
ura
l po
licy
Dec
ided
to
incr
ease
ag
ricu
ltu
ral s
ub
sid
ies
for
gra
ins,
incl
ud
ing
rap
esee
d, i
n a
bid
to
imp
rove
fo
od
se
curi
ty a
nd
en
cou
rag
e fa
rmer
s n
ot
to a
ban
do
n t
hei
r fa
rms.
Ma
jor
po
licy
de
velo
pm
en
ts
84 85FOOD OUTLOOKMAY 2014
CO
UN
TRY
PRO
DU
CT
DA
TEPO
LIC
Y C
ATE
GO
RY
/INST
RU
MEN
TD
ESC
RIP
TIO
N
Ch
ina
Gra
ins/
Oils
eed
sFe
b-1
4A
gri
cult
ura
l po
licy
Dir
ecte
d s
tate
-ow
ned
gra
in fi
rms
to in
vest
in o
vers
eas
mer
ger
s an
d a
cqu
isit
ion
s so
as
to s
et u
p a
glo
bal
su
pp
ly c
hai
n f
or
gra
ins/
oils
eed
s.
Bio
die
sel
Feb
-14
Ren
ewab
le e
ner
gy
po
licy
Ap
pro
ved
co
mm
erci
al u
se o
f b
io-a
viat
ion
fu
el w
ith
a v
iew
to
div
ersi
fy f
uel
co
nsu
mp
tio
n a
nd
red
uce
ca
rbo
n e
mis
sio
ns.
All
Mar
-14
Pro
du
ctio
n s
up
po
rtIs
sued
new
gu
idel
ines
to
imp
rove
acc
ess
of
farm
ers
and
sm
all c
om
pan
ies
to a
deq
uat
e cr
edit
lin
es.
Rap
esee
d o
ilM
ar-1
4St
ate
rese
rves
Ord
ered
rel
ease
of
rap
esee
d o
il fr
om
sta
te r
eser
ves
in o
rder
to
mak
e ro
om
fo
r p
rocu
rem
ent
fro
m n
ew
har
vest
.
Rap
esee
dM
ar-1
4Im
po
rt r
estr
icti
on
sA
llow
ed im
po
rts
of
Can
adia
n r
apes
eed
mea
l to
res
um
e, f
ollo
win
g t
he
new
reg
istr
atio
n p
roto
col i
n
pla
ce s
ince
ear
ly 2
013.
Euro
pea
n U
nio
n
Rap
esee
d o
ilO
ct-1
3B
ilate
ral t
rad
e ag
reem
ent
Ag
reed
to
th
e el
imin
atio
n o
f EU
imp
ort
tar
iffs
on
Can
adia
n r
apes
eed
oil,
un
der
bila
tera
l Co
mp
reh
ensi
ve
Eco
no
mic
an
d T
rad
e A
gre
emen
t (C
ETA
).
Palm
oil
and
der
ived
p
rod
uct
sJa
n-1
4Im
po
rt p
olic
yEn
ded
pre
fere
nti
al im
po
rt d
uti
es f
or
Ind
on
esia
n p
alm
oil,
pal
m o
il-b
ased
ole
o-c
hem
ical
s an
d b
iofu
els
un
der
th
e re
vise
d G
ener
al S
yste
m o
f Pr
efer
ence
s (G
SP).
Oliv
e o
ilFe
b-1
4D
isea
se p
reve
nti
on
Ban
ned
th
e m
ove
men
t o
f sp
ecifi
c p
lan
ts o
ut
of
an It
alia
n r
egio
n t
o h
elp
pre
ven
t th
e sp
read
of
a d
isea
se
affe
ctin
g o
live
tree
s.
Oliv
e o
ilFe
b-1
4Pr
od
uct
lab
ellin
gA
nn
ou
nce
d t
he
intr
od
uct
ion
– in
Dec
emb
er 2
014
– o
f n
ew la
bel
ling
ru
les
aim
ed a
t m
akin
g p
rod
uct
in
form
atio
n e
asie
r to
rea
d a
nd
un
der
stan
d.
Sun
flo
wer
oil
Ap
r-14
Im
po
rt p
olic
yA
pp
rove
d p
rop
osa
l to
rem
ove
, as
of
23 A
pri
l, im
po
rt t
arif
fs o
n s
ever
al U
krai
nia
n a
gri
cult
ura
l co
mm
od
itie
s –
incl
ud
ing
cru
de
and
refi
ned
su
nfl
ow
er o
il –
anti
cip
atin
g o
n-g
oin
g n
ego
tiat
ion
s o
f a
com
pre
hen
sive
EU
-Ukr
ain
e fr
ee t
rad
e ag
reem
ent.
Ind
ia
Rap
esee
dO
ct-1
3Su
pp
ort
pri
ceR
aise
d o
ffici
al p
rocu
rem
ent
pri
ce f
or
the
rab
i rap
esee
d c
rop
.
Oliv
e o
ilO
ct-1
3M
arke
t re
gu
lati
on
Reg
ula
ted
th
e d
om
esti
c o
live
oil
mar
ket
to s
tan
dar
diz
e p
rod
uct
s, s
o a
s to
pre
ven
t im
pu
riti
es,
adu
lter
atio
n a
nd
oth
er h
ealt
h-r
elat
ed p
rob
lem
s.
Gro
un
dn
ut
No
v-13
Pub
lic p
rocu
rem
ent
Prep
ared
fo
r re
sum
pti
on
of
stat
e p
rocu
rem
ent
follo
win
g a
bu
mp
er c
rop
.
All
edib
le o
ilsJa
n-1
4Im
po
rt d
uty
Rai
sed
imp
ort
du
ty o
n r
efin
ed v
eget
able
oils
, wid
enin
g t
he
du
ty d
iffe
ren
tial
bet
wee
n c
rud
e an
d r
efin
ed
oil,
so
as
to p
rote
ct t
he
do
mes
tic
refi
nin
g in
du
stry
.
Veg
etab
le o
il d
eriv
ativ
es
Feb
-14
Tra
de
po
licy
Init
iate
d in
vest
igat
ion
on
incr
ease
d im
po
rts
of
satu
rate
d f
atty
alc
oh
ols
ad
dre
ssin
g c
laim
s th
at s
uch
im
po
rts
wer
e h
arm
ing
th
e d
om
esti
c re
fin
ing
ind
ust
ry.
All
edib
le o
ilsFe
b-1
4C
on
sum
er p
olic
yEx
ten
ded
a d
ead
line
for
end
ing
th
e sa
le o
f ed
ible
oils
in lo
ose
fo
rm s
o a
s n
ot
to h
arm
po
or
con
sum
ers.
All
oils
eed
sM
ar-1
4Em
erg
ency
rel
ief
An
no
un
ced
mea
sure
s to
su
pp
ort
far
mer
s af
fect
ed b
y h
eavy
rai
ns
in t
he
stat
es o
f M
ahar
ash
tra
and
M
adh
ya P
rad
esh
.
Ind
on
esia
Soyb
ean
sN
ov-
13St
ate
pu
rch
ases
Co
nti
nu
ed s
tate
pu
rch
ases
wit
h a
vie
w t
o s
tab
ilize
do
mes
tic
pri
ces
of
soy
foo
d p
rod
uct
s.
Soyb
ean
sJa
n-1
4Pr
od
uct
ion
su
pp
ort
Rai
sed
go
vern
men
t-se
t fa
rm g
ate
pri
ce f
or
soyb
ean
s to
sti
mu
late
do
mes
tic
pro
du
ctio
n.
Palm
oil
Oct
-13
to
Ap
r-14
Exp
ort
po
licy
Left
in p
lace
th
e sl
idin
g e
xpo
rt t
ax r
egim
e u
sed
to
pre
ven
t h
ikes
in c
on
sum
er p
rice
s (v
ia r
egu
lati
on
of
do
mes
tic
sup
plie
s) a
nd
to
sti
mu
late
gro
wth
in d
ow
nst
ream
pal
m o
il p
roce
ssin
g.
Isla
mic
Rep
ub
lic o
f Ir
anA
ll ed
ible
oils
Jan
-14
Foo
d s
ub
sid
ySt
arte
d p
ub
lic d
istr
ibu
tio
n o
f fo
od
pac
kag
es, i
ncl
ud
ing
veg
etab
le o
il.
Jap
anA
ll ve
get
able
oils
Mar
-14
Bila
tera
l tra
de
agre
emen
tSi
gn
ed t
rad
e ag
reem
ent
wit
h A
ust
ralia
, in
clu
din
g im
po
rt t
arif
f el
imin
atio
n f
or
Au
stra
lian
rap
esee
d o
il en
teri
ng
Jap
an.
Rep
ub
lic o
f K
ore
a
Soyb
ean
sO
ct-1
3St
ate
rese
rves
Set
up
pu
blic
sto
cks
of
wh
eat
and
so
ybea
ns.
Soyb
ean
an
d r
apes
eed
Mar
-14
Bila
tera
l tra
de
agre
emen
tG
ran
ted
pre
fere
nti
al a
cces
s to
ag
ricu
ltu
ral i
mp
ort
s fr
om
Can
ada
– in
clu
din
g s
oyb
ean
s an
d r
apes
eed
, u
nd
er n
ewly
sig
ned
bila
tera
l fre
e tr
ade
agre
emen
t.
Ma
jor p
olicy d
eve
lop
me
nts
84 85FOOD OUTLOOKMAY 2014
*A
col
lect
ion
of m
ajor
oilc
rop/
oil/m
eal p
olic
y de
velo
pmen
ts s
tart
ing
in J
anua
ry 2
011
is a
vaila
ble
at: h
ttp:
//ww
w.f
ao.o
rg/e
cono
mic
/est
/est
-com
mod
ities
/com
mod
ity-p
olic
y-ar
chiv
e/en
/?gr
oupA
ND
com
mod
ity=
Oils
eeds
,%20
oils
%20
and%
20m
eals
CO
UN
TRY
PRO
DU
CT
DA
TEPO
LIC
Y C
ATE
GO
RY
/INST
RU
MEN
TD
ESC
RIP
TIO
N
Mal
aysi
a
Bio
die
sel
Feb
-14
Ren
ewab
le e
ner
gy
po
licy
An
no
un
ced
nat
ion
wid
e m
and
ato
ry b
len
din
g o
f d
iese
l tra
nsp
ort
atio
n f
uel
wit
h 5
% p
alm
oil-
bas
ed
bio
die
sel f
rom
Ju
ly 2
014.
Palm
oil
Oct
-13
to
Ap
r-14
Exp
ort
po
licy
Peri
od
ical
ly a
dju
sted
exp
ort
tax
es in
lin
e w
ith
th
e n
ewly
intr
od
uce
d s
lidin
g t
ax r
egim
e, a
imin
g a
t th
e p
rote
ctio
n o
f d
om
esti
c g
row
ers
and
refi
ner
s.
Palm
oil
Ap
r-14
Bila
tera
l tra
de
agre
emen
tO
bta
ined
pre
fere
nti
al a
cces
s fo
r ex
po
rts
of
Mal
aysi
an p
alm
oil
to T
urk
ey, u
nd
er n
ewly
sig
ned
co
mp
reh
ensi
ve f
ree
trad
e ag
reem
ent
wit
h T
urk
ey.
Mex
ico
All
edib
le o
ilsD
ec-1
3Im
po
rt d
uti
esSu
spen
ded
fin
al s
tag
e o
f el
imin
atio
n o
f im
po
rt d
uti
es o
n v
eget
able
oils
wh
ich
had
bee
n s
ched
ule
d f
or
Mar
ch 2
014.
Paki
stan
Sun
flo
wer
see
dFe
b-1
4Pr
od
uct
ion
su
pp
ort
Dec
ided
to
pro
mo
te lo
cal s
un
flo
wer
see
d c
ult
ivat
ion
in a
bid
to
hel
p r
edu
ce t
he
cou
ntr
y's
defi
cien
cy in
ed
ible
oil
sup
plie
s.
Phili
pp
ines
Co
con
ut
Feb
-14
Pro
du
ctio
n s
up
po
rtA
lloca
ted
fu
nd
s fo
r th
e re
hab
ilita
tio
n o
f th
e d
om
esti
c co
con
ut
ind
ust
ry h
it b
y ty
ph
oo
n Y
ola
nd
a in
N
ove
mb
er 2
013.
Ru
ssia
n F
eder
atio
nSo
ybea
ns
Jan
-14
GM
O c
ult
ivat
ion
Allo
wed
cu
ltiv
atio
n o
f G
M s
oyb
ean
th
rou
gh
ou
t th
e R
uss
ian
Fed
erat
ion
fro
m J
uly
201
4.
Turk
eyPa
lm o
ilA
pr-
14B
ilate
ral t
rad
e ag
reem
ent
Gra
nte
d p
refe
ren
tial
acc
ess
to im
po
rts
of
pal
m o
il fr
om
Mal
aysi
a, u
nd
er n
ewly
sig
ned
co
mp
reh
ensi
ve
free
tra
de
agre
emen
t w
ith
Mal
aysi
a.
Un
ited
Sta
tes
Bio
die
sel
Mar
-14
Ren
ewab
le e
ner
gy
po
licy
An
no
un
ced
new
fu
nd
ing
fo
r co
mm
erci
al e
nte
rpri
ses
in s
up
po
rt o
f ad
van
ced
bio
fuel
pro
du
ctio
n;
dir
ecte
d t
o r
esea
rch
, in
vest
men
t an
d in
fras
tru
ctu
re p
roje
cts,
pay
men
ts c
on
cern
mai
nly
pro
du
cers
of
oil/
fat-
bas
ed b
iod
iese
l.
Soyb
ean
, gro
un
dn
ut
and
su
nfl
ow
erse
edA
pr-
14Ex
po
rt p
rom
oti
on
Mad
e av
aila
ble
new
fu
nd
ing
to
hel
p s
elec
ted
co
mm
od
ity
org
aniz
atio
ns
exp
and
co
mm
erci
al e
xpo
rts.
Statistica
l ap
pe
nd
ix
106 107FOOD OUTLOOKMAY 2014
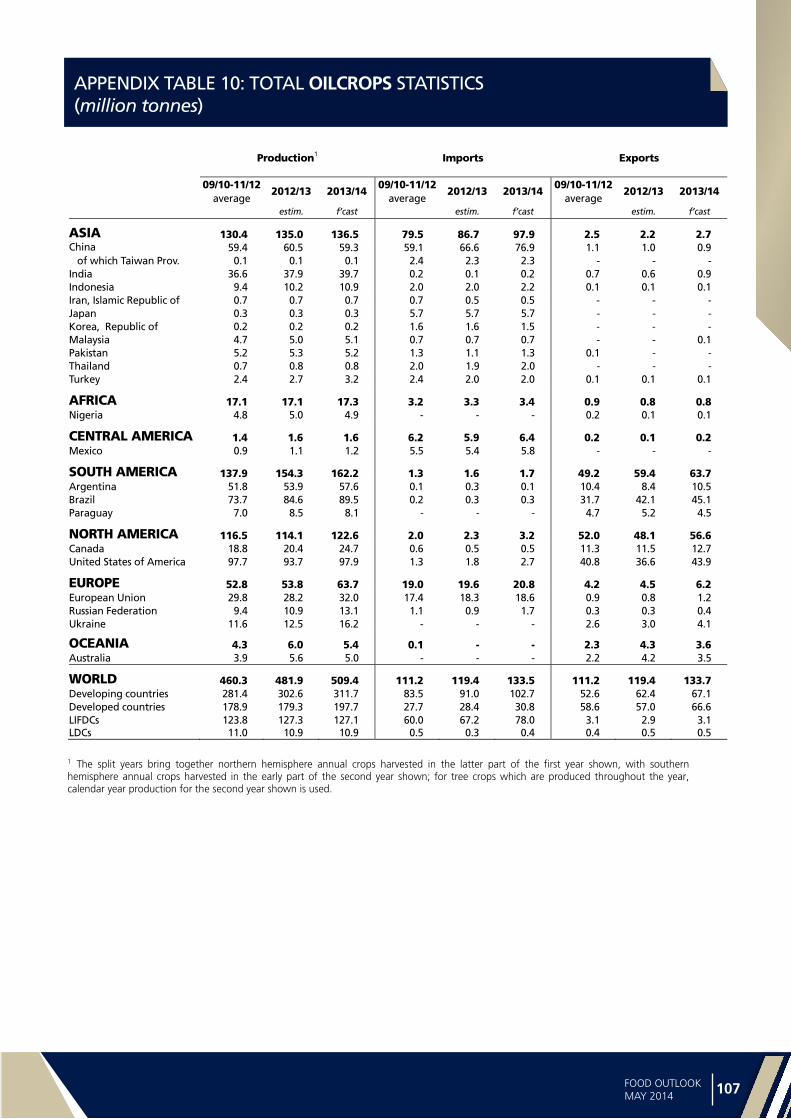
APPENDIX TABLE 10: TOTAL OILCROPS STATISTICS (million tonnes)
Production1 Imports Exports
09/10-11/12 2012/13 2013/14
09/10-11/122012/13 2013/14
09/10-11/12 2012/13 2013/14
average average averageestim. f’cast estim. f’cast estim. f’cast
1 The split years bring together northern hemisphere annual crops harvested in the latter part of the first year shown, with southern hemisphere annual crops harvested in the early part of the second year shown; for tree crops which are produced throughout the year, calendar year production for the second year shown is used.
Sta
tist
ica
l a
pp
en
dix
108 109FOOD OUTLOOKMAY 2014
APPENDIX TABLE 11: TOTAL OILS AND FATS STATISTICS 1 (million tonnes)
Imports Exports Utilization
09/10-11/12 2012/13 2013/14
09/10-11/122012/13 2013/14
09/10-11/12 2012/13 2013/14
average average averageestim. f’cast estim. f’cast estim. f’cast
Notes:- The sudden drop in the FAO price index for oilseeds in March 2014 is due to a structural break in the underlying price series for soybeans (US no.2 yellow, c.i.f.
Rotterdam), the component with the highest weight. A look at alternative reference prices for soybeans reveals that, during March and April 2014, international soybean values have actually appreciated further rather than falling. For a detailed explanation of the anomalous trend in the soybean reference price, please refer to issue no. 58 of the Oilcrops Monthly Price and Policy Update (MPPU), which can be downloaded through the following link. http://www.fao.org/fileadmin/templates/est/COMM_MARKETS_MONITORING/Oilcrops/Documents/MPPU_April_14.pdf
- The indices are based on the international prices of five selected seeds, ten selected oils and five selected cakes and meals.


![FAO September 7 th 2009 Presentation Jean-Louis DUVAL [FAO consultant] Michael LARINDE [FAO AGPS]](https://static.documents.pub/doc/80x56/56649f305503460f94c4a48b/fao-september-7-th-2009-presentation-jean-louis-duval-fao-consultant-michael.jpg)


