The 33st International Electric Propulsion Conference, The George Washington University, USA October 6 – 10, 2013 1 Farfield Plume Measurement and Analysis on the NASA-300M and NASA-300MS IEPC-2013-057 Presented at the 33rd International Electric Propulsion Conference, The George Washington University • Washington, D.C. • USA October 6 – 10, 2013 Wensheng Huang * , Rohit Shastry † , George C. Soulas ‡ , and Hani Kamhawi § National Aeronautics and Space Administration Glenn Research Center, Cleveland, Ohio, 44135, USA NASA is developing a 10- to 15-kW Hall thruster system to support future NASA missions. This activity is funded under the Space Technology Mission Directorate Solar Electric Propulsion Technology Demonstration Mission project. As a part of the development process, the NASA-300M, a 20-kW Hall thruster, was modified to incorporate the magnetic shielding concept and named the NASA-300MS. This activity was undertaken to assess the viability of using the magnetic shielding concept on a high-power Hall thruster to greatly reduce discharge channel erosion. This paper reports on the study to characterize the far-field plumes of the NASA-300M and NASA-300MS. Diagnostics deployed included a polarly-swept Faraday probe, a Wien filter (ExB probe), a retarding potential analyzer, and a Langmuir probe. During the study, a new, more accurate, integration method for analyzing Wien filter probe data was implemented and effect of secondary electron emission on the Faraday probe data was treated. Comparison of the diagnostic results from the two thrusters showed that the magnetically shielded version performed with ~2% higher voltage utilization efficiency, ~2% lower plume divergence efficiency, and ~2% lower mass utilization efficiency compared to the baseline version. The net change in efficiency is within the aggregate measurement uncertainty so the overall performance is roughly equal for the two versions of the thruster. Anode efficiency calculated from thrust stand measurement corroborates this finding. Abbreviations and Nomenclature * Research Engineer, Propulsion and Propellants, [email protected]. † Research Engineer, Propulsion and Propellants, [email protected]. ‡ Research Engineer, Propulsion and Propellants, [email protected]. § Research Engineer, Propulsion and Propellants, [email protected]. GRC = Glenn Research Center HEFT = Human Exploration Framework Team STMD = Space Technology Mission Directorate AFRL = Air Force Research Laboratory LEO = Low Earth Orbit GEO = Geosynchronous Earth Orbit 300M = NASA-300M 300MS = NASA-300MS 300MS-2 = NASA-300MS configuration 2 RPA = Retarding Potential Analyzer CEX = Charge-exchange SEE = Secondary Electron Emission MCD = Mean Channel Diameter a = Anode efficiency v = Voltage utilization efficiency d = Divergence efficiency b = Current utilization efficiency m = Mass utilization efficiency q = Charge utilization efficiency
Transcript
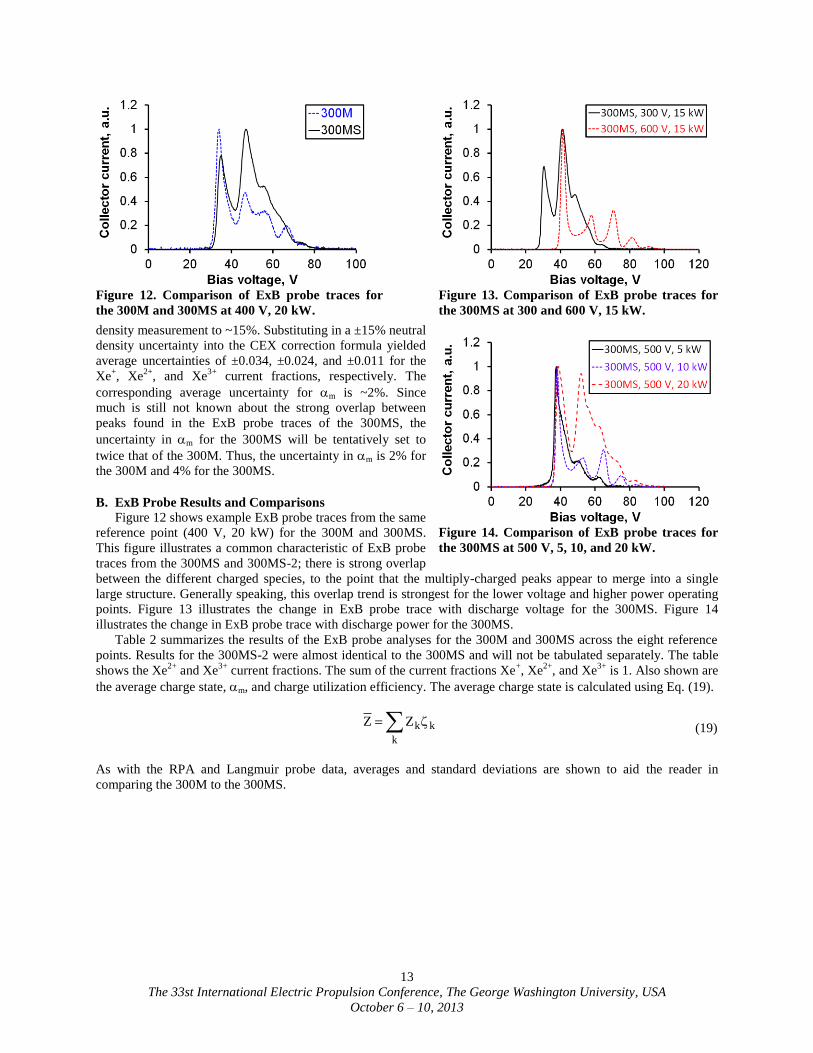
The 33st International Electric Propulsion Conference, The George Washington University, USA
October 6 – 10, 2013
1
Farfield Plume Measurement and Analysis on
the NASA-300M and NASA-300MS
IEPC-2013-057
Presented at the 33rd International Electric Propulsion Conference,
The George Washington University • Washington, D.C. • USA
October 6 – 10, 2013
Wensheng Huang*, Rohit Shastry
†, George C. Soulas
‡, and Hani Kamhawi
§
National Aeronautics and Space Administration Glenn Research Center, Cleveland, Ohio, 44135, USA
NASA is developing a 10- to 15-kW Hall thruster system to support future NASA
missions. This activity is funded under the Space Technology Mission Directorate Solar
Electric Propulsion Technology Demonstration Mission project. As a part of the
development process, the NASA-300M, a 20-kW Hall thruster, was modified to incorporate
the magnetic shielding concept and named the NASA-300MS. This activity was undertaken
to assess the viability of using the magnetic shielding concept on a high-power Hall thruster
to greatly reduce discharge channel erosion. This paper reports on the study to characterize
the far-field plumes of the NASA-300M and NASA-300MS. Diagnostics deployed included a
polarly-swept Faraday probe, a Wien filter (ExB probe), a retarding potential analyzer, and
a Langmuir probe. During the study, a new, more accurate, integration method for
analyzing Wien filter probe data was implemented and effect of secondary electron emission
on the Faraday probe data was treated. Comparison of the diagnostic results from the two
thrusters showed that the magnetically shielded version performed with ~2% higher voltage
utilization efficiency, ~2% lower plume divergence efficiency, and ~2% lower mass
utilization efficiency compared to the baseline version. The net change in efficiency is within
the aggregate measurement uncertainty so the overall performance is roughly equal for the
two versions of the thruster. Anode efficiency calculated from thrust stand measurement
The 33st International Electric Propulsion Conference, The George Washington University, USA
October 6 – 10, 2013
20
The charge and current utilization efficiencies are largely constant and will not be plotted. Charge utilization is
largely constant due to the general insensitivity of the charge utilization equation to current fractions of the multiply-
charged species. The invariance of the current utilization with operating conditions have been seen in past work14, 16
The exact value of current utilization is related to electron mobility and is an ongoing area of research. Since the
value of the current utilization is largely constant for both the 300M and 300MS and are roughly equal, the same
transport mechanisms are likely to apply for both thrusters.
Figure 20 shows a plot of the mass utilization efficiency as a function of discharge current. For a typical Hall
thruster, like the 300M, the mass utilization efficiency typically rises with the discharge current. The reason is that
as the discharge current rise so does the current density and the plasma density. Since the ionization rate scales with
the electron density, denser plasma means higher ionization rate, which give rise to higher mass utilization. The
mass utilization efficiency of the 300MS and 300MS-2 display the same trends. Note that a value of mass utilization
above unity is unphysical. There are two potential sources of error that may explain some of the high mass
utilization values. As previously mentioned, the mass utilization draws heavily on both the ExB probe measurement
and the Faraday probe measurement. Inaccurate accounting of the multiply charged species such as poor handling of
the overlap region between charged peaks can give rise to incorrect values of αm and, by extension, the mass
utilization. For the Faraday probe data, the probe may be capturing more CEX than can be removed by the
extrapolated-wing method. If data from either (or both) probe(s) have a positive systematic error, the mass
utilization and the associated anode efficiency will be too high, which may explain why the probe-derived anode
efficiency is ~1% higher than the thrust-derived efficiency. With that said, the error being examined here is around
the same as or below the uncertainty of the measurements.
From the tables and figures in this section, one can conclude that the NASA-300MS likely operates on the same
ionization and acceleration physics as the NASA-300M. The implementation of magnetic shielding did not change
the fundamental laws that govern the basic operating principles of the 300M. The performance of the thruster
remained largely unchanged. We will now turn to the small differences that have been observed during the present
study and possible physical explanations.
Generally speaking, the plume of the 300MS contains more multiply charged species and has a higher
divergence than the plume of the 300M. One possible cause for the higher amount of multiply charged species is the
presence of higher temperature plasma associated with reduced wall moderation. The key idea behind magnetic
shielding is to maintain a layer of low-temperature, low-density plasma at high plasma potential near the channel
walls that extend all the way to the thruster exit.8 The anchor points of the magnetic lines of force that travel through
the bulk plasma are moved out of the channel and onto the front pole where plasma density is much lower (see
Fig. 21). As a result the wall area effectively “wetted” by the
plasma is reduced by orders of magnitude. In a typical Hall
thruster, like the 300M, where the lines of force that pass
through the bulk plasma terminates in the ceramic discharge
channel walls, electron temperature tends be moderated.
Ceramics, like boron nitride, have relatively high secondary
electron emission coefficients. When high energy electrons
from the bulk plasma impact the wall they are preferentially
de-energized and secondary lower-energy electrons are
released, resulting in a net decrease in the average electron
Figure 19. Divergence efficiency as a function of
the discharge voltage.
Figure 20. Mass utilization efficiency as a function
of the discharge current.
Figure 21. Illustration of the anchor locations
for the magnetic field of conventional and
magnetically-shielded Hall thrusters.
The 33st International Electric Propulsion Conference, The George Washington University, USA
October 6 – 10, 2013
21
energy. The electron temperature in a typical Hall thruster does not rise much above some wall-material-dependent
critical value even as the discharge voltage increases.36
Since the wetted area is much reduced with a magnetically
shielded thruster, the electron temperature can rise as seen in more typical plasma discharges that are not moderated.
This increase in electron temperature is seen in simulations though not yet confirmed by interior plasma probing.8
Assuming the plasma temperature in a magnetically-shielded thruster is higher than its more typical cousin, the
increase in multiply charged species production will result as a natural consequence. The ionization energies for
doubly and triply charged xenon are 21.2 and 32.1 eV, respectively. The average electron temperature found in the
ionization zone of a typical Hall thruster is 20-30 eV.7, 37
For a plasma with such a temperature, even a small rise in
average plasma temperature will mean a large increase in the fraction of electrons (in the high energy tail of the
electron energy distribution) that have enough energy to produce multiply charged ions via impact-ionization.
A possible explanation for the increased divergence is that, as a consequence of the magnetic shielding topology,
the ionization and acceleration zones of the 300MS are further downstream than the 300M. This change in zone
locations was previously seen when the H6 was modified for magnetic shielding.8 In such a case, ions with radial
momentum are less likely to strike the channel walls and more likely to reach the far-field. Indeed, the main purpose
of the magnetic shielding concept is to prevent high-energy ions from striking the channel walls. Another possible
explanation is that the magnetically shielding topology has small regions, near the anchor points of the line of force,
where the electric field is tilted sideways (see Fig. 21). These regions of non-axial electric field correspond to low
plasma density so the amounts of ions that escape through them are small. The added radial momentum may explain
the small rise in plume divergence.
VIII. Conclusion
This paper has presented an in-depth efficiency analysis of the NASA-300M, a 20-kW thruster, and the NASA-
300MS, a magnetically shielded version of the 300M. The results of the phenomenological model with combined
inputs from the Langmuir probe, RPA, ExB probe, and Faraday probe shows excellent agreement with thrust stand
measurements. On the average, the 300MS data shows ~2% higher voltage utilization efficiency, ~2.5% lower
divergence efficiency, and ~1.5% higher current utilization efficiency than the 300M data. The two thrusters have
roughly the same values in charge and mass utilization efficiencies. The general conclusion is that the 300M and
300MS have very similar performance as measured by the anode efficiency. Further testing with a second
configuration of the 300MS with a shortened discharge channel shows essentially identical performance as the
300MS. The data acquired in the present study will greatly benefit the design of a flight-like magnetically-shielded
Hall thruster in the 10-15 kW class for SEP TDM.
As part of the current study, a new set of integration formulas were derived for ExB probe analysis. Two VDF
equation forms were tried as a part of the analysis. The results show excellent consistency with data obtained from
both the 300M and the 300MS. The presence of strong overlap between peaks for the ExB probe data of the 300MS
is a new phenomenon in the use of ExB probe in a Hall thruster plume environment. New advances may be needed
in the area of Hall thruster charged species spectroscopy to keep up with the newly developed magnetic shielding
concept.
Another discovery during the current study is the need to account for secondary electron emission effects on the
nude Faraday probe even when a low SEE material is used as the collector. The correction factor for SEE effects
were found to vary from 4% to 7% and must be accounted for if high fidelity results are needed.
Lastly, several physical explanations are provided to explain the increase in multiply charged species and plume
divergence found in the 300MS when compared to the 300M. The discharge of the 300MS is speculated to contain
higher temperature electrons and is further downstream than the 300M.
The 33st International Electric Propulsion Conference, The George Washington University, USA
October 6 – 10, 2013
22
Appendices
A. Derivation of new integration formulas for ExB probe analysis
The process for deriving the integration formulas for ExB probe analysis start by relating the current collected by
the ExB probe collector to the velocity distribution functions (VDFs) of the various charged species. To accomplish
this, the velocity resolution of the ExB probe is derived in terms of various physical and geometrical properties. The
results are used to relate the species and current fraction to the VDFs, culminating in the new integration formulas.
This appendix will be written in a stand-alone manner.
To figure out the relationship between the species and current fraction and the ExB probe trace we will first look
at the physical description of what exactly the ExB probe is collecting at a given plate bias voltage. This is shown in
Eqs. (22), (23), and (24).
)V(I)V(I P
j
j,PPP
(22)
j0
j0
uu
uujjPjPjP, du)u(funAeZ)V(I (23)
f0
P
0
00
DB
V
B
Eu
(24)
Where IP is ExB probe collector current, VP is the plate bias voltage, IP,j is the contribution to the measured current
by the j-th species, Zj is the charge state of the j-th species, e is the elementary charge, AP is the probe entrance area,
nj is the number density of the j-th species, u is particle velocity, u0 is the particle velocity corresponding to the
applied electric and magnetic field magnitude, E0 and B0, respectively, as shown in Eq. (24), uj is the half-width of
the ExB velocity resolution and varies with species, fj is the velocity distribution function (VDF) of the j-th species,
and Df is the gap between the ExB bias plates.
To continue, we need to derive the relationship between
uj and other known constants and variables. The derivation
will be carried out for a single species so the subscript j will
be dropped temporarily.
Figure 22 shows the design of a generic ExB probe with
a drift section. This simplified and exaggerated diagram also
represents the ExB probe used for the present study.
Starting from the left of the diagram, we have the collimator
with a circular entrance orifice of diameter a1, a circular exit
orifice of diameter a2, and a length of Lc. The particle is
injected at the maximum collimator acceptance angle, α,
and enters the filter section. The filter section is of length Lf
and is sufficiently wide that the particle does not hit the bias
plates (grey rectangles). The electric and magnetic fields in
the particle path are uniform, perpendicular, and of magnitude E0 and B0, respectively. The example particle in this
derivation is traveling slightly faster than the filter velocity u0, which is equal to E0/B0. The velocity of the particle is
assigned to be u0+Δu. Because the particle is slightly too fast, it experiences a net downward acceleration in the
filter section and passes into the drift section. The drift section is of length Ld. The particle is just slow enough to
pass through the circular orifice of diameter a3 in the SEE suppression plate. The collector is sufficiently large as to
collect all ions passing through the orifice on the SEE suppression plate. In some ExB probe designs, an exit
collimator replaces the SEE suppression plate. The diameter of the entrance orifice for the exit collimator would
become a3. Two assumptions will be used in this derivation. One, the acceptance angle is small enough that small
angle approximation applies. Two, Δu << u0, so the equation can be linearized.
Applying the equations of motion to the collimator section, we can obtain Eq. (25) for the acceptance angle of
the collimator. Note the use of the small angle approximation.
c
21
L2
aatansin
(25)
Figure 22. Simplified diagram of a generic ExB
probe with drift section.
The 33st International Electric Propulsion Conference, The George Washington University, USA
October 6 – 10, 2013
23
Applying the equations of motion to the filter section, we obtain Eq. (26) for the x-axis and Eq. (27) for the y-axis.
Note the use of the Δu << u0 assumption in Eq. (26).
0ff uL (26)
f0
2f2
1f sinuay
(27)
a
ZeB
mu
0
(28)
Where f is the dwell time of the particle in the filter section, Δyf is the change in y-position of the particle between
where it enters and where it exits the filter section, Δa is the net acceleration on the particle due to the velocity of the
particle deviating from the filter velocity, m is the mass of the particle, and e is the elementary charge. The
relationship between Δu and Δa is derived from force balance in the filter section and shown in Eq. (28). Applying
the equations of motion to the drift section, we obtain Eq. (29) for the x-axis and Eq. (30) for the y-axis.
0dd uL (29)
d0dfdd,yd sinuauy
(30)
where d is the dwell time of the particle in the drift section, Δyd is the change in y-position of the particle between
where it enters and where it exits the drift section, and uy,d is the y-velocity of the particle as it enters the drift
section. uy,d is calculated from the equations of motion for the filter section. Next, we note that the total change in
the y-position of the particle between where it enters the filter section and where it exits the drift section is equal to
the negative of the difference in y-position between the upper lip of the collimator exit and the lower lip of the
orifice on the SEE suppression plate. This relationship is expressed in Eq. (31).
2
aayy 32
df (31)
Substituting Eqs. (25)-(27), (29), and (30) into Eq. (31) and re-arranging some terms, we obtain Eq. (32). Lastly,
substituting Eq. (32) into Eq. (28), we obtain an expression for the maximum deviation in velocity that a particle can
have and still reach the collector.
2
0
fd2
f
cdf2132 uLL2L
L/)LL)(aa(aaa
(32)
fd2
f
cdf2132
0
20
LL2L
L/)LL)(aa(aa
ZeB
muu
(33)
Note, if the acceptance angle of the ExB probe is larger than the angle subtended by the plasma source, the angle α
is no longer the limiting parameter. Instead, the angle β (Eq. (34)) should be used and the form of Eq. (33) changes
to Eq. (35).
ExB
PS
R2
Dsin (34)
fd2
f
df32
0
20
LL2L
)LL(sin2aa
ZeB
muu
(35)
where DPS is the diameter of the plasma source and RExB is the distance between the ExB probe and the plasma
source. For the probe used in this study, the acceptance angle is sufficiently small that Eq. (35) does not apply.
The 33st International Electric Propulsion Conference, The George Washington University, USA
October 6 – 10, 2013
24
For an ExB probe without a drift section, we can set Ld to 0 in Eq. (33), which simplifies into Eq. (36).
2f
cf2132
0
20
L
L/L*)aa(aa
ZeB
muu
(36)
Comparing Eq. (36) to Eq. (33), we see that the addition of the drift section will generally improve the resolution of
the ExB probe. Note that a1, a2, a3, Lc, Lf, Ld, and RExB are all geometric constants for a given experimental setup.
DPS is also typically a constant (though one can never be too careful when generalizing about plasma sources). We
can now write a scaling equation for the maximum accepted deviation in velocity of a generic ExB probe, which is
shown in Eq. (37).
GZeB
muu
0
20
(37)
where G is a geometric constant.
Here are some quick observations about the maximum accepted deviation in velocity for an ExB probe. One, the
numerator of Eq. (37) contains the ion kinetic energy while the denominator contains the ion charge. In other words,
Δu scales with the ion energy per charge of the incoming particles, which is slightly lower than the discharge voltage
of a Hall thruster. The implication of this trend for a Hall thruster is that Δu is species-insensitive because all
charged species undergo similar voltage drop and have similar ion energy per charge. When calculating ExB probe
resolution as a relative percentage, the value for the singly-charged species will always be the biggest. That is
because Δu is roughly constant while u0 increases with species charge.
Two, dividing both sides of Eq. (37) by u0, we obtain Eq. (38).
G
ZeB
mu
u
u
0
0
0
(38)
This equation says that for a given charged species, the ExB probe resolution in relative percentage increases with
the velocity of the particle. For instance, an ExB probe with a ±2% resolution when probing the plume of a 250-V
thruster would have a ±4% resolution when probing the plume of a 1000-V thruster. The probe resolution in relative
percentage scales as the velocity of the particles, which scale as the square root of the accelerating voltage. This is
part of the reason why ExB probe traces for ion thruster are typically unable to resolve the VDF of the plume
particles. The high accelerating voltage (1000+ V) associated with an ion thruster means Δu will generally be large.
The combination of low VDF spread and large Δu means that Δu is generally larger than the VDF spread for an ion
thruster. This interesting trend also means that an ExB probe used to interrogate the plume of a Hall thruster
operating at high discharge voltage should have tight dimensions to ensure Δu is several times smaller than the
width of the ion VDF.
Having related Δu to known constants and variables, we now put back the subscript j in the appropriate places to
indicate species-dependence. Mass is normally species dependent; however, Hall thrusters typically operate on a
single atomic species so we will use a single atomic mass constant. The result is shown in Eq. (39).
GeBZ
muu
0j
20
j (39)
For an ExB probe with good velocity resolution, that is to say uj << u0, the integral term in Eq. (23) can be
approximated as fj(u0)*2uj. Taking the uj << u0 approximation and substituting Eq. (39) into Eq. (23), we arrive
at Eq. (40).
0
P00jj
300PjP,
B
mGA2K,)u(fnuK)V(I (40)
The 33st International Electric Propulsion Conference, The George Washington University, USA
October 6 – 10, 2013
25
where K0 is a constant for a given probe design. Further substituting Eq. (24) into Eq. (40), we arrive at Eq. (41).
f023
f0
01P2j
3Pj1PjP,
DB
1K,
)DB(
KK,)VK(fVnK)V(I (41)
Where K1 and K2 are constants for a given probe design. Depending on which VDF form is in use, the associated
equation is substituted into fj, and Eq. (41) is fitted to the ExB probe trace to solve for the fitting constant. Note, Eq.
(13) is the same as Eq. (41). The formulas presented so far, though appearing in different forms, matches previously
published work.12, 27
It is the formulas to follow that are original and diverge from past work.
To calculate the species fraction and current fraction, we now need the integral equations relating each quantity
to the ExB probe collector current. To find the species fraction, we begin by re-arranging the VP3 term, then
integrating both sides of Eq. (41) with respect to VP from 0 to ∞. Since nj does not depend on VP it can go outside
the integral. The result is shown in Eq. (42). Since the integral of fj from 0 to ∞ is unity, we can further simplify the
result, which is shown in Eq. (43).
P0 3
P
Pj,PP
0P2jj1 dV
V
)V(IdV)VK(fnK
(42)
P0 3
P
Pj,P
1j dV
V
)V(I
K
1n
(43)
Equation (43) relates nj to the ExB probe collector current and can be used to calculate the species fraction. The
integration formula for species fraction is shown in Eq. (44).
k
P0 3
P
Pk,P
P0 3
P
Pj,P
k
k
jj
dVV
)V(I
dVV
)V(I
n
n (44)
To find the current fraction, we begin by relating the current of the j-th species entering the ExB probe, Ij, to the
probe collector current. The current of the j-th species is defined in Eq. (45). Substituting Eq. (24) into Eq. (45)
yields Eq. (46).
0
00j0jPjj du)u(funAeZI (45)
0
PP2jPj2
2Pjj dV)VK(fVnKAeZI
(46)
Next, we rearrange Eq. (41) by dividing both sides by VP2, then integrate both sides with respect to VP from 0 to ∞
to obtain Eq. (47). Substituting Eq. (47) into Eq. (46) yields Eq. (48).
0
P2P
PjP,
1P
0P2jPj dV
V
)V(I
K
1dV)VK(fVn (47)
0
P2P
PjP,
1
22Pj
j dVV
)V(I
K
KAeZI
(48)
Equation (48) relates Ij to the ExB probe collector current and can be used to calculate the current fraction. The
integration formula for the current fraction is shown in Eq. (49).
The 33st International Electric Propulsion Conference, The George Washington University, USA
October 6 – 10, 2013
26
k
P0 2
P
Pk,Pk
P0 2
P
Pj,Pj
k
k
jj
dVV
)V(IZ
dVV
)V(IZ
I
I (49)
B. Traditional versus new integration formulas for ExB probe analysis
Recall, the traditional approach to analyzing ExB probe data involves calculating either by geometry or by
numerical integration the area under the curve, which is assumed to be proportional to the current of the
corresponding species entering the probe. The traditional integration formula for the current fraction can be written
as Eq. (50).
k
P0
Pk,P
P0
Pj,P
k
k
jj
dV)V(I
dV)V(I
I
I (50)
While Eq. (50) is mathematically incorrect, it turns out to be a pretty good approximation of Eq. (49) for
analyzing the plume of a Hall thruster, especially when the VDF is narrow. To see why this is the case, let us
calculate the current fractions for both integration formulas in the limit of very narrow VDFs.
The current fraction calculated from the old (traditional) approach will be labeled with ΩjO and the current
fraction calculated from the new approach will be labeled with ΩjN. Assuming the incoming ion beam is composed
of species with very narrow VDFs and all charged species undergo the same voltage drop, Eq. (49) can be simplified
as shown in Eq. (51), and Eq. (50) can be simplified as shown in Eq. (52).
k
2/3kk
2/3jj
VSame
k
kkk
jjj
VDFNarrow
k
P0 2
P
Pk,Pk
P0 2
P
Pj,Pj
Nj
Zn
Zn
unZ
unZ
dVV
)V(IZ
dVV
)V(IZ
d
(51)
k
2/3kk
2/3jj
VSame
k
3kk
3jj
VDFNarrow
k
P0
Pk,P
P0
Pj,PO
jZn
Zn
un
un
dV)V(I
dV)V(I
d
(52)
The simplified expressions for the two integration approaches are equal. The voltage drop is typically very similar
between the charged species, thus any difference in the results between the new and old approaches arise mostly
from differences in the way the two approaches account for the spread in the VDF. During the present study, the
difference was found to correspond to a change in anode efficiency of only 1-2% on the average.
Acknowledgments
We thank the NASA Space Technology Mission Directorate In-Space Propulsion project for funding this work,
and Timothy D. Smith for managing the work. We thank Peter Peterson for work on the design of the NASA-300M
Hall thruster. We thank Jonathan Van Noord of the University of Michigan and Ioannis G. Mikellides of the NASA
Jet Propulsion Laboratory for work on the design of the NASA-300MS. We thank Christopher Griffith for work on
the design of both the NASA-300M and the NASA-300MS. We thank Thomas Haag for work on the thrust stand
and Daniel L. Brown and Joseph Blakely of the Air Force Research Laboratory for the retarding potential analyzer.
And we thank Kevin L. Blake, George W. Readus, George P. Jacynycz, and Thomas Raly for the thruster
fabrication, assembly of the test setup, and operation of the vacuum facility.
The 33st International Electric Propulsion Conference, The George Washington University, USA
October 6 – 10, 2013
27
References 1"NASA Exploration Systems Mission Directorate Presentation, Human Space Exploration Summary",
http://www.nasa.gov/exploration/new_space_enterprise/home/heft_summary.html, Jan., 2011. 2Mercer, C. R., et al., "Benefits of Power and Propulsion Technology for a Piloted Electric Vehicle to an Asteroid ", 47th
AIAA/ASME/SAE/ASEE Joint Propulsion Conference & Exhibit, AIAA-2011-7252, San Diego, CA, 31 Jul.- 3 Aug., 2011. 3Capadona, L. A., et al., "Feasibility of Large High-Powered Solar Electric Propulsion Vehicles: Issues and Solutions", 47th
AIAA/ASME/SAE/ASEE Joint Propulsion Conference & Exhibit, AIAA-2011-7251, San Diego, CA, 31 Jul.- 3 Aug., 2011. 4Brophy, J. R., et al., "300-kW Solar Electric Propulsion System Configuration for Human Exploration of Near-Earth Asteroids",
47th AIAA/ASME/SAE/ASEE Joint Propulsion Conference & Exhibit, AIAA-2011-5514, San Diego, CA, 31 Jul.- 3 Aug., 2011. 5Hofer, R. R. and Randolph, T. M., "Mass and Cost Model for Selecting Thruster Size in Electric Propulsion Systems", 47th
AIAA/ASME/SAE/ASEE Joint Propulsion Conference & Exhibit, AIAA-2011-5518, San Diego, CA, 31 Jul.- 3 Aug., 2011. 6Mikellides, I. G., et al., "Magnetic shielding of the channel walls in a Hall plasma accelerator", Physics of Plasmas, Vol. 18, No.
3, doi:10.1063/1.3551583, Mar. 8, 2011, pp. 033501. 7Hofer, R. R., Goebel, D. M., Mikellides, I. G., and Katz, I., "Design of a Laboratory Hall Thruster with Magnetically Shielded
Atlanta, GA, 29 Jul.- 1 Aug., 2012. 8Mikellides, I. G., Katz, I., Hofer, R. R., and Goebel, D. M., "Design of a Laboratory Hall Thruster with Magnetically Shielded
Channel Walls, Phase III: Comparison of Theory with Experiment", 48th AIAA/ASME/SAE/ASEE Joint Propulsion Conference &
Exhibit, AIAA-2012-3789, Atlanta, GA, 29 Jul.- 1 Aug., 2012. 9Kamhawi, H., Haag, T. W., Jacobson, D. T., and Manzella, D. H., "Performance Evaluation of the NASA-300M 20 kW Hall
Effect Thruster", 47th AIAA/ASME/SAE/ASEE Joint Propulsion Conference & Exhibit, AIAA-2011-5521, San Diego, CA, 31
Jul.- 3 Aug., 2011. 10Kamhawi, H., et al., "Performance and Thermal Characterization of the 20 kW 300MS Hall Effect Thruster", 33rd International
Electric Propulsion Conference, 2013-444, Washington, DC, 6-10 Oct., 2013. 11Shastry, R., Huang, W., Haag, T. W., and Kamhawi, H., "Langmuir Probe Measurements within the Discharge Channel of the
20-kW NASA-300M and NASA-300MS Hall Thrusters", 33rd International Electric Propulsion Conference, 2013-122,
Washington, DC, 6-10 Oct., 2013. 12Shastry, R., Hofer, R. R., Reid, B. M., and Gallimore, A. D., "Method for analyzing ExB probe spectra from Hall thruster
plumes", Review of Scientific Instruments, Vol. 80, No. 6, doi:10.1063/1.3152218, 22 Jun., 2009, pp. 063502. 13Kim, V., "Main physical features and processes determining the performance of stationary plasma thrusters", Journal of
Propulsion and Power, Vol. 14, No. 5, 1998, pp. 736-743. 14Hofer, R. R. and Gallimore, A. D., "High-Specific Impulse Hall Thrusters, Part 2: Efficiency Analysis", Journal of Propulsion
and Power, Vol. 22, No. 4, doi:10.2514/1.15954, Jul.-Aug., 2006, pp. 732-740. 15Brown, D. L., "Investigation of Flow Discharge Voltage Hall Thruster Characteristics and Evaluation of Loss Mechanisms",
Ph.D. Dissertation, Aerospace Engineering, University of Michigan, Ann Arbor, MI, 2009. 16Reid, B. M., "The Influence of Neutral Flow Rate in the Operation of Hall Thrusters", Ph.D. Dissertation, Aerospace
Engineering, University of Michigan, Ann Arbor, MI, 2008. 17Manzella, D. M., "Scaling Hall Thrusters to High Power", Ph.D. Dissertation, Mechanical Engineering, Stanford University,
Stanford, CA, 2005. 18Hofer, R. R., Peterson, P. Y., Gallimore, A. D., and Jankovsky, R. S., "A High Specific Impulse Two-Stage Hall Thruster with
Plasma Lens Focusing", 27th International Electric Propulsion Conference, IEPC-2001-036, Pasadena, CA, 15-19 Oct., 2001. 19Hofer, R. R. and Gallimore, A. D., "The Role of Magnetic Field Topography in Improving the Performance of High-Voltage
Hall Thrusters", 38th AIAA/ASME/SAE/ASEE Joint Propulsion Conference & Exhibit, AIAA-2002-4111, Indianapolis, IN, 7-10
Jul., 2002. 20Haag, T. W., "Thrust stand for high-power electric propulsion devices", Review of Scientific Instruments, Vol. 62, No. 5,
doi:10.1063/1.1141998, May, 1991, pp. 1186. 21Lieberman, M. A. and Lichtenberg, A. J., Electrostatic Probe Diagnostics, in Principles of Plasma Discharges and Materials
Processing, 2nd ed., Ch., doi:10.1002/0471724254, Wiley, New York, 2005, pp. 185-203. 22Savitzky, A. and Golay, M. J. E., "Smoothing and Differentiation of Data by Simplified Least Squares Procedures", Analytical
Chemistry, Vol. 36, No. 8, doi:10.1021/ac60214a047, Jul., 1964, pp. 1627-1639. 23Steinier, J., Termonia, Y., and Deltour, J., "Comments on Smoothing and Differentiation of Data by Simplified Least Squares
Procedure", Analytical Chemistry, Vol. 44, No. 11, doi:10.1021/ac60319a045, Sep., 1972, pp. 1906-1909. 24Hutchinson, I. H., Principles of Plasma Diagnostics, 2nd ed., doi:10.1017/CBO9780511613630, Cambridge University Press,
2002. 25Beal, B. E., "Clustering of Hall Effect Thrusters for High-Power Electric Propulsion Applications", Ph.D. Dissertation,
Aerospace Engineering, University of Michigan, Ann Arbor, MI, 2004. 26Linnell, J. A., "An Evaluation of Krypton Propellant in Hall Thrusters", Ph.D. Dissertation, Aerospace Engineering, University
of Michigan, Ann Arbor, MI, 2007. 27Kim, S.-W., "Experimental Investigations of Plasma Parameters and Species-Dependent Ion Energy Distribution in the Plasma
Exhaust Plume of a Hall Thruster", Ph.D. Dissertation, Aerospace Engineering, University of Michigan, Ann Arbor, MI, 1999. 28Brown, D. L. and Gallimore, A. D., "Evaluation of Facility Effects on Ion Migration in a Hall Thruster Plume", Journal of
Propulsion and Power, Vol. 27, No. 3, doi:10.2514/1.B34068, May-Jun, 2011, pp. 573-585.
The 33st International Electric Propulsion Conference, The George Washington University, USA
October 6 – 10, 2013
28
29Brown, D. L. and Gallimore, A. D., "Evaluation of Ion Collection Area in Faraday probes", Review of Scientific Instruments,
Vol. 81, No. 6, doi:10.1063/1.3449541, 25 Jun., 2010, pp. 063504. 30Huang, W., Kamhawi, H., and Shastry, R., "Farfield Ion Current Density Measurements before and after the NASA HiVHAc
Jul.- 1 Aug., 2012. 31Reid, B. M. and Gallimore, A. D., "Near-field Ion Current Density Measurements of a 6-kW Hall Thruster", 31st International
Electric Propulsion Conference, 2009-124, Ann Arbor, MI, 20-24 Sep., 2009. 32Hagstrum, H. D., "Auger Ejection of Electrons from Tungsten by Noble Gas Ions", Physical Review, Vol. 96, No. 2,
doi:10.1103/PhysRev.96.325, 15 Oct., 1954, pp. 325-335. 33Hagstrum, H. D., "Auger Ejection of Electrons from Molybdenum by Noble Gas Ions", Physical Review, Vol. 104, No. 3,
doi:10.1103/PhysRev.104.672, 1 Nov., 1956, pp. 672-683. 34Hagstrum, H. D., "Auger Ejection of Electrons from Tungsten by Noble Gas Ions", Physical Review, Vol. 104, No. 2,
doi:10.1103/PhysRev.104.317, 15 Oct., 1956, pp. 317-318. 35Hagstrum, H. D., "Metastable Ions of the Noble Gases", Physical Review, Vol. 104, No. 2, doi:10.1103/PhysRev.104.309, Sep.,
1956, pp. 309-316. 36Choueiri, E. Y., "Fundamental difference between the two Hall thruster variants", Physics of Plasmas, Vol. 8, No. 11,
doi:10.1063/1.1409344, Nov., 2001, pp. 5025-5033. 37Reid, B. M. and Gallimore, A. D., "Langmuir Probe Measurements in the Discharge Channel of a 6-kW Hall Thruster", 44th