Page 1
Farm and landscape tools at Farming Systems Ecology
Klik op het pictogram als u een afbeelding wilt toevoegen
Workshop on Modelling Biodiversity and Ecosystem Services, Rome, 7 & 8 May 2015
Walter Rossing & Jeroen Groot
Page 2
Biocontrol, pollination, and more
• Biocontrol• Agricultural returns• Soil fertility• Biodiversity• Nutritive values• Landscape amenity• Water quality• Recreational value• etc
What is the scope for improvement in one objective before trading off with others?
Page 3
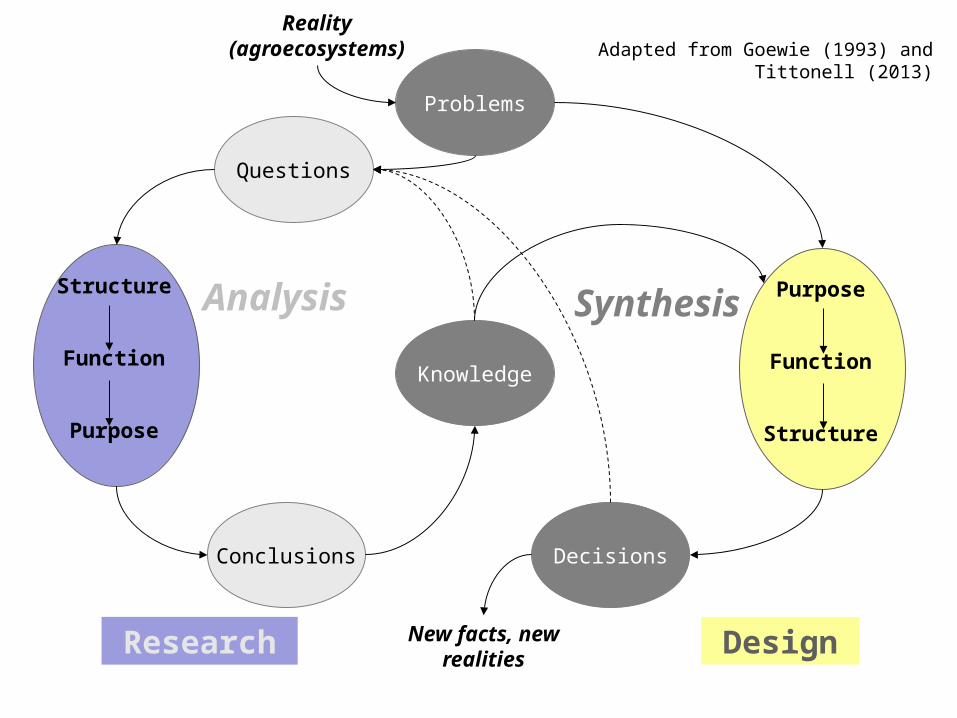
Research Design
Analysis SynthesisStructure
Function
Purpose
Purpose
Function
Structure
New facts, new realities
Conclusions Decisions
Knowledge
Questions
Problems
Reality (agroecosystems) Adapted from Goewie (1993) and
Tittonell (2013)
Page 4
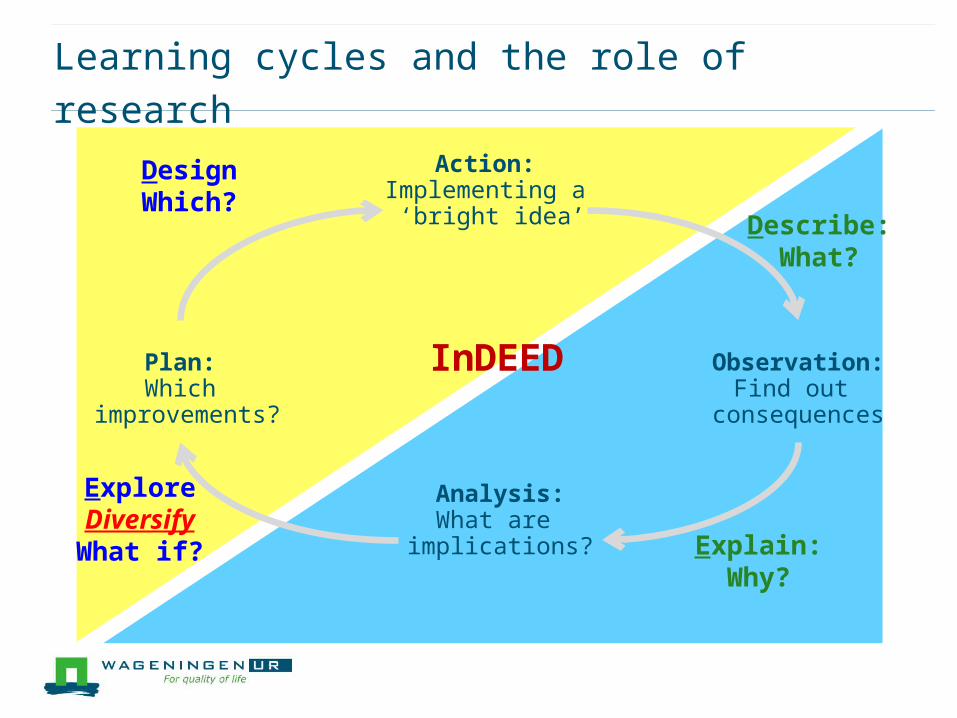
Learning cycles and the role of research
Action:Implementing a
‘bright idea’
Observation:Find out
consequences
Analysis:What are
implications?
Plan:Which
improvements?
Describe: What?
Explain: Why?
Explore Diversify What if?
Design Which?
InDEED
Page 5
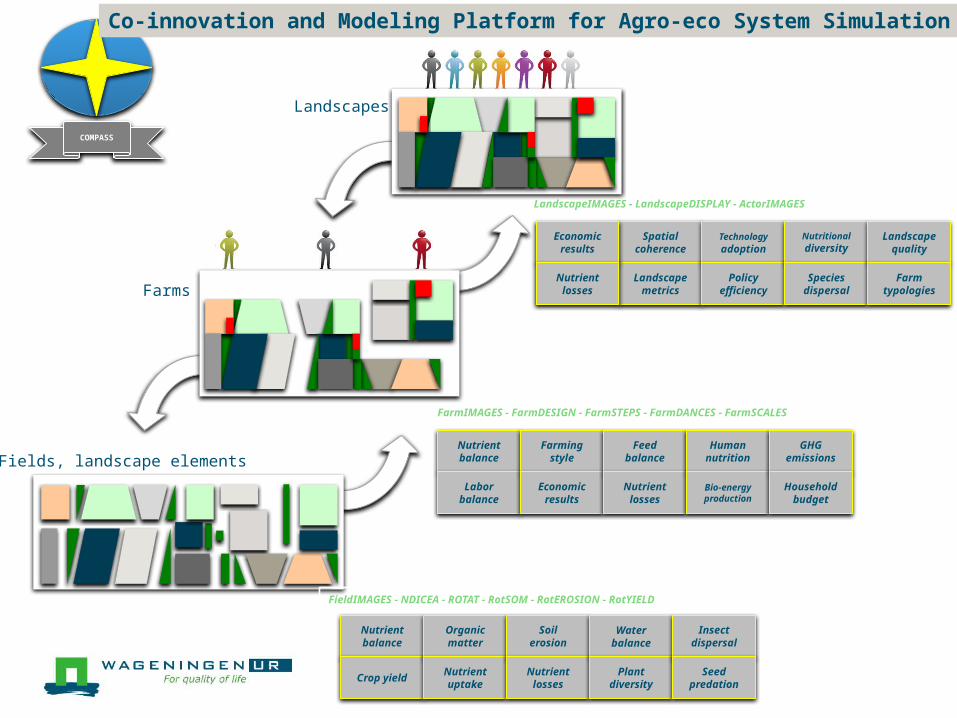
Fields, landscape elements
Farms
Landscapes
FarmIMAGES - FarmDESIGN - FarmSTEPS - FarmDANCES - FarmSCALES
FieldIMAGES - NDICEA - ROTAT - RotSOM - RotEROSION - RotYIELD
LandscapeIMAGES - LandscapeDISPLAY - ActorIMAGES
Spatialcoherence
Landscape
metrics
Nutrient balance
Labor balance
Farmingstyle
Economicresults
Nutrient balance
Crop yield
Organicmatter
Nutrient uptake
Soilerosion
Nutrient losses
Feedbalance
Nutrientlosses
Waterbalance
Plantdiversity
Economicresults
Nutrientlosses
Technology adoption
Policy efficiency
COMPASS
Insectdispersal
Seed predation
Humannutrition
Bio-energyproduction
GHGemissions
Householdbudget
Nutritionaldiversity
Speciesdispersal
Landscape
quality
Farmtypologies
Co-innovation and Modeling Platform for Agro-eco System Simulation
Page 6
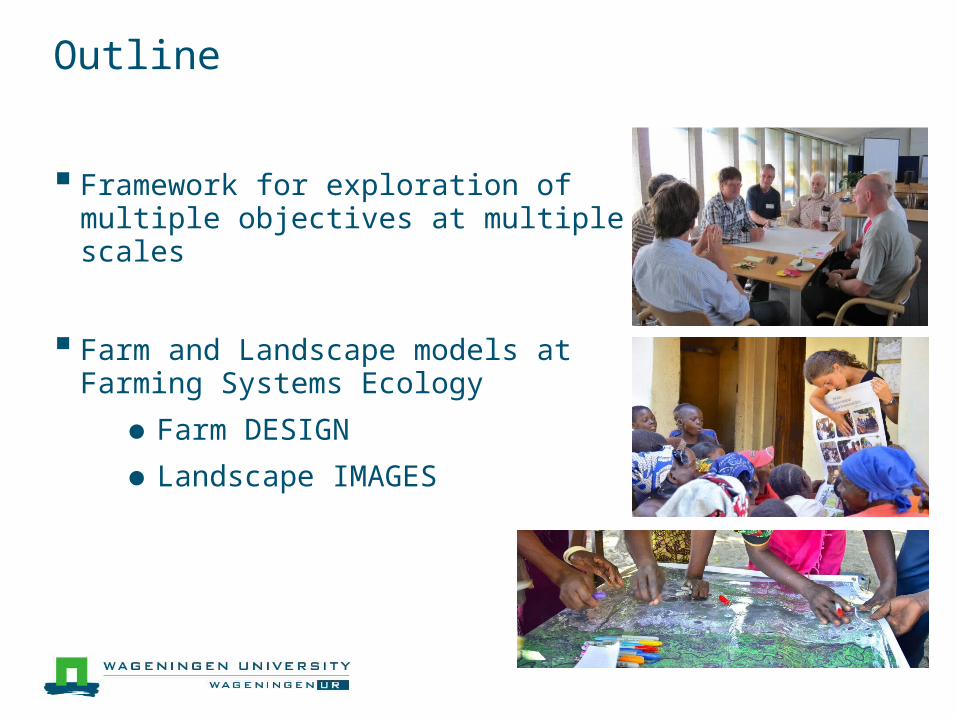
Outline
Framework for exploration of multiple objectives at multiple scales
Farm and Landscape models at Farming Systems Ecology
●Farm DESIGN
●Landscape IMAGES
Page 7
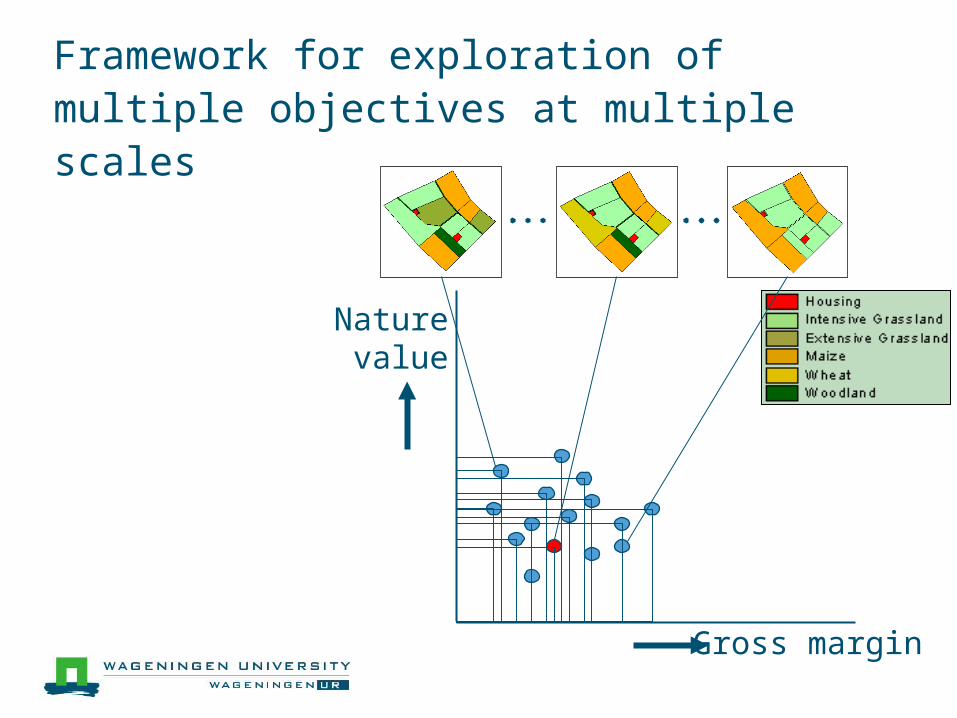
Framework for exploration of multiple objectives at multiple scales
Naturevalue
Gross margin
Page 8
Framework for exploration of multiple objectives at multiple scales
Naturevalue
Gross margin
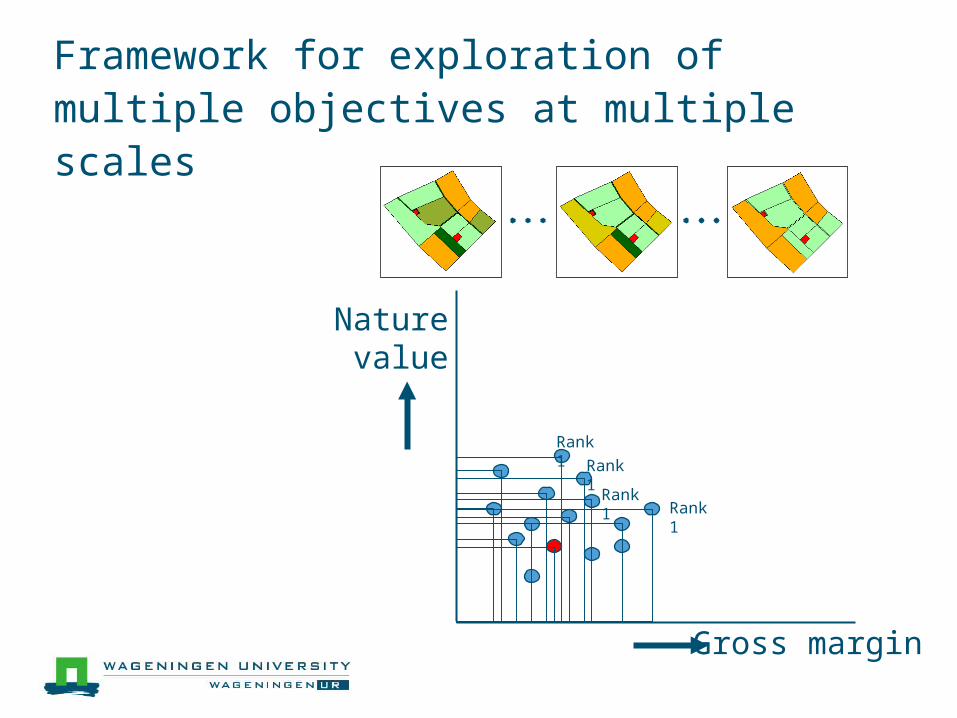
Rank 1
Rank 1
Rank 1Rank 1
Page 9
Framework for exploration of multiple objectives at multiple scales
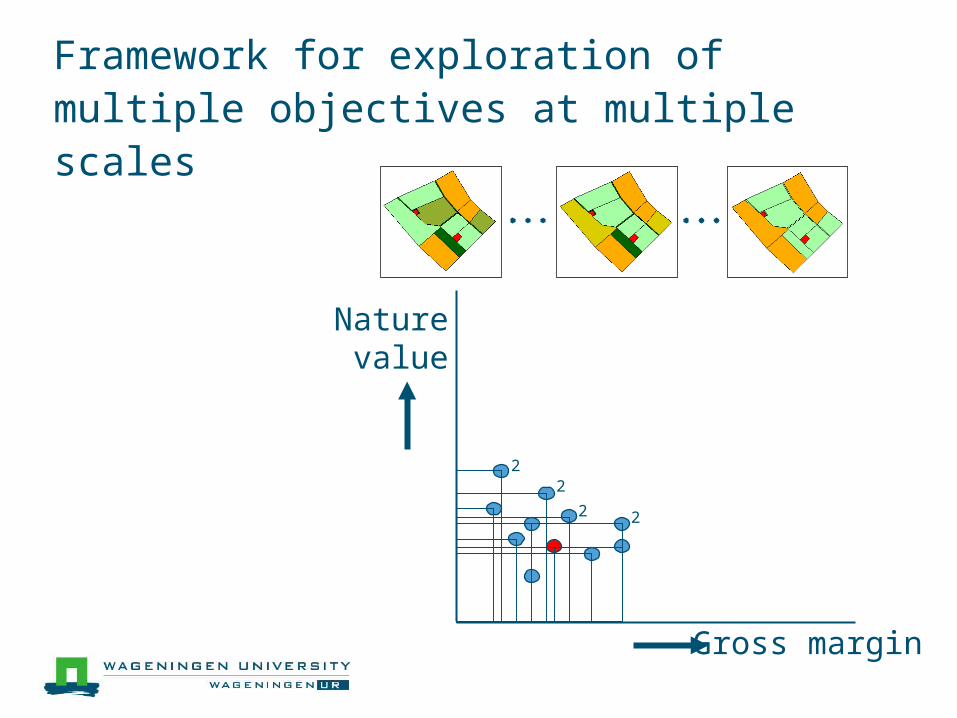
Naturevalue
Gross margin
22
2 2
Page 10
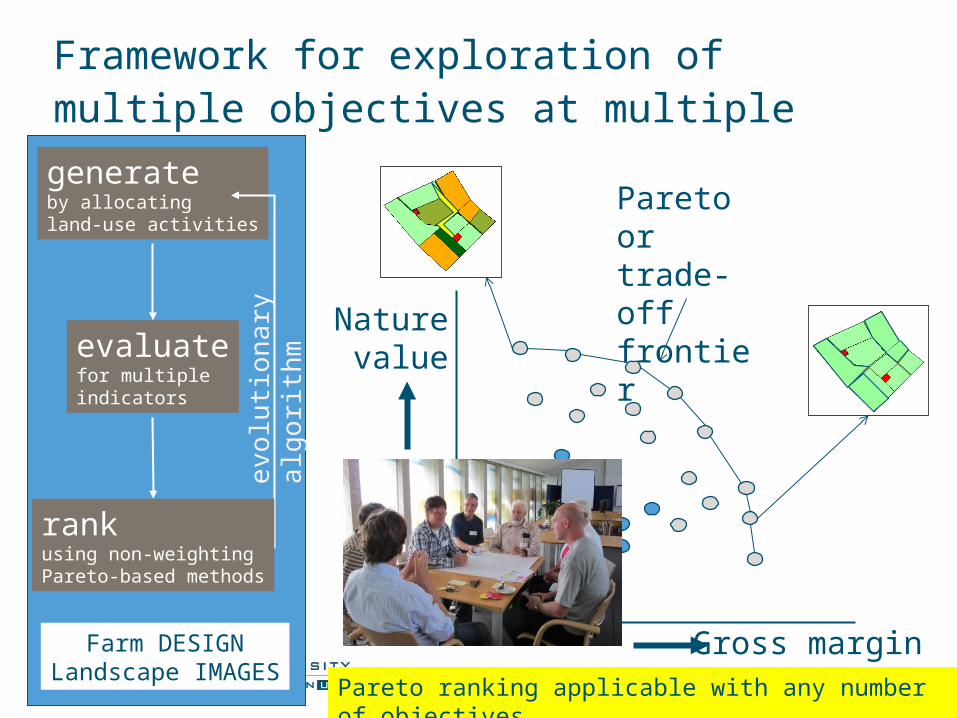
Framework for exploration of multiple objectives at multiple scales
generateby allocatingland-use activities
evaluatefor multipleindicators
rankusing non-weightingPareto-based methods
Farm DESIGNLandscape IMAGES
evolu
tion
ary
alg
ori
thmNature
value
Gross margin
1
1
11
22
2 2
2
33
34
4
5
Page 11
Framework for exploration of multiple objectives at multiple scales
generateby allocatingland-use activities
evaluatefor multipleindicators
rankusing non-weightingPareto-based methods
Farm DESIGNLandscape IMAGES
evolu
tion
ary
alg
ori
thmNature
value
Gross marginPareto ranking applicable with any number of objectives
Pareto or trade-off frontier
Page 12
Outline
Framework for exploration of multiple objectives at multiple scales
Farm and Landscape models at Farming Systems Ecology
●Farm DESIGN
●Landscape IMAGES
Page 13
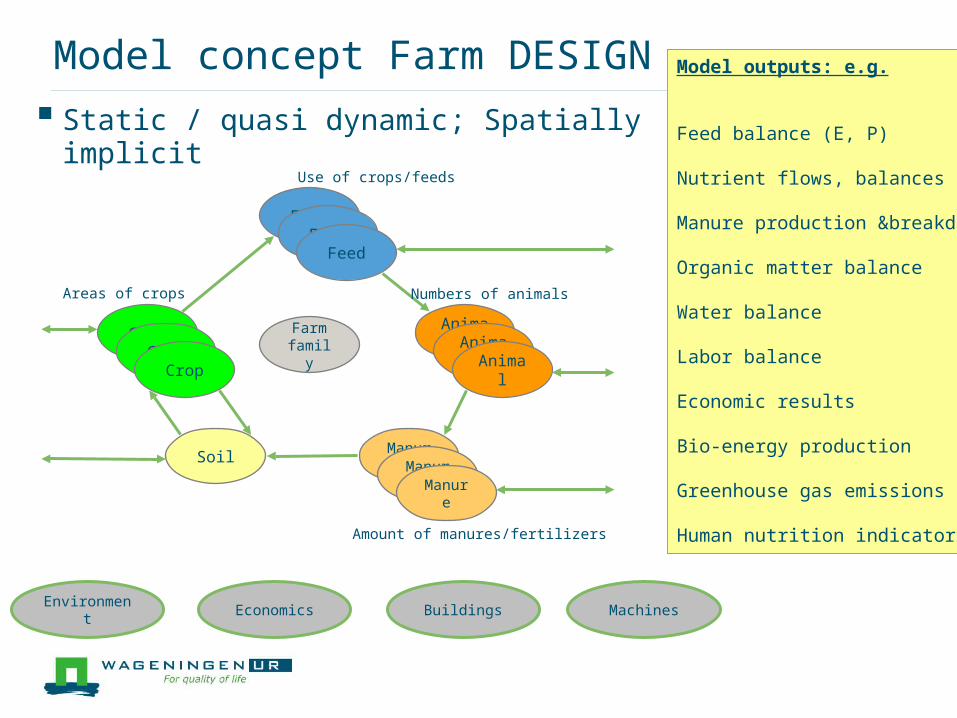
Model concept Farm DESIGN
Feed
Animal
Soil Manure
Crop FarmfamilyCrop
Crop
FeedFeed
AnimalAnimal
ManureManure
Areas of crops
Use of crops/feeds
Numbers of animals
Amount of manures/fertilizers
Environment Economics Buildings Machines
Model outputs: e.g.
Feed balance (E, P)
Nutrient flows, balances (C, NPK)
Manure production &breakdown
Organic matter balance
Water balance
Labor balance
Economic results
Bio-energy production
Greenhouse gas emissions
Human nutrition indicators
Static / quasi dynamic; Spatially implicit
Page 14
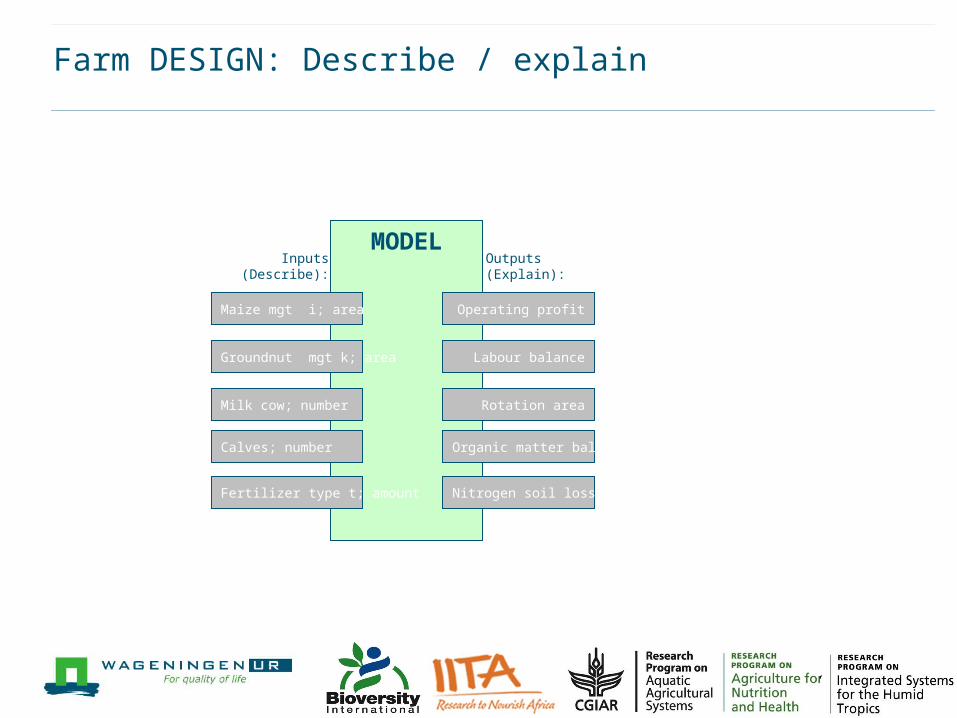
Farm DESIGN: Describe / explain
MODEL
Maize mgt i; area
Milk cow; number
Fertilizer type t; amount
Inputs(Describe):
Groundnut mgt k; area
Calves; number
Operating profit
Rotation area
Nitrogen soil losses
Outputs(Explain):
Labour balance
Organic matter balance
Page 15
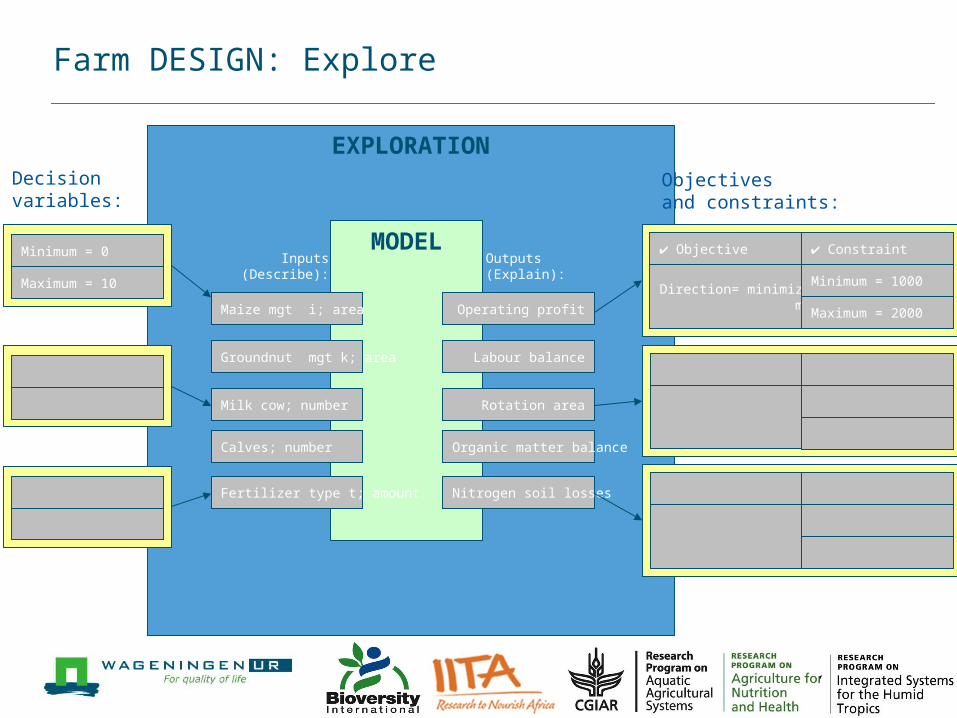
Farm DESIGN: Explore
EXPLORATION
MODEL
Maize mgt i; area
Milk cow; number
Fertilizer type t; amount
Inputs(Describe):
Groundnut mgt k; area
Calves; number
Operating profit
Rotation area
Nitrogen soil losses
Outputs(Explain):
Labour balance
Organic matter balance
Decisionvariables:
Objectivesand constraints:
Minimum = 0
Maximum = 10
✔ Objective
Direction= minimize, or maximize
✔ Constraint
Minimum = 1000
Maximum = 2000
Page 16
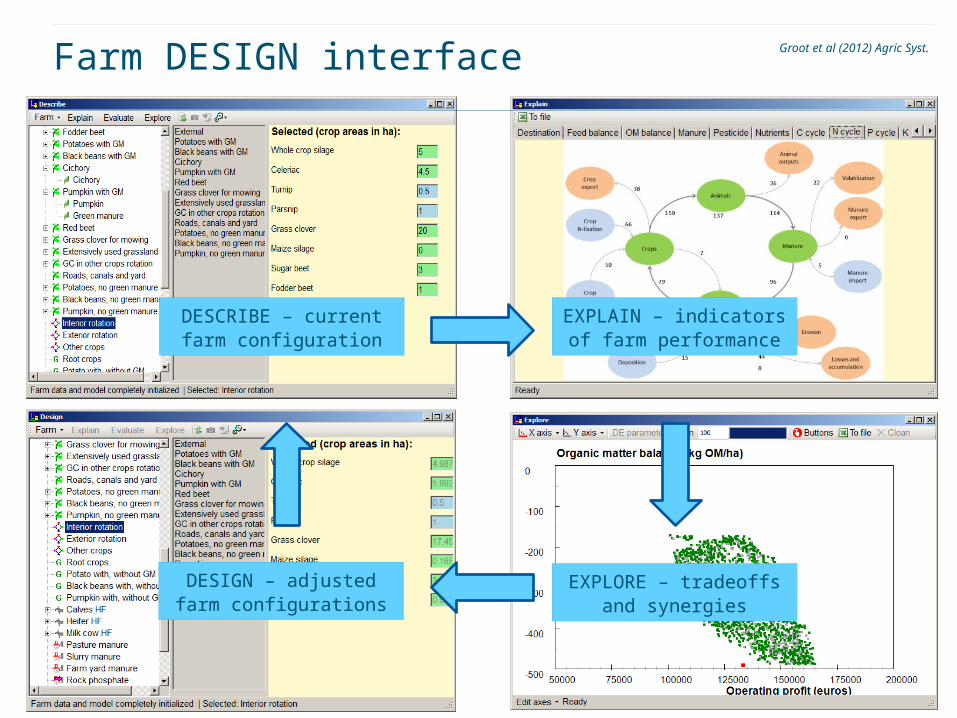
Farm DESIGN interface
DESCRIBE – currentfarm configuration
EXPLAIN – indicatorsof farm performance
DESIGN – adjustedfarm configurations
EXPLORE – tradeoffsand synergies
Groot et al (2012) Agric Syst.
Page 17
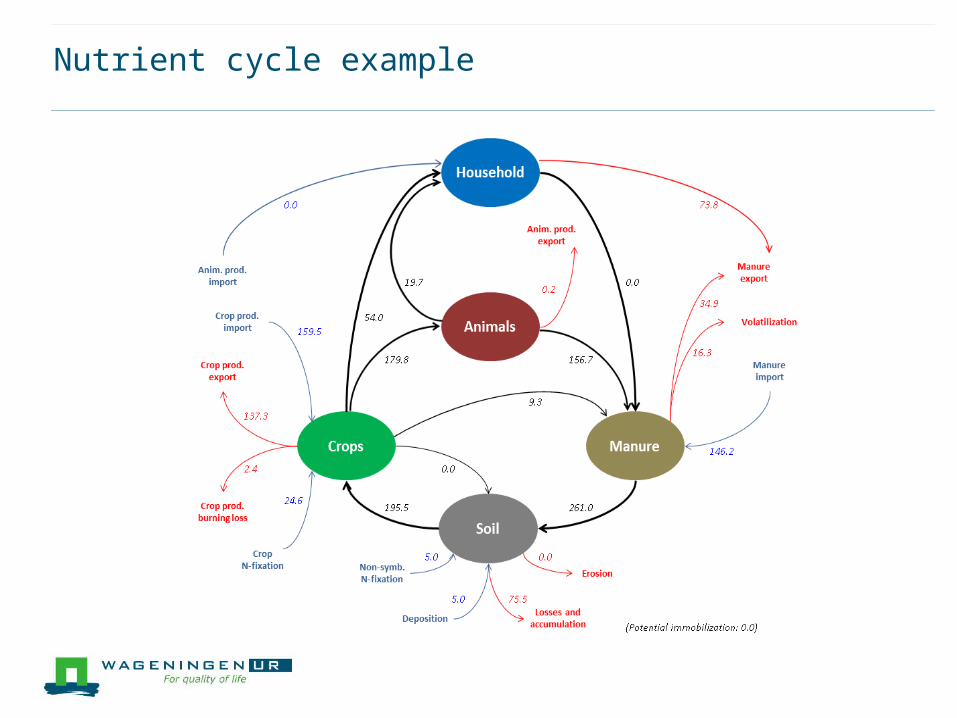
Groot, Oomen & Rossing, 2012. Agricultural Systems.
Red = original farmBlue = farms performing better for all objectivesGreen = other farms that meet constraints
Page 18
Nutrient cycle example
Page 19
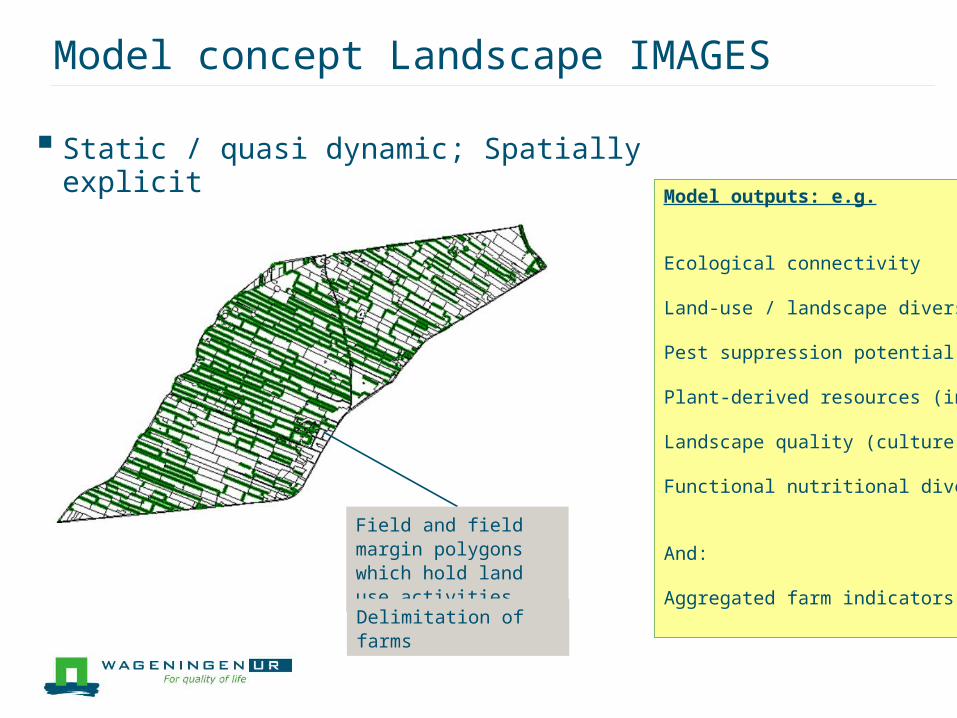
Model concept Landscape IMAGES
Model outputs: e.g.
Ecological connectivity
Land-use / landscape diversity
Pest suppression potential
Plant-derived resources (insects)
Landscape quality (culture-history)
Functional nutritional diversity
And:
Aggregated farm indicators
Static / quasi dynamic; Spatially explicit
Field and field margin polygons which hold land use activities
Delimitation of farms
Page 20
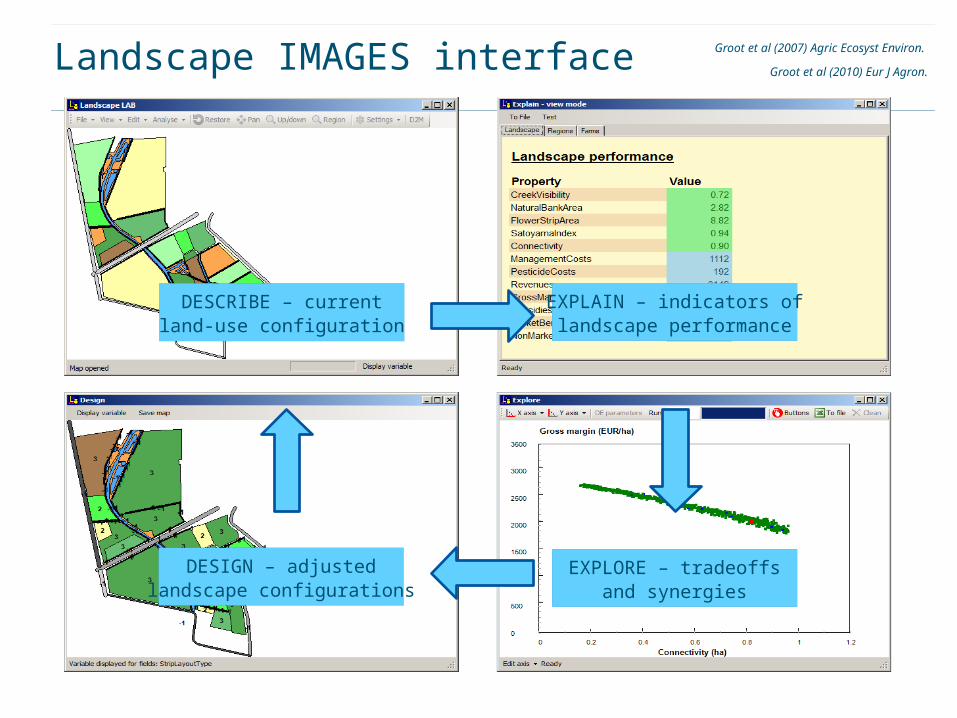
Landscape IMAGES interface Groot et al (2007) Agric Ecosyst Environ.
Groot et al (2010) Eur J Agron.
DESCRIBE – currentland-use configuration
EXPLAIN – indicators oflandscape performance
DESIGN – adjustedlandscape configurations
EXPLORE – tradeoffsand synergies
Page 21
Farming and hedgerow management NFW
Groot et al (2007) Agriculture, Ecosystems and Environment 120, 58-69.
Friesian Landscape Management NGO
Page 22
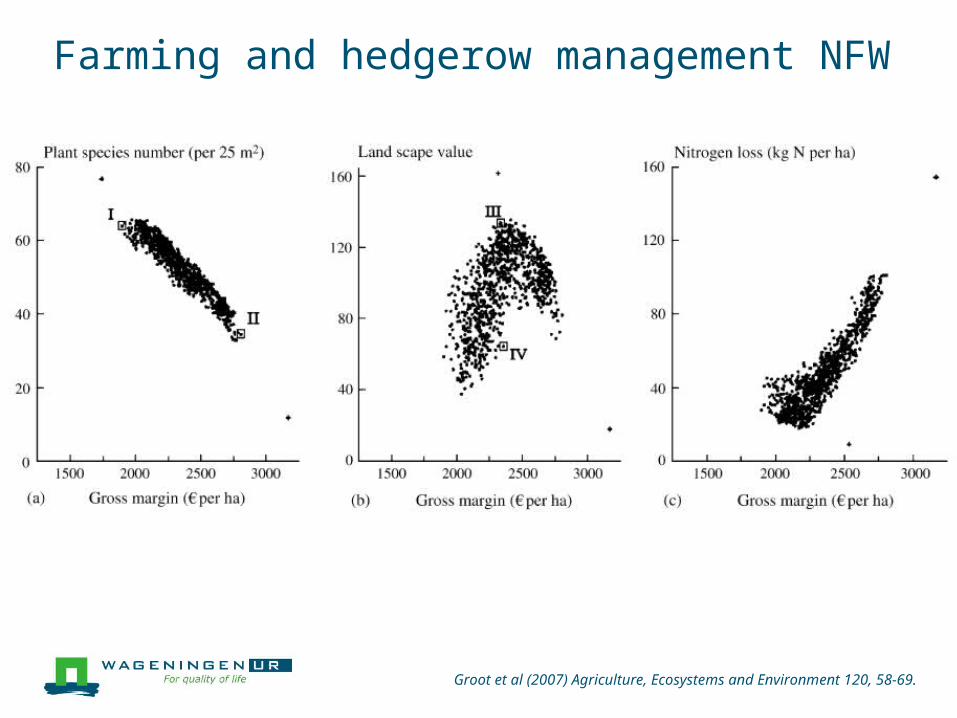
Farming and hedgerow management NFW
Groot et al (2007) Agriculture, Ecosystems and Environment 120, 58-69.
Page 23
0
5
10
15
20
25
30
35
40
45
0 20 40 60 80 100
0
10
20
30
40
50
60
70
80
90
0 20 40 60 80 100
0
2
4
6
8
10
12
14
0 20 40 60 80 100
0
2
4
6
8
10
12
0 20 40 60 80 100
0
20
40
60
80
100
120
140
0 20 40 60 80 100
0
200
400
600
800
1000
1200
0 20 40 60 80 100
0
2
4
6
8
10
12
0 2 4 6 8 10 12 14
0
20
40
60
80
100
120
140
0 2 4 6 8 10 12 14
0
200
400
600
800
1000
1200
0 2 4 6 8 10 12 14
0
5
10
15
20
25
30
35
40
45
0 2 4 6 8 10 12 14
0
10
20
30
40
50
60
70
80
90
0 2 4 6 8 10 12 14
0
20
40
60
80
100
120
140
0 2 4 6 8 10 12
0
200
400
600
800
1000
1200
0 2 4 6 8 10 12
0
5
10
15
20
25
30
35
40
45
0 2 4 6 8 10 12
0
10
20
30
40
50
60
70
80
90
0 2 4 6 8 10 12
0
200
400
600
800
1000
1200
0 20 40 60 80 100 120 140
0
5
10
15
20
25
30
35
40
45
0 20 40 60 80 100 120 140
0
10
20
30
40
50
60
70
80
90
0 20 40 60 80 100 120 140
0
5
10
15
20
25
30
35
40
45
0 200 400 600 800 1000 1200
0
10
20
30
40
50
60
70
80
90
0 200 400 600 800 1000 12000
10
20
30
40
50
60
70
80
90
0 5 10 15 20 25 30 35 40 45
Spa
tial
co
hesi
onL
/T r
atio
Por
osit
yS
ight
line
ho
mog
enei
tyH
edge
row
s ad
ded
(km
)H
edge
row
s re
mov
ed (
km)
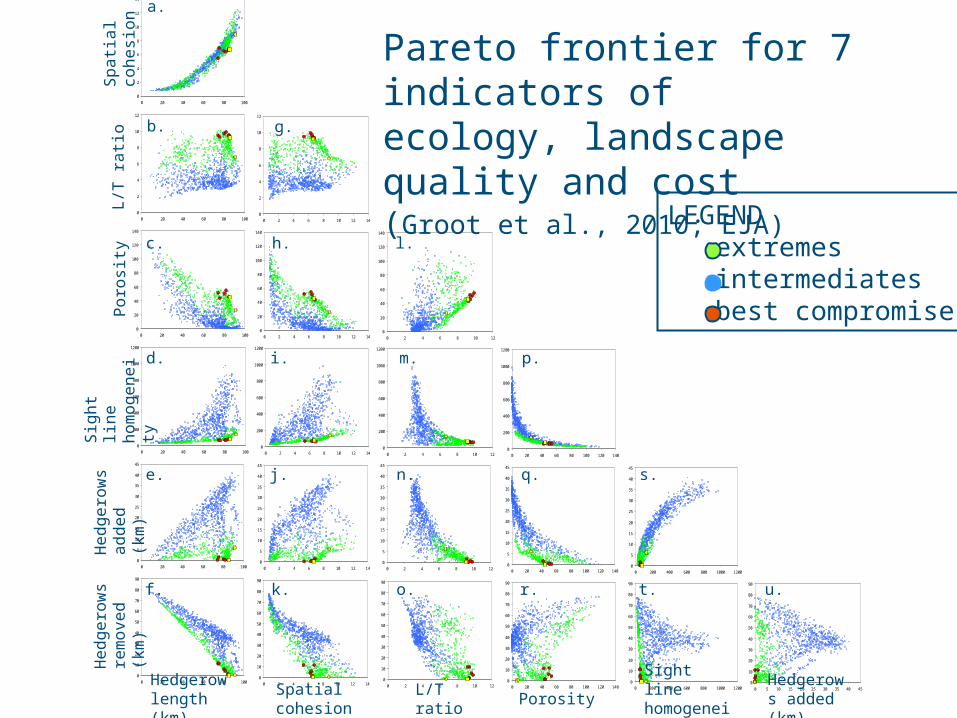
Sight line homogeneity
Hedgerows added (km)
Spatial cohesion
L/T ratio PorosityHedgerow length (km)
a.
b. g.
c.
d.
e.
h.
i.
j.
l.
m.
n.
f. k. o.
p.
q.
r.
s.
t. u.
Pareto frontier for 7 indicators ofecology, landscape quality and cost(Groot et al., 2010; EJA)LEGEND
extremesintermediatesbest compromises
Page 24
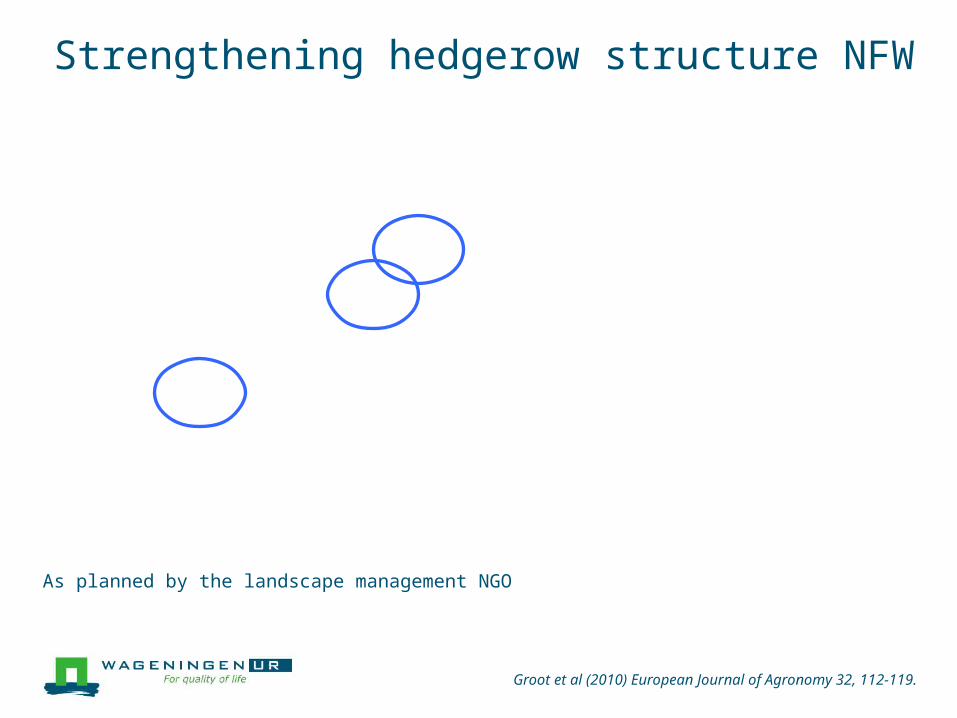
Strengthening hedgerow structure NFW
Groot et al (2010) European Journal of Agronomy 32, 112-119.
As planned by the landscape management NGO
Page 25
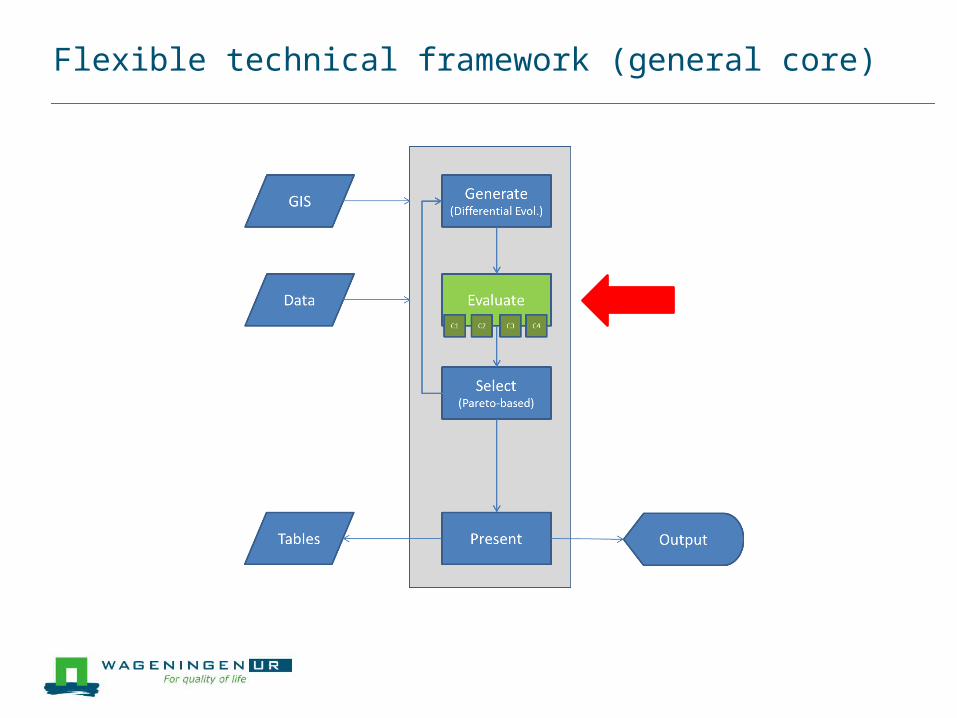
Flexible technical framework (general core)
Page 26
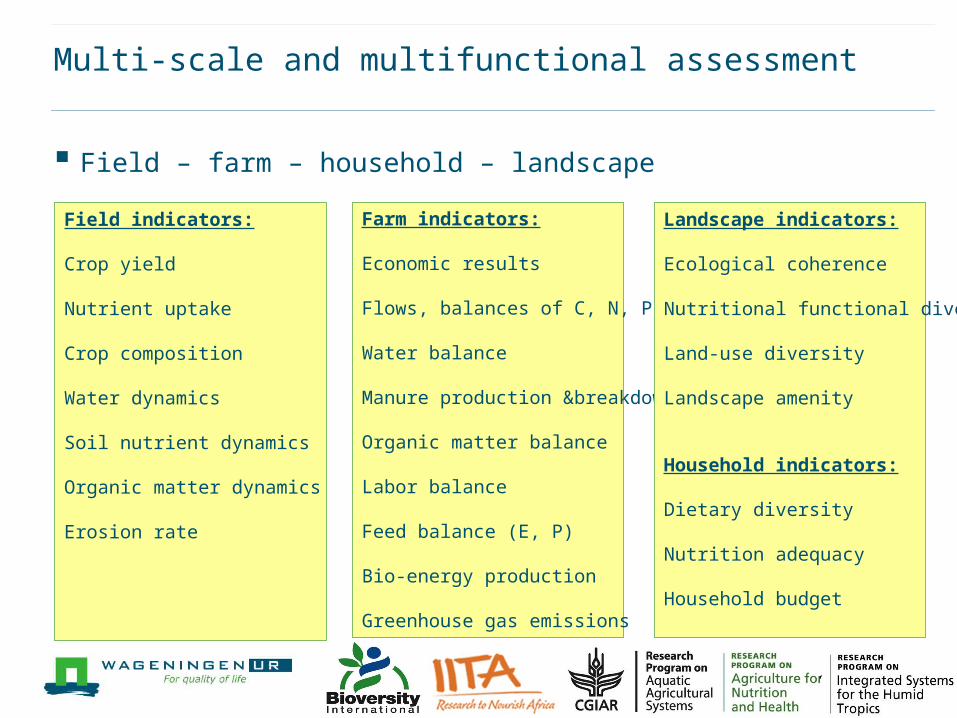
Multi-scale and multifunctional assessment
Field – farm – household – landscape
Farm indicators:
Economic results
Flows, balances of C, N, P, K
Water balance
Manure production &breakdown
Organic matter balance
Labor balance
Feed balance (E, P)
Bio-energy production
Greenhouse gas emissions
Field indicators:
Crop yield
Nutrient uptake
Crop composition
Water dynamics
Soil nutrient dynamics
Organic matter dynamics
Erosion rate
Landscape indicators:
Ecological coherence
Nutritional functional diversity
Land-use diversity
Landscape amenity
Household indicators:
Dietary diversity
Nutrition adequacy
Household budget
Page 27
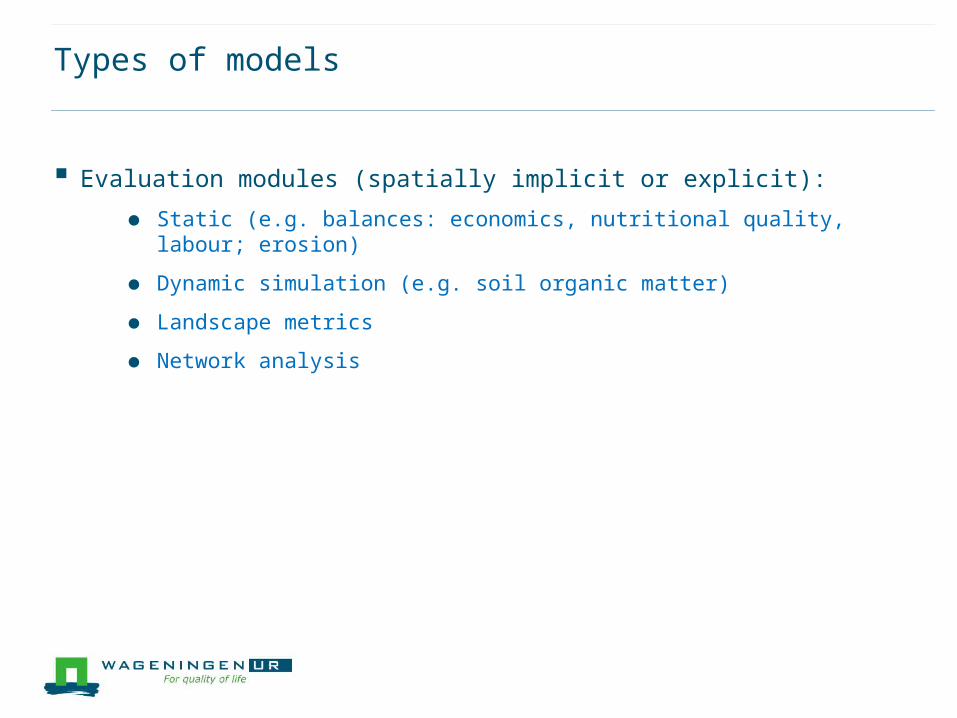
Types of models
Evaluation modules (spatially implicit or explicit):
● Static (e.g. balances: economics, nutritional quality, labour; erosion)
● Dynamic simulation (e.g. soil organic matter)
● Landscape metrics
● Network analysis
● Etc.
Framework kernel:
● Pareto-based Differential Evolution (evolutionary algorithm)
● [Agent based models]
Page 28
Current projects CRP Humidtropics (PhD + 2 postdocs; Kenya, Zambia), with IITA, ICRAF, Bioversity, AVRDC
CRP Agric. for Nutrition & Health (Zambia), with Bioversity, Columbia Univ., IFPRI
CATIE/CIRAD/SupAgro AgTrain (PhD; Costa Rica)– Ecosystem services in coffee
CIRAD (2 PhD; Amazonia)– Integrated crop-livestock-tree systems
CRP WLE (Vietnam, Cambodia) Consultancy – Landscapes and biological control, FFS
NWO (China) postdoc – Living landscapes biological control and pollination
NWO (postdoc; the Netherlands)- Biodiversity Works national program
EU-FP7 (postdoc; Europe)- Quantification of Ecosystem Services in Agro-ecosystems
CRPs MAIZE (Attic; 4 PhD + postdoc; Ethiopia, Nepal, Mexico) and WHEAT (Nutrition), with CIMMYT
CCAFS (through Birthe Paul; South Vietnam, Tanzania), with CIAT
Africa RISING (2 PhD; Tanzania, Malawi, Eastern Zambia, Northern Ghana), with IITA, CIAT, IFPRI, MSU
CIRAD/Africa RICE (PhD; Benin) - Smallholder livelihoods in rice-based systems
IRD/Univ. O/NGOs WASSA (Burkina Faso) PhD project – Woody amendments for soil
FAO (Madagascar, Zimbabwe) PhD + postdoc – Building resilience for climate change
Page 29
Thank you for your attention
[email protected]
[email protected]
Page 30
Quasi-dynamic application: adaptive capacity
Cortez-Arriola et al., in prep.
Adaptation space by re-arranging current resources and technologies
Adaptation space by adding new resources or technologies
Page 31
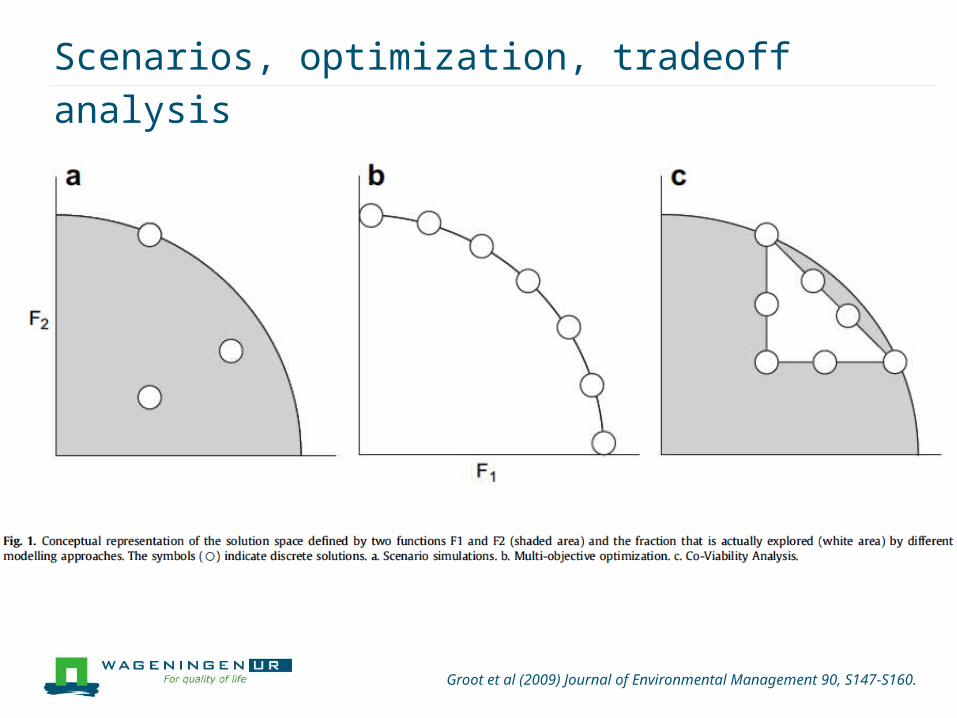
Scenarios, optimization, tradeoff analysis
Groot et al (2009) Journal of Environmental Management 90, S147-S160.
Page 32
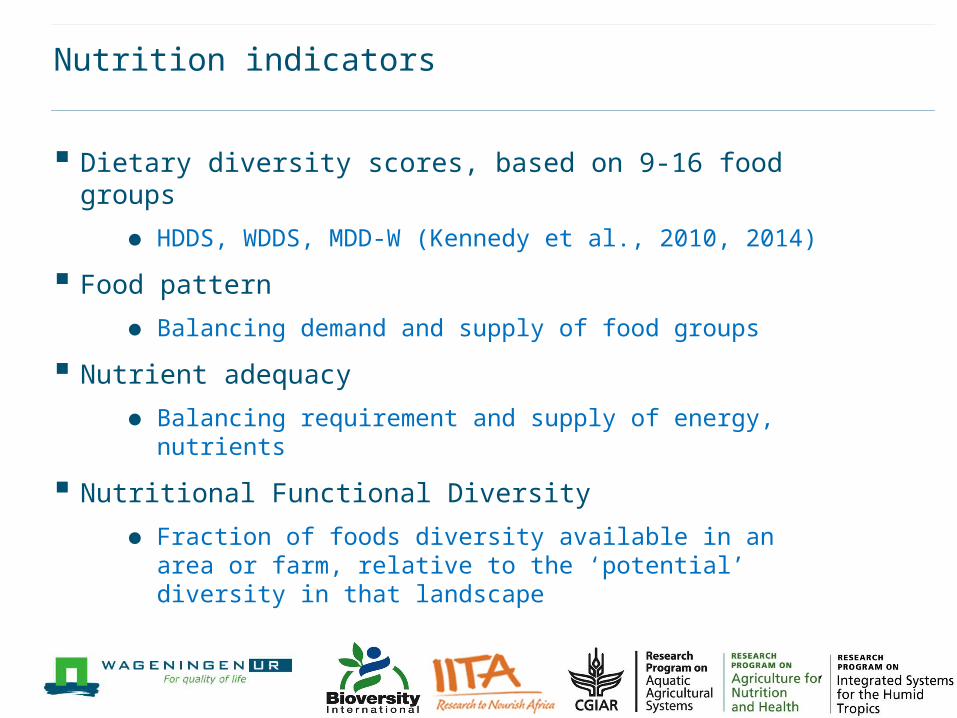
Nutrition indicators
Dietary diversity scores, based on 9-16 food groups
● HDDS, WDDS, MDD-W (Kennedy et al., 2010, 2014)
Food pattern
● Balancing demand and supply of food groups
Nutrient adequacy
● Balancing requirement and supply of energy, nutrients
Nutritional Functional Diversity
● Fraction of foods diversity available in an area or farm, relative to the ‘potential’ diversity in that landscape
Page 33
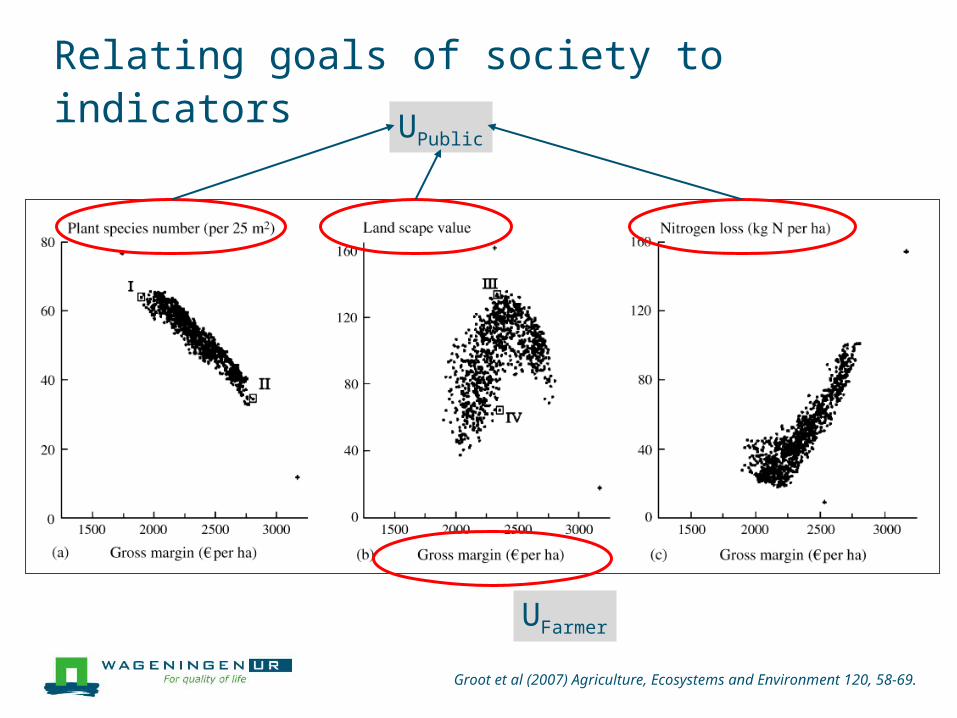
Relating goals of society to indicators
UPublic
UFarmer
Groot et al (2007) Agriculture, Ecosystems and Environment 120, 58-69.
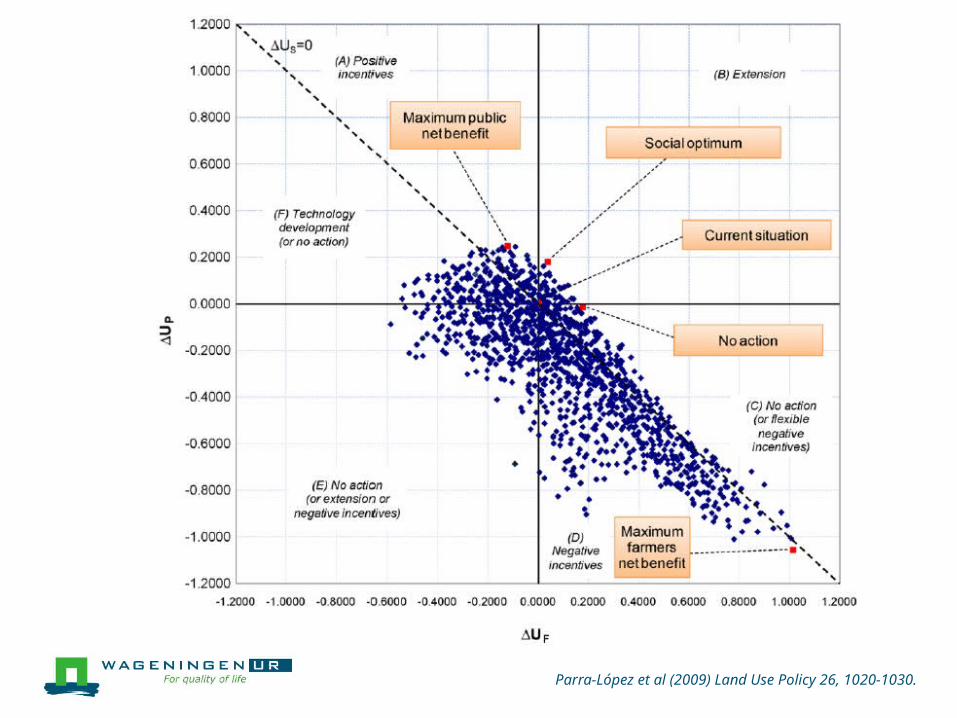
Page 34
Parra-López et al (2009) Land Use Policy 26, 1020-1030.
Page 35
Evolution of solution spaces
ΔUpublic
ΔUprivate
p2
p1
ΔUpublic
ΔUprivate
ΔUsociety=0
p1
p0
ΔU = change in utility
Parra-López et al (2009) Land Use Policy 26, 1020-1030.