1 Farm Classification Systems for North American Agriculture Katrin Nagelschmitz Agriculture and Agri-Food Canada (AAFC) 1341 Baseline Road Ottawa, Canada [email protected]Arden Esqueda Agriculture and Agri-Food Canada (AAFC) 1341 Baseline Road Ottawa, Canada [email protected]Hugo Hernandez Ramos Instituto Nacional de Estadística y Geografía (INEGI) Boulevard José María Chávez 1913, Edificio Parque Héroes, Colonia Prados de Villasunción, Aguascalientes, Aguascalientes, México [email protected]Luis Fernando Esteves Cano Instituto Nacional de Estadística y Geografía (INEGI) Boulevard José María Chávez 1913, Edificio Parque Héroes, Colonia Prados de Villasunción, Aguascalientes, Aguascalientes, México [email protected]Mary Ahearn U.S. Department of Agriculture (USDA) - Economic Research Service (ERS) 355 E Street, SW Washington, United States [email protected]The views expressed here are those of the authors and do not necessarily represent those of their respective institutions.
Transcript
1
Farm Classification Systems for North American Agriculture
Farm classifications1 are helpful when analyzing farm-level data within an agricultural
policy context. Classifications serve as a framework for organizing heterogeneous farm
businesses into relatively homogenous groups, according to specific criteria, for economic and
policy research and analysis, such as analysis of the distribution of impacts of programs and
policies.
Most commonly, farms are classified using a single indicator. For example, farm type or
commodity specialization classifications are used to analyze the distribution of impact of a
particular program or policy across different types of production, i. e. livestock producers versus
crop producers, or mixed farming operations versus specialized farms. While these approaches
provides a method for grouping farms into relatively homogeneous groups, classifications using
multiple indictors may provide a more comprehensive grouping of farms.
There are several arguments for creating a classification system based on an integrated set
of indicators. This type of classification offers a tool to synthesize and assess farm indicators as
an integrated set, thus highlighting linkages among the various indicators of interest, as well as
1 Farm classifications are also frequently referred to as farm typologies. In the context of this report, it will refer to
classification.
3
evaluating and designing more differentiated farm-level policies taking into account the wide
range of differences (Andersen et al., 2007).
The farm characteristics selected for classification are typically based on key indicators
identified as relevant to policy discussion (Andersen et al., 2007). Farm classifications have
largely focused on the size and type of the farm. The most commonly used measurements of size
include the land area of the farm, gross sales or gross expenses (Hanson, Stanton, and Ahearn,
1989).
Since 1998, Canada, Mexico and the U.S. use the common North American Industry
Classification System (NAICS) to collect industry statistics in the respective countries. While the
classification was not designed specifically for agriculture, this classification offers standardized
categories where farms are assigned a NAICS code based on their most important production
activity. Currently, this is North America’s only harmonized classification system for agriculture.
While NAICS is useful from a production standpoint, it does not contribute to discussion of any
of the emerging issues in agriculture. Today the objectives of the agricultural policies have been
broadened and increasingly focus on additional indicators.
Research suggests that additional indicators outside of the size and type of farm could help
capture the complexity and diversity of farm behaviour and performance, such as for instance
income of farm operator families, degree of production specialization and production intensity
of land use, (Briggeman et al, 2007; Galbraith et al., 2013, Andersen et al., 2007). A
classification system can only be developed based on available data or, ex ante, it could guide
data collection.
This message resonates in the Global Strategy to Improve Agricultural and Rural Statistics
(FAO, 2010), which was jointly developed based on input from a large number of stakeholders,
including national statistical institutes, ministries of agriculture, and regional and international
organizations. The framework recognizes the linkages between rural households, agricultural
holdings and the land and other natural resources that they use and impact.
A more comprehensive harmonized classification system could help facilitate cross-
country comparisons, allow regions to learn for one another, help identify best practices, and
help recognize cross country similarities (and differences) that may not be obvious at first
glance.
The paper first provides background on the agricultural industries and agricultural policies
of Canada, Mexico and the U.S, to give context to the discussion of farm classifications. The
paper then shows the farm structure in the three countries based on NAICS classifications and
farm size. This is followed by a discussion of additional indicators that have been used to
classify farms for policy discussions, as well as a discussion of the benefit of multi-dimensional
farm classification systems, and related data requirements.
4
2. Background
Canadian, American and Mexican agriculture operate in different economic environments
(see Annex 1), including structure of their industries. This impacts the type of farm classification
system that could be relevant to policy analysis.
The population of Mexico and Canada are respectively about one third and one tenth that
of the U.S. In all three countries around one fifth of the population is rural. The size of the
Canadian and Mexican economies are each about one-tenth of that of the U.S., measured in
Gross Domestic Product (GDP). GDP per capita, however, is very similar in Canadian and U.S.
economies, $47,283 and $46,215, respectively, while the Mexican GDP per capita is $9,566
(2010, FAO).
Agricultural value-added contributes 1.6% of GDP in Canada, 4.3% in Mexico, and 1.2%
in the U.S. Value-added per agricultural worker was highest in the U.S., with Canadian value-
added per agricultural worker 90% of the U.S. and Mexico 7 % of the U.S. (2009, FAO).
Agricultural Total Factor Productivity grew the most between 1992 and 2009 in Mexico and
least in the U.S. (Fuglie, 2012).
Total trade among the three North American countries has steadily increased since the
North American Free Trade Agreement (NAFTA) between Canada, the United States, and
Mexico became effective January 1, 19942.
The U.S. is the most important trading partner for both Canada and Mexico. Canada is the
second most important destination for Mexican vegetables, and Canada follows the U.S.as the
second most important source for wheat, beef and pork to Mexico. The most important
destination for U.S. exports is currently China, but Canada and Mexico rank second and third,
respectively (ASTI, 2011).
2 NAFTA followed the Canada-US Free Trade Agreement, which had become effective January 1st, 1989. NAFTA
was signed under the General Agreement on Tariffs and Trade (GATT) framework; the purpose was to liberalize
and increase trade between the three partners beyond what would be possible under the most favored nations (MFN)
status of GATT, and later the World Trade Organization (WTO). NAFTA and the WTO were negotiated roughly
around the same time, and consequently, in the vast majority of cases, NAFTA provisions are in line with the
various WTO Agreements.
5
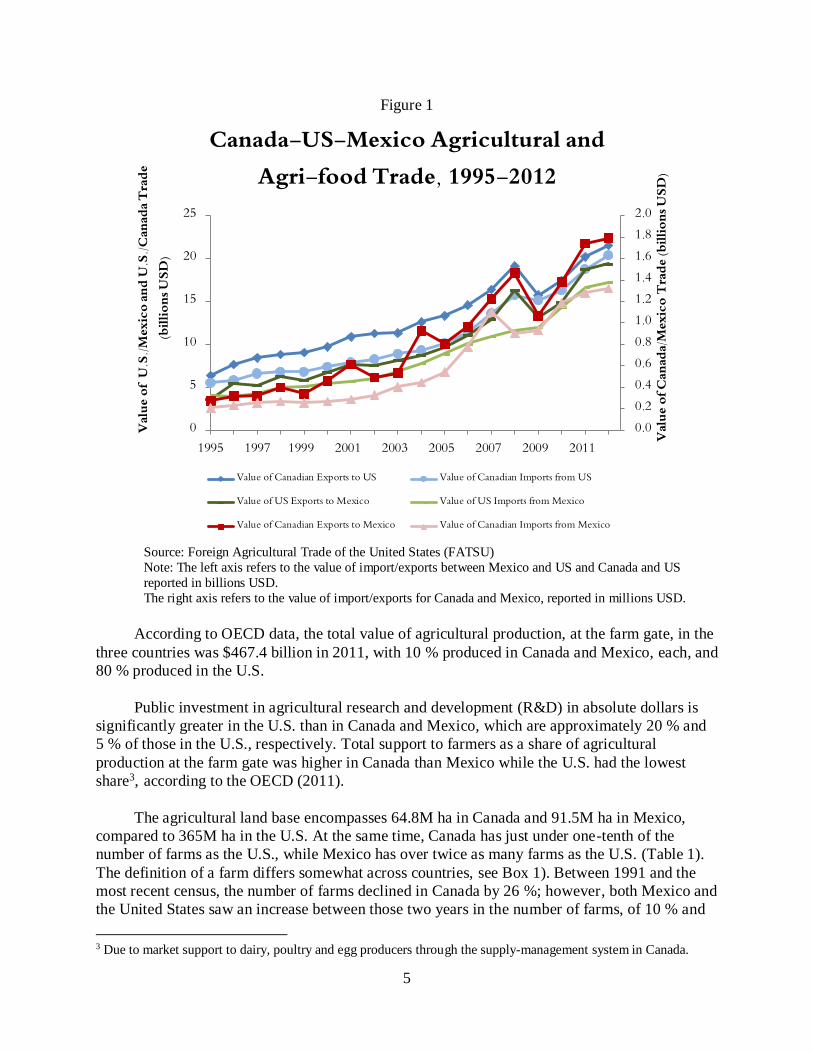
Figure 1
Source: Foreign Agricultural Trade of the United States (FATSU)
Note: The left axis refers to the value of import/exports between Mexico and US and Canada and US
reported in billions USD.
The right axis refers to the value of import/exports for Canada and Mexico, reported in millions USD.
According to OECD data, the total value of agricultural production, at the farm gate, in the
three countries was $467.4 billion in 2011, with 10 % produced in Canada and Mexico, each, and
80 % produced in the U.S.
Public investment in agricultural research and development (R&D) in absolute dollars is
significantly greater in the U.S. than in Canada and Mexico, which are approximately 20 % and
5 % of those in the U.S., respectively. Total support to farmers as a share of agricultural
production at the farm gate was higher in Canada than Mexico while the U.S. had the lowest
share3, according to the OECD (2011).
The agricultural land base encompasses 64.8M ha in Canada and 91.5M ha in Mexico,
compared to 365M ha in the U.S. At the same time, Canada has just under one-tenth of the
number of farms as the U.S., while Mexico has over twice as many farms as the U.S. (Table 1).
The definition of a farm differs somewhat across countries, see Box 1). Between 1991 and the
most recent census, the number of farms declined in Canada by 26 %; however, both Mexico and
the United States saw an increase between those two years in the number of farms, of 10 % and
3 Due to market support to dairy, poultry and egg producers through the supply-management system in Canada.
0.00.20.40.60.81.01.21.41.61.82.0
0
5
10
15
20
25
1995 1997 1999 2001 2003 2005 2007 2009 2011
Valu
e of C
anad
a/Mex
ico
Trad
e (bi
llion
s USD
)
Valu
e of
U.S
./Mex
ico a
nd U
.S./C
anad
a Tra
de(b
illio
ns U
SD)
Canada-US-Mexico Agricultural and Agri-food Trade, 1995-2012
Value of Canadian Exports to US Value of Canadian Imports from US
Value of US Exports to Mexico Value of US Imports from Mexico
Value of Canadian Exports to Mexico Value of Canadian Imports from Mexico
6
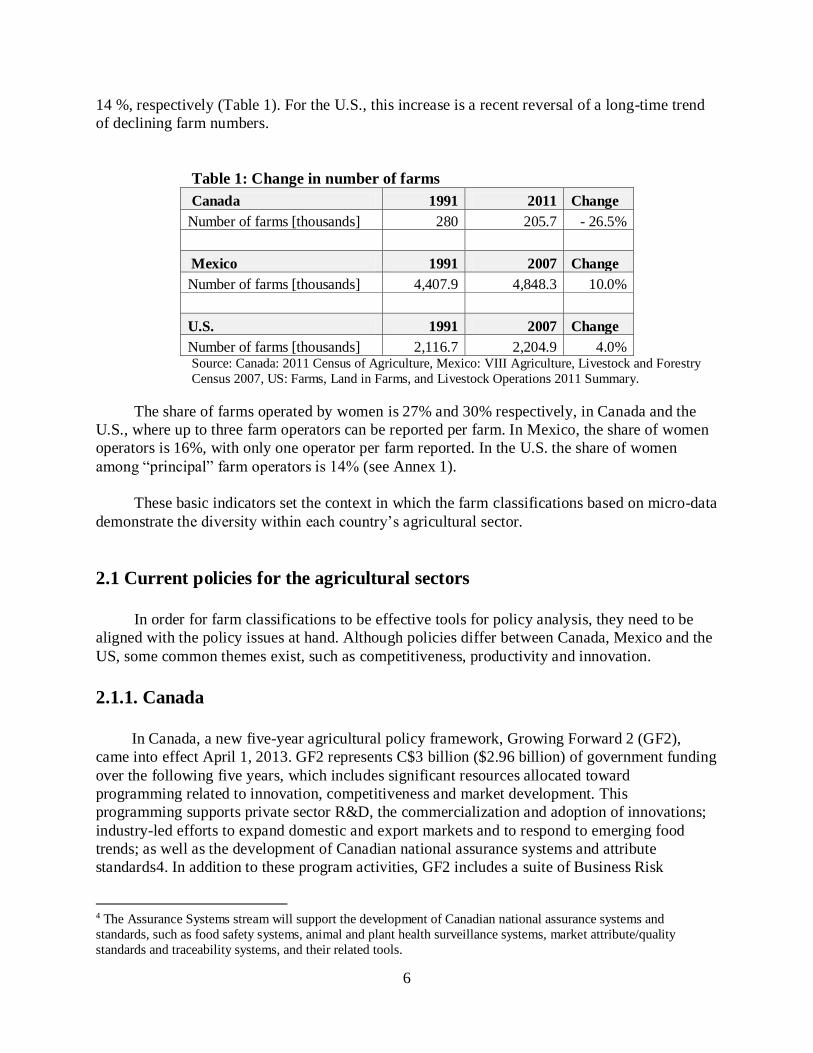
14 %, respectively (Table 1). For the U.S., this increase is a recent reversal of a long-time trend
of declining farm numbers.
Table 1: Change in number of farms
Canada 1991 2011 Change
Number of farms [thousands] 280 205.7 - 26.5%
Mexico 1991 2007 Change
Number of farms [thousands] 4,407.9 4,848.3 10.0%
U.S. 1991 2007 Change
Number of farms [thousands] 2,116.7 2,204.9 4.0% Source: Canada: 2011 Census of Agriculture, Mexico: VIII Agriculture, Livestock and Forestry
Census 2007, US: Farms, Land in Farms, and Livestock Operations 2011 Summary.
The share of farms operated by women is 27% and 30% respectively, in Canada and the
U.S., where up to three farm operators can be reported per farm. In Mexico, the share of women
operators is 16%, with only one operator per farm reported. In the U.S. the share of women
among “principal” farm operators is 14% (see Annex 1).
These basic indicators set the context in which the farm classifications based on micro-data
demonstrate the diversity within each country’s agricultural sector.
2.1 Current policies for the agricultural sectors
In order for farm classifications to be effective tools for policy analysis, they need to be
aligned with the policy issues at hand. Although policies differ between Canada, Mexico and the
US, some common themes exist, such as competitiveness, productivity and innovation.
2.1.1. Canada
In Canada, a new five-year agricultural policy framework, Growing Forward 2 (GF2),
came into effect April 1, 2013. GF2 represents C$3 billion ($2.96 billion) of government funding
over the following five years, which includes significant resources allocated toward
programming related to innovation, competitiveness and market development. This
programming supports private sector R&D, the commercialization and adoption of innovations;
industry-led efforts to expand domestic and export markets and to respond to emerging food
trends; as well as the development of Canadian national assurance systems and attribute
standards4. In addition to these program activities, GF2 includes a suite of Business Risk
4 The Assurance Systems stream will support the development of Canadian national assurance systems and
standards, such as food safety systems, animal and plant health surveillance systems, market attribute/quality
standards and traceability systems, and their related tools.
7
Management programs that help farmers in managing risk due to severe market volatility and
disaster situations.
2.1.2. Mexico
In Mexico, the objectives, strategies and priorities for development are assessed at the
beginning of each federal administration, and they are established in the National Development
Plan, as well as through regulations as per the Planning Law. The objective, as outlined in
National Development Plan for the years 2013 to 2018, is to build a productive agricultural and
fisheries sector that provides food security for the country.
Strategies have been developed to advance this objective. This includes (1) promoting
productivity in the agri-food sector by investing in the development of technological, physical
and human capital, including research and development, modernization of infrastructure,
promotion of trade, support for increased farm production and income, and development of the
capacity of primary producers in Mexico; (2) promoting partnership models that generate
economies of scale and greater value-added for agri-food sector producers, such as the
development of agri-business clusters that link smallholders with integrating enterprises, and
implementing new agri-business models that generate increased value-added throughout the
supply chain and improve farmers’ income; (3) promoting increased certainty in the agri-food
sector by promoting risk management mechanisms, establishing a comprehensive insurance
mechanism against climatic and market risks, promoting financial inclusion and efficient risk
management, and strengthening food safety to protect the health of the population and enhance
the sector´s competitiveness; (4) promoting the sustainable use of natural resources, by
promoting sustainable irrigation technology and efficient water use, tools for preserving and
enhancing genetic resources, and use of bio-technology to protect environmental and human
health; and (5) modernizing Mexico’s regulatory and institutional framework, to help promote a
productive and competitive agri-food sector.
2.1.3. U.S.
Agricultural policy in the U.S. is established under the so-called Farm Bill. The Farm Bill
is legislation redesigned approximately every five years and includes numerous Titles covering a
variety of programs relating to the agricultural and the food system, including conservation
programs, food and nutrition programs, rural development programs, and investment in the land
grant colleges and agricultural research and development. The latest farm legislation was signed
into law as the Food, Conservation, and Energy Act of 2008. The 2008 Farm Act expired
September 30, 2012. In order to establish new legislation, the U.S. Senate and U.S. House of
Representatives (House) must agree on the legislation and the President must sign it into law. In
2012, while the Senate passed its version of the legislation, the House did not, so the 2008 Act
was simply extended for one year. To date, the Senate has again passed new legislation, and the
8
House has passed a significantly different bill, leaving farm legislation in question for 2013-
2018.
Aside from lack of new legislation it is difficult to characterize U.S. policies affecting
agriculture because such a wide variety of policies are addressed in the farm legislation and the
details of the policies change approximately every five years. In general, beginning in 1985, the
farm legislation moved toward greater market orientation following concerns with liberalizing
world trade and competing in world markets, encouraging producers to make decisions based on
supply-and-demand conditions. However, the issue receiving the greatest support among
politicians in the current debate is the elimination of direct payments, which were established to
increase market orientation. Direct payments have been highly criticized because they largely go
to farmers in a financially strong position due to currently high market prices. Another area of
general agreement is to strengthen risk management programs for farms, for example, through
subsidized premiums for crop insurance. Still other policies of great importance to agriculture are
not treated in the context of farm legislation, such as policies affecting interest rates and the
recently passed Food Safety and Modernization Act (signed into law on January 4, 2011). State
and local levels of government also establish policies affecting agriculture, such as education
programs for beginning farmers and farmland tax advantages to preserve farmland within their
jurisdiction.
2.3 Sources of agricultural statistics
The development of farm classification systems depends on and is limited by available
data sources. In all three countries the censuses of agriculture build the foundation of the
agricultural statistics programs. In Canada and the U.S., agricultural censuses are conducted
every five years and in Mexico every ten years. The most recent censuses were undertaken in
2011, 2007, and 2012, in Canada, Mexico and the U.S., respectively5.
2.3.1 Canada
In Canada, the Census of Agriculture data can be linked with Census of Population data,
enabling analysis of farm operator household characteristics as well as the Farm Environmental
Management Survey (FEMS), which collects data on farm-environmental practices. Other
sources of micro-level farm data include the Farm Financial Survey (FFS), the Agricultural
Taxation Data Program (TDP), and program administrative data6. FFS is a biannual survey that
collects data on farm characteristics, balance sheet information, and farm revenues and expenses.
The survey also includes a limited number of changing questions on policy relevant topics (e.g.
on-farm food safety, business management practices), and thus allows for cross-tabulation of the
responses with farm financial performance. The TDP data set consists of detailed farm financial
5 U.S. census data will be released in February 2014. 6 Program administrative data refers to data collect from producers apply for support programs. For example, under
the current suite of programs, program administrative data is collected for participation in the Business Risk
Management programs.
9
information from income tax returns, and also provides information on the family income of the
owners of unincorporated farms.
Since 2007, Agriculture and Agri-Food Canada (AAFC) has been developing a more
comprehensive and integrated data base and a micro-simulation model to estimate current and
future behaviour of farm businesses. The model, called the Canadian Agriculture Dynamic
Micro-Simulation Model (CADMS) utilizes the data from the FFS, TDP, Census of Agriculture
and program administrative data to create a simulated longitudinal data set of income statement
and balance sheet data, as well as physical farm inventories and assets. The CADMS is used to
produce 2-year forecasts of farm-level income, wealth and financial indicators. It is also used for
scenario analysis related to proposed program development and/or market conditions and for
program performance measurement. In addition, it is used to analyze the structure and
competitiveness of the individual agricultural sub-sectors, and the impact of innovation
adoptions, such as new crop varieties.
2.3.2 Mexico
The current agricultural statistical system in Mexico collects, compiles, analyzes and
publishes a wide range of information on the agricultural sector in the country. Two information
capturing methods are fundamentally converged in this system: the agricultural censuses,
conducted by the National Institute of Statistics and Geography (INEGI) and the use of
administrative registers mainly by the Ministry of Agriculture. Information related to cultivated
lands, animal species and the means of production used by the producers of all the production
units that exist in the national territory are captured with the census. The census is conducted
generally every ten years.
During the period between censuses, INEGI, the Ministry of Agriculture (through the
Agri-food and Fisheries Information Service (SIAP) and other institutions conduct surveys that
complement the census information. For example, SIAP makes use of the administrative
registers to obtain information periodically. The information includes planted area, harvested
area, damaged area, the observed crops and estimations, the observed and estimated production,
and the rural average price. Data on livestock includes stock, production, weight and prices of
livestock (cattle, pigs, sheep, goats and poultry); as well as production and prices of the
agricultural and animal products, such as milk, eggs and others.
Currently in Mexico there is demand for agricultural information that has not yet been
satisfied. Although the agricultural census is generally performed every ten years, sixteen years
past between the last two census, which were conducted in 1991 and 2007. There is currently no
a continuous survey system in Mexico. For this reason, INEGI is working on the design and
development of an Agricultural Information System that will integrate the Agricultural Census, a
continuous Survey System and information from Administrative Registers. INEGI has the
support of the FAO for this project.
10
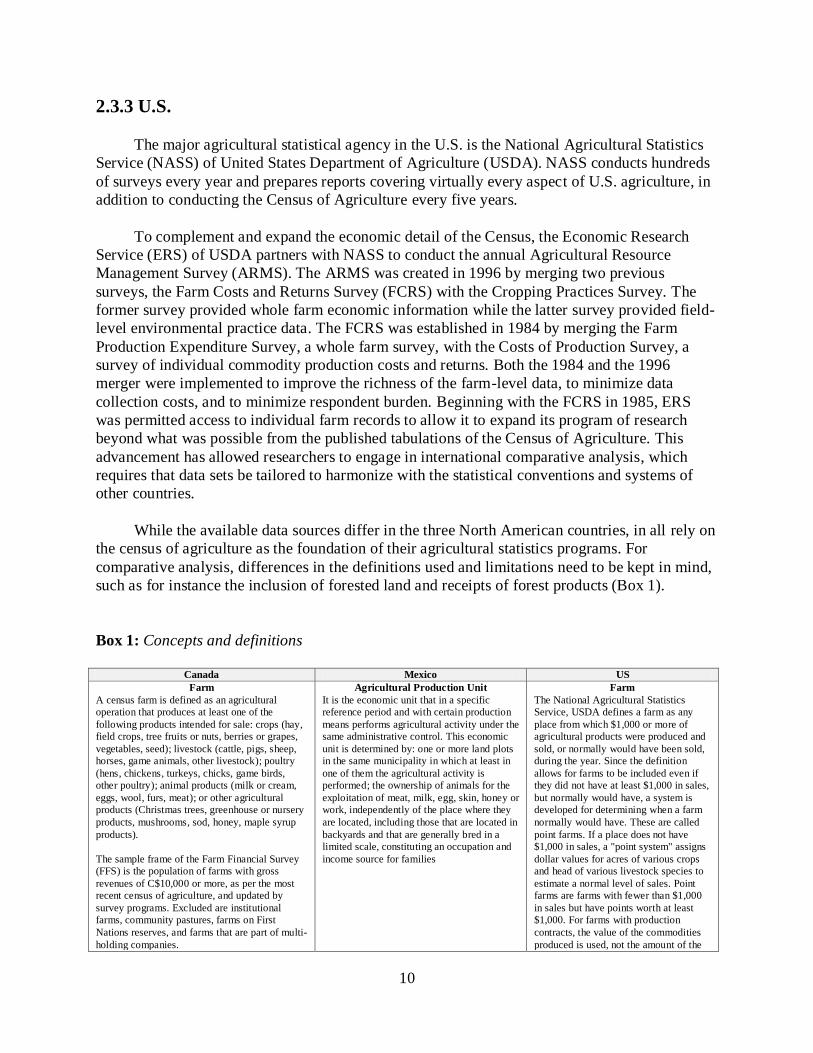
2.3.3 U.S.
The major agricultural statistical agency in the U.S. is the National Agricultural Statistics
Service (NASS) of United States Department of Agriculture (USDA). NASS conducts hundreds
of surveys every year and prepares reports covering virtually every aspect of U.S. agriculture, in
addition to conducting the Census of Agriculture every five years.
To complement and expand the economic detail of the Census, the Economic Research
Service (ERS) of USDA partners with NASS to conduct the annual Agricultural Resource
Management Survey (ARMS). The ARMS was created in 1996 by merging two previous
surveys, the Farm Costs and Returns Survey (FCRS) with the Cropping Practices Survey. The
former survey provided whole farm economic information while the latter survey provided field-
level environmental practice data. The FCRS was established in 1984 by merging the Farm
Production Expenditure Survey, a whole farm survey, with the Costs of Production Survey, a
survey of individual commodity production costs and returns. Both the 1984 and the 1996
merger were implemented to improve the richness of the farm-level data, to minimize data
collection costs, and to minimize respondent burden. Beginning with the FCRS in 1985, ERS
was permitted access to individual farm records to allow it to expand its program of research
beyond what was possible from the published tabulations of the Census of Agriculture. This
advancement has allowed researchers to engage in international comparative analysis, which
requires that data sets be tailored to harmonize with the statistical conventions and systems of
other countries.
While the available data sources differ in the three North American countries, in all rely on
the census of agriculture as the foundation of their agricultural statistics programs. For
comparative analysis, differences in the definitions used and limitations need to be kept in mind,
such as for instance the inclusion of forested land and receipts of forest products (Box 1).
Box 1: Concepts and definitions
Canada Mexico US
Farm
A census farm is defined as an agricultural
operation that produces at least one of the
following products intended for sale: crops (hay,
field crops, tree fruits or nuts, berries or grapes,
Nations reserves, and farms that are part of multi-
holding companies.
Agricultural Production Unit
It is the economic unit that in a specific
reference period and with certain production
means performs agricultural activity under the
same administrative control. This economic
unit is determined by: one or more land plots
in the same municipality in which at least in
one of them the agricultural activity is
performed; the ownership of animals for the
exploitation of meat, milk, egg, skin, honey or
work, independently of the place where they
are located, including those that are located in
backyards and that are generally bred in a
limited scale, constituting an occupation and
income source for families
Farm
The National Agricultural Statistics
Service, USDA defines a farm as any
place from which $1,000 or more of
agricultural products were produced and
sold, or normally would have been sold,
during the year. Since the definition
allows for farms to be included even if
they did not have at least $1,000 in sales,
but normally would have, a system is
developed for determining when a farm
normally would have. These are called
point farms. If a place does not have
$1,000 in sales, a "point system" assigns
dollar values for acres of various crops
and head of various livestock species to
estimate a normal level of sales. Point
farms are farms with fewer than $1,000
in sales but have points worth at least
$1,000. For farms with production
contracts, the value of the commodities
produced is used, not the amount of the
11
Canada Mexico US
The sample frame of the Agricultural Tax Data
Program (ATDP) consists of incorporated farms
with revenues from agricultural activities
(according to NAICS) of C$25,000 or more and
unincorporated and communal farms with
operating revenue of C$10,000 or more.
fees they receive. The Economic
Research Service, USDA defines a
family farm as one in which the majority
of the business is owned by the operator
and individuals related to the operator by
blood, marriage, or adoption, including
relatives that do not live in the operator
household. Since the inception of this
definition in 2005, family farms have
been at least 97% of all U.S. farms.
Farm Operator
The Census and the FFS define farm operators as
the persons responsible for the management
decisions of the agricultural operation. The
Census allows for up to three operators, without
identifying a primary operator.
For the TDP, the persons of reference are those
who declare positive gross farm income or non-
zero net farm income on their income tax return,
accompanied by the statement of farming
activities. Personal and family income data is
only available for unincorporated farms, and the
data set is limited to those with gross operating
revenues of C$10,000 or more.
Producer
It is the natural or legal entity that has the
responsibility of the production unit’s
administration. It is the one in charge of
decision making for the activities related to
the production unit, it can be the owner or the
leaseholder of the unit’s land plots. Any
person designated by the owner for decision
making in the production unit is also
considered as the producer or responsible.
Farm Operator
The farm operator is the person who runs
the farm, making the day-to-day
management decisions. The operator
could be an owner, hired manager, cash
tenant, share tenant, and/or a partner. If
land is rented or worked on shares, the
tenant or renter is the operator. In the
case of multiple operators, the
respondent for the farm identifies who
the principal farm operator is during the
data collection process. See USDA, ERS
(2013) for more information.
Land Area
Census and FFS: Land area equals Land owned
minus land rented to other plus land rented from
others. Includes crop land, fruit trees, Christmas
trees, summer fallow, pastures, woodlands and
wetlands, and all other land.
Land Area
Total area that occupies the area sum of the
land plots that constitute the production unit.
The area that the producer took as leased,
borrowed, bartered or other. But the one the
producer leased lent, bartered or other is
excluded.
Land Area
Land in farms equals Land owned minus
land rented to other plus land rented from
others. Includes crop land, fruit trees,
Christmas trees, summer fallow,
pastures, woodlands and wetlands, and
land in farmsteads and with farm
buildings. Excludes land rented on an
AUM basis.
Gross Farm Receipts / Gross Farm Revenues
Census: Gross Farm Receipts consist of receipts
from all agricultural and forest products sold,
program payments, custom work receipts. It does
not include sales of capital items (quota, land,
machinery, etc.) or receipts from the sale of any
goods purchased only for retail sales.
Taxation Data Program: Gross Farm Revenues
consist of livestock and crop revenues, program
payments and insurance proceeds, custom wok
and machine rental, rental income forest
products, sand and gravel, sale of agricultural
inputs and outputs bought for resale.
Gross Cash Farm Revenues
Includes gross farm receipts of farming
operations, including sales of agricultural
commodities, farm-related income such
as indemnities from insurance and
income from farm recreational and agri-
tourism, and government payments. For
production contracts, the fee the grower
received is included, but the value of the
commodity removed is excluded.
Market revenues
Market revenues are Gross farm receipts / gross
farm revenues less program payments
Market revenues
Market revenues include only the cash
sales of crop and livestock commodities Program payments
Available in the FFS and ATDP. Includes
provincial crop, production insurance,
AgriInsurance, AgriStability, other direct
program payments, rebates (e.g. on hail
insurance, fuel tax and property tax) subsidies,
etc.
Program payments
Includes all government support received to
enhance production and natural disaster
programs.
Program payments
Includes all government payments
received under commodity, conservation,
and disaster programs.
Off-farm income
Available in the Census as non-farm income
linkage of Census of Agriculture and Census of
Population provides accurate off-farm income.
FFS data is less reliable because it is self-
declared.
Off-farm income
It should also be noted that, information on
gross revenues and incomes are not included
in Mexico’s Census of agriculture
questionnaire, so this information is not
provided.
Off-farm income
Includes earned and unearned sources of
income for the principal operator and the
principal operator’s household. This item
is not collected for the 2-3% of farms
classified as nonfamily farms.
12
3. Comparative agricultural economic analysis
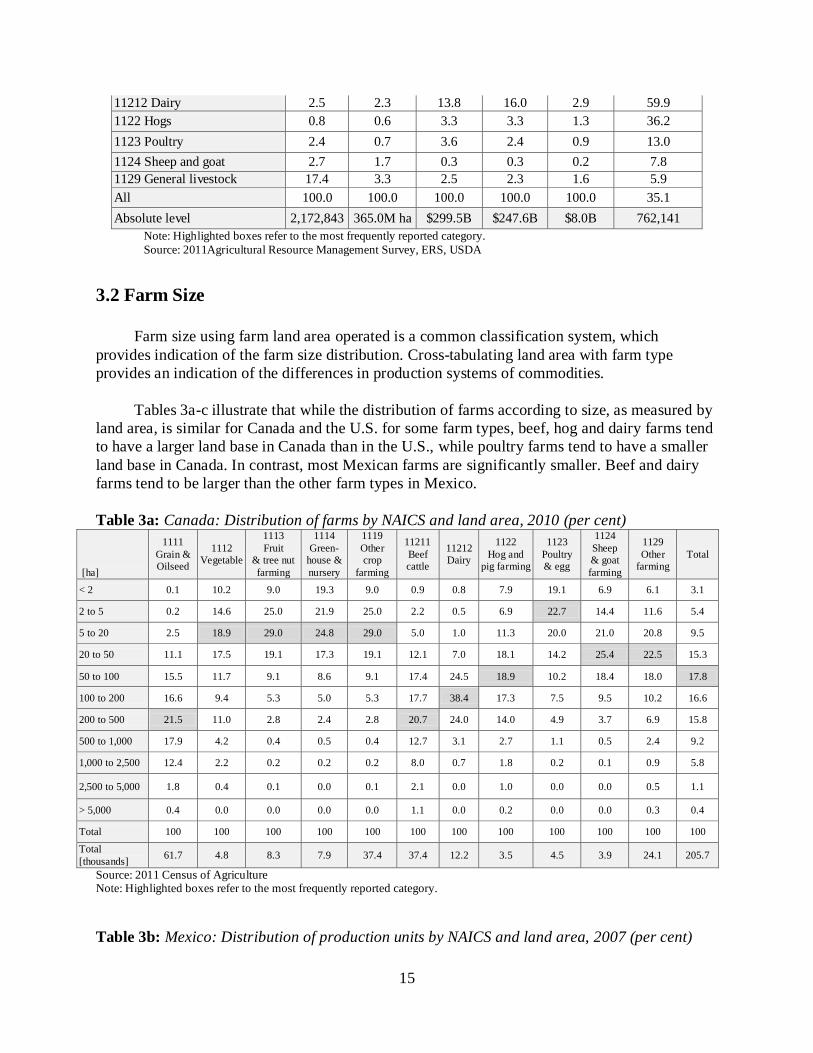
3.1 Farm Type
In recent decades, agricultural markets and value chains have become increasingly
integrated, including the Canadian, Mexican and U.S. agricultural markets, partly through the
North American Free Trade Agreement (NAFTA). The North American Industry Classification
System (NAICS) was developed by the statistical agencies of Canada, Mexico and the United
States, against the backdrop of NAFTA. The NAICS is a production oriented classification
system. It provides common definitions of the industrial structure and a common statistical
framework to facilitate the analysis of the three North American economies (Statistics Canada
2012)7,8.
The NAICS classifies businesses and other organizations that produce goods and services
according to the similarity of production processes (Statistics Canada, 2012). The hierarchical
structure of the NAICS divides the whole economy into 20 sectors (2-digit level)9. Agriculture is
part of 2-digit sector “11,” “Agriculture, Forestry, Fishing and Hunting”, and consists of two 3-
digit sub-sectors (Crop Production, 111, and Animal Production and Aquaculture, 112), which
are in turn divided into eleven 4-digit “industry groups” and 34 “industries” at the 5-digit level.
Up to the 5-digit level data are comparable among Canada, Mexico and the United States. An
additional 6-digit level enables each country to separate specific industries that are of importance
to that country10.
Farms are classified based on the production activity that generates the majority of
estimated production. Farms with diversified production are classified as “Other Crop Farming”
or “Other Livestock Farming.” The revenues received for production of commodities other than
the one that defines the farm is not separately accounted for.
In all three countries, there is no requirement that the agricultural activity is the dominant
revenue generator for an enterprise to be included in agricultural statistics, and therefore the
7 The NAICS aims to also maintain cohesion with the International Standard Industrial Classification of All
Economic Activities (ISIC), and international efforts are under way towards greater harmonization with the
European classification system, NACE (Nomenclature statistique des activités economiques dans la Communauté
européenne (Statistics Canada, 2012). 8 Canada, Mexico and the U.S. established the North American Tripartite Committee for Agricultural Statistics
(NATCAS), which consists of representatives of the three statistical agencies. Its objectives are to develop and
publish North American agriculture and agriculture-related statistics and to promote the adoption of common
classification systems and standards. http://webpage.siap.gob.mx/ 9 While the NAICS uses the terms “sector” and “industry” very specifically in the hierarchical classification of
production activities, this paper uses the terms for the most part interchangeably. 10 In agriculture, Canada and the U.S. have specific industry 111211 for potato farming, while Mexico designated that code for tomato farming. In addition, Canada has 111993 for combination fruit and vegetable farming and
111994 for maple syrup and products production, while the U.S. classification has specific industries 111991 sugar
beet farming and 111992 peanut farming. Mexico has additional codes 112131 for cattle raised for both milking and
meat production and 112139 for cattle raised for other purposes, which includes working cattle, cattle for bullfights
or bull-riding, as well as other purposes not considered in other NAICS codes.
13
enterprise can fall into other NAICS codes. Rather, the requirement is that the enterprise satisfies
minimum levels of agricultural characteristics, as described in the definition in Box 1. They are
then included in the total number of farms (Canada, U.S.) and production units (Mexico). In
Canada and the U.S., non-farm NAICS codes are not assigned to farms, because the Census in
Canada does not gather information on non-agricultural receipts, and the U.S. census includes
only questions of a limited number of other on-farm activities, such as forestry, on-farm value-
added production (e.g. jams), and tourism. In Mexico, data enables identification of non-
agricultural NAICS codes. In the 2007 census, the total number of agricultural production units
included 20.9% that were engaged in the majority in non-agricultural activities (Table 2b).
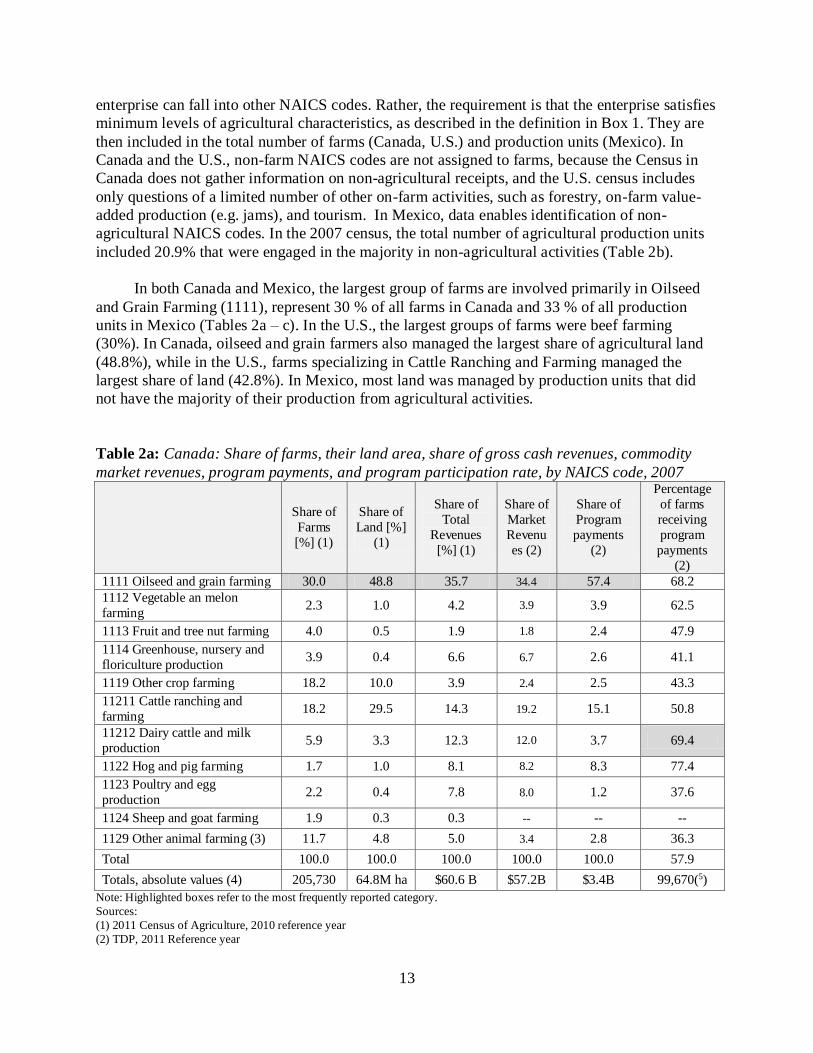
In both Canada and Mexico, the largest group of farms are involved primarily in Oilseed
and Grain Farming (1111), represent 30 % of all farms in Canada and 33 % of all production
units in Mexico (Tables 2a – c). In the U.S., the largest groups of farms were beef farming
(30%). In Canada, oilseed and grain farmers also managed the largest share of agricultural land
(48.8%), while in the U.S., farms specializing in Cattle Ranching and Farming managed the
largest share of land (42.8%). In Mexico, most land was managed by production units that did
not have the majority of their production from agricultural activities.
Table 2a: Canada: Share of farms, their land area, share of gross cash revenues, commodity
market revenues, program payments, and program participation rate, by NAICS code, 2007
Totals, absolute values (4) 205,730 64.8M ha $60.6 B $57.2B $3.4B 99,670(5)
Note: Highlighted boxes refer to the most frequently reported category.
Sources:
(1) 2011 Census of Agriculture, 2010 reference year
(2) TDP, 2011 Reference year
14
(3) Includes sheep and goat farming
(4) C$61.2B (Gross Revenues); C$57.8B (Market Revenues); $3.4B (Program Payments) (5) The number of farms that received program payments in 2011 is a subset of the TDP file for the 2011 reference year, and
therefore is not 57.9 % of the 2011 census farms.
Table 2b: Mexico: Share of production units, their land area, and program participation rate,
by NAICS Code, 2007
Share of
Farms
[%]
Share of
Land
[%]
Share of farms
receiving program
payments [%]
1111 Oilseed and grain farming 33.4 12.6 48.66
1112 Vegetable an melon farming 2.5 1.6 42.93
1113 Fruit and tree nut farming 10.2 3.5 35.81
1114 Greenhouse, nursery and floriculture production 0.5 0.1 22.31
1119 Other crop farming 5.7 4.6 31.31
11211 Cattle ranching and farming 5.7 30.6 51.33
11212 Dairy cattle and milk production 2.7 3.4 46.90
1122 Hog and pig farming 3.8 0.7 35.14
1123 Poultry and egg production 3.4 0.8 31.26
1124 Sheep and goat farming 4.3 1.3 44.69
1129 Other animal farming 6.9 2.6 53.13
11 Total 79.1 61.8
Other NAICS codes* 20.9 38.2 13.02
Total 100.0 100.0 37.77
Totals, absolute values 4,847,818 97.1 M ha 1,831,461
Note: Highlighted boxes refer to the most frequently reported category.
* “Other NAICS” consists of the following: ‘Production units with no agricultural activity’ 16.47%; ‘Exploitation of milk and
meat cattle’ (2007 NAICS code 112131), 0.01; ‘Exploitation of cattle for other purposes’ (NAICS code 112139), 3.86%;
‘Collection of forestry products’ (NAICS code 113212), 0.21%; and ‘Felling of trees’ (NAICS code 113310), 0.31%, Total 20.86%.
Source: VIII Agriculture, Livestock and Forestry Census 2007
Table 2c: U.S.: Share of farms, their land area, share of gross cash revenues, commodity market revenues,
program payments, and program participation, by NAICS code, 2011
Share of
farms
[%]
Share of
land
[%]
Share of
gross cash
revenue
[%]
Share of
commodity
market
revenues
[%]
Share of
program
payments
[%]
Share of farms
receiving
program
payments
[%]
1111 Oilseed and grain 14.6 29.4 37.0 37.0 51.9 84.3
1112 Vegetable and melon 1.5 0.8 5.2 5.3 1.1 17.7
1113 Fruits and tree nuts 2.9 1.0 6.9 6.8 1.3 11.7
1114 Greenhouse, nursery, and
floriculture 2.3 0.3 3.8 4.1 0.2 5.9
1119 Tobacco, cotton, peanut,
and general crop 22.6 13.3 8.6 7.5 23.4 48.4
11211 Beef cattle 30.1 46.7 15.1 15.1 15.0 25.6
15
11212 Dairy 2.5 2.3 13.8 16.0 2.9 59.9
1122 Hogs 0.8 0.6 3.3 3.3 1.3 36.2
1123 Poultry 2.4 0.7 3.6 2.4 0.9 13.0
1124 Sheep and goat 2.7 1.7 0.3 0.3 0.2 7.8
1129 General livestock 17.4 3.3 2.5 2.3 1.6 5.9
All 100.0 100.0 100.0 100.0 100.0 35.1
Absolute level 2,172,843 365.0M ha $299.5B $247.6B $8.0B 762,141
Note: Highlighted boxes refer to the most frequently reported category.
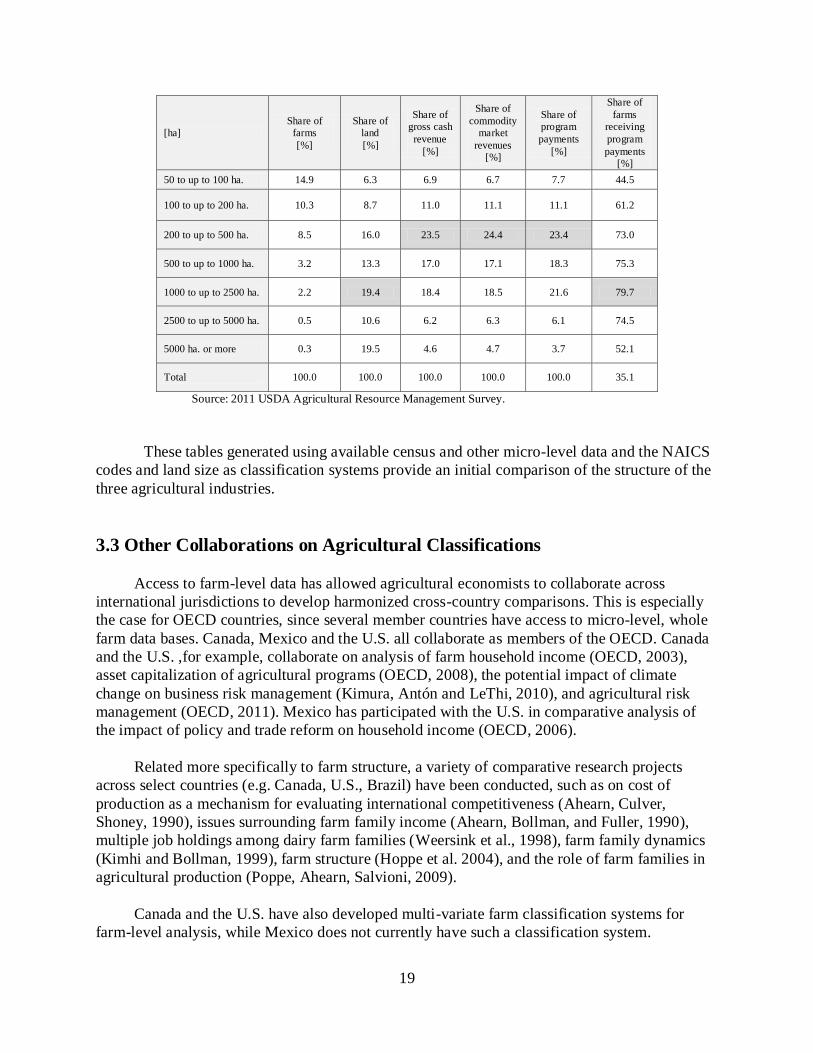
These tables generated using available census and other micro-level data and the NAICS
codes and land size as classification systems provide an initial comparison of the structure of the
three agricultural industries.
3.3 Other Collaborations on Agricultural Classifications
Access to farm-level data has allowed agricultural economists to collaborate across
international jurisdictions to develop harmonized cross-country comparisons. This is especially
the case for OECD countries, since several member countries have access to micro-level, whole
farm data bases. Canada, Mexico and the U.S. all collaborate as members of the OECD. Canada
and the U.S. ,for example, collaborate on analysis of farm household income (OECD, 2003),
asset capitalization of agricultural programs (OECD, 2008), the potential impact of climate
change on business risk management (Kimura, Antón and LeThi, 2010), and agricultural risk
management (OECD, 2011). Mexico has participated with the U.S. in comparative analysis of
the impact of policy and trade reform on household income (OECD, 2006).
Related more specifically to farm structure, a variety of comparative research projects
across select countries (e.g. Canada, U.S., Brazil) have been conducted, such as on cost of
production as a mechanism for evaluating international competitiveness (Ahearn, Culver,
Shoney, 1990), issues surrounding farm family income (Ahearn, Bollman, and Fuller, 1990),
multiple job holdings among dairy farm families (Weersink et al., 1998), farm family dynamics
(Kimhi and Bollman, 1999), farm structure (Hoppe et al. 2004), and the role of farm families in
agricultural production (Poppe, Ahearn, Salvioni, 2009).
Canada and the U.S. have also developed multi-variate farm classification systems for
farm-level analysis, while Mexico does not currently have such a classification system.
20
3.3.1 Multi-variate classification systems in Canada
AAFC developed its typology in the 1990s, to capture the characteristics of Canada’s
diverse farm sector and to better understand why particular subsets of farms behave differently
than others. The AAFC typology classifies farms into more homogeneous groups based on five
factors: organizational structure; age; dependence on off-farm income; total family income;
revenue class. By capturing the life cycle or different business intentions among farmers, it is
possible to explain some of the challenges facing particular subsets of farms and to develop
policies that better target the needs of individual farms. The AAFC farm typology is similar in
many respects to the Economic Research Service’s (ERS) farm typology for the United States
(ERS, 2001), see below.
The AAFC typology distinguishes first between family farms and non-family farms, i.e.
communal operations, cooperatives and non-family corporations. Family farms are then
distinguished between non-business and business-focused farms11. Non-business focused farms
are determined according to total family income and age, while the remaining farms are
considered based solely on their gross farm revenues. Analysis using AAFC typology shows that
groups differ in their contributions to agricultural production, product specialization, program
participation and dependence on farm income.
3.3.2 Multi-variate classification systems in the U.S.
Farm structure classification systems in the U.S. have evolved as structural issues have
evolved and data collection capabilities have been advanced. However, it is also remarkable how
similar issues have been over time. Major farm classification systems have been advanced by
NASS and ERS (and their predecessor agencies) based on the Census of Agriculture (the first
one conducted in 1840 as part of the Sixth Decennial Census of Population) and farm-level
sample surveys. Publications based on the Census data have featured a variety of farm
classifications over the years. Early classification schemes were based strictly on single-variable
farm criteria, such as farm size or the tenure status of farm operators. The 1930 Census featured
farms classified by their commodity specialization, an early precursor to the NAICS.
As early as the 1935 Census, classification systems were based on farm household
characteristics, as well as farm characteristics, and based on multiple variables. In particular, in
11 Non-Business-Focused farms categorized in the following order: First, Pension Farms, which are farms with
revenues less than $252,524 (C$249,999) in gross farm revenues managed by an operator 60 years of age or older
and receiving pension income, with no children involved in the day-to-day operation of the farm; Lifestyle Farms,
which with revenues of less than $50,505 (C$49,999) managed by families with off-farm income greater than $50,505 (C$50,000); Low Income Farms, which have with gross farm revenues of less than $252,524 (C$249,999 )
managed by families with total income below Canada’s Low-Income Measures. The remaining farms are Business-
Focused Farms, which are grouped according to gross revenues, in the ranges of less than $101,009
(C$99,999, Small Business-focussed); $252,524 (C$249,999 Medium Business-focussed);); $505,049 (C$499,999,
Large Business-focussed); and $505,050 and more (C$500,000 Very Large Business-focussed). More recently, the
category of Million-dollar farms has been added in some analysis recognizing the significant differences in the Very
Large Business-focussed group.
21
1935, the concept of part-time farming was recognized in the statistics and the volume featured a
special article on part-time farms, defined as small farms with an operator who worked off the
farm at least 100 or more days per year. The 1940 Census introduced a classification system
based on the gross value of farm products which is a highly relevant system to this day. Bachman
and Jones (1950) of the Bureau of Agricultural Economics (ERS’ predecessor agency) published
a report based on the 1945 Census where they classified farms based on the gross value of sales
and introduced the terms part-time farms and nominal farms. Beginning with the 1954 Census
and continuing until the 1974 Census, the major classification scheme was called the Economic
Class of Farms. Under this system, large farms, called commercial farms, were further classified
based on their gross value of sales and having an operator who worked less than 100 days off the
farm, and smaller farms were classified based on whether or not the operator worked 100 or
more days off the farm or having off-farm income less than farm income. The term residential
farm was also introduced with the 1954 Census and was defined as those with less than $250 in
sales. In 1959, the classification scheme was modified to introduce age into the criteria so that
commercial farms excluded those 65 years old or older, who were considered to be of retirement
age. It also classified those farms with an operator of 65 years or more as a new category,
labelled part-retirement farms. The 1969 Census began collecting data on production contracting
on operations and raised new issues on how to classify farms by size who were engaged in
production contracting and without market sales. In 1978, the multiple-factor Economic Class of
Farms classification was dropped in favor of a simpler classification based solely on gross value
of sales, including the value of commodities removed under production contracts.
Access of ERS to individual farm records data in 1985 and the expansion of farm
household data in the early years of the Farm Costs and Returns Surveys opened the door for
ERS to explore various alternatives for developing policy-relevant classification schemes. In
1991, using the newly-available farm household data Ahearn and Lee (1991) classified farms
based on the major occupation of the principal operator and the major income source of the farm
household (i.e., farm or off-farm income). Perry and Ahearn (1993) introduced the limited
resource farm household categorization, again, made possible by access to the Farm Costs and
Returns Survey. Having access to individual farm records meant that ERS recognized that some
farms did not have a single household associated with it that would freely share household
resources with the farm business since they were not closely held businesses and some farms had
more than one household associated with the farm business. To address this issue, presentation of
farm household well-being indicators from 1988-1990 classified farms as family farms (Ahearn,
Perry and El-Osta, 1993). Rather than relying on age as an indicator of retirement status (as has
been done since at least the 1959 Census), ERS added a question on the ARMS to ask whether or
not the principal operator consider himself or herself retired from farming.
Based on the 1995 Farm Costs and Returns Data, ERS introduced a classification scheme
in 1998 still used today, referred to as the ERS typology of farms, which was based on multiple
characteristics of farm businesses and farm households used in previous classification schemes.
The most defining farm characteristic in the classification scheme is farm size, measured as gross
value of farm sales. Other variables included family farm identifier, major occupation of the
principal operator, retirement status, and limited resource status. The ERS typology has been
used in a variety of publications, such as the Family Farm Report series (see Hoppe and Banker
(2010) for the latest) and occasional studies such as (Hoppe and Newton, 2001). Very recently,
22
the ERS typology classification system has been updated in various ways, including dropping the
limited resource farm category (Hoppe and MacDonald, 2013).
5. Discussion
Farm characteristics, as well as demographic, socioeconomic and regulatory conditions are
continually changing, and therefore classifications must evolve to meet the policy challenges and
the economic and structural changes over time to remain an effective tool for analysis. Individual
countries have developed classification systems over time that meet the requirements of their
domestic users, whether classification systems are based on single indicators of farm structure or
multi-variate classification systems. Historically, basic farm classifications have largely been
focused on the size and type of the farm income. For the multi-variate classification systems of
Canada and the U.S., farm size based on gross sales has been used as one of the main variables.
Development of an inclusive classification system for North America will remain a
challenge, as it must simultaneously recognize the policy, economic, and structural issues of the
whole continent, as well as the data systems of each nation. At the same time, development of a
useful classification system must look to the future and assess what the future needs are likely to
imply for a classification system. A case must be made in each country to allocate the resources
to collect the necessary data to develop a harmonized classification system. Though challenges
will continue, the integration of the economies through NAFTA has facilitated the progress
towards an integration of our statistical systems that is very likely to continue into the future.
Issues include availability and harmonization of farm financial information, given the importance
of an economic-based measure of size, i.e., based on gross sales. Furthermore, developing an
integrated classification of national agricultural industries as different as Mexico compared to
Canada and the U.S., in terms of current per capita productivity and the share of small
subsistence farms, may very well provide some lessons for the development of a harmonized
classification system for the world, with agricultural systems at every stage of development.
Bonnen (1977) identified systematic data deficiencies in agricultural economics; he
suggested that these deficiencies arise from two main causes, (1) changes in the organization and
nature of the agri-food industry, and (2) shifts in the agricultural policy agenda. Bonnen (1977)
suggested that when the issue or question changes, it is often the case that the conceptual base of
data is no longer completely appropriate and also that data critical to the new questions are not
being collected. Evidence of this is found when we assess the data that is currently being
collected against the backdrop of current policy agendas. These have broadened and increasingly
focus on issues like competiveness, productivity, innovation and environmental sustainability.
For example, in the context of innovation, further empirical analysis is warranted to better
understand farmers’ decisions to innovate (Nossal et al, 2011). This could include the effort
allocated to innovation, the adoption of innovations, and the impacts of these decisions on farm
productivity. Certain farm characteristics have been previously identified as influencing
innovation, such as age, education, farm size, and investment (Nossal and Lim, 2011; Sauer and
Zilberman, 2009). However, these findings are based on how data is currently being collected. A
23
more precise measure of innovation efforts would be preferable, along with the necessary data
collection effort.
Environmental sustainability is another important emerging policy issue across
international jurisdictions. In order for agricultural economists to address these policy needs, a
better understanding of the drivers that motivate producers to implement environmentally
sustainable practices is necessary (e.g. efficiency, regulatory, market, management of social
licensing, supply-chain). Furthermore, information on the level of adoption is required. An added
challenge in developing a classification system focused on environmental sustainability is the
regional specific nature of environmental sustainability. Regional characteristics (e.g. soil
properties, soil hydrology, air and water quality, climate) may play a larger role than farm-level
characteristics. Previous research has shown farm characteristics like farm size, education, and
soil zones were significant factors correlated with the adoption of environmentally sustainable
practices (Smith et al, 2013). However, similar to research on farm-level innovation, these
findings are based on currently available data resource, and may not capture the necessary
characteristics. Developing proper linkages between regional characteristics and farm-level
characteristics may help enhance our understanding of environmental stewardship at a farm
level.
Given the increasing complexity of farms, classification systems that incorporate farm
characteristics outside of size and type should be explored. There are several arguments for
creating a classification system based on an integrated set of indicators. This type of
classification offers a tool to synthesize and assess farm indicators as an integrated set rather than
as single indicators, thus highlighting linkages among the various indicators of interest
(Andersen et al., 2007). Most multi-variate classification systems include farm size, along with
other variables often characterizing the personal characteristics of farm households, depending
on the targeted goal of the classification system. Multi-dimensional classification systems
recognize the linkages of farm business and farm household decision making and can therefore
be an effective tool in policy design. Multi-variate farm classifications have been developed in
the U.S. and Canada; however, they do not currently reflect the emerging policy issues such as
innovative capacity or adoption of environmentally sustainable practices.
Freshwater (2012) suggests that for the most part, the data collected in the context of the
agriculture industry seems ‘trapped’ in the use of the older concept of the family farm. While
farms remain the basic production unit of agriculture, and the vast majority of farms are family
owned and operated, they are now production units integrated into more complex decisions
making environments. Also, while larger farms behave differently than smaller farms, they are
both complex in their motivations and structures. This is evident when we incorporate for
example factors like types of off-farm income into farm classifications. Multi-variate
classifications systems allow us to dissect the large group of small complex farms into smaller
more homogeneous groups, like business focused small farms, pension farms, lifestyle farm etc.
To develop better information on how these farms behave, it is necessary to think of them
differently than in the past.
To be useful in a policy context, the data collected, as well as the farm characteristics
included in farm classification, should be based on indicators identified as being relevant to
24
policy discussion. To develop an effective classification that addresses these emerging policy
issues, context is key. For example, if the purpose of a classification system is to analyze
farm-level innovation, it should be designed with this specific purpose of analyzing farms from
an innovation standpoint. To do this, data specific to the issue of innovation is required, in
addition to data that will provide insights into behavioural incentives for adoption. This is a
challenging issue given that in many instances, such as when focussing on innovation and
environmental sustainability, also data on production and regional characteristics are important.
The issue of data requirements is addressed by the World Bank, the FAO, and the United
Nations jointly-produced publication “Global Strategy to Improve Agricultural and Rural
Statistics” (FAO, 2010). The Global Strategy to Improve Agricultural and Rural Statistics
assessment found a serious decline in the quantity and quality of agricultural statistics, which is
occurring at the same time as many new data requirements are emerging. Among these emerging
data requirements are those relating to global warming, land and water use, the increasing use of
food and feed commodities to produce biofuels, poverty and food security. The evaluation also
found a need to improve the coordination between national statistical organizations and the other
national agencies that produce agricultural statistics (FAO, 2010). The focus of the Global
Strategy was to identify the minimum core data that should be collected, but left unexplored the
issue of farm classifications.
For Canadian and the U.S., broad set of data currently exist, which include detailed
farm-level data related to farm and farm operator characteristics, farm assets, liabilities,
revenues, expenses, capital investments, capital sales and environmental practices. Nevertheless,
in Canada the accuracy of certain variables, namely off-farm income and labor resources
dedicated to agriculture, could potentially be improved. While environmental management
information is collected at a farm level, this information is not collected in conjunction with
demographic information, making it challenging to establish a classification based on
environmental sustainability and farm characteristics. Currently, limited information is collected
related to farm level innovation, and data that does exist tend to focus on specific activities,
which may not be applicable to all farm types (e.g. conservation tillage practices). These
shortcomings could potentially be addressed by improving linkages across data resources (i.e.
Census of Agriculture and other surveys). In this way, the information collected could be used
more effectively, particularly in the absence of longitudinal data.
In Mexico, within the context of the national statistical system, it is difficult to collect
information on variables related to revenues, farm assets, liabilities, capital investments and
profit margins for the agricultural production units due to the characteristics of these units, as
well as producers’ socio-demographic conditions. This has been highlighted in the different
census editions that have been conducted since 1930. For this reason, the classification criteria of
the production units used in Mexico so far have been the NAICS, the size in terms of area and
the type of unit: agricultural, livestock and forestry. However, in order to support both the
development and evaluation of public policies, multi-variate classification alternatives are being
analyzed, considering labor, purchase of machinery and the volume of production, among other
variables. INEGI is initiating the development of an Agricultural Information System, which will
consist of the Agricultural Census, a Continuous Survey System and Administrative Registers.
This system will aim to meet the current and emerging major demands of information. In
25
addition, Mexico is working with FAO in the implementation of the Global Strategy. These
Mexican challenges will take time to address, but progress is being made in the right direction,
so that in the future there may be additional information for additional classifications.
To achieve a harmonized classification system across jurisdictions will require
collaborative efforts to ensure that the data requirements are met. A harmonized classification
system would facilitate cross country comparisons and add context to discussions pertaining to
the structure and performance of agriculture across regions. It could facilitate the identification
of best management practices across regions, and identify similarities which might otherwise be
overlooked at first glance.
The current approach under the FAO’s World Programme for the Census of Agriculture
(2005) places emphasis on conducting agricultural censuses within the framework of the system
of integrated agricultural censuses and surveys and in the broader context of the national
statistics system. The programme recognizes the high cost of conducting an agricultural census
and emphasises the coordination of the agricultural census with other censuses, especially the
population and housing census, which can result in considerable cost savings and added value
(FAO, 2005).
In Canada, Mexico and the U.S., efforts are currently under way to reduce the cost of data
collection, reducing response burden especially for large farms, and the search for efficiencies
without impacting the usefulness of data collected, for monitoring and policy analysis.
6. Conclusion
While farm structure and policy environments differ among Canada, the U.S. and Mexico,
all three countries aim to increase the productivity, innovative capacity and environmental
sustainability of their agricultural industries.
An effective way to analyze these emerging policy issues is to use farm-level classification
systems. The most common classification systems for farms are typically based on size, or
production type. An example of this is NAICS, which is based solely on the main type of
production of a farm. Perhaps, the next most basic classification that could be developed is a
classification of farms based on size, measured as gross sales or revenue, rather than land area as
is compared here. Moving beyond a land area measure of size is especially important for a
harmonized classification system across countries because of the great diversity in the climatic
and resource characteristics of land. Moreover, looking to the future, multi-variable classification
systems, including those that link farm and household characteristics, developed with current
policy priorities in mind, would provide more in-depth insight.
As agriculture continues its path to global integration, the value of harmonized farm
classification systems across borders may increase. However, the cost of data collection and data
discrepancies across international jurisdictions are challenges. The use of administrative data and
targeted surveys may facilitate access to the data required to develop farm classifications that are
effective tools to address current policy questions and analyze industry trends at the farm level,
26
but these sources of data also interject definitional differences that must be overcome in a
harmonized system.
REFERENCES
Ahearn, Mary, Janet Perry, and Hisham El-Osta (1993) The Economic Well-Being of Farm
Operator Households, 1988-90, USDA, ERS, AER-666
Ahearn, M., D. Culver, and R. Schoney (1990) Usefulness and Limitations of COP Estimates for
Evaluating International Competitiveness: A Comparison of Canadian and U.S. Wheat,
invited Paper at the Amer. Agric. Econ. Assoc. Meetings, Vancouver, B.C., August 4-8, 1990.
Ahearn, M., R. Bollman, and A. Fuller (1990) The Role of Pluriactivity in Maintaining Incomes
of Farm Operator Households: Comparisons of Canada, U.S., and the EC, paper presented at a
preconference on Agriculture and Rural Restructuring in Canada, U.S., and the EC,
Vancouver, B.C., August 3-4, 1990
Ahearn, M. and J. E. Lee, Jr. (1991) Multiple Job Holding Among Farm Operator Households in
the U.S.: Historical Perspective and Future Prospect, in Multiple Job Holding Among Farm
Families, Milton Hallberg, Jill Findies, and Daniel Lass, editors, Ames: Iowa State University
Press.
Andersen, E., B. Elbersen, F. Godeschalk, D. Verhoog (2007) Farm management indicators and
farm typologies as a basis for assessments in a changing policy environment, Journal of
Environmental Management v82(3) 353-362.
Bachman, K. and R. Jones (1950) Sizes of Farms in the United States” Technical Bulletin 1019
Briggeman, B. C., Gray, A. W., Morehart, M. J., Baker, T. G., & Wilson, C. A. (2007). A new
US farm household typology: Implications for agricultural policy. Applied Economic
Perspectives and Policy, 29(4), 765-782.
FAO (2005) World Programme for the Census of Agriculture 2010, Volume 1 of A system of
Integrated Agricultural Censuses and Surveys.
http://www.fao.org/docrep/009/a0135e/a0135e00.HTM#TOC, Accessed August 15, 2013
FAO (2010), Global Strategy to Improve Agricultural and Rural Statistics, Report number