Enquiries on this publication to Lindsey Clothier, Farming Statistics, Department for Environment, Food and Rural Affairs. Tel: 020802 66337, email: [email protected]. A National Statistics publication. National Statistics are produced to high professional standards. They undergo regular quality assurance reviews to ensure that they meet customer needs. They are produced free from any political interference. Published 29 March 2018 Farm Rents 2016/17 - England This release provides estimates of average rents paid under Full Agricultural Tenancies, Farm Business Tenancies and seasonal agreements (those of less than 12 months) for 2014/15 to 2016/17 together with the area of land covered by these agreements. The data are used by tenant farmers and landlords to set rents and by Defra to inform decisions on statutory succession. Throughout this release the results from the 2016/17 Farm Business Survey (FBS) will be referred to as the 2016 results. The key results for each agreement type in 2016 are given below. Full Agricultural Tenancy (FAT) agreements (Tables 2 - 5) In 2016 the average rent for Full Agricultural Tenancy (FAT) agreements was £181 per hectare, 1% higher than 2015. There was little overall change for individual farm types or regions. Farm Business Tenancy (FBT) agreements (Tables 6 - 9) In 2016 the average rent for Farm Business Tenancy (FBT) agreements was £219 per hectare, 4% higher than 2015. There was little overall change for individual farm types or regions Seasonal agreements (Table 10) The average rent for seasonal agreements was £149 per hectare in 2016 compared to £162 per hectare in 2015.
Transcript
Enquiries on this publication to Lindsey Clothier, Farming Statistics, Department for Environment, Food and Rural Affairs. Tel: 020802 66337, email: [email protected].
A National Statistics publication. National Statistics are produced to high professional standards. They undergo regular quality assurance reviews to ensure that they meet customer needs. They are produced free from any political interference.
Published 29 March 2018
Farm Rents 2016/17 - England
This release provides estimates of average rents paid under Full Agricultural Tenancies, Farm Business Tenancies and seasonal agreements (those of less than 12 months) for 2014/15 to 2016/17 together with the area of land covered by these agreements. The data are used by tenant farmers and landlords to set rents and by Defra to inform decisions on statutory succession. Throughout this release the results from the 2016/17 Farm Business Survey (FBS) will be referred to as the 2016 results. The key results for each agreement type in 2016 are given below.
Full Agricultural Tenancy (FAT) agreements (Tables 2 - 5)
In 2016 the average rent for Full Agricultural Tenancy (FAT) agreements was £181 per hectare, 1% higher than 2015.
There was little overall change for individual farm types or regions. Farm Business Tenancy (FBT) agreements (Tables 6 - 9)
In 2016 the average rent for Farm Business Tenancy (FBT) agreements was £219 per hectare, 4% higher than 2015.
There was little overall change for individual farm types or regions Seasonal agreements (Table 10)
The average rent for seasonal agreements was £149 per hectare in 2016 compared to £162 per hectare in 2015.
Table 1: Average rents FAT, FBT and seasonal agreements in England
(a) There were changes to the classification of agreements in 2015. If agreements were classified according to their 2014 type, the average seasonal agreement rent for 2015 would have been £158/ha +/-£12/ha, an increase of 7% from 2014. The average rents for other agreement types were not affected by this change.
Figure 1: Average rents by agreement type: 2005 – 2016
Between 2015 and 2016, the average rent for Full Agricultural Tenancies (FATs) increased by 1% to £181 per hectare; the average rent for Farm Business Tenancies (FBTs) increased by 4% to £210 per hectare (Figure 1 & Table 1).
Average rents tend to be higher for FBTs than for FATs, and to be higher in the East of England, East Midlands and West Midlands than in other regions (Figure 2). There is considerable
variation in rents at agreement level. This reflects factors such as the quality of the land and that agreements may be for land only or may also include any combination of dwellings, buildings and other assets (see tables 4 and 8). Figure 2: Regional average rents by agreement type: 2016
The lines at the top of the bars indicate the 95% confidence intervals.
0
50
100
150
200
250
300
350
NorthEast
NorthWest
Yorkshire& Humber
EastMidlands
WestMidlands
East ofEngland
SouthEast
SouthWest
England
Full Agricultural Tenancies Farm Business Tenancies
In 2016 the average rent for Full Agricultural Tenancy (FAT) agreements was £181 per hectare, 1% higher than 2015.
There was little overall change for individual farm types or regions.
Full Agricultural Tenancies
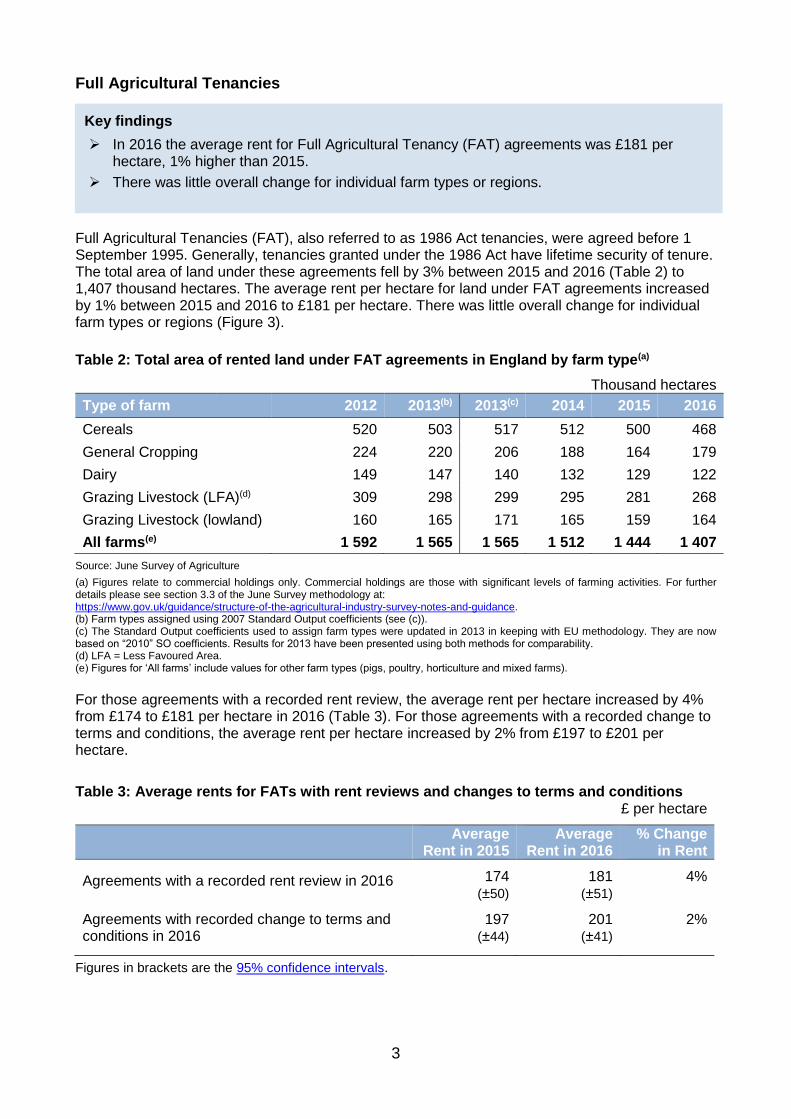
Full Agricultural Tenancies (FAT), also referred to as 1986 Act tenancies, were agreed before 1 September 1995. Generally, tenancies granted under the 1986 Act have lifetime security of tenure. The total area of land under these agreements fell by 3% between 2015 and 2016 (Table 2) to 1,407 thousand hectares. The average rent per hectare for land under FAT agreements increased by 1% between 2015 and 2016 to £181 per hectare. There was little overall change for individual farm types or regions (Figure 3).
Table 2: Total area of rented land under FAT agreements in England by farm type(a)
Source: June Survey of Agriculture
(a) Figures relate to commercial holdings only. Commercial holdings are those with significant levels of farming activities. For further details please see section 3.3 of the June Survey methodology at: https://www.gov.uk/guidance/structure-of-the-agricultural-industry-survey-notes-and-guidance. (b) Farm types assigned using 2007 Standard Output coefficients (see (c)). (c) The Standard Output coefficients used to assign farm types were updated in 2013 in keeping with EU methodology. They are now based on “2010” SO coefficients. Results for 2013 have been presented using both methods for comparability. (d) LFA = Less Favoured Area. (e) Figures for ‘All farms’ include values for other farm types (pigs, poultry, horticulture and mixed farms).
For those agreements with a recorded rent review, the average rent per hectare increased by 4% from £174 to £181 per hectare in 2016 (Table 3). For those agreements with a recorded change to terms and conditions, the average rent per hectare increased by 2% from £197 to £201 per hectare.
Table 3: Average rents for FATs with rent reviews and changes to terms and conditions
Figures in brackets are the 95% confidence intervals.
Figure 3: Average rents for FATs (England) 2015 and 2016 by farm type (top) and region (bottom)
Note: Averages for “All farm types” include other farm types (pigs, poultry, horticulture and mixed farms).
The lines at the top of the bars indicate the 95% confidence intervals. The results used to produce these charts can be found in the accompanying spreadsheet.
0
50
100
150
200
250
300
350
Cereals GeneralCropping
Dairy Grazinglivestock
(LFA)
Grazinglivestock(Lowland)
All farm types
2015 2016
£ per hectare
0
50
100
150
200
250
300
350
NorthEast
NorthWest
Yorkshire&
Humber
EastMidlands
WestMidlands
East ofEngland
SouthEast
SouthWest
England
2015 2016
£ per hectare
5
Tenancy agreements may relate to land only or may include any combination of dwellings, buildings and other assets. In 2016, the average rent for those FAT agreements relating only to land1 was £223 per hectare (Table 4 & Figure 4). Whilst this average is 10% higher than in 2015, there is considerable variability in the data and the increase is unlikely to be statistically significant. The average rent for all other FAT agreements fell by 1% to £173 per hectare. Table 4: Average rents for land only and other FAT agreements in England
(a) All other FAT agreements here include those agreements covering land and/or any combination of dwellings, buildings and other assets. Figure 4: Average rents for land only and other FAT agreements
Tenancy agreements may include Basic Payment Scheme (BPS) entitlements (or Single Payment Scheme (SPS) prior to 2015). There were too few agreements that did not include entitlements within the 2016 sample to provide a reliable estimate. The data in Table 5 are shown for completeness, but the difference in average rents between the two groups is not statistically significant. Table 5: Average rents for FAT agreements in England by Single/Basic Payment Scheme (SPS/BPS) entitlement
(a) Based on a small number of observations. In 2015 there were only 18 FAT agreements within the sample that did not include SPS entitlements.
1 In 2016, 44% of sample agreements were land only.
0
50
100
150
200
250
2007 2009 2011 2013 2015
Land only
Other than land only
All FATs
£ per hectare
£ per hectare
Average rent 2015/16%
change
Confidence Intervals
2014 2015 2016 2014 2015 2016
Land only FAT agreements 204 202 223 10% ± 29 ± 26 ± 42
All other FAT agreements(a) 170 175 173 -1% ± 9 ± 9 ± 16
All FAT agreements 176 179 181 1% ± 9 ± 9 ± 15
£ per hectare
Average rent 2015/16 %
change
Confidence Intervals
2014 2015 2016 2013 2014 2016
FAT agreements excluding SPS/BPS entitlements(a)
156 135 n/a n/a ±56 ± 41 n/a
FAT agreements including SPS/BPS entitlements
176 180 180 0% ± 9 ± 9 ± 15
All FAT agreements 176 179 181 1% ± 9 ± 9 ± 15
6
Key findings
In 2016 the average rent for Farm Business Tenancy (FBT) agreements was £219 per hectare; 4% higher than 2015.
There was little overall change for individual farm types or regions.
Farm Business Tenancies
Agricultural tenancies agreed since 1 September 1995 under the Agricultural Tenancies Act 1995, are known as Farm Business Tenancies (FBTs). In 2016 the total area of land under FBT agreements was 1,193 thousand hectares, an increase of 6% from 2015 (Table 6).
Table 6: Total area of rented land under FBT agreements in England by farm type(a)
Source: June Survey of Agriculture
(a) Figures relate to commercial holdings only. Commercial holdings are those with significant levels of farming activities. For further details please see section 3.3 of the June Survey methodology at: https://www.gov.uk/guidance/structure-of-the-agricultural-industry-survey-notes-and-guidance. (b) Farm types assigned using 2007 Standard Output (SO) coefficients (see (c)). (c) The Standard Output coefficients used to assign farm types were updated in 2013 in keeping with EU methodology. They are now based on “2010” SO coefficients. Results for 2013 have been presented using both methods for comparability. (d) LFA = Less Favoured Area. (e) Figures for ‘All farms’ include values for other farm types (pigs, poultry, horticulture and mixed farms).
The average rent per hectare for land under FBT agreements increased by 4% between 2015 and 2016 to £219 per hectare. There was little overall change for individual farm types or regions (Figure 4). Until 2014, the Farm Business Survey included similar informal agreements within the definition of FBT agreements. Informal agreements in this context were those based on the same principles as an FBT but without the accompanying legal documentation. In 2015, the classification of agreements was changed to improve the collection and reporting of data. The FBT agreements now reported here for 2015 and 2016 are defined as being written or unwritten for any period subject to the provisions of the Act. This will include formal FBTs that have rolled on informally, but in law are still regarded as FBTs. Informal agreements where there is no formal tenancy agreement but the land is part of the Utilised Agricultural Area (i.e. not seasonally let) are now being separately recorded and reported. The results presented in this section exclude these informal agreements. Whilst this change has resulted in some reclassification of agreements, it has had a minimal impact on the average FBT results. Including those FBTs now classified as “informal” does not change the average rent per ha in 2015. For those agreements with a recorded rent review (Table 7) in 2016, the average rent per hectare increased by 8% from £185 in 2015 to £199 per hectare in 2016. For those agreements with a recorded change to terms and conditions, the average rent per hectare increased by 11% from £202 to £224 per hectare. Where recorded2, the average length of term for FBT agreements was 4 years 10 months (+/- 9 months).
2 Agreement lengths are not recorded for all FBTs within the survey. See Data Analysis further details.
Table 7: Average rents for FBTs with rent reviews and changes to terms and conditions
Figures in brackets are the 95% confidence intervals.
Figure 5: Average rents for FBTs (England) 2015 and 2016 by farm type (top) and region (bottom)
Note: Averages for “All farm types” include other farm types (pigs, poultry, horticulture and mixed farms).
The lines at the top of the bars indicate the 95% confidence intervals. The results used to produce these charts can be found in the accompanying spreadsheet.
0
50
100
150
200
250
300
350
Cereals GeneralCropping
Dairy Grazinglivestock
(LFA)
Grazinglivestock(Lowland)
All farm types
2015 2016
£ per hectare
0
50
100
150
200
250
300
350
NorthEast
NorthWest
Yorkshire& Humber
EastMidlands
WestMidlands
East ofEngland
SouthEast
SouthWest
England
2015 2016
£ per hectare
£ per hectare
Average
Rent in 2015 Average
Rent in 2016 % Change
in Rent
Agreements with a recorded rent review in 2016 185 199 8%
(±29) (±35)
Agreements with recorded change to terms and conditions in 2015
202 (±29)
224 (±42)
11%
8
Tenancy agreements may relate only to land or include any combination of dwellings, buildings and other assets. The average rent for those FBT agreements relating only to land3 increased by 6% in 2016 to £219 per hectare (Table 8 and Figure 6). Whilst the average rent for all other FBT agreements increased by 2% to £219 per hectare, there is considerable variability in the data as reflected in the confidence intervals. Table 8: Average rents for land only and other FBT agreements in England
(a) All other FBT agreements here include those agreements covering land and/or any combination of dwellings, buildings and other assets.
Figure 6: Average rents for land only and other FBT agreements
Tenancy agreements may include Basic Payment Scheme (BPS) entitlements, or Single Payment Scheme (SPS) prior to 2015. The average rent for those FBT agreements including SPS/BPS entitlements4 increased by 3% in 2016 to £216 per hectare (Table 9). The average rent for those FBT agreements excluding SPS/BPS entitlements increased by 7% to £236 per hectare. However, it should be noted that there is considerable variability in this data and the confidence intervals for this result are relatively wide (±£46 per hectare in 2016).
Table 9: Average rents for FBT agreements in England by Single/Basic Payment Scheme (SPS/BPS) entitlement
3 In 2016, 84% of FBT agreements within the sample were land only. 4 In 2016, 75% of FBT agreements within the sample included BPS entitlements.
0
50
100
150
200
250
2007 2008 2009 2010 2011 2012 2013 2014 2015 2016
Land only
Other than land only
All FBTs
£ per hectare
£ per hectare
Average rent 2015/16 %
change
Confidence Intervals
2014 2015 2016 2014 2015 2016
Land only FBT agreements 196 207 219 6% ± 15 ± 17 ± 17
All other FBT agreements(a) 221 215 219 2% ± 23 ± 24 ± 37
All FBT agreements 207 210 219 4% ± 13 ± 15 ± 18
£ per hectare
Average rent 2015/16 %
change
Confidence Intervals
2014 2015 2016 2014 2015 2016
FBT agreements excluding SPS/BPS entitlements
213 221 236 7% ±30 ± 38 ± 46
FBT agreements including SPS/BPS entitlements
205 209 216 3% ± 14 ± 16 ± 20
All FBT agreements 207 210 219 4% ± 13 ± 15 ± 18
9
Key findings
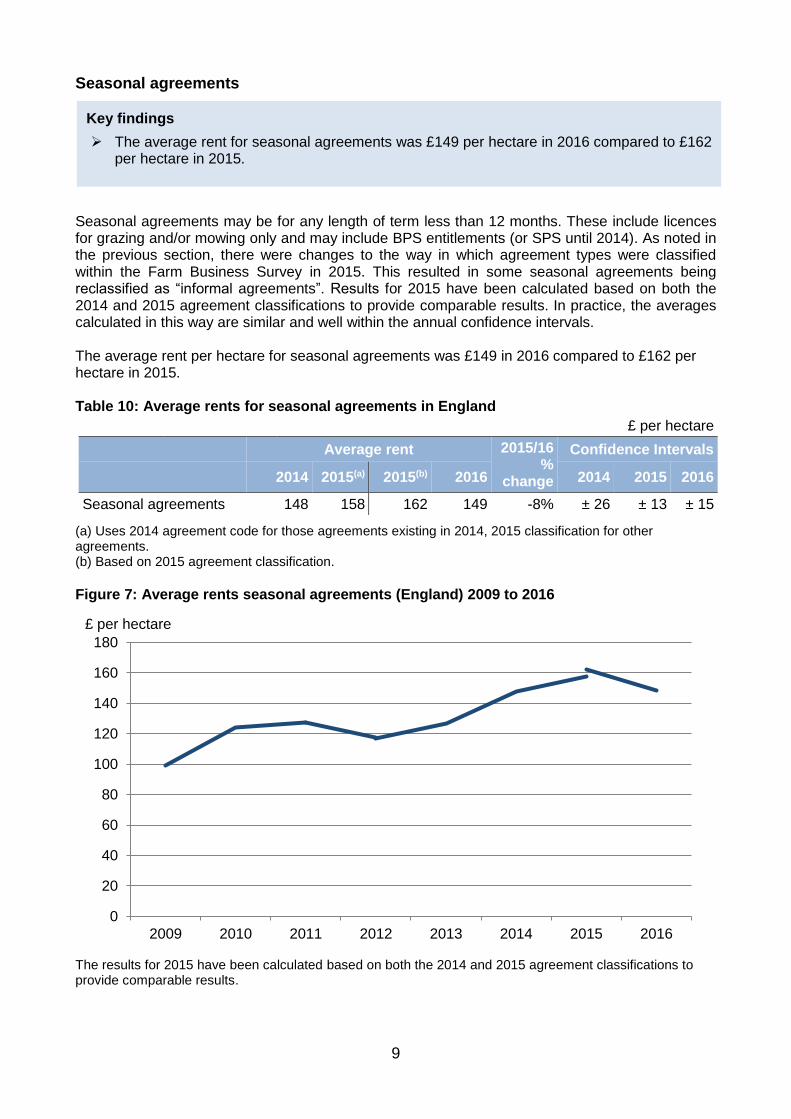
The average rent for seasonal agreements was £149 per hectare in 2016 compared to £162 per hectare in 2015.
Seasonal agreements
Seasonal agreements may be for any length of term less than 12 months. These include licences for grazing and/or mowing only and may include BPS entitlements (or SPS until 2014). As noted in the previous section, there were changes to the way in which agreement types were classified within the Farm Business Survey in 2015. This resulted in some seasonal agreements being reclassified as “informal agreements”. Results for 2015 have been calculated based on both the 2014 and 2015 agreement classifications to provide comparable results. In practice, the averages calculated in this way are similar and well within the annual confidence intervals. The average rent per hectare for seasonal agreements was £149 in 2016 compared to £162 per hectare in 2015. Table 10: Average rents for seasonal agreements in England
(a) Uses 2014 agreement code for those agreements existing in 2014, 2015 classification for other agreements. (b) Based on 2015 agreement classification.
Figure 7: Average rents seasonal agreements (England) 2009 to 2016
The results for 2015 have been calculated based on both the 2014 and 2015 agreement classifications to provide comparable results.
In 2015, there was an improvement to the way in which tenancy agreements were classified in the Farm Business Survey. A new category of “informal agreements” was introduced. These informal agreements are those where there is no formal tenancy agreement but the land is part of the Utilised Agricultural Area (i.e. not seasonally let). This resulted in the reclassification5 of a number of agreements.
In 2016, the average rent per hectare for informal agreements was £193 per hectare, 3% lower than in 2015 (Table 11). However, it should be noted that due to the nature of these agreements there is considerable variability.
Table 11: Average rents for informal agreements in England by Basic Payment Scheme (BPS) entitlement
5 For further details see the 2015 Statistical Notice at https://www.gov.uk/government/statistics/farm-rents
Survey methodology Results show the average amount of rent paid per hectare per year. They cover a wide range of rental agreements including those that are land only and those that include dwellings, farm buildings and other assets. To give an indication of the difference in rents, results have also been produced to show average values for land only agreements (see tables 4 and 8). The Farm Business Survey (FBS) is an annual survey conducted by experienced data collectors via interview and access to farmers’ documents. The FBS collects data at a business level for all rental agreements, with a sample of around 1,750 farm businesses in England. The sample covers all types of farming in all regions of the country, and includes owner-occupied, tenanted and mixed tenure farms. The FBS has a threshold which removes the smallest farm businesses (those with less than 25,000 euros of Standard Output) from the survey. More detailed information about the Farm Business Survey and the data collected can be found at: https://www.gov.uk/farm-business-survey-technical-notes-and-guidance/.
Definitions Results within this release are shown for four main types of rental agreements; Full Agricultural Tenancies, Farm Business Tenancies, Seasonal and Informal agreements. Information about agricultural tenancies can be found at https://www.gov.uk/guidance/agricultural-tenancies. Unless otherwise stated, results for each of the agreement types are defined below:
Full Agricultural Tenancies (FAT), also referred to as 1986 Act tenancies, were agreed before 1 September 1995. Generally, tenancies granted under the 1986 Act have lifetime security of tenure. FATs include Full Agricultural Tenancies with and without Single/Basic Payment Scheme (SPS/BPS) entitlements.
Agricultural tenancies agreed since 1 September 1995 under the Agricultural Tenancies Act 1995, are known as Farm Business Tenancies (FBTs). Until 2014, Farm Business Tenancies were defined within the Farm Business Survey as including similar informal agreements with and without SPS entitlements. Informal agreements in this context were those based on the same principles as an FBT but without the accompanying legal documentation. In 2015 the classification of agreements was changed to improve the collection and reporting of data. FBT agreements reported in this notice for 2015 are defined as being written or unwritten for any period subject to the provisions of the Act. This will include formal FBTs that have rolled on informally, but in law are still regarded as FBT.
Seasonal agreements include licences for grazing and/or mowing only with and without SPS/BPS entitlements.
From 2015, informal agreements are defined as those where there is no formal tenancy agreement but the land is part of the Utilised Agricultural Area (i.e. not seasonally let).
Detailed results have been included to show the difference in average rents for those agreements with and without BPS/SPS entitlements. These results are shown in tables 5 and 9.
Data analysis The data are subject to rigorous validation checks which identify inconsistencies within the data or large year-on-year changes. The survey data are weighted so that the results reflect the population of farms represented by the survey. Initial weights are applied to the FBS records based on the inverse sampling fraction for each design stratum (farm type by farm size). These weights are then adjusted (calibration weighting) so that they can produce unbiased estimators of a number of different target variables. Further information on calibration weighting can be found in the ‘Statistical Issues’ document here: https://www.gov.uk/farm-business-survey-technical-notes-and-guidance/.
Where appropriate, results are published by farm type and region. More information about farm type classification can be found in section 5.2 of the June Survey methodology via the following link: https://www.gov.uk/government/collections/structure-of-the-agricultural-industry/.
Agreement lengths The results for Farm Business Tenancies (FBTs) presented within this notice include other similar informal agreements. For each agreement the researchers recorded the agreement length, whether the agreement was for “Life” or had no fixed term. In 2015, 49% of FBT agreements within the sample had a recorded length of term. The average term length of these agreements was 5 years and 2 months (+/- 10 months). The remaining 51% of FBT agreements were recorded as having no fixed term.
Accuracy and reliability As a guide to the accuracy of the results, we have included the 95% confidence intervals for all the latest rents shown in the tables. For example, the survey results show that the average annual rent for all land under Full Agricultural Tenancies is £181 per hectare for 2016 with a 95% confidence interval of ±£15 per hectare. This means that we can be 95% confident that the range £166 - £196 per hectare contains the actual population average rent for all land under FATs. Confidence limits are based on the standard errors multiplied by 1.96 to give the 95% confidence interval. The standard errors only give an indication of the sampling error. They do not reflect any other sources of survey errors, such as non-response bias and interviewer errors. It should be noted that the confidence intervals are higher for the regional estimates compared to those for the published farm types. This is because the regional estimates include all farm types including pig, poultry and horticultural farms for which rents tend to be more variable. Percentage changes shown within this release are based on unrounded figures. Totals may not necessarily agree with the sum of their components due to rounding.
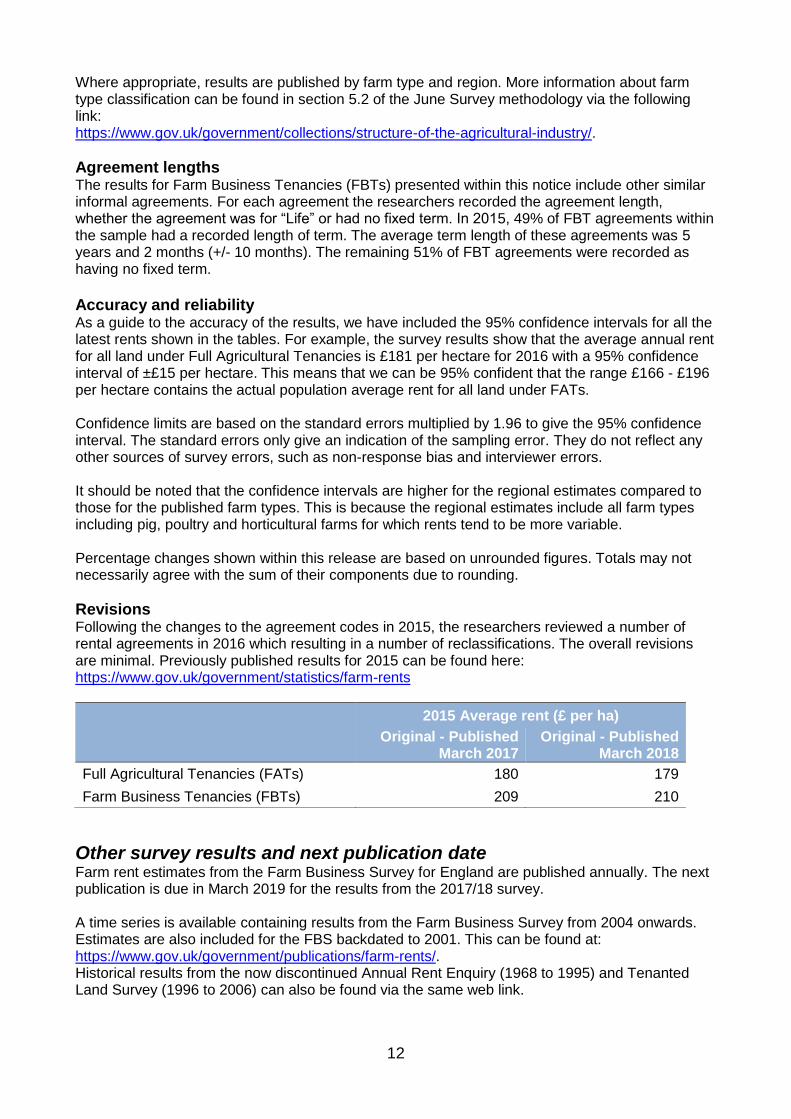
Revisions Following the changes to the agreement codes in 2015, the researchers reviewed a number of rental agreements in 2016 which resulting in a number of reclassifications. The overall revisions are minimal. Previously published results for 2015 can be found here: https://www.gov.uk/government/statistics/farm-rents
Other survey results and next publication date Farm rent estimates from the Farm Business Survey for England are published annually. The next publication is due in March 2019 for the results from the 2017/18 survey. A time series is available containing results from the Farm Business Survey from 2004 onwards. Estimates are also included for the FBS backdated to 2001. This can be found at: https://www.gov.uk/government/publications/farm-rents/. Historical results from the now discontinued Annual Rent Enquiry (1968 to 1995) and Tenanted Land Survey (1996 to 2006) can also be found via the same web link.
Results from all the Defra farming surveys can be viewed on the Defra website at: https://www.gov.uk/government/organisations/department-for-environment-food-rural-affairs/about/statistics/.
Data uses Defra uses the rent data in the calculation of net incomes in the annual Units of Production Order (UPO), which the Minister is required to make annually under the Agricultural Holdings Act 1986. This is to determine eligibility for statutory succession to an agricultural tenancy order. Tenant farmers and landlords use the data when setting rental prices on tenant farms.
User engagement
As part of our ongoing commitment to compliance with the Code of Practice for Official Statistics (http://www.statisticsauthority.gov.uk/assessment/code-of-practice/index.html), we wish to strengthen our engagement with users of these statistics and better understand the use made of them and the types of decisions that they inform. Consequently, we invite users to make themselves known, to advise us of the use they do, or might, make of these statistics, and what their wishes are in terms of engagement. Feedback on this notice and enquiries about these statistics are also welcome. Please contact Charles Mbakwe at [email protected].