35
Strictly Private and Confidential $6,500,000 - G/O Education Technology Notes & $23,500,000 - G/O Bond Sale Discussion Farmington Municipal School District No. 5 January 23, 2014
| Date post: | 08-Jun-2018 |
| Category: |
Documents |
| Upload: | nguyentuyen |
| View: | 214 times |
| Download: | 0 times |
Strictly Private and Confidential
$6,500,000 - G/O Education Technology Notes &
$23,500,000 - G/O Bond Sale Discussion
Farmington Municipal School District No. 5
January 23, 2014

1
Disclaimer
This presentation was prepared exclusively for the benefit of and internal use by the recipient for the purpose of considering thetransaction or transactions contemplated herein. This presentation is confidential and proprietary to RBC Capital Markets, LLC(“RBC CM”) and may not be disclosed, reproduced, distributed or used for any other purpose by the recipient without RBC CM’sexpress written consent.
By acceptance of these materials, and notwithstanding any other express or implied agreement, arrangement, or understandingto the contrary, RBC CM, its affiliates and the recipient agree that the recipient (and its employees, representatives, and otheragents) may disclose to any and all persons, without limitation of any kind from the commencement of discussions, the taxtreatment, structure or strategy of the transaction and any fact that may be relevant to understanding such treatment, structureor strategy, and all materials of any kind (including opinions or other tax analyses) that are provided to the recipient relating tosuch tax treatment, structure, or strategy.
The information and any analyses contained in this presentation are taken from, or based upon, information obtained from therecipient or from publicly available sources, the completeness and accuracy of which has not been independently verified, andcannot be assured by RBC CM. The information and any analyses in these materials reflect prevailing conditions and RBC CM’sviews as of this date, all of which are subject to change.
To the extent projections and financial analyses are set forth herein, they may be based on estimated financial performanceprepared by or in consultation with the recipient and are intended only to suggest reasonable ranges of results. The printedpresentation is incomplete without reference to the oral presentation or other written materials that supplement it.
Employees of RBC CM are expressly prohibited from directly or indirectly: (a) offering any company favorable researchcoverage as an inducement for the receipt of investment banking business; or (b) threatening to retaliate with adverse coverageor comments if such business is not awarded. All recommendations, ratings, price targets and opinions regarding a companyare determined independently by RBC CM’s Research Department.
IRS Circular 230 Disclosure: RBC CM and its affiliates do not provide tax advice and nothing contained herein should beconstrued as tax advice. Any discussion of U.S. tax matters contained herein (including any attachments) (i) was not intended orwritten to be used, and cannot be used, by you for the purpose of avoiding tax penalties; and (ii) was written in connection withthe promotion or marketing of the matters addressed herein. Accordingly, you should seek advice based upon your particularcircumstances from an independent tax advisor.

2
Debt Management Plan

3
Upcoming Bond Expenditures
2010-2011 2011-2012 2012-2013 2013-2014
Beginning Cash Balance as of June 30, 2010 $7,689,737 $15,929,683 $20,217,057 7,674,608$
Bond Proceeds $12,500,000 $14,000,000 $0 $23,500,000 (2)
McKinley Elementary $577,452 $6,349 $60,718 46,777$
Apache Elementary 162,103 483,031 -
Panther Trail - 596,682 403,318
Animas Elementary - Phase 1 272,979 (1) - - -
Ladera Elementary - Phase 1 181,143 1,107,010 - -
Ladera Elementary - Phase 2 865,000 (3)
Piedra Vista High School - Roof, Parking Lot, Lockers 476,986 1,645,993 4,411 318,788
Animas Elementary - Phase 2 64,238 1,809,317 1,527,773 -
Farmington High School - RR/HVAC Remodels 165,362 768,129 -
Farmington High School - Hutchinson Fieldhouse, Track, Turf 684,387 897,431 611,471 1,453,383
Special Preschool 924,536 3,590 - -
Cate Center Phase 2 159,714 (1)
Cate Center Phase 3 - - 110,801 1,477,599
Heights Middle School - - - 450,000 (3)
Hermosa Middle School - - 42,706 4,182,000 (3)
Tibbetts Middle School - Replace 327,231 3,539,849 8,153,335 100,000
McCormick Elementary - - - 2,500,000 (3)
Northeast Elementary 10,165 (1) - - 5,207,000 (3)
Farmington High School - Replacement - Design - - 9,311 2,930,000
Central Kitchen 160,059 (1)
Mesa Verde, Heights, Hermosa 14,681 (1)
Bluffview Restrooms 17,658 200,000
Mesa Verde 39,366 655,000
Country Club 200,000 (3)
Apache/Bluffview Exterior insulation 1,700,000 (3)
Reimburse Mill budget for 2009 PSCOC architectural fees 142,060 559,440 Other 102,320 54,694 40,648 207,000
$4,260,054 $9,712,626 $12,542,449 $22,895,865
Ending Cash Balance $15,929,683 20,217,057$ 7,674,608$ 8,278,743$
(1) Balance remaining.
(2) Preliminary, subject to change.
(3) Pending
Source: Farmington Municipal Schools.
FARMINGTON MUNICIPAL SCHOOL DISTRICT - UPCOMING BOND EXPENDITURES
4
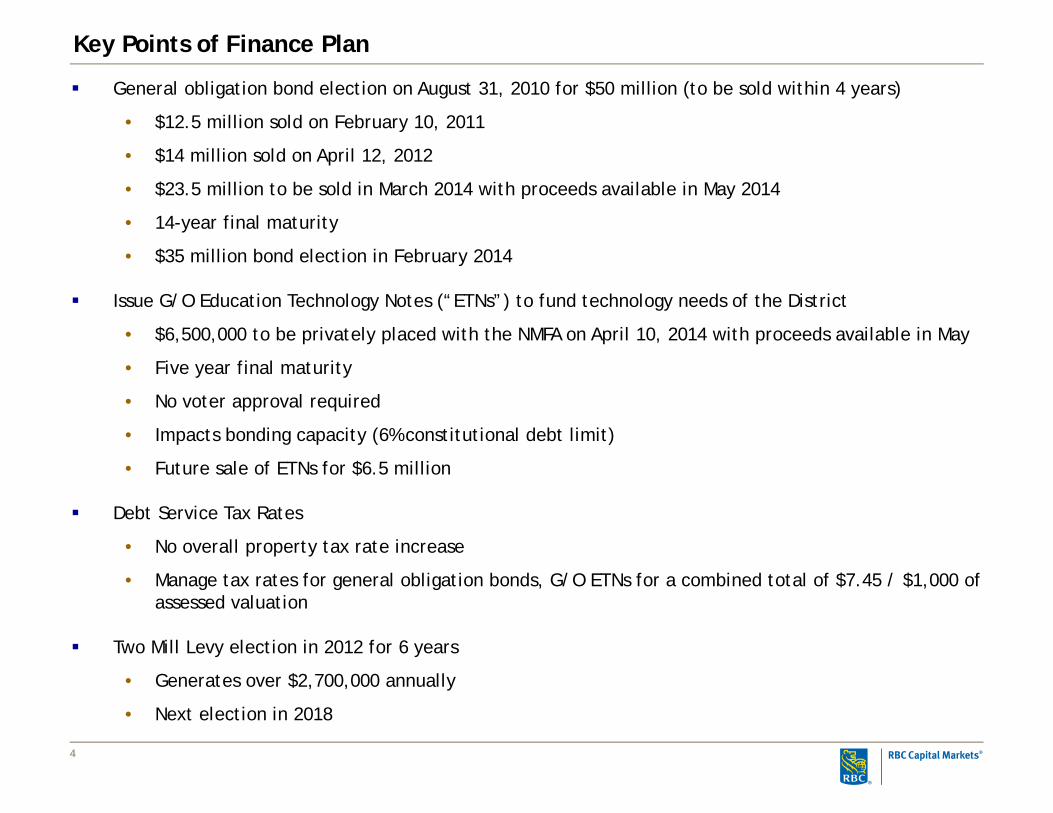
Key Points of Finance Plan
General obligation bond election on August 31, 2010 for $50 million (to be sold within 4 years)
• $12.5 million sold on February 10, 2011
• $14 million sold on April 12, 2012
• $23.5 million to be sold in March 2014 with proceeds available in May 2014
• 14-year final maturity
• $35 million bond election in February 2014
Issue G/O Education Technology Notes (“ETNs”) to fund technology needs of the District
• $6,500,000 to be privately placed with the NMFA on April 10, 2014 with proceeds available in May
• Five year final maturity
• No voter approval required
• Impacts bonding capacity (6% constitutional debt limit)
• Future sale of ETNs for $6.5 million
Debt Service Tax Rates
• No overall property tax rate increase
• Manage tax rates for general obligation bonds, G/O ETNs for a combined total of $7.45 / $1,000 of assessed valuation
Two Mill Levy election in 2012 for 6 years
• Generates over $2,700,000 annually
• Next election in 2018

5
Issue Summary – Education Technology Notes, Series 2014
Issue Size: $6,500,000
Maturity Dates: 2015 - 2018
Average Life (Years): 2.72
Pricing Date: April 10, 2014
Closing Date: May 16, 2014
Method of Sale: Private Placement
Purchaser: New Mexico Finance Authority
Estimated Tax Rate Increase: None

6
Time Schedule – Education Technology Notes, Series 2014
$6,500,000 Farmington Municipal School District No. 5
General Obligation Education Technology Notes, Series 2014 Preliminary Financing Timetable – Private Placement with New Mexico Finance Authority
(As of January 22, 2014)
Date Activity Responsibility Thurs., Jan. 23 Update District staff on G/O ETNs and G/O Bond sales SD, RBC Thurs., Jan. 23 FMS Board approves NMFA application and adopts NMFA Resolution
approving the submission of the application for financing with NMFA SD, BC, RBC
Thurs., Feb. 27 NMFA Board approves financing of G/O ETNs NMFA Thurs., Mar. 13 Regular Board meeting to adopt Resolution to determine necessity to
purchase education technology support service via a G/O Education Technology Notes (“ETNs”) and notice of a public hearing on 4/10/14.
SD, BC, RBC
Fri., Mar. 14 1st publication of Notice of Special Meeting for ETNs BC Fri., Mar. 21 2nd publication of Notice of Special Meeting for ETNs BC
Thurs., Apr. 10 Special Board meeting to adopt final ETN Resolution at 3:45 PM SD, RBC, BC Fri., Apr. 11 Publish Notice of Adoption of Resolution BC Fri., May 16 Closing SD, BC, RBC, NMFA
Working Group Key
Code Participant Role SD Farmington School District Issuer
RBC RBC Capital Markets Financial Advisor BC Modrall Law Firm Bond Counsel
NMFA New Mexico Finance Authority Purchaser
Note 1: School Board meets 2nd and 4th Thursday of every month Note 2: Publications in the Farmington Daily News

7
Comparison of Public Sale vs. Private Placement w/ NMFA – ETNs
Public Sale NMFAPar Amount of Bonds $6,500,000 $6,500,000
Costs of Issuance: Financial Advisor 23,000 23,000 Bond Counsel 23,000 23,000 Moody's Rating 6,500 - i-Deal (electronic posting & distribution) 750 - Printing of OS 500 - Paying Agent/Registrar - - NMFA Placement Fee (2) - 48,750
Total Costs of Issuance 53,750 46,000
Available for Projects $6,446,250 $6,454,000
Total Interest 483,375 106,091
Total Principal and Interest $6,983,375 $6,606,091
True Interest Cost (TIC) 1.0014% 0.8783%
All-In TIC 1.2938% 1.1447%Average Coupon 2.650% 0.600%
Closing Date 16-May-14 16-May-14
(2) While the NMFA fee is a cost of issuance, the fee is embedded in the interest rates to allow the District to receive the total par amount of bonds for projects and to pay other costs of issuance. The NMFa fee is typically $7.50 per $1,000 of par amount
GENERAL OBLIGATION NOTES
FARMINGTON MUNICIPAL SCHOOLSComparison of Public Sale vs. Private Placement with NMFA

8
Issue Summary – General Obligation Bonds, Series 2014
Issue Size: $23,500,000
Maturity Dates: 2014 - 2027
Average Life (Years): 8.479
Pricing Date: April 10, 2014
Closing Date: May 14, 2014
Method of Sale: Competitive Public Sale
Purchaser: To Be Determined
Estimated Tax Rate Increase: None

9
Time Schedule – General Obligation Bonds, Series 2014
$23,500,000 Farmington Municipal School District
General Obligation School Building Bonds, Series 2014
Financing Timetable (As of January 22, 2014)
Date Activity Responsibility
Thurs., Jan. 23 Board briefing SD, RBC
Tues., Mar. 18 Distribute draft of Preliminary Official Statement RBC
Tues., Mar. 25 Rating presentation with Moody’s Investors Service SD, RBC
Fri., Mar. 28 Publish Notice of Sale RBC
Wed., Apr. 2 Post Preliminary Official Statement on i-Deal Prospectus RBC
Thurs., Apr. 10 Bond Sale 10:00 A.M. SD, RBC
Thurs., Apr. 10 Board meets to adopt Bond Resolution SD, RBC, BC
Fri., Apr. 11 Publish Notice of Adoption of Resolution SD, RBC
Wed., May 14 Bond Closing SD, RBC, BC
Working Group Key
Code Participant Role SD Farmington School District Issuer
RBC RBC Capital Markets Financial Advisor
BC Modrall Law Firm Bond Counsel
Note 1: School Board meets 2nd and 4th Thursday of every month Note 2: Publications in Farmington Daily Times
10
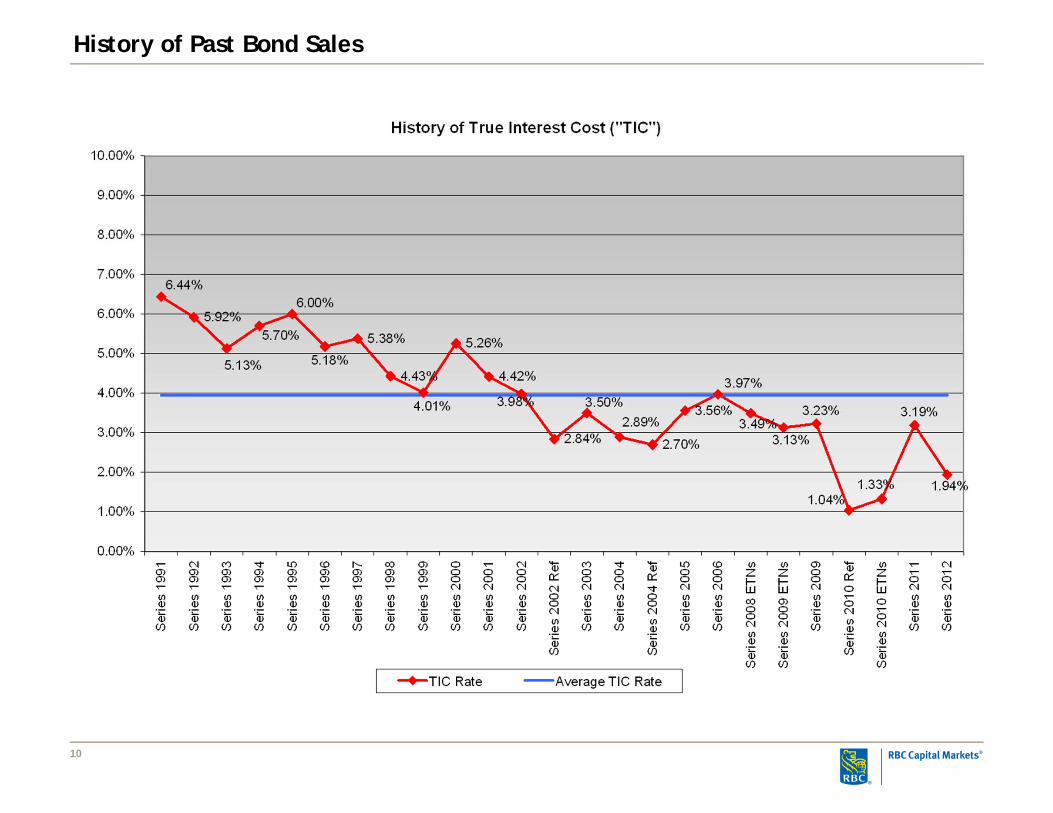
History of Past Bond Sales
11
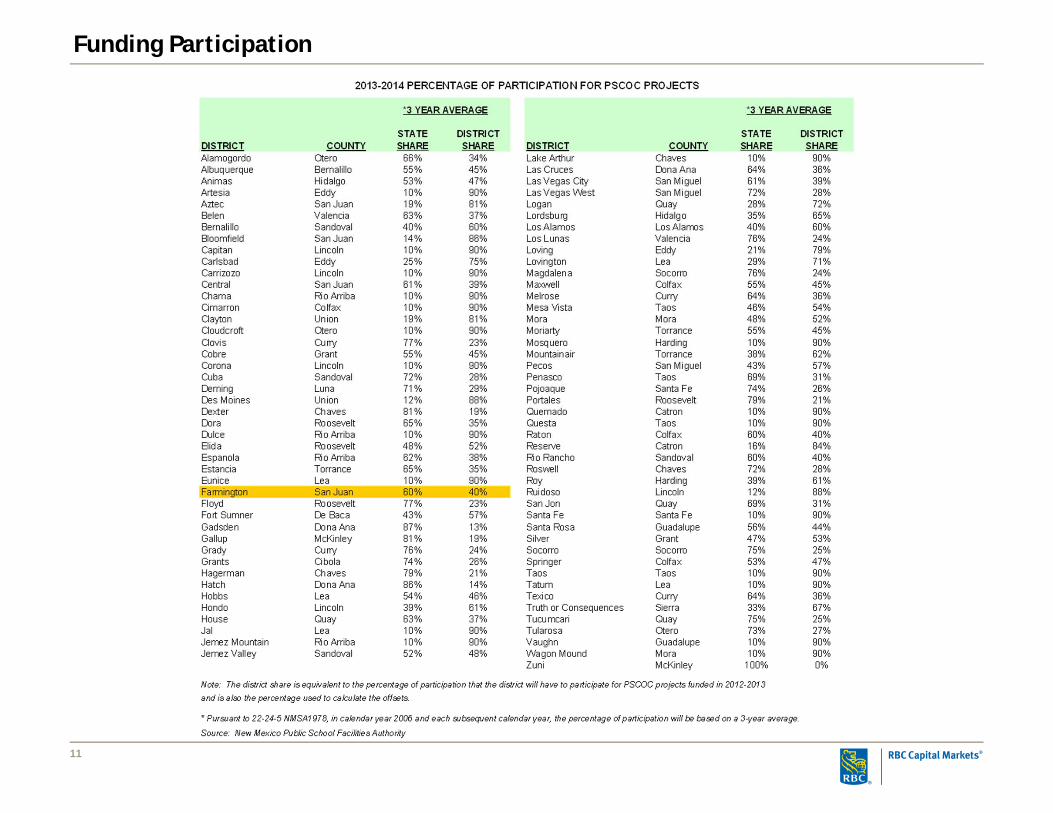
Funding Participation

12
History of Assessed Valuation
01/21/2014
Total Bond Authorization Approved by Voters on August 31, 2010 50,000,000$
Total Authorized but Unissued Bonds 23,500,000$
2013 Assessed Valuation 1,427,428,576$
Constitutional Debt Limitation (6% of Assessed Valuation) 6.00% 85,645,715
Less Current Outstanding Debt 36,995,000
Available Debt Capacity 48,650,715$
% Bonded to Capacity 43.20%
Tax % % % % Change OverYear Residential Growth Non-Residential Growth Oil & Gas Growth Total AV Previous Year
2009 $690,507,422 7.44% $524,985,990 10.95% $284,753,322 15.9% $1,500,246,734 10.19%
2010 721,629,807 4.51% 521,064,607 -0.75% 131,413,661 -53.8% 1,374,108,075 -8.41%
2011 768,909,411 6.55% 499,044,294 -4.23% 148,590,174 13.1% 1,416,543,879 3.09%
2012 797,731,417 3.75% 499,235,671 0.04% 162,995,453 9.7% 1,459,962,541 3.07%
2013 828,578,820 3.87% 497,192,952 -0.41% 101,656,804 -37.6% 1,427,428,576 -2.23%
Source: New Mexico Department of Finance & Administration.

13
New vs. Re-Appraisal
% % Preliminary % Est. Final %
2012 New (1) Change Re-Appraisal (1) Change 2013 Tax Year Change 2013 Tax Year Change
Farmington - 5 In $656,049,914 $10,723,423 1.63% $15,554,910 2.37% $682,328,247 4.01% $682,216,745 -0.02%Farmington - 5 Out 141,681,503 1,931,822 1.36% 2,637,248 1.86% 146,250,573 3.22% 146,381,209 0.09%
Total Residential $797,731,417 $12,655,245 1.59% $18,192,158 2.28% $828,578,820 3.87% $828,597,954 0.00%
Farmington - 5 In $352,104,310 $5,927,611 1.68% ($4,012,663) -1.14% $354,019,258 0.54% $354,826,436 0.23%Farmington - 5 Out 63,348,442 1,050,621 1.66% 1,072,181 1.69% 65,471,244 3.35% 69,749,033 6.53%
Total Non-Residential $415,452,752 $6,978,232 1.68% ($2,940,482) -0.71% $419,490,502 0.97% $424,575,469 2.20%
Total Assessor's Valuation $1,213,184,169 $19,633,477 1.62% $15,251,676 1.26% $1,248,069,322 2.88% $1,253,173,423 3.30%
Central Assesment $83,782,919 $77,702,368 -7.26% $77,702,368 -7.26%
Oil & Gas (As of 4/2013) $162,995,453 $101,656,804 -37.63% $101,656,804 -37.63%
TOTAL ASSESSED VALUATION $1,459,962,541 $19,633,477 1.62% 15,251,676$ 1.26% $1,427,428,494 -2.23% $1,432,532,595 -1.88%
1) Numbers taken from San Juan County PTD-03 Report dated 6/14/13
FARMINGTON MUNICIPAL SCHOOL DISTRICTSAN JUAN COUNTY
NEW vs. RE-APPRAISAL
14
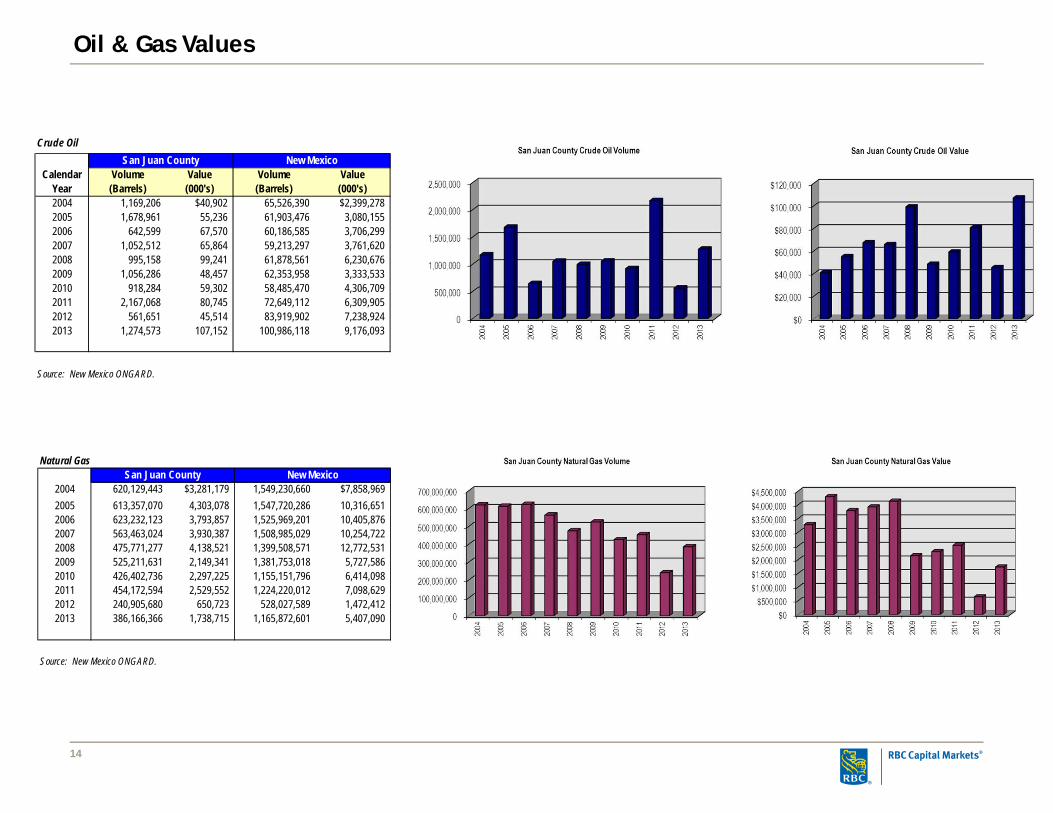
Oil & Gas Values
Crude Oil San Juan County New Mexico
Calendar Volume Value Volume ValueYear (Barrels) (000's) (Barrels) (000's)2004 1,169,206 $40,902 65,526,390 $2,399,2782005 1,678,961 55,236 61,903,476 3,080,1552006 642,599 67,570 60,186,585 3,706,2992007 1,052,512 65,864 59,213,297 3,761,6202008 995,158 99,241 61,878,561 6,230,6762009 1,056,286 48,457 62,353,958 3,333,5332010 918,284 59,302 58,485,470 4,306,7092011 2,167,068 80,745 72,649,112 6,309,9052012 561,651 45,514 83,919,902 7,238,9242013 1,274,573 107,152 100,986,118 9,176,093
Source: New Mexico ONGARD.
Natural GasSan Juan County New Mexico
2004 620,129,443 $3,281,179 1,549,230,660 $7,858,9692005 613,357,070 4,303,078 1,547,720,286 10,316,6512006 623,232,123 3,793,857 1,525,969,201 10,405,8762007 563,463,024 3,930,387 1,508,985,029 10,254,7222008 475,771,277 4,138,521 1,399,508,571 12,772,5312009 525,211,631 2,149,341 1,381,753,018 5,727,5862010 426,402,736 2,297,225 1,155,151,796 6,414,0982011 454,172,594 2,529,552 1,224,220,012 7,098,6292012 240,905,680 650,723 528,027,589 1,472,4122013 386,166,366 1,738,715 1,165,872,601 5,407,090
Source: New Mexico ONGARD.
15
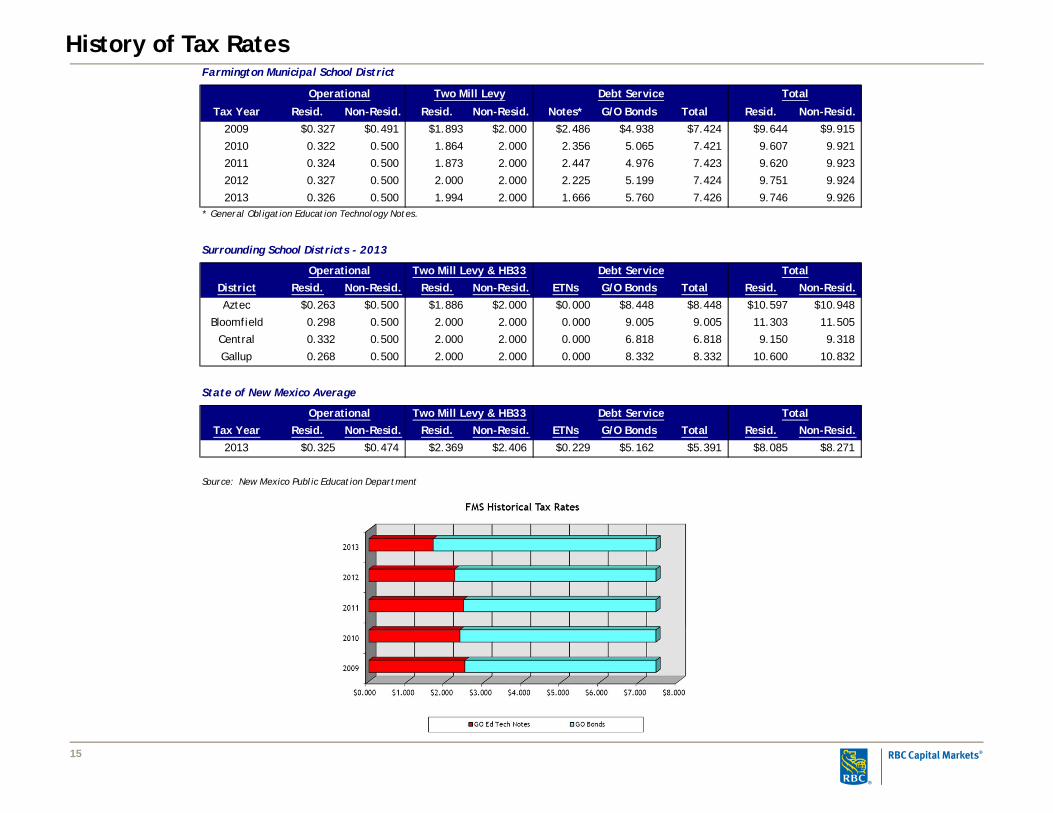
History of Tax Rates
Operational Total
Tax Year Resid. Non-Resid. Resid. Non-Resid. Notes* G/O Bonds Total Resid. Non-Resid.2009 $0.327 $0.491 $1.893 $2.000 $2.486 $4.938 $7.424 $9.644 $9.915
2010 0.322 0.500 1.864 2.000 2.356 5.065 7.421 9.607 9.921
2011 0.324 0.500 1.873 2.000 2.447 4.976 7.423 9.620 9.923
2012 0.327 0.500 2.000 2.000 2.225 5.199 7.424 9.751 9.924
2013 0.326 0.500 1.994 2.000 1.666 5.760 7.426 9.746 9.926* General Obligation Education Technology Notes.
Operational TotalDistrict Resid. Non-Resid. Resid. Non-Resid. ETNs G/O Bonds Total Resid. Non-Resid.Aztec $0.263 $0.500 $1.886 $2.000 $0.000 $8.448 $8.448 $10.597 $10.948
Bloomfield 0.298 0.500 2.000 2.000 0.000 9.005 9.005 11.303 11.505
Central 0.332 0.500 2.000 2.000 0.000 6.818 6.818 9.150 9.318
Gallup 0.268 0.500 2.000 2.000 0.000 8.332 8.332 10.600 10.832
Operational TotalTax Year Resid. Non-Resid. Resid. Non-Resid. ETNs G/O Bonds Total Resid. Non-Resid.
2013 $0.325 $0.474 $2.369 $2.406 $0.229 $5.162 $5.391 $8.085 $8.271
Source: New Mexico Public Education Department
Farmington Municipal School District
State of New Mexico Average
Two Mill Levy & HB33 Debt Service
Two Mill Levy Debt Service
Surrounding School Districts - 2013
Two Mill Levy & HB33 Debt Service

16
Election Planning Cycle
Year Board Bond 2-Mill Levy HB#33 ETNs2006 X X2007 X20082009 X2010 X2011 X2012 X2013 X2014 X2015 X20162017 X2018 X X2019 X
FARMINGTON MUNICIPAL SCHOOLSELECTION PLANNING
No E
lect
ion
Requ
ired
Curr
ently
Not
Use
d

17
NMFA Application & Resolution

NMFA Use Only: App. #: ________ - PP FA assigned: ____________ Legislative Authorization: __________
PUBLIC PROJECT REVOLVING FUND
GENERAL OBLIGATION APPLICATION
1. GENERAL INFORMATION
Application Date: January 23, 2014 A. APPLICANT / ENTITY
Applicant/Entity: Farmington Municipal School District
Address: 2001 North Dustin, Farmington, New Mexico 87499
County: San Juan Census Tract: _______
Legislative District: Senate: _________ House: ____________
Phone: (505)324-9840 Fax: (505)599-8806 E-Mail Address: [email protected]
Individual Completing Application: Loretta Brush, RBC Capital Markets, LLC
Address: 6301 Uptown Blvd. NE, Suite 110, Albuquerque, NM 87110
Phone: (505)872-5999 Fax: (505)872-5979 E-Mail Address: [email protected]
B. CONSULTING PROFESSIONALS (Financial Advisor), if available:
Firm: RBC Capital Markets, LLC
Contact: Paul J. Cassidy
Address: 6301 Uptown Blvd. NE, Suite 110, Albuquerque, NM 87110
Phone: (505)872-5999 Fax: (505)872-5979 E-Mail Address: [email protected]
Legal Counsel: Modrall Law Firm Trustee Bank:
C. PRIMARY CONTACT PERSON
Name: Farmington Municipal Schools
Contact: Janel Ryan, Superintendent or Randy Bondow, Asst. Superintendent of Finance
Address: 2001 North Dustin, Farmington, NM 87499
Phone: (505)324-9840 Fax: (505)599-8806 E-Mail Address: [email protected] or [email protected]

2. PROJECT SUMMARY A. Project Description. Complete the following information, using additional paper if necessary. Include any additional documents that may be useful in reviewing the project, i.e. architectural designs, feasibility studies, business plan, etc.
1. Description of the project. See Attached.
2. Proposed Project Start Date: 5/16/2014 Proposed Project Completion Date: 5/16/15
3. How will the ongoing maintenance, operation, and replacement of this project be funded? School budget operational fund
B. Total Project Cost & Sources of Funds Detail. NMFA Funds Other Public Private Requested Funds* Funds Total
Construction Activities: Planning and Design Construction Equipment
Infrastructure Activities: Facility Acquisition Land Acquisition Utilities (Electric, Gas, Water, etc.) Engineering and Architectural Contingencies Project Administration/Legal Fees Technology Needs 6,500,000 Total Cost: 6,500,000 6,500,000
* Specify any other public funds and amounts and terms of these funds (i.e. FmHA, CDBG, EPA, etc.)
Source Amount Terms / # of
Years Total: $0

Attach a letter verifying that each non-NMFA funding source has been approved, or is in the process of being approved for this project. Explain any exceptions. C. Will this project require right-of-way acquisition? Yes No x
If yes, specify any right-of-way needs, and whether acquisition may or may not delay beginning of project.
D. Who will hold title to the land where the project is to be located? If this is land owned by the Bureau of Land Management, State Land Office, or Tribal Land, please attach lease agreements. (If there is no clear title, attach an explanation of ownership arrangements.)
E. Does this project require a Joint Powers Agreement (JPA)? Yes No x If yes, provide a copy of the JPA, which should include a list of the current membership.
3. FINANCING A. 1. Specify the revenue to be pledged as security for the NMFA loan (a revenue source must be
pledged for this type of project).
Municipal Local Option GRT – please specify: __________________________________
County Option GRT – please specify: __________________________________
Other Tax-Based Revenue:
x Ad Valorem Property Tax
State-Shared GRT
Law Enforcement Funds
Fire Protection Funds
Net System Revenues: __________________________________
2. Is there an alternative revenue source available to pledge to pay debt service in the event that the primary pledged revenue is unavailable or insufficient? Yes No x If yes, specify:
3. Preferred financing term: * 4 years. * specify month principal is payable. September 1

B. What is the Assessed Valuation for the previous 5 years?
TaxYear Total AV
2009 $1,500,246,734
2010 1,374,108,075
2011 1,416,543,879
2012 1,459,962,541
2013 1,427,428,576
C. Major Taxpayers in 2013
Assessed % of DistrictTaxpayer Business Valuation AVAnimas Valley Land & Water Co. Real Estate $9,722,134 0.7%Animas Valley Mall LLC Retail 9,617,345 0.7%XTO Energy Inc. Oil Field Service 9,006,707 0.6%Weatherford US LP Pipeline 7,004,165 0.5%Compressor Systems Inc Oil Field Service 6,564,757 0.5%Gas Company of NM Utility 6,376,392 0.4%San Juan Regional Medical Center Healthcare 6,126,855 0.4%Enterprise Field Services LLC Oil Field Service 5,941,695 0.4%Conoco Phillips Co. Pipeline 4,522,458 0.3%Transwestern Pipeline Pipeline 4,509,895 0.3%
Total $69,392,402 4.8%
TOP TEN MAJOR TAXPAYERS
D. Is any debt being repaid from the revenue source(s) referenced in A (1)? Yes x No
If yes, provide bond or loan documents and payment schedule for any existing debt service being paid from the same revenues that would be used to repay a NMFA loan.

E. Debt Summary: Summarize all debt obligations outstanding as of the date of the application, including leases, installment purchases, short-term borrowings, and long-term debt.
Below is the District’s outstanding debt.
Current General Obligation Debt Outstanding:
2006 ELECTION =
SERIES SERIES$9,000,000 01/16/2007 $16,000,000 03/31/2009 $4,900,000 Series 2010
YEAR PRIN 9/1 COUPON INTEREST PRIN 9/1 COUPON INTEREST PRIN 9/1 COUPON INTEREST2014 450,000 3.88% 146,588 500,000 3.00% 168,875 1,110,000 3.50% 38,850 2015 850,000 3.60% 129,150 500,000 3.50% 153,8752016 900,000 3.60% 98,550 500,000 3.50% 136,3752017 900,000 3.65% 66,150 500,000 4.00% 118,8752018 900,000 3.70% 33,300 500,000 4.00% 98,8752019 500,000 4.00% 78,8752020 625,000 5.00% 58,8752021 650,000 4.25% 27,6252022 Callable: 9/1/14 @ 100 Callable: 9/1/16 @ 100 Non-callable
TOTAL 4,000,000 473,738 4,275,000 842,250 1,110,000 38,850
25,000,000$ 2010 G/O Refunding BondsRefunds Series 2001, 2003 & 2004
AUGUST 2010 ELECTION =
SERIES SERIES$12,500,000 03/16/2011 $14,000,000 03/01/2012
YEAR PRIN 9/1 COUPON INTEREST PRIN 9/1 COUPON INTEREST2014 650,000 3.00% 258,000 950,000 3.00% 239,000 2015 700,000 4.00% 238,500 950,000 3.00% 210,500 2016 1,000,000 3.50% 210,500 950,000 3.00% 182,000 2017 1,000,000 3.75% 175,500 950,000 4.00% 153,500 2018 1,000,000 4.00% 138,000 950,000 3.00% 115,500 2019 1,200,000 4.00% 98,000 950,000 3.00% 87,000 2020 1,250,000 4.00% 50,000 975,000 3.00% 58,500 2021 975,000 3.00% 29,250 2022
TOTAL 9,400,000 2,066,500 10,500,000 1,943,750
50,000,000$
Current General Obligation Lease Purchase Arrangement Debt Outstanding
YEAR Principal Interest Principal Interest2014 1,090,000 66,300 1,250,000 55,8342015 1,120,000 33,600 2,125,000 45,9942016 2,125,000 25,4412017
TOTAL $2,210,000 $99,900 $5,500,000 $127,268
2010 2012

F.
01/21/2014
Total Bond Authorization Approved by Voters on August 31, 2010 50,000,000$
Total Authorized but Unissued Bonds 23,500,000$
2013 Assessed Valuation 1,427,428,576$
Constitutional Debt Limitation (6% of Assessed Valuation) 6.00% 85,645,715
Less Current Outstanding Debt 36,995,000
Available Debt Capacity 48,650,715$
% Bonded to Capacity 43.20%
4. READINESS TO PROCEED ITEMS
A. The following items must accompany this application in order for this application to be considered
complete:
Three most recently completed fiscal year audit reports
Current unaudited financials
Current fiscal year budget
Verification of ownership of land where project will be located
Documentation that each non-NMFA project funding source has been approved, or is in the process of being approved (if applicable)
Joint Powers Agreement (if applicable)
B. In addition, complete the following information, using additional paper as necessary. These items will be required prior to disbursement of NMFA proceeds:
Provide a detailed drawdown schedule for project payments
Final technical information for the project, stamped and approved by a registered engineer
Cost breakdown of the project, certifiable by either an engineer or architect
Area map, site map, and floor map (if applicable)
Verification of ownership of land where project will be located
Documentation that each non-NMFA project funding source has been approved, or is in the process of being approved (if applicable)
Documentation showing status of right-of-way acquisition (if applicable)
Explanation of land ownership arrangements (if applicable)

List all required permits and licenses necessary to complete this project. Detail the status of each item, a plan of action, and time frame for completing incomplete permits and licenses. Also provide a copy of all permits and licenses.
Is there litigation pending which would have a bearing on this project or applicant? Yes No
If yes, provide a complete summary of all circumstances relating to such litigation.
Indicate the regular meeting dates for your authorizing bond: 2nd and 4th Thursday of each month

5. CERTIFICATION I certify that: We have the authority to request and incur the debt described in this application and upon award, will enter into a contract for the repayment of any NMFA loans and/or bonds. We will comply with all applicable state and federal regulations and requirements. To the best of our knowledge, all information contained in this application is valid and accurate and the submission of this application has been authorized by the governing body of the undersigned jurisdiction.
Signature:_____________________________________ Title:__________________________ (highest elected official) Jurisdiction: __________________________________________ Signature:_____________________________________ Title: Superintendent Date:_________________________________________

Annual Items Item Cost CategoryGuide K12 $28,700.00 AdministrationAdministrationPearson Powerschool/SchoolNet $151,000.00 AdministrationAdministrationHealthmaster Annual Renewal $16,200.00 AdministrationAdministrationFollett (Library) $20,000.00 AdministrationAdministrationCharms Music Software $3,000.00 AdministrationAdministrationAptiris Support (FirstClass Apps) $12,300.00 * AdministrationAdministrationOnline Registration System $30,400.00 AdministrationAdministration $261,600.00Sungard $147,669.00 Business/HRBusiness/HReSchool $11,847.00 Business/HRBusiness/HRTricon Subscription Renewal $4,807.90 Business/HRBusiness/HRAS400 Maintenance $8,300.00 Business/HRBusiness/HRDorian Business System (AS400) $5,400.00 Business/HRBusiness/HR $178,023.90Trillion $204,067.00 CommunicationsCommunicationsBrainstorm $48,000.00 CommunicationsCommunicationsFirstClass $45,000.00 CommunicationsCommunicationsReliance Communications $16,096.50 CommunicationsCommunicationsUS Internet $5,931.90 CommunicationsCommunicationsSTR (FaxCom Renewal) $4,040.00 CommunicationsCommunicationsCity of Farmington Joint Pole Use $1,072.00 CommunicationsCommunicationsCisco SmartNET $4,000.00 CommunicationsCommunicationsCity of Farmington Electric Fiber Lease $26,000.00 CommunicationsCommunicationsMeru Support $20,000.00 * CommunicationsCommunicationsCXTEC $20,000.00 CommunicationsCommunications $394,207.40Edgenuity $75,000.00 CurriculumTyping Agent Renewal $5,118.75 CurriculumNaviance Renewal $53,910.16 CurriculumDesign Science $1,169.74 CurriculumAgileMinds (Intensified Algebra) $24,282.00 CurriculumAchieve 3000 $125,000.00 CurriculumNetTrekker/BrainPop $24,000.00 CurriculumExploreLearning $18,000.00 CurriculumFactsOnFile $4,500.00 CurriculumDiscovery Education $24,000.00 CurriculumWorldBook $6,900.00 CurriculumTumbleBooks $4,600.00 CurriculumMobiMax $2,600.00 CurriculumWrite to Learn $50,000.00 Curriculum

Annual Items Item Cost Category
One Time Items
Read 180/System 44 CurriculumTyping Pal $6,000.00 * CurriculumEdsby $40,150.00 Curriculum $465,230.65Apple Power Adapter Replacement $21,500.00 FLILaptop Insurance $233,250.00 FLI $254,750.00Applecare Support $15,996.00 Tech SupportTech SupportJAMF $94,110.00 Tech SupportTech SupportD&B Power Associates $1,749.00 Tech SupportTech SupportLanSchool $10,000.00 Tech SupportTech SupportNetwork Tool Subscriptions $1,400.00 Tech SupportTech SupportTrebron $3,000.00 Tech SupportTech Support $126,255.00Projector Replacement $12,000.00
Yearly Total $1,692,066.95
Sungard Upgrade $14,000.00Apple MacBook Pro (Staff) $30,000.00 1,000/eaOnline Registration System $45,000.00Server Upgrades $20,000.00Apple MacBook Air (Student) 2850 $2,350,000.00 825/eaAgileMinds (Remaining Payment) $150,000.00
Anticipated Costs (one time) Total $2,609,000.00Overage from last Budget $498,406.08
1st Year Total (Yearly and One Time) $4,799,473.03
Budget Total (2 Yearly, and One Time) $6,491,539.98

RESOLUTION NO. __________
AUTHORIZING AND APPROVING SUBMISSION OF A COMPLETED APPLICATION FOR FINANCIAL ASSISTANCE AND PROJECT APPROVAL TO THE
NEW MEXICO FINANCE AUTHORITY. WHEREAS, the Farmington Municipal School District, New Mexico ("Governmental Unit") is a qualified entity under the New Mexico Finance Authority Act, Sections 6-21-1 through 6-21-31, NMSA 1978 ("Act"), and the Farmington Municipal School District Board of Education ("Governing Body") is authorized to borrow funds and/or issue bonds for financing of public projects for benefit of the Governmental Unit; and WHEREAS, the New Mexico Finance Authority ("Authority") has instituted a program for financing of projects from the public project revolving fund created under the Act and has developed an application procedure whereby the Governing Body may submit an application ("Application") for financial assistance from the Authority for public projects; and WHEREAS, the Governing Body intends to undertake acquisition and purchase of education technology equipment and support costs related to such purchase of educational technology equipment ("Project") for the benefit of the Governmental unit and its citizens; and WHEREAS, the application prescribed by the Authority has been completed and submitted to the Governing Body and this resolution approving submission of the completed Application to the Authority for its consideration and review is required as part of the Application.
NOW THEREFORE, BE IT RESOLVED BY THE GOVERNING BODY OF THE FARMINGTON MUNICIPAL SCHOOL DISTRICT: Section 1. That all action (not inconsistent with the provision hereof) heretofore taken by the Governing body and the officers and employees thereof directed toward the Application and the Project, be and the same is hereby ratified, approved and confirmed. Section 2. That the completed Application submitted to the Governing Body, be and the same is hereby approved and confirmed. Section 3. That the officers and employees of the Governing Body are hereby directed and requested to submit the completed Application to the Authority for its review, and are further authorized to take such other action as may be requested by the Authority in its consideration and review of the Application and to further proceed with arrangements for financing the Project.

Section 4. All acts and resolutions in conflict with this resolution are hereby rescinded, annulled and repealed. Section 5. This resolution shall take effect immediately upon its adoption. PASSES APPROVED AND ADOPTED this 23rd day of January, 2014. GOVERNING BODY By ______________________________ Authorized Officer (Seal) ATTEST: ______________________________ Authorized Officer
18
Finance Plan
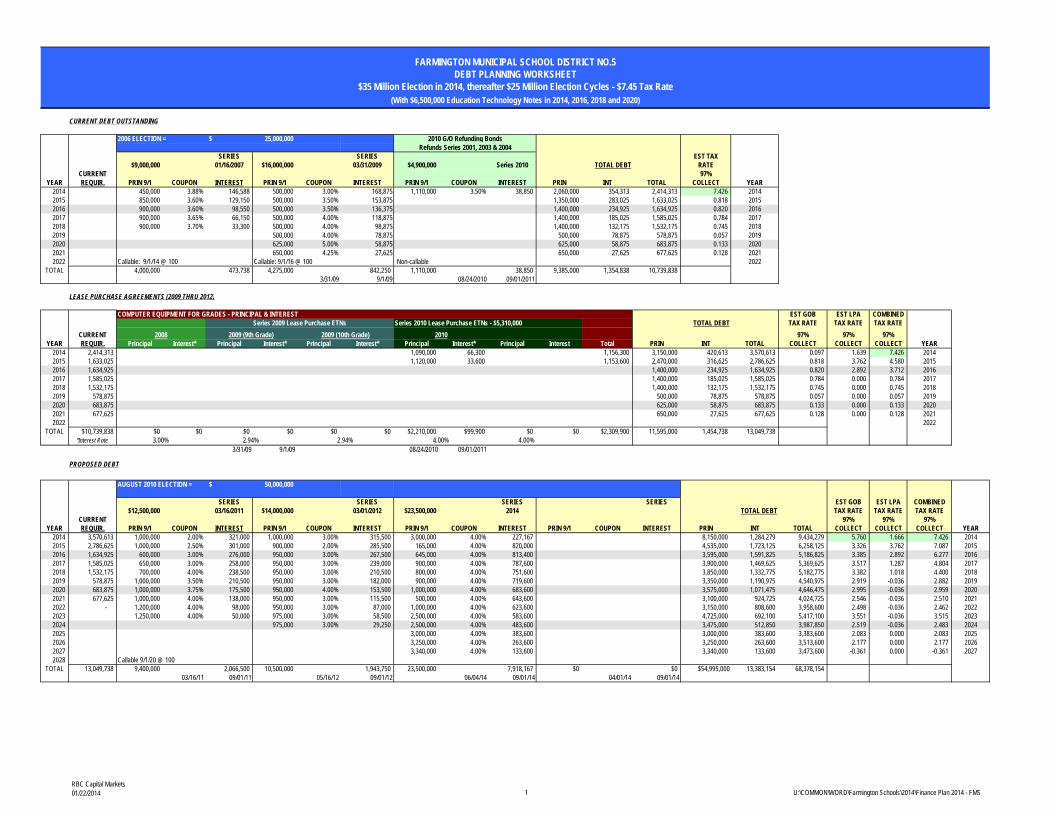
CURRENT DEBT OUTSTANDING
2006 ELECTION = SERIES SERIES EST TAX $9,000,000 01/16/2007 $16,000,000 03/31/2009 $4,900,000 Series 2010 TOTAL DEBT RATE
CURRENT 97%YEAR REQUIR. PRIN 9/1 COUPON INTEREST PRIN 9/1 COUPON INTEREST PRIN 9/1 COUPON INTEREST PRIN INT TOTAL COLLECT YEAR
2014 450,000 3.88% 146,588 500,000 3.00% 168,875 1,110,000 3.50% 38,850 2,060,000 354,313 2,414,313 7.426 20142015 850,000 3.60% 129,150 500,000 3.50% 153,875 1,350,000 283,025 1,633,025 0.818 20152016 900,000 3.60% 98,550 500,000 3.50% 136,375 1,400,000 234,925 1,634,925 0.820 20162017 900,000 3.65% 66,150 500,000 4.00% 118,875 1,400,000 185,025 1,585,025 0.784 20172018 900,000 3.70% 33,300 500,000 4.00% 98,875 1,400,000 132,175 1,532,175 0.745 20182019 500,000 4.00% 78,875 500,000 78,875 578,875 0.057 20192020 625,000 5.00% 58,875 625,000 58,875 683,875 0.133 20202021 650,000 4.25% 27,625 650,000 27,625 677,625 0.128 20212022 Callable: 9/1/14 @ 100 Callable: 9/1/16 @ 100 Non-callable 2022
TOTAL 4,000,000 473,738 4,275,000 842,250 1,110,000 38,850 9,385,000 1,354,838 10,739,838 3/31/09 9/1/09 08/24/2010 09/01/2011
LEASE PURCHASE AGREEMENTS (2009 THRU 2012)
COMPUTER EQUIPMENT FOR GRADES - PRINCIPAL & INTEREST EST GOB EST LPA COMBINED Series 2010 Lease Purchase ETNs - $5,310,000 TOTAL DEBT TAX RATE TAX RATE TAX RATE
CURRENT 97% 97% 97%YEAR REQUIR. Principal Interest* Principal Interest* Principal Interest* Principal Interest* Principal Interest Total PRIN INT TOTAL COLLECT COLLECT COLLECT YEAR
2014 2,414,313 1,090,000 66,300 1,156,300 3,150,000 420,613 3,570,613 0.097 1.639 7.426 20142015 1,633,025 1,120,000 33,600 1,153,600 2,470,000 316,625 2,786,625 0.818 3.762 4.580 20152016 1,634,925 1,400,000 234,925 1,634,925 0.820 2.892 3.712 20162017 1,585,025 1,400,000 185,025 1,585,025 0.784 0.000 0.784 20172018 1,532,175 1,400,000 132,175 1,532,175 0.745 0.000 0.745 20182019 578,875 500,000 78,875 578,875 0.057 0.000 0.057 20192020 683,875 625,000 58,875 683,875 0.133 0.000 0.133 20202021 677,625 650,000 27,625 677,625 0.128 0.000 0.128 20212022 2022
TOTAL $10,739,838 $0 $0 $0 $0 $0 $0 $2,210,000 $99,900 $0 $0 $2,309,900 11,595,000 1,454,738 13,049,738 *Interest Rate 4.00%
3/31/09 9/1/09 08/24/2010 09/01/2011
PROPOSED DEBT
AUGUST 2010 ELECTION = SERIES SERIES SERIES SERIES EST GOB EST LPA COMBINED $12,500,000 03/16/2011 $14,000,000 03/01/2012 $23,500,000 2014 TOTAL DEBT TAX RATE TAX RATE TAX RATE
CURRENT 97% 97% 97%YEAR REQUIR. PRIN 9/1 COUPON INTEREST PRIN 9/1 COUPON INTEREST PRIN 9/1 COUPON INTEREST PRIN 9/1 COUPON INTEREST PRIN INT TOTAL COLLECT COLLECT COLLECT YEAR
2014 3,570,613 1,000,000 2.00% 321,000 1,000,000 3.00% 315,500 3,000,000 4.00% 227,167 8,150,000 1,284,279 9,434,279 5.760 1.666 7.426 20142015 2,786,625 1,000,000 2.50% 301,000 900,000 2.00% 285,500 165,000 4.00% 820,000 4,535,000 1,723,125 6,258,125 3.326 3.762 7.087 20152016 1,634,925 600,000 3.00% 276,000 950,000 3.00% 267,500 645,000 4.00% 813,400 3,595,000 1,591,825 5,186,825 3.385 2.892 6.277 20162017 1,585,025 650,000 3.00% 258,000 950,000 3.00% 239,000 900,000 4.00% 787,600 3,900,000 1,469,625 5,369,625 3.517 1.287 4.804 20172018 1,532,175 700,000 4.00% 238,500 950,000 3.00% 210,500 800,000 4.00% 751,600 3,850,000 1,332,775 5,182,775 3.382 1.018 4.400 20182019 578,875 1,000,000 3.50% 210,500 950,000 3.00% 182,000 900,000 4.00% 719,600 3,350,000 1,190,975 4,540,975 2.919 -0.036 2.882 20192020 683,875 1,000,000 3.75% 175,500 950,000 4.00% 153,500 1,000,000 4.00% 683,600 3,575,000 1,071,475 4,646,475 2.995 -0.036 2.959 20202021 677,625 1,000,000 4.00% 138,000 950,000 3.00% 115,500 500,000 4.00% 643,600 3,100,000 924,725 4,024,725 2.546 -0.036 2.510 20212022 - 1,200,000 4.00% 98,000 950,000 3.00% 87,000 1,000,000 4.00% 623,600 3,150,000 808,600 3,958,600 2.498 -0.036 2.462 20222023 1,250,000 4.00% 50,000 975,000 3.00% 58,500 2,500,000 4.00% 583,600 4,725,000 692,100 5,417,100 3.551 -0.036 3.515 20232024 975,000 3.00% 29,250 2,500,000 4.00% 483,600 3,475,000 512,850 3,987,850 2.519 -0.036 2.483 20242025 3,000,000 4.00% 383,600 3,000,000 383,600 3,383,600 2.083 0.000 2.083 20252026 3,250,000 4.00% 263,600 3,250,000 263,600 3,513,600 2.177 0.000 2.177 20262027 3,340,000 4.00% 133,600 3,340,000 133,600 3,473,600 -0.361 0.000 -0.361 20272028 Callable 9/1/20 @ 100
TOTAL 13,049,738 9,400,000 2,066,500 10,500,000 1,943,750 23,500,000 7,918,167 $0 $0 $54,995,000 13,383,154 68,378,154 03/16/11 09/01/11 05/16/12 09/01/12 06/04/14 09/01/14 04/01/14 09/01/14
FARMINGTON MUNICIPAL SCHOOL DISTRICT NO.5
DEBT PLANNING WORKSHEET$35 Million Election in 2014, thereafter $25 Million Election Cycles - $7.45 Tax Rate
(With $6,500,000 Education Technology Notes in 2014, 2016, 2018 and 2020)
2008 2009 (9th Grade) 2009 (10th Grade) 2010
25,000,000$ 2010 G/O Refunding BondsRefunds Series 2001, 2003 & 2004
Series 2009 Lease Purchase ETNs
3.00% 2.94% 2.94% 4.00%
50,000,000$
RBC Capital Markets01/22/2014 1 U:\COMMON\WORD\Farmington Schools\2014\Finance Plan 2014 - FMS
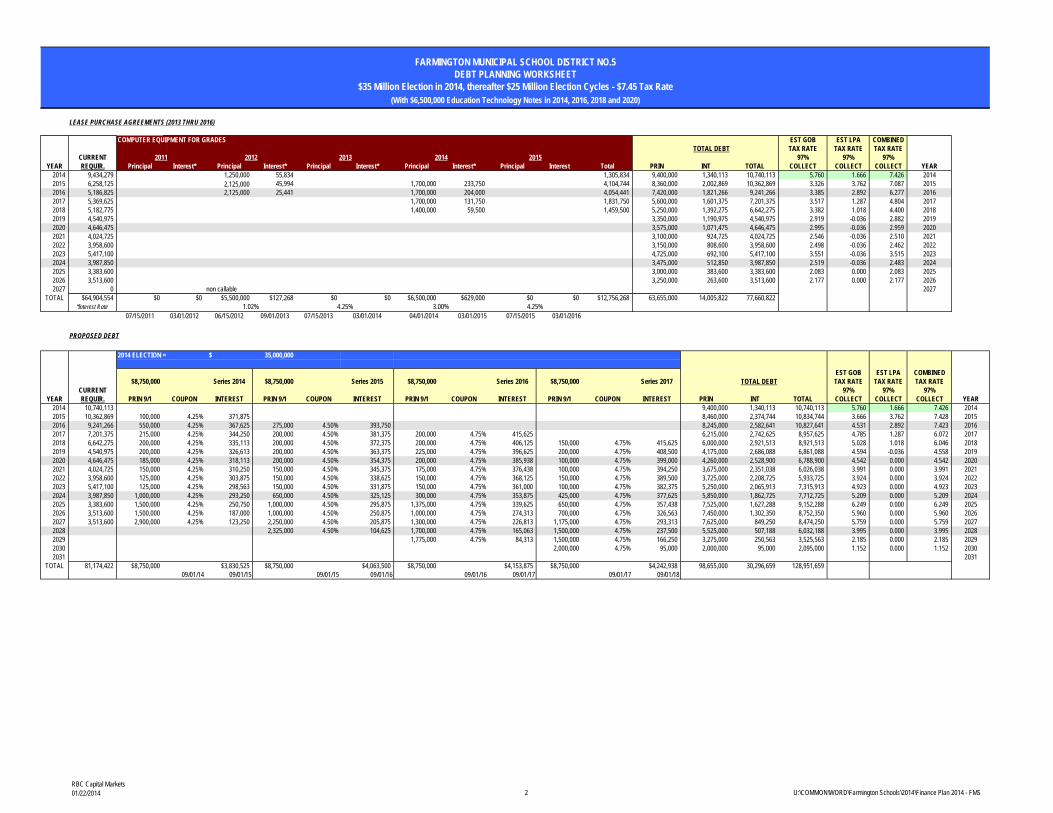
FARMINGTON MUNICIPAL SCHOOL DISTRICT NO.5
DEBT PLANNING WORKSHEET$35 Million Election in 2014, thereafter $25 Million Election Cycles - $7.45 Tax Rate
(With $6,500,000 Education Technology Notes in 2014, 2016, 2018 and 2020)
LEASE PURCHASE AGREEMENTS (2013 THRU 2016)
COMPUTER EQUIPMENT FOR GRADES EST GOB EST LPA COMBINED TOTAL DEBT TAX RATE TAX RATE TAX RATE
CURRENT 97% 97% 97%YEAR REQUIR. Principal Interest* Principal Interest* Principal Interest* Principal Interest* Principal Interest Total PRIN INT TOTAL COLLECT COLLECT COLLECT YEAR
2014 9,434,279 1,250,000 55,834 1,305,834 9,400,000 1,340,113 10,740,113 5.760 1.666 7.426 20142015 6,258,125 2,125,000 45,994 1,700,000 233,750 4,104,744 8,360,000 2,002,869 10,362,869 3.326 3.762 7.087 20152016 5,186,825 2,125,000 25,441 1,700,000 204,000 4,054,441 7,420,000 1,821,266 9,241,266 3.385 2.892 6.277 20162017 5,369,625 1,700,000 131,750 1,831,750 5,600,000 1,601,375 7,201,375 3.517 1.287 4.804 20172018 5,182,775 1,400,000 59,500 1,459,500 5,250,000 1,392,275 6,642,275 3.382 1.018 4.400 20182019 4,540,975 3,350,000 1,190,975 4,540,975 2.919 -0.036 2.882 20192020 4,646,475 3,575,000 1,071,475 4,646,475 2.995 -0.036 2.959 20202021 4,024,725 3,100,000 924,725 4,024,725 2.546 -0.036 2.510 20212022 3,958,600 3,150,000 808,600 3,958,600 2.498 -0.036 2.462 20222023 5,417,100 4,725,000 692,100 5,417,100 3.551 -0.036 3.515 20232024 3,987,850 3,475,000 512,850 3,987,850 2.519 -0.036 2.483 20242025 3,383,600 3,000,000 383,600 3,383,600 2.083 0.000 2.083 20252026 3,513,600 3,250,000 263,600 3,513,600 2.177 0.000 2.177 20262027 0 non callable 2027
TOTAL $64,904,554 $0 $0 $5,500,000 $127,268 $0 $0 $6,500,000 $629,000 $0 $0 $12,756,268 63,655,000 14,005,822 77,660,822 *Interest Rate
07/15/2011 03/01/2012 06/15/2012 09/01/2013 07/15/2013 03/01/2014 04/01/2014 03/01/2015 07/15/2015 03/01/2016
PROPOSED DEBT
2014 ELECTION = EST GOB EST LPA COMBINED $8,750,000 Series 2014 $8,750,000 Series 2015 $8,750,000 Series 2016 $8,750,000 Series 2017 TOTAL DEBT TAX RATE TAX RATE TAX RATE
CURRENT 97% 97% 97%YEAR REQUIR. PRIN 9/1 COUPON INTEREST PRIN 9/1 COUPON INTEREST PRIN 9/1 COUPON INTEREST PRIN 9/1 COUPON INTEREST PRIN INT TOTAL COLLECT COLLECT COLLECT YEAR
2014 10,740,113 9,400,000 1,340,113 10,740,113 5.760 1.666 7.426 20142015 10,362,869 100,000 4.25% 371,875 8,460,000 2,374,744 10,834,744 3.666 3.762 7.428 20152016 9,241,266 550,000 4.25% 367,625 275,000 4.50% 393,750 8,245,000 2,582,641 10,827,641 4.531 2.892 7.423 20162017 7,201,375 215,000 4.25% 344,250 200,000 4.50% 381,375 200,000 4.75% 415,625 6,215,000 2,742,625 8,957,625 4.785 1.287 6.072 20172018 6,642,275 200,000 4.25% 335,113 200,000 4.50% 372,375 200,000 4.75% 406,125 150,000 4.75% 415,625 6,000,000 2,921,513 8,921,513 5.028 1.018 6.046 20182019 4,540,975 200,000 4.25% 326,613 200,000 4.50% 363,375 225,000 4.75% 396,625 200,000 4.75% 408,500 4,175,000 2,686,088 6,861,088 4.594 -0.036 4.558 20192020 4,646,475 185,000 4.25% 318,113 200,000 4.50% 354,375 200,000 4.75% 385,938 100,000 4.75% 399,000 4,260,000 2,528,900 6,788,900 4.542 0.000 4.542 20202021 4,024,725 150,000 4.25% 310,250 150,000 4.50% 345,375 175,000 4.75% 376,438 100,000 4.75% 394,250 3,675,000 2,351,038 6,026,038 3.991 0.000 3.991 20212022 3,958,600 125,000 4.25% 303,875 150,000 4.50% 338,625 150,000 4.75% 368,125 150,000 4.75% 389,500 3,725,000 2,208,725 5,933,725 3.924 0.000 3.924 20222023 5,417,100 125,000 4.25% 298,563 150,000 4.50% 331,875 150,000 4.75% 361,000 100,000 4.75% 382,375 5,250,000 2,065,913 7,315,913 4.923 0.000 4.923 20232024 3,987,850 1,000,000 4.25% 293,250 650,000 4.50% 325,125 300,000 4.75% 353,875 425,000 4.75% 377,625 5,850,000 1,862,725 7,712,725 5.209 0.000 5.209 20242025 3,383,600 1,500,000 4.25% 250,750 1,000,000 4.50% 295,875 1,375,000 4.75% 339,625 650,000 4.75% 357,438 7,525,000 1,627,288 9,152,288 6.249 0.000 6.249 20252026 3,513,600 1,500,000 4.25% 187,000 1,000,000 4.50% 250,875 1,000,000 4.75% 274,313 700,000 4.75% 326,563 7,450,000 1,302,350 8,752,350 5.960 0.000 5.960 20262027 3,513,600 2,900,000 4.25% 123,250 2,250,000 4.50% 205,875 1,300,000 4.75% 226,813 1,175,000 4.75% 293,313 7,625,000 849,250 8,474,250 5.759 0.000 5.759 20272028 2,325,000 4.50% 104,625 1,700,000 4.75% 165,063 1,500,000 4.75% 237,500 5,525,000 507,188 6,032,188 3.995 0.000 3.995 20282029 1,775,000 4.75% 84,313 1,500,000 4.75% 166,250 3,275,000 250,563 3,525,563 2.185 0.000 2.185 20292030 2,000,000 4.75% 95,000 2,000,000 95,000 2,095,000 1.152 0.000 1.152 20302031 2031
TOTAL 81,174,422 $8,750,000 $3,830,525 $8,750,000 $4,063,500 $8,750,000 $4,153,875 $8,750,000 $4,242,938 98,655,000 30,296,659 128,951,659 09/01/14 09/01/15 09/01/15 09/01/16 09/01/16 09/01/17 09/01/17 09/01/18
2015
1.02% 4.25% 3.00% 4.25%
2011 2012 2013 2014
35,000,000$
RBC Capital Markets01/22/2014 2 U:\COMMON\WORD\Farmington Schools\2014\Finance Plan 2014 - FMS
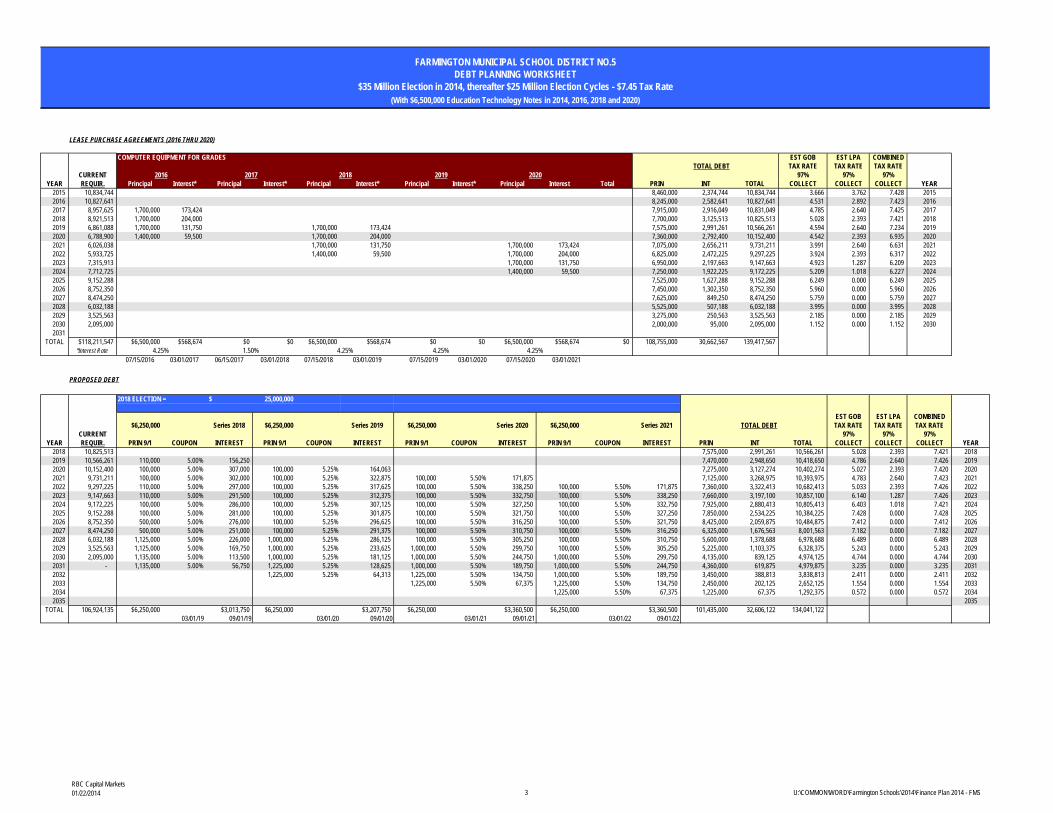
FARMINGTON MUNICIPAL SCHOOL DISTRICT NO.5
DEBT PLANNING WORKSHEET$35 Million Election in 2014, thereafter $25 Million Election Cycles - $7.45 Tax Rate
(With $6,500,000 Education Technology Notes in 2014, 2016, 2018 and 2020)
LEASE PURCHASE AGREEMENTS (2016 THRU 2020)
COMPUTER EQUIPMENT FOR GRADES EST GOB EST LPA COMBINED TOTAL DEBT TAX RATE TAX RATE TAX RATE
CURRENT 97% 97% 97%YEAR REQUIR. Principal Interest* Principal Interest* Principal Interest* Principal Interest* Principal Interest Total PRIN INT TOTAL COLLECT COLLECT COLLECT YEAR
2015 10,834,744 8,460,000 2,374,744 10,834,744 3.666 3.762 7.428 20152016 10,827,641 8,245,000 2,582,641 10,827,641 4.531 2.892 7.423 20162017 8,957,625 1,700,000 173,424 7,915,000 2,916,049 10,831,049 4.785 2.640 7.425 20172018 8,921,513 1,700,000 204,000 7,700,000 3,125,513 10,825,513 5.028 2.393 7.421 20182019 6,861,088 1,700,000 131,750 1,700,000 173,424 7,575,000 2,991,261 10,566,261 4.594 2.640 7.234 20192020 6,788,900 1,400,000 59,500 1,700,000 204,000 7,360,000 2,792,400 10,152,400 4.542 2.393 6.935 20202021 6,026,038 1,700,000 131,750 1,700,000 173,424 7,075,000 2,656,211 9,731,211 3.991 2.640 6.631 20212022 5,933,725 1,400,000 59,500 1,700,000 204,000 6,825,000 2,472,225 9,297,225 3.924 2.393 6.317 20222023 7,315,913 1,700,000 131,750 6,950,000 2,197,663 9,147,663 4.923 1.287 6.209 20232024 7,712,725 1,400,000 59,500 7,250,000 1,922,225 9,172,225 5.209 1.018 6.227 20242025 9,152,288 7,525,000 1,627,288 9,152,288 6.249 0.000 6.249 20252026 8,752,350 7,450,000 1,302,350 8,752,350 5.960 0.000 5.960 20262027 8,474,250 7,625,000 849,250 8,474,250 5.759 0.000 5.759 20272028 6,032,188 5,525,000 507,188 6,032,188 3.995 0.000 3.995 20282029 3,525,563 3,275,000 250,563 3,525,563 2.185 0.000 2.185 20292030 2,095,000 2,000,000 95,000 2,095,000 1.152 0.000 1.152 20302031
TOTAL $118,211,547 $6,500,000 $568,674 $0 $0 $6,500,000 $568,674 $0 $0 $6,500,000 $568,674 $0 108,755,000 30,662,567 139,417,567 *Interest Rate
07/15/2016 03/01/2017 06/15/2017 03/01/2018 07/15/2018 03/01/2019 07/15/2019 03/01/2020 07/15/2020 03/01/2021
PROPOSED DEBT
2018 ELECTION = EST GOB EST LPA COMBINED $6,250,000 Series 2018 $6,250,000 Series 2019 $6,250,000 Series 2020 $6,250,000 Series 2021 TOTAL DEBT TAX RATE TAX RATE TAX RATE
CURRENT 97% 97% 97%YEAR REQUIR. PRIN 9/1 COUPON INTEREST PRIN 9/1 COUPON INTEREST PRIN 9/1 COUPON INTEREST PRIN 9/1 COUPON INTEREST PRIN INT TOTAL COLLECT COLLECT COLLECT YEAR
2018 10,825,513 7,575,000 2,991,261 10,566,261 5.028 2.393 7.421 20182019 10,566,261 110,000 5.00% 156,250 7,470,000 2,948,650 10,418,650 4.786 2.640 7.426 20192020 10,152,400 100,000 5.00% 307,000 100,000 5.25% 164,063 7,275,000 3,127,274 10,402,274 5.027 2.393 7.420 20202021 9,731,211 100,000 5.00% 302,000 100,000 5.25% 322,875 100,000 5.50% 171,875 7,125,000 3,268,975 10,393,975 4.783 2.640 7.423 20212022 9,297,225 110,000 5.00% 297,000 100,000 5.25% 317,625 100,000 5.50% 338,250 100,000 5.50% 171,875 7,360,000 3,322,413 10,682,413 5.033 2.393 7.426 20222023 9,147,663 110,000 5.00% 291,500 100,000 5.25% 312,375 100,000 5.50% 332,750 100,000 5.50% 338,250 7,660,000 3,197,100 10,857,100 6.140 1.287 7.426 20232024 9,172,225 100,000 5.00% 286,000 100,000 5.25% 307,125 100,000 5.50% 327,250 100,000 5.50% 332,750 7,925,000 2,880,413 10,805,413 6.403 1.018 7.421 20242025 9,152,288 100,000 5.00% 281,000 100,000 5.25% 301,875 100,000 5.50% 321,750 100,000 5.50% 327,250 7,850,000 2,534,225 10,384,225 7.428 0.000 7.428 20252026 8,752,350 500,000 5.00% 276,000 100,000 5.25% 296,625 100,000 5.50% 316,250 100,000 5.50% 321,750 8,425,000 2,059,875 10,484,875 7.412 0.000 7.412 20262027 8,474,250 500,000 5.00% 251,000 100,000 5.25% 291,375 100,000 5.50% 310,750 100,000 5.50% 316,250 6,325,000 1,676,563 8,001,563 7.182 0.000 7.182 20272028 6,032,188 1,125,000 5.00% 226,000 1,000,000 5.25% 286,125 100,000 5.50% 305,250 100,000 5.50% 310,750 5,600,000 1,378,688 6,978,688 6.489 0.000 6.489 20282029 3,525,563 1,125,000 5.00% 169,750 1,000,000 5.25% 233,625 1,000,000 5.50% 299,750 100,000 5.50% 305,250 5,225,000 1,103,375 6,328,375 5.243 0.000 5.243 20292030 2,095,000 1,135,000 5.00% 113,500 1,000,000 5.25% 181,125 1,000,000 5.50% 244,750 1,000,000 5.50% 299,750 4,135,000 839,125 4,974,125 4.744 0.000 4.744 20302031 - 1,135,000 5.00% 56,750 1,225,000 5.25% 128,625 1,000,000 5.50% 189,750 1,000,000 5.50% 244,750 4,360,000 619,875 4,979,875 3.235 0.000 3.235 20312032 1,225,000 5.25% 64,313 1,225,000 5.50% 134,750 1,000,000 5.50% 189,750 3,450,000 388,813 3,838,813 2.411 0.000 2.411 20322033 1,225,000 5.50% 67,375 1,225,000 5.50% 134,750 2,450,000 202,125 2,652,125 1.554 0.000 1.554 20332034 1,225,000 5.50% 67,375 1,225,000 67,375 1,292,375 0.572 0.000 0.572 20342035 2035
TOTAL 106,924,135 $6,250,000 $3,013,750 $6,250,000 $3,207,750 $6,250,000 $3,360,500 $6,250,000 $3,360,500 101,435,000 32,606,122 134,041,122 03/01/19 09/01/19 03/01/20 09/01/20 03/01/21 09/01/21 03/01/22 09/01/22
4.25% 4.25%
25,000,000$
2016 2017 2018
4.25% 1.50% 4.25%
2019 2020
RBC Capital Markets01/22/2014 3 U:\COMMON\WORD\Farmington Schools\2014\Finance Plan 2014 - FMS

FARMINGTON MUNICIPAL SCHOOL DISTRICT NO.5
DEBT PLANNING WORKSHEET$35 Million Election in 2014, thereafter $25 Million Election Cycles - $7.45 Tax Rate
(With $6,500,000 Education Technology Notes in 2014, 2016, 2018 and 2020)
SUMMARY STATISTICS
ASSESSED BONDING PRIN % BONDED PRIN % BONDED BOND SALES Tax Rates
TYE VALUE CAPACITY OUTST. CAPACITY OUTST. CAPACITY 2010 2014 & 2018 2006 2010 2014 2018 ETN ETN Adj. for Adj. for9/1 ( 000'S) MAY 15 MAY 15 MAY 15 SEPT 1 SEPT 1 ELECTION ELECTIONS ETN SERIES Election Election Election Election 2008-2015 2016-2020 GOB Cash LPA Cash TOTAL YEAR
2010 1,369,782 82,186,930 37,080,348 45.12% 42,348,676 51.53% 2,210,000 2010 2.947 0.000 0.000 0.000 1.805 0.000 -0.762 -0.034 7.424 20102011 1,374,108 82,446,485 42,348,676 51.37% 21,918,843 26.59% $12,500,000 - 2011 2.816 0.968 0.000 0.000 2.456 0.000 -0.075 -0.210 7.421 20112012 1,416,504 84,990,233 35,918,843 42.26% 44,980,000 52.92% 14,000,000 5,500,000 2012 2.125 2.909 0.000 0.000 2.469 0.000 -0.291 -0.036 7.423 20122013 1,459,963 87,597,752 65,140,000 74.36% 60,495,000 69.06% 23,500,000 - 2013 2.089 1.904 0.000 0.000 2.598 0.000 -0.360 -0.438 7.424 20132014* 1,427,429 85,645,715 66,995,000 78.22% 66,345,000 77.46% - 6,500,000 2014 1.744 4.235 0.000 0.000 1.778 0.000 -1.647 -0.139 7.426 20142015 1,427,429 85,645,715 75,095,000 87.68% 66,635,000 77.80% 8,750,000 - 2015 1.179 2.507 0.341 0.000 3.798 0.000 -0.361 -0.036 7.428 20152016 1,427,429 85,645,715 66,635,000 77.80% 73,640,000 85.98% 8,750,000 6,500,000 2016 1.181 2.565 1.146 0.000 2.928 0.000 -0.361 -0.036 7.423 20162017 1,427,429 85,645,715 73,640,000 85.98% 74,475,000 86.96% 8,750,000 - 2017 1.145 2.733 1.268 0.000 1.323 1.353 -0.361 -0.036 7.425 20172018 1,427,429 85,645,715 74,475,000 86.96% 79,525,000 92.85% 8,750,000 6,500,000 2018 1.107 2.637 1.646 0.000 1.054 1.375 -0.361 -0.036 7.421 20182019 1,427,429 85,645,715 79,525,000 92.85% 78,090,000 91.18% 6,250,000 - 2019 0.418 2.862 1.676 0.192 0.000 2.676 -0.361 -0.036 7.426 20192020 1,427,429 85,645,715 78,090,000 91.18% 83,280,000 97.24% 6,250,000 6,500,000 2020 0.494 2.862 1.547 0.485 0.000 2.429 -0.361 -0.036 7.420 20202021 1,427,429 85,645,715 83,280,000 97.24% 82,155,000 95.92% 6,250,000 2021 0.489 2.417 1.445 0.792 0.000 2.676 -0.361 -0.036 7.423 20212022 1,427,429 85,645,715 82,155,000 95.92% 74,920,000 87.48% 6,250,000 2022 0.000 2.859 1.426 1.108 0.000 2.429 -0.361 -0.036 7.426 20222023 1,427,429 85,645,715 74,920,000 87.48% 67,560,000 78.88% 2023 0.000 3.912 1.371 1.217 0.000 1.323 -0.361 -0.036 7.426 20232024 1,427,429 85,645,715 67,560,000 78.88% 59,910,000 69.95% 2024 0.000 2.880 2.690 1.194 0.000 1.054 -0.361 -0.036 7.421 20242025 1,427,429 85,645,715 59,910,000 69.95% 51,985,000 60.70% 2025 0.000 2.444 4.166 1.179 0.000 0.000 -0.361 0.000 7.428 20252026 1,427,429 85,645,715 51,985,000 60.70% 43,735,000 51.07% 75,000,000 60,000,000 33,710,000 0.000 2.538 3.784 1.452 0.000 0.000 -0.361 0.000 7.412 20262027 1,427,429 85,645,715 43,735,000 51.07% 31,970,000 37.33% 0.000 0.000 6.120 1.422 0.000 0.000 -0.361 0.000 7.182 20272028 1,427,429 85,645,715 31,970,000 37.33% 24,120,000 28.16% 0.000 0.000 4.357 2.494 0.000 0.000 -0.361 0.000 6.489 20282029 1,427,429 85,645,715 24,120,000 28.16% 17,620,000 20.57% 0.000 0.000 2.546 3.057 0.000 0.000 -0.361 0.000 5.243 20292030 1,427,429 85,645,715 17,620,000 20.57% 11,485,000 13.41% 0.000 0.000 1.513 3.592 0.000 0.000 -0.361 0.000 4.744 20302031 1,427,429 85,645,715 11,485,000 13.41% 7,125,000 8.32% 0.000 0.000 0.000 3.597 0.000 0.000 -0.361 0.000 3.235 20312032 1,427,429 85,645,715 7,125,000 8.32% 3,675,000 4.29% 0.000 0.000 0.000 2.772 0.000 0.000 -0.361 0.000 2.411 20322033 1,427,429 85,645,715 3,675,000 4.29% 1,225,000 1.43% 0.000 0.000 0.000 1.915 0.000 0.000 -0.361 0.000 1.554 20332034 1,427,429 85,645,715 1,225,000 1.43% 0 0.00% 0.000 0.000 0.000 0.933 0.000 0.000 -0.361 0.000 0.572 20342035 1,427,429 85,645,715 0 0.00% 0 0.00% 0.000 0.000 0.000 0.000 0.000 0.000 0.000 0.000 0.000 20352036 1,427,429 85,645,715 0 0.00% 0.00% A.V. growth rate = 0.00% 0.000 0.000 0.000 0.000 0.000 0.000 0.000 0.000 0.000 2036
* Preliminary.
RBC Capital Markets01/22/2014 4 U:\COMMON\WORD\Farmington Schools\2014\Finance Plan 2014 - FMS


