Fast airborne aerosol size and chemistry measurements aboveMexico City and Central Mexico during the MILAGRO campaign
P. F. DeCarlo1,2,*, E. J. Dunlea1, J. R. Kimmel1, A. C. Aiken1,3, D. Sueper1, J. Crounse4, P. O. Wennberg4,L. Emmons5, Y. Shinozuka6, A. Clarke6, J. Zhou6, J. Tomlinson7, D. R. Collins7, D. Knapp5, A. J. Weinheimer5,D. D. Montzka2, T. Campos5, and J. L. Jimenez1,3
1Cooperative Institute for Research in Environmental Science (CIRES) University of Colorado, Boulder, CO, USA2Department of Atmospheric and Oceanic Science, University of Colorado at Boulder, Boulder, CO, USA3Department of Chemistry and Biochemistry, University of Colorado at Boulder, Boulder, CO, USA4California Institute of Technology, Pasadena, CA, USA5National Center for Atmospheric Research, Boulder, CO, USA6Department of Oceanography, University of Hawaii, USA7Department of Meteorology, Texas A&M University, College Station, TX, USA* now at: Laboratory of Atmospheric Chemistry, Paul Scherrer Institute, Switzerland
Received: 22 November 2007 – Published in Atmos. Chem. Phys. Discuss.: 20 December 2007Revised: 20 June 2008 – Accepted: 20 June 2008 – Published: 25 July 2008
Abstract. The concentration, size, and composition of non-refractory submicron aerosol (NR-PM1) was measured overMexico City and central Mexico with a High-ResolutionTime-of-Flight Aerosol Mass Spectrometer (HR-ToF-AMS)onboard the NSF/NCAR C-130 aircraft as part of the MILA-GRO field campaign. This was the first aircraft deploymentof the HR-ToF-AMS. During the campaign the instrumentperformed very well, and provided 12 s data. The aerosolmass from the AMS correlates strongly with other aerosolmeasurements on board the aircraft. Organic aerosol (OA)species dominate the NR-PM1 mass. OA correlates stronglywith CO and HCN indicating that pollution (mostly sec-ondary OA, SOA) and biomass burning (BB) are the mainOA sources. The OA to CO ratio indicates a typical value foraged air of around 80µg m−3 (STP) ppm−1. This is withinthe range observed in outflow from the Northeastern US,which could be due to a compensating effect between higherBB but lower biogenic VOC emissions during this study. TheO/C atomic ratio for OA is calculated from the HR massspectra and shows a clear increase with photochemical age,as SOA forms rapidly and quickly overwhelms primary ur-ban OA, consistent with Volkamer et al. (2006) and Klein-man et al. (2008). The stability of the OA/CO while O/C in-creases with photochemical age implies a net loss of carbonfrom the OA. BB OA is marked by signals atm/z 60 and
73, and also by a signal enhancement at largem/z indica-tive of larger molecules or more resistance to fragmentation.The main inorganic components show different spatial pat-terns and size distributions. Sulfate is regional in nature withclear volcanic and petrochemical/power plant sources, whilethe urban area is not a major regional source for this species.Nitrate is enhanced significantly in the urban area and imme-diate outflow, and is strongly correlated with CO indicatinga strong urban source. The importance of nitrate decreaseswith distance from the city likely due to evaporation. BBdoes not appear to be a strong source of nitrate despite itshigh emissions of nitrogen oxides, presumably due to lowammonia emissions. NR-chloride often correlates with HCNindicating a fire source, although other sources likely con-tribute as well. This is the first aircraft study of the regionalevolution of aerosol chemistry from a tropical megacity.
1 Introduction
Aerosols are important components of the earth system.Some of the effects of aerosols are reduction in visibility(Watson, 2002), deterioration of human health (Pope andDockery, 2006), deposition of pollutants to ecosystems (Byt-nerowicz and Fenn, 1996), and direct and indirect effectson the radiative balance of the climate system. Currently,aerosols and their associated direct and indirect effects con-tribute the largest uncertainty to the radiative forcing of the
Published by Copernicus Publications on behalf of the European Geosciences Union.
4028 P. F. DeCarlo et al.: Aerosol size and chemistry measurements during MILAGRO
climate system (IPCC, 2007). Organic species account fora large fraction of the submicron aerosol mass at most loca-tions (Zhang et al., 2007a) and are especially poorly under-stood. Urban areas are large sources of aerosols and aerosolprecursors. Pollution from megacities and large urban areasis important not only for local effects on health, visibility,and ecosystems/crops but also because of their collective in-fluence in regional to global scale atmospheric chemistry andradiative forcing (Lawrence et al., 2007; Madronich, 2006).
The Megacity Initiative: Local and Global Research Ob-servations (MILAGRO) took place in and around MexicoCity during March of 2006. The Megacity Impacts on Re-gional and Global Environment (MIRAGE-Mex) was thecomponent of the MILAGRO campaign under US NSF spon-sorship, and included several aircraft platforms and groundsites. The MILAGRO campaign was designed to study thechemical characterization and transformation of pollutantsfrom the Mexico City urban area to regional scales in apseudo-lagrangian framework. A High-Resolution Time-of-Flight Aerosol Mass Spectrometer (HR-ToF-AMS) (DeCarloet al., 2006) was deployed for the first time on an aircraftplatform onboard the National Science Foundation / NationalCenter for Atmospheric Research (NSF/NCAR) C-130 air-craft.
Air pollution in Mexico City has been studied for manyyears. An overview and detailed list of the studies in MexicoCity from 1960–2000 is given by Raga et al. (2001). Impor-tant conclusions include the need for size-resolved composi-tion measurements of PM2.5 aerosol, as well as the need ofvertical measurements of aerosol species. More recent stud-ies in Mexico City have added to our understanding of Mex-ico City pollution. Salcedo et al. (2006) conclude that organ-ics dominate PM2.5 inside the city during the MCMA-2003campaign, and a significant fraction of the organics are oxy-genated organic aerosol (OOA). Sulfate showed a more re-gional behavior while nitrate was mostly produced from localphotochemistry. Non-refractory (NR) chloride was presentin small levels with a diurnal cycle peaking in the morning,but also showed some very large plumes that were not asso-ciated with OA. The inorganic acids were neutralized by am-monium most of the time, although some periods with am-monium deficit were also observed when sulfate was high.Volkamer et al. (2006) show that secondary organic aerosol(SOA) from urban sources is produced rapidly and about 8times more efficiently in the city than an SOA model pre-dicted. Although only one case study is presented, the pa-per states that similar conclusions were obtained for severalother days simulated. This study extended previous resultsabout SOA underprediction over regional scales (de Gouwet al., 2005; Johnson et al., 2006a; Heald et al., 2005) toshorter time scales and the urban environment. Kleinman etal. (2008) analyzed the aerosol evolution with photochemicalage during MILAGRO over the urban area and near outflowand confirm the results of Volkamer et al. (2006).
Wildfires and biomass burning (BB) have also been iden-tified as important sources of particulate matter in MexicoCity. Bravo et al. (2002) found a correlation between es-timated emissions from wildfires and both Total SuspendedParticles (TSP) and PM10 for the years 1992–1999. Dur-ing the Mexico City Metropolitan Area campaign in 2003(MCMA-2003) biomass burning was identified as an impor-tant source of fine particles, and especially for OA and alsomineral matter and black carbon, but with no enhancement ofnitrate, sulfate, or ammonium (Johnson et al., 2006b; Molinaet al., 2007; Salcedo et al., 2006). Recent results from theMILAGRO campaign also suggest that biomass burning con-tributed significantly to the gas and particle pollution in thecity basin and outflow, although the magnitude of the im-pacts of fires is the subject of debate (Moffet et al., 2007;Stone et al., 2008; Querol et al., 2008; Yokelson et al., 2007).A source apportionment study using trace metals, inorganics,EC, and OC at many locations in and around Mexico City fortotal PM2.5 and PM10 did not identify biomass burning as asource (Querol et al., 2008). However, specific tracers of thissource (e.g., WSOC, water-soluble K, levoglucosan) werenot included in this study, and thus biomass burning emis-sions were probably mixed with other emission sources inthe source apportionment analysis (M. Viana, personal com-munication, 2007). A different source apportionment studyof fine organic aerosol reports that BB made a highly vari-able contribution in time accounting on average for 16% and32% of the ambient organic carbon (OC) at the urban (T0)and rural (T1) ground supersites respectively (Stone et al.,2008). 14C measurements indicate a significant fraction ofmodern carbon in the organic aerosol measured at the T0site, part of which likely originates from urban sources suchas trash burning and cooking (Aiken et al., 2007a; Gaffney etal., 2008).
The meteorology of the Mexico City basin has been char-acterized in earlier field campaigns. The meteorology of thebasin is very complex in response to synoptic, land/sea, andorographic forcings (de Foy et al., 2006; Fast and Zhong,1998). These field campaigns examined venting timescalesof the basin and concluded that typically the basin vents ontimescales less than one day (de Foy et al., 2006; Fast andZhong, 1998). Mixing heights during the MCMA-2003 cam-paign were typically around 3000 m and vigorous verticalmixing implied pollutants were well mixed in the bound-ary layer during the day (de Foy et al., 2006). A recentlypublished study examines the basin scale wind transport dur-ing the MILAGRO campaign, identifying six episode typesand compares the meteorological conditions in March 2006with previous 10 years (de Foy et al., 2008). An overviewof the large-scale meterology during the MILAGRO cam-paign is presented in Fast et al. (2007) and identifies 3 gen-eral regimes. 1–14 March is the first regime and is char-acterized by sunny and dry conditions. The second regimefrom 14–23 March saw an increase in humidity and the de-velopment of afternoon convection, which slowly diminished
P. F. DeCarlo et al.: Aerosol size and chemistry measurements during MILAGRO 4029
as the atmosphere became drier. The third regime (24–31March) began with a cold surge, saw increased precipitation,and a decrease in the frequency and intensity of fires.
The C-130 performed 12 research flights (RFs) during theMILAGRO campaign. Flight altitudes were typically lessthan 6 km above sea level (ASL) (∼96% of data), and ap-proximately 97% of city data (defined in Sect. 3.2) weretaken at less than 2 km radar altitude. Vigorous turbulentmixing in the boundary layer implies a well mixed boundarylayer over Mexico City during the afternoon. The regionaldata average altitude is 4.0 km above sea level (a.s.l.) and3.2 km radar altitude (above the ground). For this paper thefocus will be on RFs 2, 3, and 12 (8, 10 and 29 March 2006,respectively). Data will also be presented from RFs 1, 9, 10,and 11 from the 4, 23, 26 and 28 March 2006. RFs 2, 3, and12 all had city and regional components in their flight pat-terns. RF 1 had a city and regional component, but not allinstruments were working on the C-130. RF 9 was a flight tothe Yucatan Pennisula, and did not contain a city component.RF 10 was cut short due to mechanical problems with the air-craft, and the majority of the flight was spent at high altitude.RF 11 was a flight designed to measure the morning transi-tion of photochemistry and did not sample in the city basin.During RFs 4-8 a leak in the shared inlet system did not allowquantitative measurements of aerosol chemistry; when pos-sible mass fractions of the measured AMS chemical specieswere reported to the database, however they have not beenincluded in this paper.
In this paper, we present, the results of the measurementsof non-refractory submicron aerosol chemistry from the HR-ToF-AMS in the C-130 which indicate that organic aerosols(OA) are the largest NR chemical component, with nitrate,sulfate, ammonium, and chloride also making significantcontributions. Different aerosol species have different spa-tial distributions and tracer correlations, indicating influencesfrom different sources and processes. A large fraction ofthe organic aerosol is oxidized, with an oxygen-to-carbonatomic ratio (O/C) that increases with distance from the cityapproaching a ratio of 0.9 away from the basin. Organic O/Ccan be used as a qualitative “photochemical clock”. Finallya detailed case study of RF 2 is presented to assemble all ofthese results into a coherent and detailed picture of submi-cron aerosol over and around Mexico City. Quantitative ap-portionment of OA sources will be addressed in a subsequentpublication.
2 Methods
2.1 Instrumentation
2.1.1 HR-ToF-AMS
The HR-ToF-AMS has been described in detail previously(DeCarlo et al., 2006). It improves upon previous versions
of the AMS (Drewnick et al., 2005; Jayne et al., 2000;Canagaratna et al., 2007) by the use of a high-resolutionmass spectrometer that allows the determination of the el-emental composition of most ions, while previous AMSversions can only determine the total signal at each inte-ger mass. In the rest of the paper we will refer to theHR-ToF-AMS as “AMS” for brevity. The AMS samplednon-refractory submicron aerosol (NR-PM1) during the re-search flights. Data were acquired in two acquisition modes(Jimenez et al., 2003): Particle Time-of-Flight mode (PToF)which allows for particle sizing, and Mass Spec (MS) mode,which produces species concentrations and a complete massspectrum of the non-refractory submicron mass with nosize information, but with higher sensitivity than the PToFmode. For most of the campaign data was averaged andsaved every 12 s. Data was also saved at longer time in-tervals (∼30–45 s) early in the campaign, and sometimes a“plume-mode” was utilized which consisted of 3 s save in-tervals of MS mode only (no particle sizing). The HR-ToF-AMS was run exclusively in the V-mode of ion flight forthe mass spectrometer, which is about a factor of 10 moresensitive than the alternative W-mode. V-mode operationhas lower resolution than W-mode, but still maintains highenough resolution to separate most ions of the same nominalmass, and especially reduced vs. oxidized organic fragments(DeCarlo et al., 2006). This instrument was installed to-wards the rear of the C-130 (http://mirage-mex.acd.ucar.edu/Measurements/C130/Images/C-130layout.png) and sharedan inlet system with the Georgia Tech Particle into LiquidSampler (PILS). The inlet is described in more detail else-where (Dunlea et al., 2008). Briefly, the inlet was mountedin the belly of the aircraft and consisted of a near isokineticshallow conical diffuser into a 2.54 cm (1.0 inch) diameterstainless steel tube with a smooth 90◦ bend into the cabinfloor. The flow was then isokinetically subsampled into theAMS line (8 l per min) and PILS (30 l per min). A pres-sure controlled inlet was used just before the AMS (Bahreiniet al., 2008), to eliminate the fluctuations in aerosol sizingand transmission efficiency due to changing pressures in theaerodynamic lens of the instrument. The PCI used a set-point of 350 Torr, with a 180 micron orifice upstream, anda 150 micron orifice in the lens of the AMS. This allows forsampling up to∼6.5 km without the need for flow or sizingcorrections to the raw AMS data. The transmission of par-ticle sizes into the AMS was determined by the AMS inlet(critical orifices and aerodynamic lens) as the losses in theplane inlet and tubing were small for the AMS size range(Dunlea et al., 2008). The residence time between the inlettip and the AMS was∼4 s (of which 3.2 s was in the PCI),and the flow warmed up to cabin temperature due to ramheating in the inlet and heat transfer (1T ∼2–35◦C for air-craft altitudes below 4 km). This may have led to some evap-oration of aerosol components (Murphy et al., 2007), whichwould be more important for ammonium nitrate and chloride,less important for organics, and negligible for ammonium
4030 P. F. DeCarlo et al.: Aerosol size and chemistry measurements during MILAGRO
sulfate (Huffman et al., 2008b). Further information on AMSdata processing is given in Sect. 2.3.
2.1.2 Nephelometer
Total and submicrometer aerosol scattering coefficients weremeasured at 450, 550 and 700 nm using two TSI model3563 3-wavelength integrating nephelometers (Anderson etal., 1996; Heintzenberg and Charlson, 1996; Anderson et al.,2003). The submicrometer TSI nephelometer employed a 1-µm aerodynamic impactor maintained at 30 lpm by an Ali-cat Scientific volumetric flow controller. While the measure-ments were made every second, sample air residence timeinside the nephelometers was about 10 s. The noise over10 s at 550 nm is estimated to be 0.3 Mm−1 (Anderson et al.,1996). The instrument relative humidity was usually lowerthan 30%. The scattering coefficients were detected over 7–170◦, and corrected for 0–180◦ using the measured wave-length dependence as a surrogate for the particle size afterAnderson and Ogren (1998). For the submicron (PM1) scat-tering, this angular truncation correction is typically less than10%, and contributes negligible (<3%) uncertainty. Gas cal-ibration results in a smaller (+/−1%) systematic error (An-derson et al., 1996). The aerosol inlet for the nephelometerwas a shrouded solid diffuser maintained at isokinetic flow±5% and aspirated at about 100 lpm. The aerodynamic 50%size cut was 5µm (McNaughton et al., 2007).
2.1.3 Optical Particle Counter (OPC)
An optical particle counter (OPC, a modified LAS-X, Parti-cle Measurement Systems, Boulder, Colorado) measured thedry (RH<30%) aerosol size distribution between 0.1µm andabout 10µm (Clarke, 1991). The He-Ne laser operates at633 nm detecting light scattered by individual particles over35–145◦. The particle size up to 2µm was calibrated withpolystyrene latex spheres whose refractive index is 1.59. Forcalibrating the coarse mode, glass beads with a refractive in-dex of 1.54 were also used. The data was obtained every 3 s,but averaged over 30 s to reduce error due to low countingstatistics at about 1µm or larger.
2.1.4 Scanning Mobility Particle Sizer (SMPS)
The Texas A&M SMPS (Wang and Flagan, 1990) measuredthe size distribution of particles between 0.012 and 0.67µmmobility diameter once every 1.5 min. A high flow differen-tial mobility analyzer (Stolzenburg et al., 1998) is used in theSMPS with sample and sheath flow rates of 1.5 and 15 l permin, respectively. The sampled aerosol was dried to below10% RH prior to classification using a Nafion tube bundle.The SMPS was located adjacent to, and shared an inlet with,the nephelometer and Single particle soot photometer (SP2).The “apparent” aerosol volume (DeCarlo et al., 2004) wascalculated from the SMPS size distributions with the assump-tion of spherical particles. This volume would be biased high
if a significant fraction of the particles were non-spherical,which is however not expected due to the large fraction ofsecondary species.
2.1.5 HCN
The Caltech CIMS (Crounse et al., 2006) measured selectedproduct ions on the C-130 via reaction of the reagent ionCF3O− with analytes directly in air. HCN is measured bymonitoring the product ion atm/z 112, which is the clusterof CF3O− with HCN. The sensitivity to HCN is dependenton the water vapor mixing ratio. Sensitivity changes due towater vapor changes are corrected for using the dewpoint hy-grometer water measurement from the C-130 aircraft, and awater calibration curve that has been generated though lab-oratory measurements. Non-water sensitivity changes arecorrected for using in-flight standard addition calibrationsof H2O2 and HNO3 (other species measured by the CIMS)and proxied to laboratory calibrations of HCN. The detectionlimit (S/N=1) for HCN for a 0.5 s integration period is bet-ter than 15 pptv for moderate to low water vapor levels (H2Omixing ratio≤0.004).
2.1.6 CO
The NCAR/NSF C-130 CO vacuum UV resonance fluores-cence instrument is similar to that of Gerbig et al. (1999).The MILAGRO data have a 3 ppbv precision, 1-s resolution,and a typical accuracy of±10% for a 100 ppbv ambient mix-ing ratio.
2.1.7 NOx, NOy measurement
NOx (NO and NO2) and NOy (total reactive nitrogen) weremeasured (along with O3) using the NCAR 4-channel chemi-luminescence instrument, previously flown on the NASAWB-57F (Ridley et al., 2004). NOy was measured via Au-catalyzed conversion of reactive nitrogen species to NO, witha time response of about 1 s. NO2 was measured as NO fol-lowing photolytic conversion of NO2, with a time responseof about 3 s due to the residence time in the photolysis cell.NO was measured with an identical time response due to useof a cell with an identical residence time. NO and NO2 arereported at 1-s. For NO, NO2, and NOy, the precision of a1-s value is near 15 pptv. The overall estimated uncertaintiesof 1-s values are±(15+7% of the mixing ratio) pptv for NO,±(15+10% of the mixing ratio) pptv for NO2, ±(15+15% ofmixing ratio) pptv for NOy.
P. F. DeCarlo et al.: Aerosol size and chemistry measurements during MILAGRO 4031
2.1.8 MOZART model
A simulation of MOZART-4 (Model for Ozone and Re-lated chemical Tracers, version 4) (Emmons et al., 20081)was run where tracers that represented the CO emissionsfrom Mexico City for each day were included. MOZART-4 was driven with NCEP/GFS (National Centers for Envi-ronmental Prediction Global Forecast System) meteorolog-ical fields at a horizontal resolution of T170 (0.7◦). Theemissions are from the Mexico National Emissions Inventoryfor 1999 (http://www.epa.gov/ttn/chief/net/mexico.html, asgridded by M. Mena, U. Iowa) and the tracers include theemissions between 18–20◦ N and 98–100◦ W.
2.2 Ground supersites
The ground supersites, named T0, T1, and T2 are describedin Fast et al. (2007). Some additional information on theground supersites is given in Querol et al. (2008) and Stone etal. (2008). Briefly T0 was inside the city, and T1 and T2 wereoutside the city to the northeast about 30 and 63 km awayfrom T0 respectively. The names were chosen to indicate therelative ages of air for pseudo-lagrangian experiments whencity air flowed to the northeast. A more detailed discussionof these sites will be given in the forthcoming MILAGROoverview paper (Molina et al., 20082). Notably at the T0supersite another HR-ToF-AMS was deployed jointly by theJimenez group and Aerodyne (Aiken et al., 2007a, 2008).
2.3 AMS data processing
2.3.1 AMS calibrations
Procedures for AMS calibration can be found in previouspublications (Allan et al., 2003, 2004; Jimenez et al., 2003;Kimmel et al., 2006). The amplification factor of the mi-crochannel plate detector (MCP) was measured every daythe instrument was in use (“single ion calibration”). Due tothe stability and reproducibility of the single ion throughoutthe campaign a single average value was used for the entirecampaign. The lack of MCP degradation is likely due to thevery limited instrument use,∼120 h total, equivalent to only5 days of operation in a ground-based field campaign. Ion-ization efficiency (IE) calibrations were performed 6 timesduring the campaign. Due to customs issues the calibrationequipment was not delivered until 10 days into the campaign,thus the IE for the first 3 flights was assumed to be the same,
1Emmons, L. K., Hess, P. G., Lamarque, J.-F., Pfister, G. G.,Fillmore, D., Granier, C., Guenther, A., Kinnison, D., Laepple, T.,Orlando, J., Tie, X., Tyndall, G., Walters, S., et al.: Impact of Mex-ico City emissions on regional air quality from MOZART-4 simu-lations, Atmos. Chem. Phys., in preparation, 2008.
2Molina, L. T., Madronich, S., Gaffney, J. S., et al.: AnOverview of the MILAGRO Campaign: Mexico City Emissionsand Their Evolution, Atmos. Chem. Phys. Discuss., in prepara-tion, 2008.
and was determined by a calibration made on 12 March 2006.Over the course of the campaign the IE calibration valuesvaried by 20%, but varied by smaller amounts from flightto flight. 20% is therefore an upper limit to the uncertaintyintroduced by not having calibration equipment for the firstthree flights. IE values for the rest of the flights were de-termined from calibrations bracketing the flights. All AMSdata was converted to mass loading at standard temperatureand pressure (STP, 273 K and 1013.25 hPa). Measured AMSmass was converted to volume using the assumption thatspecies volume is additive (Eq. 4 of DeCarlo et al. (2004)).For this conversion the densities of the species were assumedto be 1.78, 1.72, and 1.52 g cm−3 for ammonium sulfate,ammonium nitrate, ammonium chloride respectively (Lide,2007). A density of 1.27 g cm−3 was used for organics, basedon the measured value from Cross et al. (2007).
2.3.2 AMS data processing
AMS Data was processed in the Igor Pro 6.0 Soft-ware (Wavemetrics Inc. Lake Oswego, Oregon) us-ing the standard ToF-AMS Data Analysis toolkit,(“Squirrel”, http://cires.colorado.edu/jimenez-group/ToFAMSResources/ToFSoftware/SquirrelInfo/). The par-ticle collection efficiency (CE) for the AMS was assumedto be 0.5 unless there was evidence of acidic aerosol (seeFig. 2 for comparisons of AMS results with those fromother instruments). In cases of acidic aerosol, the CE wasincreased proportional to the mass fraction of sulfuric acid(CE=1) to ammonium bisulfate (CE=0.5) (Canagaratna etal., 2007; Quinn et al., 2006; Takegawa et al., 2005). The in-tegration of total signals for individual ions (“high-resolutionsticks,” e.g. C2H3O+ and C3H+
7 at m/z 43) from raw massspectral data was carried out using the “Pika” module ofSquirrel developed by our group (http://cires.colorado.edu/jimenez-group/ToFAMSResources/ToFSoftware/PikaInfo/),which implements the procedures described in DeCarlo etal. (2006). Sticks for spectra acquired in open (particles+ air + mass spectrometer background) and closed (onlybackground) modes were calculated. Particle + air signalfor each ion was determined by the difference of the opensignal and the closed signal. Air contributions to individualions (e.g. CO+2 at m/z 44) were subtracted from the totalsignal at that ion. Variations in the gas-phase CO2 wouldproduce only a very small effect in the aerosol CO+
2 ionsignal. The typical gas-phase CO2 background of∼380 ppmis equivalent to∼100 ng m−3 of organic-equivalent (org.-eq.(Zhang et al., 2005a)) aerosol signal atm/z 44. Thissignal is subtracted from∼2600 ng m−3 of org.-eq.m/z 44aerosol signal in the city and∼1000 ng m−3 in regional air.Variations on the order of 40 ppm for gas-phase CO2 wouldchange its contribution to totalm/z 44 by +/− 10 ng m−3,which is within the noise of the measurement. Note that thiscorrection can be much more important for studies with lowOA concentrations.
4032 P. F. DeCarlo et al.: Aerosol size and chemistry measurements during MILAGRO
Fig. 1. High-resolution ion signals atm/z 29 and 43 for RF 3 (10March 2006). The insets shows individual 12-s high resolution massspectra form/z 29 and 43. Form/z 43, the oxygen-containing frag-ment dominates the total signal in both the city and non-city case,however the intensity of the C3H+
7 ion increases in the city, indi-cating additional presence of more reduced aerosol species such asprimary traffic and biomass burning emissions.
A correction atm/z 29 was also necessary, as the 2 mostintense peaks CHO+ and 15NN+ (29.00274 and 29.00318,respectively), cannot be separated at the resolution of the in-strument. N15N+ was calculated as a constant fraction of theN+
2 signal atm/z 28 from calibrations with a particle filter,with the remaining signal assigned to the CHO+ ion. Twoother peaks, corresponding to C2H+
5 and CH3N+at m/z 29were also resolved from the above two ions. Figure 1 showsion signals atm/z 29 and 43 during research flight 3. Tracesof the ion signals for this flight are shown and insets show themass spectra for thesem/z for one 12 s data point. The insetfor m/z 43 shows 2 different mass spectra corresponding to 2different portions of the flight; one in the city and one in theoutflow. From this it is clear that the C2H3O+ fragment isproportionately larger than the C3H+
7 fragment, indicative ofthe larger contribution of oxygenated species (likely SOA)in the outflow and of more reduced species (such as trafficexhaust, biomass burning, and less aged SOA) over the city.
2.3.3 Calculation of light scattering from AMS Data
AMS total size distributions from PToF mode were averagedto a 5 minute timebase for RFs 1, 2, 3, 9, 10 11, and 12. The
total NR size distribution was converted to a number dis-tribution vs. volume-equivalent diameter (dN/dlogdve), as-suming spherical particles and using the bulk density of theaerosol calculated from the chemical composition for each5 min average, according to the conversions detailed in De-Carlo et al. (2004). Scattering was calculated for this dis-tribution using the routine of Bohren and Huffman (1983)translated into Igor (C. Brock, NOAA, personal communi-cation, 2006). We used a refractive index of 1.54, which isthe average of the refractive indices for Ammonium Sulfate(1.55), and organics (1.53) (Hand et al., 2002; Kleinman etal., 2007) and calculated scattering at 550 nm to compare tothe Nephelometer, which measured submicron scattering atthat wavelength.
2.3.4 Elemental analysis of organic aerosol from AMS data
Elemental analysis was performed on the high-resolutiondata following the method described in Aiken et al. (2007b,2008). Inorganic and air ions were removed so only or-ganic ions were included in the calculation of elemental ra-tios. Oxygen-to-carbon atomic ratios of the organic aerosol(O/C) and hydrogen-to-carbon (H/C) were determined, aswell as the organic mass-to-organic carbon ratio (OM/OC).The nitrogen-to-carbon ratio was calculated, however the V-mode does not have enough resolution to reliably quantifysome N-containing ions, so the absolute N/C ratio is not re-ported, although it is used in the OM/OC calculation. W-mode data from the T0 supersite in Mexico City show thatorganic N/C is typically more than an order of magnitudesmaller than the O/C (Aiken et al., 2008), comparable tothe N/C ratio found on the C-130. Thus errors in the re-ported OM/OC due to imprecision in the N/C ratios derivedhere should be small. Organonitrates and organosulfates canproduce nominally “inorganic” ions in the AMS (e.g. NO+,NO+
2 , SO+, SO+
2 ). Ignoring these ions will result in a neg-ative bias on the O/C and OM/OC. However the analysis ofthe stoichiometric neutralization of ammonium vs. nitrate,sulfate, and chloride (discussed below, see also Zhang etal. (2007b)) suggests that the contribution of these types ofspecies (and thus the associated errors in O/C and OM/OC)is small. To avoid the effect of noise at low OA concentra-tions, ratios are only reported when the OA mass was largerthan 2µg m−3.
3 Results and discussion
3.1 Aerosol Measurement Intercomparisons
Data were converted to the timebase of the slower measure-ment when comparing with different instruments. The AMSmass and calculated volume and the Nephelometer submi-cron scattering were reported at approximately 12 s per datapoint, and for comparisons Nephelometer data was interpo-lated to the AMS timebase. The SMPS data was recorded on
P. F. DeCarlo et al.: Aerosol size and chemistry measurements during MILAGRO 4033
Fig. 2. (a)Time series from RF 3 (10 March 2006) of AMS calculated volume, SMPS apparent volume, and PM1 light scattering, all on theirnative timebases.(b) Scatter plot of submicron light scattering as measured at 550 nm by the Nephelometer vs the AMS total mass. Datais interpolated to the AMS timebase and the majority of data points in the plot are 12 s averages.(c) Scatter plot of volume calculated fromthe AMS mass and composition-dependent density, against the apparent volume calculated from the SMPS distribution assuming particlesphericity. The AMS data in this plot has been averaged to the 96 second SMPS timebase. A slope close to 1 and anR2 of 0.82 indicategood general agreement.(d) Calculated scattering from 5-min AMS size distributions and Mie theory versus average measured scatteringby the Nephelometer over the same period. 27 data points out of 507 total points were eliminated due to low loading resulting in unphysicalsize distributions from the AMS. Reported errors in slopes in plots b-d are the 1-σ estimate for the fitted variables returned from the fittingalgorithm.
a 96 s timebase, for this comparison AMS data was averagedto the SMPS timebase. The calculation of scattering fromAMS size distribution data was done on a 5 min time grid asthe size distributions have lower signal to noise ratios thantotal mass concentrations and require more time integration.Figure 2a shows a timeseries from RF 3 (10 March 2006) forcalculated AMS volume, SMPS apparent volume, and mea-sured PM1 Light Scattering. All data are shown in Fig. 2a attheir native sampling resolution, and high correlation amongthe measurements is seen. Although only one flight is shown,other flights show similar agreement. Correlations betweenthe different measurements for the whole campaign are dis-cussed in the following sections. Note that data from takeoffand landing were excluded from these comparisons since theinlet for the AMS was in a different location on the aircraftthan the Nephelometer and SMPS, and particles generatedby the landing gear and exhaust are sampled differently forthese portions of the flights.
3.1.1 AMS vs. Nephelometer comparison
A direct comparison of Nephelometer Scattering to NR-submicron aerosol mass for the entire MILAGRO campaignshows high correlation (see Fig. 2b). The slope of the linearregression (3.79 m2/g) is equivalent to the Mass ScatteringEfficiency (MSE), and is in good agreement with the rangeof dry MSE values of 3.6±1.3 m2/g reported by Shinozukaet al. (2007). Based on preliminary data, black carbon makesup 1–3% of the submicron mass during MIRAGE (R. Sub-ramanian, DMT, personal communication), and would makeup slightly less of the submicron volume due to the higherdensity values for black carbon (Park et al., 2004) in rela-tion to the dominant organic constituents; consequently theAMS mass or calculated volume is not expected to be sig-nificantly impacted by the exclusion of black carbon. Someof the scatter can be explained by differences in the exactsize cuts of both instruments, and of sampling timebase,
4034 P. F. DeCarlo et al.: Aerosol size and chemistry measurements during MILAGRO
Fig. 3. Average chemical composition of NR-PM1 in differentregions. Mass concentrations are given inµg m−3 STP (273 K,1 atm). Panel(d) has a gray background to differentiate the grounddata from the aircraft data(a) Average of whole MIRAGE aircraftcampaign.(b) Average of MIRAGE data when flying directly overMexico City. (c) Average of MIRAGE excluding all points overMexico City. (d) Average measured at the ground at the T0 Su-persite, between the hours of 18:00–24:00 UTC (12:00–18:00 localtime). The time period was chosen for comparison purposes, as thisis when the C-130 typically flew over the city (see text). The areaof each pie is proportional to average mass concentration.
frequency, and different inlet locations on the aircraft. TheAMS sampled in MS mode approximately half of the time,while the Nephelometer was sampling continuously. Shortplumes (∼6 s or less equivalent to approximately 600 m at100 m/s) could be missed by the AMS or be sampled and benon-representative of the average mass loading for the pe-riod in question. The regression of submicron Nephelometerscattering to AMS calculated volume gave a slope (VolumeScattering Effciency) of 5.50 m2 cm−3 (R2=0.86).
3.1.2 AMS and SMPS volume comparison
Figure 2c shows a scatter plot of AMS calculated volume vs.SMPS apparent volume for all overlapping data during MI-RAGE. Again, good agreement is found with a slope of 0.98(R2=0.82). Perfect agreement is not expected due to lack ofcomplete overlap in the measured size ranges, effects on siz-ing of particle non-sphericity, and since SMPS is measuringa different particle size at each point in space (time), whilethe AMS does an interleaved average as discussed above. Athigh mass loadings the AMS is above the fit line, which couldbe due to ammonium nitrate evaporation in the SMPS (Gyselet al., 2007), which was maintained at 40◦C to improve RHcontrol in the tandem differential differential mobility ana-
lyzer (TDMA) that was located in the same enclosure as theSMPS.
3.1.3 Calculated scattering vs. measured scattering
Scattering calculated from AMS size-resolved compositionwas compared to the averaged nephelometer measurements.Figure 2d shows that agreement is good for most of theflights. During flights with lower aerosol concentrationsthere is more scatter, likely because the AMS size distribu-tions are noisier for low loading (especially for larger sizes)and this noise is amplified with the non-linearity in the scat-tering calculation. Calculated scattering from INTEX-B wasalso included in this figure to show the general agreementwith MIRAGE and shows the lower loadings sampled duringthe INTEX-B campaign (Dunlea et al., 2008).
3.2 Submicron Aerosol Chemistry over and away fromMexico City
Bulk NR-PM1 composition was averaged for the whole air-craft campaign as well as for periods when the aircraftwas over Mexico City (defined as the box between 19.814,19.023 N, and 260.577 and 261.379). Figures 3a–c show thisinformation. Figure 3d shows the average aerosol composi-tion as measured at the ground during the entire campaignat the T0 supersite (19.48973 N,−99.1501 W) at the typi-cal times of day (12:00–18:00 local time) when the C-130flew over the city. The average for the whole campaign wasused for T0 as there were only a few direct flyovers and bothinstruments were not always operating during those times,and also because the bulk aerosol composition was not highlyvariable at T0. The relative concentrations of organic and to-tal inorganic species are very similar. The fraction of organ-ics from the MCMA-2003 campaign (Salcedo et al., 2006) islarger than the fraction reported in this study, but this is dueto the MCMA-2003 study reporting a full day average. Afull day average would increase the mass fraction of organ-ics because there are higher primary organics and lower am-monium nitrate concentrations during evenings, nights, andearly mornings.
The spatial and vertical distribution of the species showedsignificant differences. Figure 3c shows that away from thecity the total average concentration is∼1/4 of that over thecity, confirming the importance of the MCMA as a regionalsource, and with an increased fraction of sulfate at the ex-pense of nitrate. In general, sulfate was more of a regionalcomponent to the aerosol with similar concentrations bothin the MCMA basin and in the regional airmass, while ni-trate was localized to the city and in the near-outflow. Thisis consistent with the conclusions of Salcedo et al. (2006),who based them on the rapid variability and strong diurnalcycles of nitrate in the city, versus the much more constantand slowly varying levels of sulfate, as well as the fact thatOH+NO2 could explain the rapid nitrate increases observed
P. F. DeCarlo et al.: Aerosol size and chemistry measurements during MILAGRO 4035
Fig. 4. Spatial maps of(a) NR-PM1 sulfate,(b) NR-PM1 nitrate, (c) NR-PM1 chloride, and(d) NR-PM1 Organics. The dashed boxrepresents the area designated as “city” in Fig. 3. Several large SO2 sources for the region are indicated in part (b). Volcanoes are designatedas red triangles, petrochemical refineries indicated by hollow circles. Both Popocatepetl and Colima were active in 2007, while the lastknown eruption of El Chichon is 1982 (Smithsonian, 2007). Also note that the colorscale for part (d) is double that of parts (a) and (b), andthe scale of part (c) is 10% of parts (a) and (b).
Table 1. Results of the Organic Aerosol to CO regression analysis for RFs 1, 2, 3, 9, 10, 11, 12. RFs 1, 2, 3, 12 had a city and regionalcomponent; the rest of the flights are included for completeness, but do not represent the same range of conditions. CO background is givenby the X-axis intercept for the low CO (<200 ppbv) conditions. Slopes are the OA/CO ratio for each flight. The R2 value is given to indicatethe quality of fit.
RF 1 RF 2 RF3 RF9 RF10 RF 11 RF12
Units (STP) 4 March 08 March 10 March 23 March 26 March 28 March 29 MarchOA/CO (low CO) µg m−3 ppmv−1 77.9 81.1 84.8 62.5 32.5 47.0 80.2Estimated CO background ppbv 73.1 78 61 74 63 73 93R2 0.84 0.53 0.82 0.65 0.25 0.50 0.78
in the mornings, while sulfate formation from OH+SO2 wassmall compared to the concentrations observed. Kleinman etal. (2008) analyzed the increase of the sulfate/CO for theirMILAGRO dataset from the G-1 aircraft in the MCMA out-flow. However, given the lack of correlation of sulfate withurban pollutants, this analysis may have led to an artificiallyinflated rate of growth of sulfate/CO for this species in theresults of Kleinman et al., as CO decreased due to dilutionbut sulfate did not due to its more regional character. Spatial
maps of NR-PM1 sulfate, nitrate, and chloride are shown inFig. 4a-c. Both industrial sources and volcanic sources havebeen identified as potentially contributing to the aerosol sul-fate in the basin (de Foy et al., 2007; Johnson et al., 2006b;Raga et al., 1999; Salcedo et al., 2006). The maps show themore regional distribution of sulfate with significant struc-ture indicating the influence of the large SO2 sources fromindustrial complexes (e.g. Tula and refineries near Veracruz)and active volcanoes (e.g. Popocateptl). Emissions of SO2
4036 P. F. DeCarlo et al.: Aerosol size and chemistry measurements during MILAGRO
Fig. 5. Shows OA and NO−3 aerosol components divide by excessCO to account for dilution. Part(a) shows a spatial map of theOA/CO ratio. Part(b) shows a spatial map of the NR-PM1 ni-trate/CO ratio. Part(c) shows the average OA/CO and NO3/COratio as a function of distance from Mexico City. The error barsare the standard error of the mean for all of the measurements inthat distance bin. Points from the Yucatan portion of RF 9 wereexcluded from this analysis due to the influence of local fires fromthat region.
from Popocateptl were also monitored directly during MI-LAGRO, when the volcano was a continous source of SO2and its emissions varied from a minimum of 0.56 Gg/day toa maximum of 5.97 Gg/day (Grutter et al., 2008). Submi-cron aerosol nitrate appears to be in the form of ammoniumnitrate, based on the ammonium balance and observed frag-mentation pattern (see below), while the fractional contribu-tion of organic nitrates to total nitrate appears to be small.Nitrate shows a dominant source in the city basin, and cor-relates strongly with CO in the city basin (R2=0.79) but notwith HCN (R2=0.10) indicating the dominance of the urban
non-fire source for this species. Mexico City is character-ized by high concentrations of gas-phase NH3 that favor itsco-condensation with nitric acid to form semivolatile am-monium nitrate (San Martini et al., 2006). In contrast, fireplumes around Mexico City have a large molar excess ofNOx vs. NH3 (Yokelson et al., 2007), which may explain thelimited ammonium nitrate formation. Nitrate shows a verylarge fractional reduction in the outflow, most likely due toevaporation upon dilution with regional air with low HNO3and NH3, or the loss of NH+4 to sulfuric acid or ammoniumbisulfate. Regional temperature gradients do not appear toplay a role, as the average temperature measured on the C-130 is approximately 5◦C higher above the city box than theregional air, which would favor evaporation in the city andcondensation away from the city. HNO3 also reacts withdust in the Mexico City area forming mineral nitrates in thesupermicron mode (Fountoukis et al., 2007; Moffet et al.,2007; Querol et al., 2008) that would not be detected by theAMS. However the dust spatial and temporal distribution ishighly variable and is unlikely to be the only cause of thepronounced decrease in nitrate away from the city observedin this study. Figures 5a–c show the ratio of organic and ni-trate aerosol to excess CO to remove the effect of dilution inthe cleaner regional air. Excess CO is defined as the CO con-centration above background, with the background value foreach flight given in Table 1. Additionally data with OA con-centrations less than 2µg m−3 STP or NO3 concentrationsless than 0.2µg m−3 STP were eliminated from the analysisto reduce the impact of noise and of uncertainty in the CObackground (90% of the points used in the analysis had COexcess>35 ppbv). Clearly NO3/CO shows a large reduc-tion with distance from the Mexico City urban area, whileOA/CO does not. Although aerosol nitrate does not com-pletely disappear, its ratio to CO decreases quickly and hasdropped by nearly a factor of 4 by the time the aircraft is200 km from the city basin. The OA/CO ratio in the outflownear the city is about 80µg m−3 STP ppm−1. This is likelydue to a combination of rapid SOA formation from urbanemissions and mixing of biomass burning OA, and will beanalyzed in more detail in a subsequent publication. This ra-tio is similar to the value found by Kleinman et al. (2008), fortheir study of the near outflow on the DOE G-1 aircraft. It isalso much larger than values of 5–10µg m−3 STP ppm−1 forurban POA (Aiken et al., 2007a; Zhang et al., 2005c), whichhighlights the dominance of SOA in the pollution outflowof the city, consistent with previous observations in MexicoCity (Kleinman et al., 2008; Volkamer et al., 2006, 2007)and at several other locations (Zhang et al., 2007a). Boththe asymptotic value of OA/CO and the timescale of SOAformation of approximately one day are similar to findingsreported for the outflow of the Northeastern US (de Gouw etal., 2005, 2008; Kleinman et al., 2007; Peltier et al., 2007a),and of the Po Valley in Italy (Crosier et al., 2007). The factthat similar asymptotic values are observed despite lowerbiogenic emissions being added to anthropogenic pollution
P. F. DeCarlo et al.: Aerosol size and chemistry measurements during MILAGRO 4037
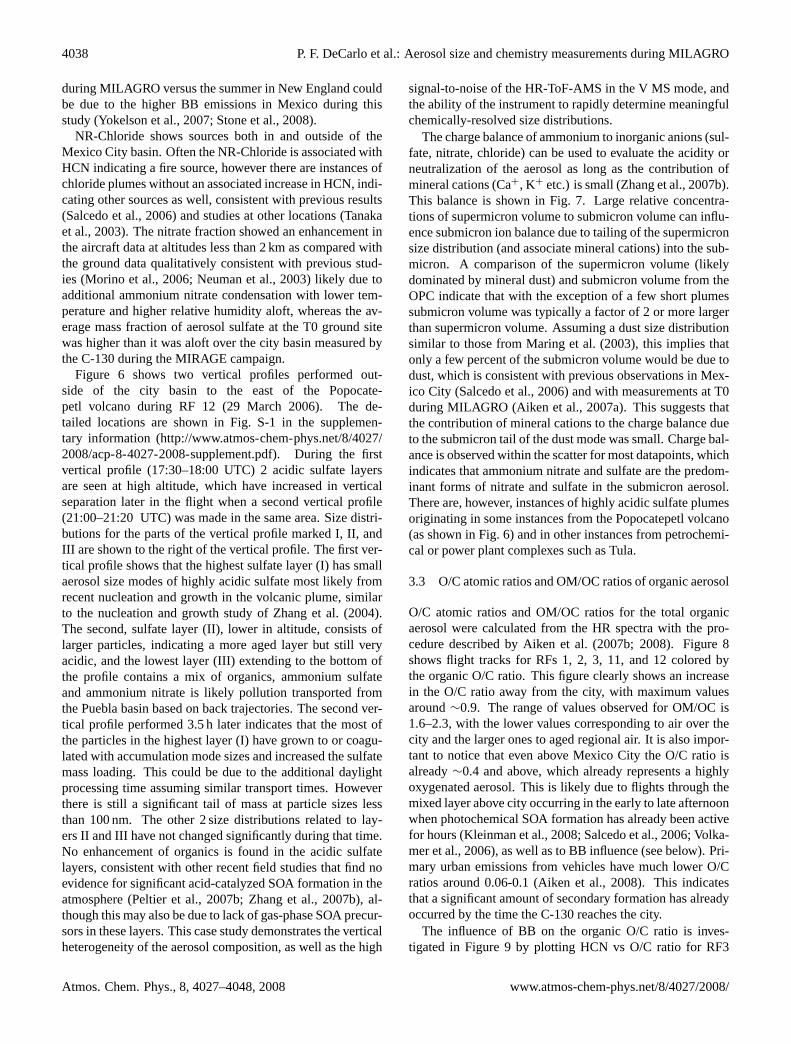
Fig. 6. Vertical profiles east of the Popocatepetl volcano for 2 different times during Research Flight 12. For both profiles the lowest pointcorresponds to an altitude∼300 m above the ground, and the locations of the profiles are shown in Figure S-1 in the supp. info. The firstprofile took place from 17:34–18:02 UTC at 19.29 N and−97.63 W. The second profile took place from 21:02–21:19 UTC at 19.23 N and−97.8 W. Two elevated acidic sulfate layers are clearly seen on both profiles. See text for further description.
4038 P. F. DeCarlo et al.: Aerosol size and chemistry measurements during MILAGRO
during MILAGRO versus the summer in New England couldbe due to the higher BB emissions in Mexico during thisstudy (Yokelson et al., 2007; Stone et al., 2008).
NR-Chloride shows sources both in and outside of theMexico City basin. Often the NR-Chloride is associated withHCN indicating a fire source, however there are instances ofchloride plumes without an associated increase in HCN, indi-cating other sources as well, consistent with previous results(Salcedo et al., 2006) and studies at other locations (Tanakaet al., 2003). The nitrate fraction showed an enhancement inthe aircraft data at altitudes less than 2 km as compared withthe ground data qualitatively consistent with previous stud-ies (Morino et al., 2006; Neuman et al., 2003) likely due toadditional ammonium nitrate condensation with lower tem-perature and higher relative humidity aloft, whereas the av-erage mass fraction of aerosol sulfate at the T0 ground sitewas higher than it was aloft over the city basin measured bythe C-130 during the MIRAGE campaign.
Figure 6 shows two vertical profiles performed out-side of the city basin to the east of the Popocate-petl volcano during RF 12 (29 March 2006). The de-tailed locations are shown in Fig. S-1 in the supplemen-tary information (http://www.atmos-chem-phys.net/8/4027/2008/acp-8-4027-2008-supplement.pdf). During the firstvertical profile (17:30–18:00 UTC) 2 acidic sulfate layersare seen at high altitude, which have increased in verticalseparation later in the flight when a second vertical profile(21:00–21:20 UTC) was made in the same area. Size distri-butions for the parts of the vertical profile marked I, II, andIII are shown to the right of the vertical profile. The first ver-tical profile shows that the highest sulfate layer (I) has smallaerosol size modes of highly acidic sulfate most likely fromrecent nucleation and growth in the volcanic plume, similarto the nucleation and growth study of Zhang et al. (2004).The second, sulfate layer (II), lower in altitude, consists oflarger particles, indicating a more aged layer but still veryacidic, and the lowest layer (III) extending to the bottom ofthe profile contains a mix of organics, ammonium sulfateand ammonium nitrate is likely pollution transported fromthe Puebla basin based on back trajectories. The second ver-tical profile performed 3.5 h later indicates that the most ofthe particles in the highest layer (I) have grown to or coagu-lated with accumulation mode sizes and increased the sulfatemass loading. This could be due to the additional daylightprocessing time assuming similar transport times. Howeverthere is still a significant tail of mass at particle sizes lessthan 100 nm. The other 2 size distributions related to lay-ers II and III have not changed significantly during that time.No enhancement of organics is found in the acidic sulfatelayers, consistent with other recent field studies that find noevidence for significant acid-catalyzed SOA formation in theatmosphere (Peltier et al., 2007b; Zhang et al., 2007b), al-though this may also be due to lack of gas-phase SOA precur-sors in these layers. This case study demonstrates the verticalheterogeneity of the aerosol composition, as well as the high
signal-to-noise of the HR-ToF-AMS in the V MS mode, andthe ability of the instrument to rapidly determine meaningfulchemically-resolved size distributions.
The charge balance of ammonium to inorganic anions (sul-fate, nitrate, chloride) can be used to evaluate the acidity orneutralization of the aerosol as long as the contribution ofmineral cations (Ca+, K+ etc.) is small (Zhang et al., 2007b).This balance is shown in Fig. 7. Large relative concentra-tions of supermicron volume to submicron volume can influ-ence submicron ion balance due to tailing of the supermicronsize distribution (and associate mineral cations) into the sub-micron. A comparison of the supermicron volume (likelydominated by mineral dust) and submicron volume from theOPC indicate that with the exception of a few short plumessubmicron volume was typically a factor of 2 or more largerthan supermicron volume. Assuming a dust size distributionsimilar to those from Maring et al. (2003), this implies thatonly a few percent of the submicron volume would be due todust, which is consistent with previous observations in Mex-ico City (Salcedo et al., 2006) and with measurements at T0during MILAGRO (Aiken et al., 2007a). This suggests thatthe contribution of mineral cations to the charge balance dueto the submicron tail of the dust mode was small. Charge bal-ance is observed within the scatter for most datapoints, whichindicates that ammonium nitrate and sulfate are the predom-inant forms of nitrate and sulfate in the submicron aerosol.There are, however, instances of highly acidic sulfate plumesoriginating in some instances from the Popocatepetl volcano(as shown in Fig. 6) and in other instances from petrochemi-cal or power plant complexes such as Tula.
3.3 O/C atomic ratios and OM/OC ratios of organic aerosol
O/C atomic ratios and OM/OC ratios for the total organicaerosol were calculated from the HR spectra with the pro-cedure described by Aiken et al. (2007b; 2008). Figure 8shows flight tracks for RFs 1, 2, 3, 11, and 12 colored bythe organic O/C ratio. This figure clearly shows an increasein the O/C ratio away from the city, with maximum valuesaround∼0.9. The range of values observed for OM/OC is1.6–2.3, with the lower values corresponding to air over thecity and the larger ones to aged regional air. It is also impor-tant to notice that even above Mexico City the O/C ratio isalready∼0.4 and above, which already represents a highlyoxygenated aerosol. This is likely due to flights through themixed layer above city occurring in the early to late afternoonwhen photochemical SOA formation has already been activefor hours (Kleinman et al., 2008; Salcedo et al., 2006; Volka-mer et al., 2006), as well as to BB influence (see below). Pri-mary urban emissions from vehicles have much lower O/Cratios around 0.06-0.1 (Aiken et al., 2008). This indicatesthat a significant amount of secondary formation has alreadyoccurred by the time the C-130 reaches the city.
The influence of BB on the organic O/C ratio is inves-tigated in Figure 9 by plotting HCN vs O/C ratio for RF3
P. F. DeCarlo et al.: Aerosol size and chemistry measurements during MILAGRO 4039
Fig. 7. Scatter plot of measured ammonium versus the amountneeded to fully neutralize the measured submicron nitrate, sulfate,and chloride. Dashed line is the 1:1 line. Points below the line arenominally acidic, while points above the line are nominally basic.
(10 March 2006) which included high concentrations of BBaerosol over the Mexico City basin. Using a concentrationof 1000 pptv or greater of HCN as an indicator of fresh BBplumes, the O/C range for primary biomass burning OA (P-BBOA) is estimated as 0.3–0.45, which are similar to thevalues observed in laboratory BB experiments (Aiken et al.,2008; Huffman et al., 2008a3). The range of values may bedue to both residence time in the atmosphere (SOA forma-tion, oxidation, and/or volatile evaporation due to dilution)and/or inherent variability in biomass burning plumes fromdifferences in the vegetation burned and fire conditions (e.g.smoldering vs. flaming). Only a few plumes were sampled,consequently the range of values may be broader than whatis given here, but this is useful as an indicator of approximateO/C ratios for biomass burning.
From Fig. 8 it is clear that organic O/C ratios increase sig-nificantly away from the city, with distance being a proxyfor the age of the aerosol; i.e. aerosol outside the city canhave a city origin and have been aged during transport, or aregional non-city origin. Regional air typically shows agedcharacteristics due to the longer average residence time ofthe OA sampled in the regional air (Zhang et al., 2005b,2005c). Since thermodynamics drives atmospheric organicstowards increased oxidation, the increase in the organic O/Cratio is indicative of aging of the aerosol, and in the absence
3Huffman, J. A., Aiken, A. C., Docherty, K. S., Ulbrich, I. M.,DeCarlo, P. F., Jayne, J. T., Onasch, T. B., Trimborn, A., Worsnop,D. R., Ziemann, P. J., and Jimenez, J. L.: Volatility of primary andsecondary organic aerosols in the field contradicts current modelrepresentations, Environ. Sci. Technol., submitted, 2008a.
Fig. 8. Flight tracks for RFs 1, 2, 3, 11, and 12 colored by theorganic O/C atomic ratio. RFs 9 and 10 were excluded from thisplot since there was no city component of these flights. Only datapoints with OA concentrations greater than 2µg m−3 are shown,to reduce the effect of noise on the O/C calculation. The organicaerosol is clearly more oxidized away from the dominant source inthe region, the Mexico City basin. Box indicates the Mexico Cityurban area.
Fig. 9. O/C atomic ratio for OA vs HCN for RF 3 10 March 2006.Intense fire plumes are indicated by HCN concentrations exceeding1000 pptv, and show an O/C ratio of BBOA ranging between 0.3and 0.45.
of calibration or kinetic modeling, it is a qualitative indi-cator of photochemical age. Recent results by Huffman etal. (2008a)3 indicate that SOA in Mexico City is less volatilethan urban POA and most P-BBOA, so some of the increasein the O/C ratio in the regional scale may be due to evap-oration losses of more reduced species. This is likely notthe dominant effect since primary O/C ratios are low for ur-ban combustion emissions, and around 0.4 for biomass burn-ing plumes, and to reach O/C ratios of 0.6–0.8, addition of
4040 P. F. DeCarlo et al.: Aerosol size and chemistry measurements during MILAGRO
Fig. 10. Relationship between−log10(NOx/NOy) and O/C atomicratio of organic aerosols during RF12 (29 March 2006). Clear cor-relation between these 2 indicates that O/C of OA increases withphotochemical age. Data points marked with crosses are likely im-pacted by aged petrochemical emissions and are not representativeof urban outflow and are excluded from the fit.
SOA of higher O/C ratios, or heterogeneous oxidation of theaerosol need to occur. However, heterogeneous oxidation ofthe emitted primary aerosols cannot explain the large massof SOA rapidly formed. Also, heterogeneous oxidation pro-ceeds with longer timescales of the order of 1 week or longer(Molina et al., 2004; Murphy et al., 2007; Schauer et al.,1996; Zhang et al., 2005a). An order-of-magnitude calcula-tion (see Appendix 1) comparing the gain of O observed inFig. 8 vs. an upper limit of what could be expected from OHheterogeneous oxidation shows that heterogeneous oxidationis expected to be too slow by a factor of∼7–135 to explainthe rate of O increase observed here, i.e. only∼0.7–14% ofthe increase in O/C can be explained by heterogeneous re-actions. This is consistent with the results of the only studyof heterogeneous aging on ambient particles to date (Georgeet al., 2008), which observed a gain of O/C (estimated fromtheir results and the correlation ofm/z 44/OA and O/C ofAiken et al. (2008)) about 11 times slower than than ob-served here. As SOA formation has a timescale around 1day (de Gouw et al., 2005; Peltier et al., 2007a), additionalSOA formation (from urban and BB precursors) or additionalgas-phase oxidation of semivolatile SOA species are the mostlikely reasons for the observed increase in O/C. Downwindof the city basin the increase in the O/C ratio while OA/COstays approximately constant implies that there is a loss oforganic carbon from the OA (e.g. by evaporation upon dilu-tion), since the addition of oxygen to the OA without subse-quent loss of organic carbon would increase the OA/CO ra-tio, but this is not observed. Significant loss of carbon due toheterogeneous reactions is unlikely, given the constraint pro-vided by Murphy et al. (2007). These authors observed the
timescale of this process to be of the order of several monthsfor tropospheric accumulation mode particles (dominated bysulfate and organics, very likely OOA) in the lower strato-sphere despite high oxidant levels. High rates of carbon lossdue to heterogeneous reactions have only been reported inthe laboratory for very reduced particle compositions whichare not representative of atmospheric OOA (e.g. Molina etal., 2004) and were only observed for equivalent aging timeslonger than 9 days when oxidizing ambient particles in thelaboratory (George et al., 2008).
Another qualitative measure of photochemical age is the−log10(NOx/NOy) ratio (Kleinman et al., 2007). This andother such ratios work best if there is an isolated sourceor source region, which does not mix with other sourcesfrom emission to the time of sampling. This can be a prob-lem when using this ratio when urban pollution mixes withfire plumes, as fire plumes from the pine forests near Mex-ico City had high NOx emissions (Yokelson et al., 2007).When air from different sources mixes this photochemicalclock is “reset” losing information on the age of pollutionfrom both sources. For this reason we compared the organicO/C atomic ratio to the−log10(NOx/NOy) from RF 12 (29March 2006), when biomass burning was low, and gas phasedata of HCN and CO did not indicate recent biomass burn-ing influence. Figure 10 shows a comparison between the−log10(NOx/NOy) ratio and the O/C ratio. There is a cleartrend which shows the increase in the−log10(NOx/NOy) ra-tio with increasing O/C ratio, indicating that this is a goodqualitative clock for photochemical age. The x-interceptof the regression occurs at approximately an O/C ratio of0.52. The lowest values of the O/C ratio were found at al-titudes of ∼2900 m (a.s.l.) during a transect through theMexico City basin around 20:20 UTC (14:30 local), whichwas clearly dominated by pollution sources. The reason forthis high value is potentially due to the C-130 arrival intothe city in the mid afternoon, by which time a significantfraction of the total SOA formation has already occurred.The −log10(NOx/NOy) clock can also be “reset” by mix-ing fresh high NOx plumes with older pollution. Since sec-ondary OA mass rapidly exceeds primary OA the mixing ofa fresh plume with low concentrations of OA (and low O/C)would only minimally affect the O/C ratio which would bedominated by the higher O/C ratio of the secondary OA. Thegroup of points above the value of 1.5 for−log10(NOx/NOy)come from a leg of the flight at 18.67 N from 95.88 to95.16 W longitude, just inland from the Gulf of Mexico andin the vicinity of petrochemical refineries and processing fa-cilities. It is likely that the relationship of−log10(NOx/NOy)to O/C atomic ratio for this section of the flight is more in-dicative of an aged industrial plume than an urban plume.
3.4 Case study: research flight 2, 8 March 2006
RF 2 provides the opportunity to combine the analysistechniques discussed above into a detailed picture of the
P. F. DeCarlo et al.: Aerosol size and chemistry measurements during MILAGRO 4041
Fig. 11.Time traces of different pollutants and ratios for RF 2 (8 March 2006) Part(a) shows the OA/CO ratio, and aircraft altitude. Part(b)shows the O/C atomic ratio and OM/OC ratio. Part(c) shows time traces of NR-PM1 Organic and Chloride aerosol with the fire contributionof m/z 60 calculated as: m/z 60–0.003∗Organic (see text for explanation), and gas phase HCN. Part(d) shows timetraces of NR-PM1 Organicand Nitrate in the aerosol phase and CO in the gas phase. Periods marked I and III show times when the aerosol was dominated by urbanpollution, and period II indicates a time when the aerosol was heavily influence by fire emissions. Part(e) shows the contribution in percentof CO emitted from sources in Mexico City based on the emissions and transport from the MOZART model for the flight day and each ofthe previous 6 days. Parts(f)–(i) show size distributions for different parts of the flight as labeled on the figures. All size distributions weresubject to 2 point binomial smoothing to reduce high-frequency noise.
4042 P. F. DeCarlo et al.: Aerosol size and chemistry measurements during MILAGRO
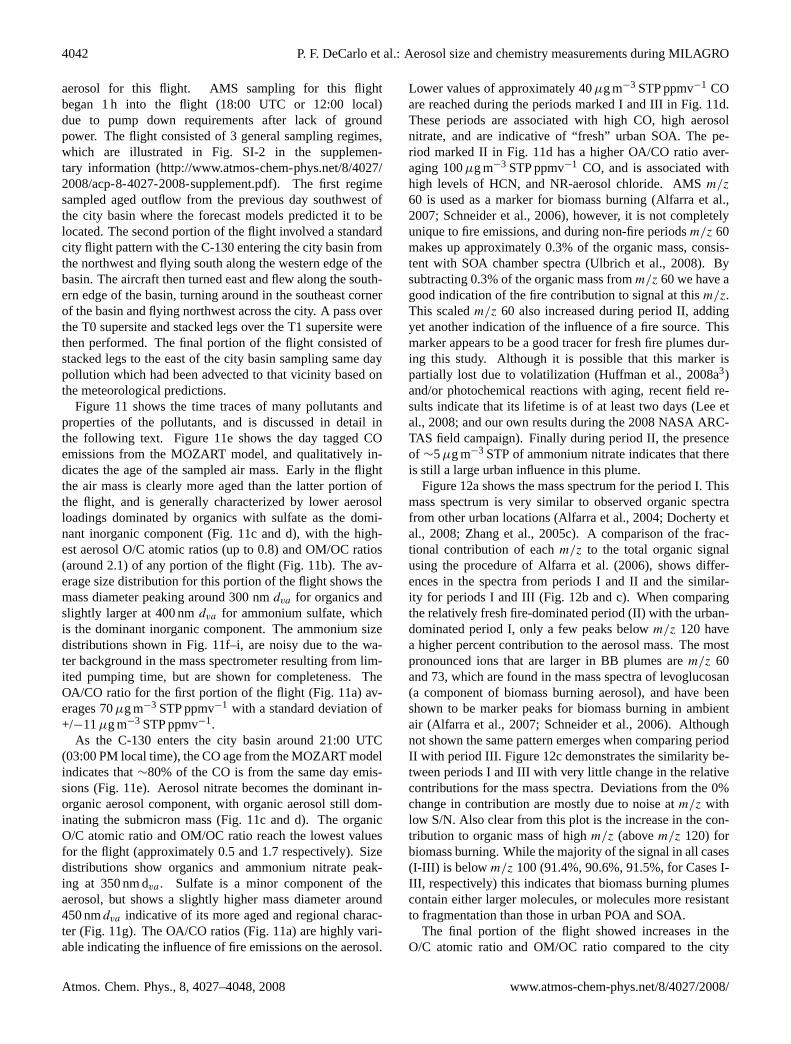
aerosol for this flight. AMS sampling for this flightbegan 1 h into the flight (18:00 UTC or 12:00 local)due to pump down requirements after lack of groundpower. The flight consisted of 3 general sampling regimes,which are illustrated in Fig. SI-2 in the supplemen-tary information (http://www.atmos-chem-phys.net/8/4027/2008/acp-8-4027-2008-supplement.pdf). The first regimesampled aged outflow from the previous day southwest ofthe city basin where the forecast models predicted it to belocated. The second portion of the flight involved a standardcity flight pattern with the C-130 entering the city basin fromthe northwest and flying south along the western edge of thebasin. The aircraft then turned east and flew along the south-ern edge of the basin, turning around in the southeast cornerof the basin and flying northwest across the city. A pass overthe T0 supersite and stacked legs over the T1 supersite werethen performed. The final portion of the flight consisted ofstacked legs to the east of the city basin sampling same daypollution which had been advected to that vicinity based onthe meteorological predictions.
Figure 11 shows the time traces of many pollutants andproperties of the pollutants, and is discussed in detail inthe following text. Figure 11e shows the day tagged COemissions from the MOZART model, and qualitatively in-dicates the age of the sampled air mass. Early in the flightthe air mass is clearly more aged than the latter portion ofthe flight, and is generally characterized by lower aerosolloadings dominated by organics with sulfate as the domi-nant inorganic component (Fig. 11c and d), with the high-est aerosol O/C atomic ratios (up to 0.8) and OM/OC ratios(around 2.1) of any portion of the flight (Fig. 11b). The av-erage size distribution for this portion of the flight shows themass diameter peaking around 300 nmdva for organics andslightly larger at 400 nmdva for ammonium sulfate, whichis the dominant inorganic component. The ammonium sizedistributions shown in Fig. 11f–i, are noisy due to the wa-ter background in the mass spectrometer resulting from lim-ited pumping time, but are shown for completeness. TheOA/CO ratio for the first portion of the flight (Fig. 11a) av-erages 70µg m−3 STP ppmv−1 with a standard deviation of+/−11µg m−3 STP ppmv−1.
As the C-130 enters the city basin around 21:00 UTC(03:00 PM local time), the CO age from the MOZART modelindicates that∼80% of the CO is from the same day emis-sions (Fig. 11e). Aerosol nitrate becomes the dominant in-organic aerosol component, with organic aerosol still dom-inating the submicron mass (Fig. 11c and d). The organicO/C atomic ratio and OM/OC ratio reach the lowest valuesfor the flight (approximately 0.5 and 1.7 respectively). Sizedistributions show organics and ammonium nitrate peak-ing at 350 nm dva . Sulfate is a minor component of theaerosol, but shows a slightly higher mass diameter around450 nmdva indicative of its more aged and regional charac-ter (Fig. 11g). The OA/CO ratios (Fig. 11a) are highly vari-able indicating the influence of fire emissions on the aerosol.
Lower values of approximately 40µg m−3 STP ppmv−1 COare reached during the periods marked I and III in Fig. 11d.These periods are associated with high CO, high aerosolnitrate, and are indicative of “fresh” urban SOA. The pe-riod marked II in Fig. 11d has a higher OA/CO ratio aver-aging 100µg m−3 STP ppmv−1 CO, and is associated withhigh levels of HCN, and NR-aerosol chloride. AMSm/z
60 is used as a marker for biomass burning (Alfarra et al.,2007; Schneider et al., 2006), however, it is not completelyunique to fire emissions, and during non-fire periodsm/z 60makes up approximately 0.3% of the organic mass, consis-tent with SOA chamber spectra (Ulbrich et al., 2008). Bysubtracting 0.3% of the organic mass fromm/z 60 we have agood indication of the fire contribution to signal at thism/z.This scaledm/z 60 also increased during period II, addingyet another indication of the influence of a fire source. Thismarker appears to be a good tracer for fresh fire plumes dur-ing this study. Although it is possible that this marker ispartially lost due to volatilization (Huffman et al., 2008a3)and/or photochemical reactions with aging, recent field re-sults indicate that its lifetime is of at least two days (Lee etal., 2008; and our own results during the 2008 NASA ARC-TAS field campaign). Finally during period II, the presenceof ∼5µg m−3 STP of ammonium nitrate indicates that thereis still a large urban influence in this plume.
Figure 12a shows the mass spectrum for the period I. Thismass spectrum is very similar to observed organic spectrafrom other urban locations (Alfarra et al., 2004; Docherty etal., 2008; Zhang et al., 2005c). A comparison of the frac-tional contribution of eachm/z to the total organic signalusing the procedure of Alfarra et al. (2006), shows differ-ences in the spectra from periods I and II and the similar-ity for periods I and III (Fig. 12b and c). When comparingthe relatively fresh fire-dominated period (II) with the urban-dominated period I, only a few peaks belowm/z 120 havea higher percent contribution to the aerosol mass. The mostpronounced ions that are larger in BB plumes arem/z 60and 73, which are found in the mass spectra of levoglucosan(a component of biomass burning aerosol), and have beenshown to be marker peaks for biomass burning in ambientair (Alfarra et al., 2007; Schneider et al., 2006). Althoughnot shown the same pattern emerges when comparing periodII with period III. Figure 12c demonstrates the similarity be-tween periods I and III with very little change in the relativecontributions for the mass spectra. Deviations from the 0%change in contribution are mostly due to noise atm/z withlow S/N. Also clear from this plot is the increase in the con-tribution to organic mass of highm/z (abovem/z 120) forbiomass burning. While the majority of the signal in all cases(I-III) is below m/z 100 (91.4%, 90.6%, 91.5%, for Cases I-III, respectively) this indicates that biomass burning plumescontain either larger molecules, or molecules more resistantto fragmentation than those in urban POA and SOA.
The final portion of the flight showed increases in theO/C atomic ratio and OM/OC ratio compared to the city
P. F. DeCarlo et al.: Aerosol size and chemistry measurements during MILAGRO 4043
(Fig. 11b), but these variables did not increase to the lev-els seen in the aged outflow from the early part of the flight,consistent with the lower average age of the air predictedby MOZART. This part of the flight also included some ad-vected fire plumes indicated by increases in the OA/CO ratio(up to 250µg m−3STP ppmv−1), HCN, NR-chloride, andm/z 60 (Fig. 11b and c). Size distributions for the periodmarked same day outflow (OF), and fire plume are shown inFig. 11h and i. The same day outflow size distribution showsa clear drop in aerosol nitrate from the city plume, reducedimportance of ultrafine particles below 100 nm, and a peakin the distribution at 300 nmdva . The fire plume distributionshows the clear dominance of organics in the fire plume, andthe presence of nitrate in the size distribution suggests thatthe fire plume is adding to the urban pollution, although someof the nitrate may also originate from fire emissions. Themass size distribution for the fire plume peaks at a slightlysmaller size of 250 nmdva .
4 Conclusions
A HR-ToF-AMS was flown for the first time during theMILAGRO campaign. The performance of the instrumentwas very good, providing 12-s quantitative aerosol size andchemistry data. Comparisons between submicron volumefrom a SMPS, and light scattering confirm the quantificationof the AMS data. Organic species dominated the submicronaerosol both near the source and in the outflow and regionalair. Inorganic components also made a large contribution,with different species showing different spatial characteris-tics. Aerosol sulfate had a more regional but still some-what structured character with clear volcanic and petrochem-ical/power plant sources. Submicron nitrate showed a strongcity source and a high correlation with CO that links it tourban emissions. The higher source strength of NH3 in thecity versus the fires may explain the preferential formationof nitrate in city air, given the comparable NOx emissionsof both sources. Ammonium was associated with nitrate andsulfate, indicating the dominant forms of these species wereammonium nitrate and ammonium sulfate respectively. NR-aerosol chloride was often associated with HCN indicatinga fire source, although some chloride plumes did not showthis correlation, indicating other sources of NR chloride. Or-ganic aerosol had strong correlations with both CO and HCNindicating both urban and biomass burning sources. The or-ganic O/C atomic ratio showed more reduced aerosol nearthe city/source regions and higher values farther from thecity. O/C was also shown to be a qualitative photochem-ical clock by comparison to –log10(NOx /NOy). SOA for-mation from urban sources quickly overwhelms urban POAemissions as shown by the increase of the O/C ratio to valuesmuch larger than those of urban POA, and consistent with theresults of Volkamer et al. (2006) and Kleinman et al. (2008).A case study of the 8-March-06 research flight illustrates the
Fig. 12. Part (a) shows the organic mass spectrum for the periodmarked I in Fig. 11. Part(b) shows the percent change in contri-bution to the total organic signal between the biomass and urban-dominated cases, I and II. Part(c) shows the percentage change be-tween the 2 urban-dominated periods I and III. The minimal changehere indicates the similarity between these 2 periods. The proce-dure for this plot follows Alfarra et al. (2006): each mass spectrumis normalized to sum to 1. Then the difference in signal for eachion of 2 spectra is calculated, and then divided by one of the spectraand displayed as a percentage.
conclusions above, and indicates that in the AMS mass spec-tra of BBOA the largerm/z fragments are enhanced, and thatm/z 60 andm/z 73 are good marker peaks for biomass burn-ing aerosol in this study.
Appendix A
This appendix details the calculation of the estimated uptakeof oxygen by the organic aerosol during photochemical aging(Fig. 10) by heterogeneous reactions, and compares it to theexperimentally observed gain of oxygen.
The mode of the organic aerosol mass distribution is cho-sen as the typical size. Smaller particles would gain oxygen
4044 P. F. DeCarlo et al.: Aerosol size and chemistry measurements during MILAGRO
faster while larger particles would gain oxygen more slowlythan in the calculation shown here. Using the peak of themass distribution from Figs. 6 and 11 in vacuum aerody-namic diameter (dva , measured by the AMS), assuming par-ticle sphericity, and estimating the average material density(ρp) from the measured AMS components (DeCarlo et al.,2004), we find a volume equivalent diameter (dve) of 230 nm.
The organic mass (OM) of a particle of this size can becalculated using Eq. A1:
OM =π
6d3veρpMForg (A1)
whereMForg is the mass fraction of organics species in theparticle. Assuming 60% for the mass fraction of the organ-ics from Figure 3, and an estimatedρp of 1.43 g cm−3 (seeSect. 2), theOM of the assumed particle is 5.45×10⁻¹⁸ kg(i.e. 5.45 fg). Assuming that the organic mass and size ofthis particle remains constant during aging, the mass of oxy-gen in all of the organic species in the particle (Omass) can becalculated using Eq. A2:
Omass=OM
OM/OC· O/C ·
16
12(A2)
whereOM/OCis the Organic-Mass-to-Organic-Carbon ratio,O/C is the atomic oxygen to carbon ratio (both estimatedfrom the high-resolution AMS data), and 16/12 is used toconvert the O/C atomic ratio into an O/C mass ratio. Usingthe O/C atomic ratios of 0.55 and 0.85 from Fig. 8, and thecorresponding OM/OC ratios of 1.87 and 2.25, respectively(Aiken et al., 2008), the oxygen mass in the particle at the be-ginning is 2.13×10⁻¹⁸ kg and increases to 2.74×10⁻¹⁸ kg.This indicates a gain of 6.10×10⁻¹⁹ kg of oxygen in the par-ticle, or 2.30×10⁷ atoms of oxygen during this aging process.
The uptake of oxygen by heterogeneous reaction can beestimated assuming an uptake coefficient (γ ) due to reactionwith OH. γ =1 is used as an upper limit. Howeverγ is likelylower for highly oxygenated OA with an O/C ratio>0.55 sothe calculations are also carried out withγ =0.1. The esti-mated 24-h average OH concentration around Mexico Cityis 1.46×10⁶ (C. Cantrell, NCAR, personal communication,2008). From kinetic theory the average molecular speed ofOH speed,c, is 600 m s−1. A correction factor,α, of 0.9 isused to account for the diffusion limitation to mass transfer,assuming a pressure of 0.5 atm (Seinfeld and Pandis, 1998,Fig. 11.2). The number of OH collisions with the particlesurface,COH , can then be estimated as:
COH = αγ c
4· πd2
ve [OH ] 1t (A3)
where 1t is the aging time of 24 h, estimated from thechange in the−log(NOx/NOy) ratio from Fig. 8. The re-sult of the calculation is 2.82×10⁶ collisions with OH. Weassume that the surface is 60% organic (same as the massfraction) which results in 1.69×10⁶ collisions of OH with an
organic molecule a the surface. If it is assumed that eachsuccessful collision results in the addition of between 1 and2 oxygen atoms to the aerosol organic material, then aγ of1 implies the uptake of 1.69–3.39×10⁶ O atoms in a 24 h pe-riod. A γ of 0.1 implies the uptake of 1.69–3.39×10⁵ oxygenatoms in 24 h. These values range between 7 and 135 timestoo small to explain the increase in oxygen content calculatedfrom the increased O/C ratio over the same 24 h time period.
Acknowledgements.We are grateful to the NCAR RAF and C-130personnel for much help and guidance during integration andresearch flights, especially A. Schanot, P. Romashkin, and M. Lord.We thank R. Bahreini, C. Simmons, and A. Middlebrook of NOAAfor help with integration and the PCI. We thank C. Brock ofNOAA for providing Mie Scattering code in the Igor programminglanguage. We are also grateful to the rest of the C-130 investigatorsand the Jimenez group for many helpful discussions. This studywas supported by grants NSF ATM-0513116, ATM-0528634,and ATM-0449815, NASA NNG04GA67G and NNG06GB03G,UCAR/NSF S05-39607, and by EPA fellowship FP-91650801 (toPFD) and NASA fellowship NNG04GR06H (to ACA).
Edited by: S. Madronich
References
Aiken, A. C., Cubison, M. J., Huffman, J. A., DeCarlo, P. F., Ul-brich, I., Docherty, K., Sueper, D. T., and Jimenez, J. L.: OrganicAerosol Analysis with the Aerodyne High Resolution Time-ofFlight Aerosol Mass Spectrometer (HR-ToF-AMS) at T0 in Mex-ico City during MILAGRO / MCMA-2006, American Associa-tion of Aerosol Research, Reno, NV, 2007a.
Aiken, A. C., DeCarlo, P. F., and Jimenez, J. L.: Elemental Analy-sis of Organic Species with Electron Ionization High-ResolutionMass Spectrometry, Anal. Chem., 79, 8350–8358, 2007b.
Aiken, A. C., DeCarlo, P. F., Kroll, J. H., Worsnop, D. R., Huffman,J. A., Docherty, K. S., Ulbrich, I. M., Mohr, C., Kimmel, J. R.,Sueper, D., Sun, Y., Zhang, Q., Trimborn, A. M., Northway, M.,Ziemann, P. J., Canagaratna, M. R., Onasch, T. B., Alfarra, M.R., Prevot, A. S. H., Dommen, J., Duplissy, J., Metzger, A., Bal-tensperger, U., and Jimenez, J. L.: O/C and OM/OC Ratios ofPrimary, Secondary, and Ambient Organic Aerosols with High-Resolution Time-of-Flight Aerosol Mass Spectrometry, Environ.Sci. Technol., 42, 4478–4485, 2008.
Alfarra, M. R., Coe, H., Allan, J. D., Bower, K. N., Boudries, H.,Canagaratna, M. R., Jimenez, J. L., Jayne, J. T., Garforth, A. A.,Li, S. M., and Worsnop, D. R.: Characterization of urban and ru-ral organic particulate in the lower Fraser valley using two aero-dyne aerosol mass spectrometers, Atmos. Environ., 38, 5745–5758, 2004.
Alfarra, M. R., Paulsen, D., Gysel, M., Garforth, A. A., Dommen,J., Prevot, A. S. H., Worsnop, D. R., Baltensperger, U., and Coe,H.: A mass spectrometric study of secondary organic aerosolsformed from the photooxidation of anthropogenic and biogenicprecursors in a reaction chamber, Atmos. Chem. Phys. Discuss.,6, 7747–7789, 2006,http://www.atmos-chem-phys-discuss.net/6/7747/2006/.
P. F. DeCarlo et al.: Aerosol size and chemistry measurements during MILAGRO 4045
Alfarra, M. R., Prevot, A. S. H., Szidat, S., Sandradewi, J., Weimer,S., Lanz, V. A., Schreiber, D., Mohr, M., and Baltensperger,U.: Identification of the Mass Spectral Signature of OrganicAerosols from Wood Burning Emissions, Environ. Sci. Technol.,41, 5770–5777, 2007.
Allan, J. D., Alfarra, M. R., Bower, K. N., Williams, P. I., Gal-lagher, M. W., Jimenez, J. L., McDonald, A. G., Nemitz, E.,Canagaratna, M. R., Jayne, J. T., Coe, H., and Worsnop, D. R.:Quantitative Sampling Using an Aerodyne Aerosol Mass Spec-trometer: 2. Measurements of Fine Particulate Chemical Com-position in Two UK Cities, J. Geophys. Res.-Atmos., 108(D9),4091, doi:10:1029/2002JD002359, 2003.
Allan, J. D., Delia, A. E., Coe, H., Bower, K. N., Alfarra, M. R.,Jimenez, J. L., Middlebrook, A. M., Drewnick, F., Onasch, T. B.,Canagaratna, M. R., Jayne, J. T., and Worsnopf, D. R.: A gen-eralised method for the extraction of chemically resolved massspectra from aerodyne aerosol mass spectrometer data, J. AerosolSci., 35, 909–922, 2004.
Anderson, T. L., Covert, D. S., Marshall, S. F., Laucks, M. L.,Charlson, R. J., Waggoner, A. P., Ogren, J. A., Caldow, R.,Holm, R. L., Quant, F. R., Sem, G. J., Wiedensohler, A.,Ahlquist, N. A., and Bates, T. S.: Performance characteristicsof a high-sensitivity, three-wavelength, total scatter/backscatternephelometer, J. Atmos. Ocean. Tech., 13, 967–986, 1996.
Anderson, T. L. and Ogren, J. A.: Determining aerosol radiativeproperties using the TSI 3563 integrating nephelometer, AerosolSci. Tech., 29, 57–69, 1998.
Anderson, T. L., Masonis, S. J., Covert, D. S., Ahlquist, N. C., How-ell, S. G., Clarke, A. D., and McNaughton, C. S.: Variabilityof aerosol optical properties derived from in situ aircraft mea-surements during ACE-Asia, J. Geophys. Res., 108(D23), 8647,doi:8610.1029/2002JD003247, 2003.
Bahreini, R., Dunlea, E. J., Matthew, B. M., Simons, C., Docherty,K. S., DeCarlo, P. F., Brock, C. A., Jimenez, J. L., and Middle-brook, A. M.: Design and Operation of a Pressure Controlled In-let for Airborne Sampling with an Aerodyne Aerosol Mass Spec-trometer, Aerosol Sci. Tech., 42, 6, 465–471, 2008.
Bohren, C. F. and Huffman, D. R.: Absorption and scattering oflight by small particles, Wiley, New York, 530 pp., 1983.
Bravo, A. H., Sosa, E. R., Sanchez, A. P., Jaimes, P. M., and Saave-dra, R. M. I.: Impact of wildfires on the air quality of MexicoCity, 1992–1999, Environ. Pollut., 117, 243–253, 2002.
Bytnerowicz, A. and Fenn, M. E.: Nitrogen deposition in Californiaforests: A review, Environ. Pollut., 92, 127–146, 1996.
Canagaratna, M. R., Jayne, J. T., Jimenez, J. L., Allan, J. D., Al-farra, M. R., Zhang, Q., Onasch, T. B., Drewnick, F., Coe, H.,Middlebrook, A., Delia, A., Williams, L. R., Trimborn, A. M.,Northway, M. J., DeCarlo, P. F., Kolb, C. E., Davidovits, P., andWorsnop, D. R.: Chemical and Microphysical Characterizationof Ambient Aerosols with the Aerosol Mass Spectrometer, MassSpectrom. Rev., 26, 185–222, 2007.
Crosier, J., Allan, J. D., Coe, H., Bower, K. N., Forment, P., andWilliams, P. I.: Chemical composition of summertime aerosol inthe Po Valley (Italy), northern Adriatic and Black Sea, Q. J. Roy.Meteor. Soc., 133, 61–75, 2007.
Cross, E. S., Slowik, J. G., Davidovits, P., Allan, J. D., Worsnop, D.R., Jayne, J. T., Lewis, D. K., Canagaratna, M., and Onasch, T.B.: Laboratory and ambient particle density determinations usinglight scattering in conjunction with aerosol mass spectrometry,Aerosol Sci. Tech., 41, 343–359, 2007.
Crounse, J. D., McKinney, K. A., Kwan, A. J., and Wennberg, P.O.: Measurement of gas-phase hydroperoxides by chemical ion-ization mass spectrometry, Anal. Chem., 78, 6726–6732, 2006.
de Foy, B., Varela, J. R., Molina, L. T., and Molina, M. J.: Rapidventilation of the Mexico City basin and regional fate of the ur-ban plume, Atmos. Chem. Phys., 6, 2321–2335, 2006,http://www.atmos-chem-phys.net/6/2321/2006/.
de Foy, B., Lei, W., Zavala, M., Volkamer, R., Samuelsson, J., Mel-lqvist, J., Galle, B., Martinez, A. P., Grutter, M., Retama, A., andMolina, L. T.: Modelling constraints on the emission inventoryand on vertical dispersion for CO and SO2 in the Mexico CityMetropolitan Area using Solar FTIR and zenith sky UV spec-troscopy, Atmos. Chem. Phys., 7, 781–801, 2007,http://www.atmos-chem-phys.net/7/781/2007/.
de Foy, B., Fast, J. D., Paech, S. J., Phillips, D., Walters, J. T.,Coulter, R. L., Martin, T. J., Pekour, M. S., Shaw, W. J., Kasten-deuch, P. P., Marley, N. A., Retama, A., and Molina, L. T.: Basin-scale wind transport during the MILAGRO field campaign andcomparison to climatology using cluster analysis, Atmos. Chem.Phys., 8, 1209–1224, 2008,http://www.atmos-chem-phys.net/8/1209/2008/.
de Gouw, J. A., Middlebrook, A. M., Warneke, C., Goldan, P.D., Kuster, W. C., Roberts, J. M., Fehsenfeld, F. C., Worsnop,D. R., Canagaratna, M. R., Pszenny, A. A. P., Keene, W. C.,Marchewka, M., Bertman, S. B., and Bates, T. S.: Budget oforganic carbon in a polluted atmosphere: Results from the NewEngland Air Quality Study in 2002, J. Geophys. Res.-Atmos.,110, D16305, doi:10.1029/2004JD005623, 2005.
de Gouw, J. A., Brock, C. A., Atlas, E. L., Bates, T. S., Fehsen-feld, F. C., Goldan, P. D., Holloway, J. S., Kuster, W. C., Lerner,B. M., Matthew, B. M., Middlebrook, A. M., Onasch, T. B.,Peltier, R. E., Quinn, P. K., Senff, C. J., Stohl, A., Sullivan,A. P., Trainer, M., Warneke, C., Weber, R. J., and Williams,E. J.: Sources of Particulate Matter in the Northeastern UnitedStates: 1. Direct Emissions and Secondary Formation of Or-ganic Matter in Urban Plumes, J. Geophys. Res., 113, D08301,doi:08310.01029/02007JD009243, 2008.
DeCarlo, P., Slowik, J., Worsnop, D. R., Davidovits, P., andJimenez, J.: Particle Morphology and Density Characterizationby Combined Mobility and Aerodynamic Diameter Measure-ments. Part 1: Theory, Aerosol Sci. Tech., 38, 1185–1205, 2004.
DeCarlo, P. F., Kimmel, J. R., Trimborn, A., Northway, M. J., Jayne,J. T., Aiken, A. C., Gonin, M., Fuhrer, K., Horvath, T., Docherty,K. S., Worsnop, D. R., and Jimenez, J. L.: Field-deployable,high-resolution, time-of-flight aerosol mass spectrometer, Anal.Chem., 78, 8281–8289, 2006.
Docherty, K. S., Stone, E. A., Ulbrich, I. M., DeCarlo, P. F., Snyder,D. C., Schauer, J. J., Peltier, R. E., Weber, R. J., Murphy, S. M.,Seinfeld, J. H., Eatough, D. J., and Jimenez, J. L.: Apportion-ment of Primary and Secondary Organic Aerosols in SouthernCalifornia during the 2005 Study of Organic Aerosols in River-side (SOAR), Environ. Sci. Technol., in press, 2008.
4046 P. F. DeCarlo et al.: Aerosol size and chemistry measurements during MILAGRO
Drewnick, F., Hings, S. S., DeCarlo, P., Jayne, J. T., Gonin, M.,Fuhrer, K., Weimer, S., Jimenez, J. L., Demerjian, K. L., Bor-rmann, S., and Worsnop, D. R.: A new time-of-flight aerosolmass spectrometer (TOF-AMS) – Instrument description andfirst field deployment, Aerosol Sci. Tech., 39(7), 637–658, 2005.
Dunlea, E. J., DeCarlo, P. F., Kimmel, J. R., Aiken, A. C., Peltier,R., Weber, R., Tomlinson, J., Collins, D., Shinozuka, Y., Howell,S., Clarke, A., Emmons, L., Apel, E., Pfister, G., van Donke-laar, A., Millet, D., Heald, C. L., and Jimenez, J. L.: Observa-tions of Processed Asian Pollution with a High-Resolution Time-of-Flight Aerosol Mass Spectrometer (HR-ToF-AMS), Atmos.Chem. Phys. Discuss., in press, 2008.
Fast, J. D. and Zhong, S. Y.: Meteorological factors associated withinhomogeneous ozone concentrations within the Mexico Citybasin, J. Geophys. Res.-Atmos., 103, 18 927–18 946, 1998.
Fast, J. D., de Foy, B., Rosas, F. A., Caetano, E., Carmichael, G.,Emmons, L., McKenna, D., Mena, M., Skamarock, W., Tie, X.,Coulter, R. L., Barnard, J. C., Wiedinmyer, C., and Madronich,S.: A meteorological overview of the MILAGRO field cam-paigns, Atmos. Chem. Phys., 7, 2233–2257, 2007,http://www.atmos-chem-phys.net/7/2233/2007/.
Fountoukis, C., Nenes, A., Sullivan, A., Weber, R., VanReken, T.,Fischer, M., Matv?as, E., Moya, M., Farmer, D., and Cohen,R. C.: Thermodynamic characterization of Mexico City aerosolduring MILAGRO 2006, Atmos. Chem. Phys. Discuss., 7, 9203–9233, 2007,http://www.atmos-chem-phys-discuss.net/7/9203/2007/.
Gaffney, J. S., Marley, N. A., Sturchio, N. C., Heraty, L., Martinez,N., Hardy, K., and Guilderson, T.: Biogenic carbon dominancebased on 13C/12C and 14C measurements of total carbon at T-0 and T-1 sites during MILAGRO, The 88th Annual Meeting ofthe American Meteorological Society New Orleans, LA, 20–24January, abstract no. J1.1, 2008.
George, I. J., Slowik, J., and Abbatt, J. P. D.: Chemical ag-ing of ambient organic aerosol from heterogeneous reactionwith hydroxyl radicals, Geophys. Res. Lett., 35, L13811,doi:10.1029/2008GL033884, 2008.
Gerbig, C., Schmitgen, S., Kley, D., Volz-Thomas, A., Dewey,K., and Haaks, D.: An improved fast-response vacuum-UV res-onance fluorescence CO instrument, J. Geophys. Res.-Atmos.,104, 1699–1704, 1999.
Grutter, M., Basaldud, R., Rivera, C., Harig, R., Junkerman, W.,Caetano, E., and Delgado-Granados, H.: SO2 emissions fromPopocatpetl volcano: emission rates and plume imaging usingoptical remote sensing techniques, Atmos. Chem. Phys. Discuss.,8, 8119–8141, 2008,http://www.atmos-chem-phys-discuss.net/8/8119/2008/.
Gysel, M., Crosier, J., Topping, D. O., Whitehead, J. D., Bower, K.N., Cubison, M. J., Williams, P. I., Flynn, M. J., McFiggans, G.B., and Coe, H.: Closure study between chemical compositionand hygroscopic growth of aerosol particles during TORCH2,Atmos. Chem. Phys., 7, 6131–6144, 2007,http://www.atmos-chem-phys.net/7/6131/2007/.
Hand, J. L., Kreidenweis, S. M., Kreisberg, N., Hering, S., Stolzen-burg, M., Dick, W., and McMurry, P. H.: Comparisons ofAerosol Properties Measured by Impactors and Light Scatteringfrom Individual Particles: Refractive Index, Number and Vol-ume Concentrations, and Size Distributions, Atmos. Environ.,36, 1853–1861, 2002.
Heald, C. L., Jacob, D. J., Park, R. J., Russell, L. M., Hue-bert, B. J., Seinfeld, J. H., Liao, H., and Weber, R. J.:A large organic aerosol source in the free troposphere miss-ing from current models, Geophys. Res. Lett., 32, L18809,doi:10.1029/2005GL023831, 2005.
Heintzenberg, J., and Charlson, R. J.: Design and Applicationsof the Integrating Nephelometer: A Review, J. Atmos. Ocean.Tech., 13, 987–1000, 1996.
Huffman, J. A., Ziemann, P. J., Jayne, J. T., Worsnop, D.R., and Jimenez, J. L.: Development and Characterizationof a Fast-Stepping/Scanning Thermodenuder for Chemically-Resolved Aerosol Volatility Measurements, Aerosol Sci. Tech.,42, 395–407, 2008b.
IPCC: Climate Change 2007: The Scientific Basis. Contribution ofWorking Group I to the Fourth Assessment Report of the Inter-governmental Panel on Climate Change, edited by: Solomon,S., Qin, D., Manning, M., Marquis, M., Averyt, K., Tignor, M.M. B., Miller, H. L., and Chen, Z., Cambridge University Press,Cambridge, England, 2007.
Jayne, J. T., Leard, D. C., Zhang, X. F., Davidovits, P., Smith, K.A., Kolb, C. E., and Worsnop, D. R.: Development of an AerosolMass Spectrometer for Size and Composition Analysis of Sub-micron Particles, Aerosol Sci. Tech., 33, 49–70, 2000.
Jimenez, J. L., Jayne, J. T., Shi, Q., Kolb, C. E., Worsnop,D. R., Yourshaw, I., Seinfeld, J. H., Flagan, R. C., Zhang,X. F., Smith, K. A., Morris, J. W., and Davidovits, P.:Ambient Aerosol Sampling using the Aerodyne AerosolMass Spectrometer, J. Geophys. Res.-Atmos., 108(D7), 8425,doi:8410.1029/2001JD001213, 2003.
Johnson, D., Utembe, S. R., Jenkin, M. E., Derwent, R. G., Hay-man, G. D., Alfarra, M. R., Coe, H., and McFiggans, G.: Simu-lating regional scale secondary organic aerosol formation duringthe TORCH 2003 campaign in the southern UK, Atmos. Chem.Phys., 6, 403–418, 2006a,http://www.atmos-chem-phys.net/6/403/2006/.
Johnson, K. S., de Foy, B., Zuberi, B., Molina, L. T., Molina, M.J., Xie, Y., Laskin, A., and Shutthanandan, V.: Aerosol composi-tion and source apportionment in the Mexico City MetropolitanArea with PIXE/PESA/STIM and multivariate analysis, Atmos.Chem. Phys., 6, 4591–4600, 2006b,http://www.atmos-chem-phys.net/6/4591/2006/.
Kimmel, J., DeCarlo, P. F., Trimborn, A. M., Northway,M. J., Worsnop, D. R., and Jimenez, J. L.: QuantitativeTime-of-flight Mass Spectrometry of Aerosols Using aDigitally Thresholded Analog-to-Digital Converter, Amer-ican Society for Mass Spectrometry, Seattle, Washington,http://cires.colorado.edu/jimenez-group/ToFAMSResources/ToFManual/Docs/KimmelASMS 2006.pdf, 2006.
Kleinman, L. I., Daum, P. H., Lee, Y. N., Senum, G. I., Springston,S. R., Wang, J., Berkowitz, C., Hubbe, J., Zaveri, R. A., Brech-tel, F. J., Jayne, J., Onasch, T. B., and Worsnop, D.: Aircraftobservations of aerosol composition and ageing in New Englandand Mid-Atlantic States during the summer 2002 New EnglandAir Quality Study field campaign, J. Geophys. Res.-Atmos., 112,D09310, doi:10.1029/2006JD007786, 2007.
Kleinman, L. I., Springston, S. R., Daum, P. H., Lee, Y. N., Nun-nermacker, L. J., Senum, G. I., Wang, J., Weinstein-Lloyd, J.,Alexander, M. L., Hubbe, J., Ortega, J., Canagaratna, M. R., andJayne, J.: The time evolution of aerosol composition over the
P. F. DeCarlo et al.: Aerosol size and chemistry measurements during MILAGRO 4047
Mexico City plateau, Atmos. Chem. Phys., 8, 1559–1575, 2008,http://www.atmos-chem-phys.net/8/1559/2008/.
Lawrence, M. G., Butler, T. M., Steinkamp, J., Gurjar, B. R., andLelieveld, J.: Regional pollution potentials of megacities andother major population centers, Atmos. Chem. Phys., 7, 3969–3987, 2007,http://www.atmos-chem-phys.net/7/3969/2007/.
Lee, T., Sullivan, A. P., Collett, J. L., Kreidenweis, S. M., Jimenez,J. L., Onasch, T. B., Trimborn, A. M., Malm, W. C., Hao, W.M., and Wold, C.: Characterizing of the chemical properties ofbiomass combustion smoke using an aerosol mass spectrometer,Annual Conference of the Air and Waste Management Associa-tion, Portland, OR, 2008.
Madronich, S.: Chemical evolution of gaseous air pollutants down-wind of tropical megacities: Mexico City case study, Atmos. En-viron., 40, 6012–6018, 2006.
Maring, H., Savoie, D. L., Izaguirre, M. A., Custals, L., andReid, J. S.: Mineral dust aerosol size distribution changeduring atmospheric transport, J. Geophys. Res., 108, 8592,doi:8510.1029/2002JD002536, 2003.
McNaughton, C. S., Clarke, A. D., Howell, S. G., Pinkerton, M.,Anderson, B., Thornhill, L., Hudgins, C., Winstead, E., Dibb,J. E., Scheuer, E., and Maring, H.: Results from the DC-8 In-let Characterization Experiment (DICE): Airborne versus sur-face sampling of mineral dust and sea salt aerosols, Aerosol Sci.Tech., 41, 136–159, 2007.
Moffet, R. C., de Foy, B., Molina, L. T., Molina, M. J., and Prather,K. A.: Measurement of ambient aerosols in northern Mexico Cityby single particle mass spectrometry, Atmos. Chem. Phys. Dis-cuss., 7, 6413–6457, 2007,http://www.atmos-chem-phys-discuss.net/7/6413/2007/.
Molina, L. T., Kolb, C. E., de Foy, B., Lamb, B. K., Brune, W.H., Jimenez, J. L., Ramos-Villegas, R., Sarmiento, J., Paramo-Figueroa, V. H., Cardenas, B., Gutierrez-Avedoy, V., and Molina,M. J.: Air quality in North America’s most populous city –overview of the MCMA-2003 campaign, Atmos. Chem. Phys.,7, 2447–2473, 2007,http://www.atmos-chem-phys.net/7/2447/2007/.
Molina, M. J., Ivanov, A. V., Trakhtenberg, S., and Molina, L. T.:Atmospheric evolution of organic aerosol, Geophys. Res. Lett.,31, L22104, doi:10.1029/2004GL020910, 2004.
Morino, Y., Kondo, Y., Takegawa, N., Miyazaki, Y., Kita, K.,Komazaki, Y., Fukuda, M., Miyakawa, T., Moteki, N., andWorsnop, D. R.: Partitioning of HNO3 and particulate nitrateover Tokyo: Effect of vertical mixing, J. Geophys. Res.-Atmos.,111, D15215, doi:10.1029/2005JD006887, 2006.
Murphy, D. M., Cziczo, D. J., Hudson, P. K., and Thomson, D. S.:Carbonaceous material in aerosol particles in the lower strato-sphere and tropopause region, J. Geophys. Res.-Atmos., 112,D04203, doi:10.1029/2006JD007297, 2007.
Neuman, J. A., Nowak, J. B., Brock, C. A., Trainer, M., Fehsen-feld, F. C., Holloway, J. S., Hubler, G., Hudson, P. K., Murphy,D. M., Nicks, D. K., Orsini, D., Parrish, D. D., Ryerson, T. B.,Sueper, D. T., Sullivan, A., and Weber, R.: Variability in ammo-nium nitrate formation and nitric acid depletion with altitude andlocation over California, J. Geophys. Res.-Atmos., 108, 4557,doi:10.1029/2003JD003616, 2003.
Park, K., Kittelson, D. B., Zachariah, M. R., and McMurry, P. H.:Measurement of Inherent Material Density of Nanoparticle Ag-glomerates, J. Nanopart. Res., 6, 267–272, 2004.
Peltier, R. E., Sullivan, A. P., Weber, R. J., Brock, C. A., Wollny,A. G., Holloway, J. S., Gouw, J. A. d., and Warneke, C.: Fineaerosol bulk composition measured on WP-3D research aircraftin vicinity of the Northeastern United States – results fromNEAQS, Atmos. Chem. Phys., 7, 3231–3247, 2007a,http://www.atmos-chem-phys.net/7/3231/2007/.
Peltier, R. E., Sullivan, A. P., Weber, R. J., Wollny, A. G., Holloway,J. S., Brock, C. A., de Gouw, J. A., and Atlas, E. L.: No evidencefor acid-catalyzed secondary organic aerosol formation in powerplant plumes over metropolitan Atlanta, Georgia, Geophys. Res.Lett., 34, L06801, doi:10.1029/2006GL028780, 2007b.
Pope, C. A., and Dockery, D. W.: Health effects of fine particulateair pollution: lines that connect, J. Air Waste Manage., 56, 709–742, 2006.
Querol, X., Pey, J., Minguillon, M. C., Perez, N., Alastuey, A.,Viana1, M., Moreno, T., Bernabe, R. M., Blanco, S., Cardenas,B., Vega, E., Sosa, G., Escalona, S., Ruiz, H., and Artınano,B.: PM speciation and sources in Mexico during the MILAGRO-2006 Campaign, Atmos. Chem. Phys., 8, 111–128, 2008,http://www.atmos-chem-phys.net/8/111/2008/.
Quinn, P. K., Bates, T. S., Coffman, D., Onasch, T. B., Worsnop,D., Baynard, T., de Gouw, J. A., Goldan, P. D., Kuester, W.C., Williams, E., Roberts, J. M., Lerner, B., Stohl, A., Petters-son, A., and Lovejoy, E. R.: Impacts of Sources and Agingon Submicrometer Aerosol Properties in the Marine BoundaryLayer Across the Gulf of Maine, J. Geophys. Res., 111, D23S36,doi:10.1029/2006JD007582, 2006.
Raga, G. B., Kok, G. L., Baumgardner, D., Baez, A., and Rosas, I.:Evidence for volcanic influence on Mexico City aerosols, Geo-phys. Res. Lett., 26, 1149–1152, 1999.
Raga, G. B., Baumgardner, D., Castro, T., Martinez-Arroyo, A.,and Navarro-Gonzalez, R.: Mexico City air quality: a qualitativereview of gas and aerosol measurements (1960–2000), Atmos.Environ., 35, 4041–4058, 2001.
Ridley, B., Ott, L., Pickering, K., Emmons, L., Montzka, D.,Weinheimer, A., Knapp, D., Grahek, F., Li, L., Heymsfield,G., McGill, M., Kucera, P., Mahoney, M. J., Baumgardner, D.,Schultz, M., and Brasseur, G.: Florida thunderstorms: A faucetof reactive nitrogen to the upper troposphere, J. Geophys. Res.-Atmos., 109, D17305, doi:10.1029/2004JD004769, 2004.
Salcedo, D., Onasch, T. B., Dzepina, K., Canagaratna, M. R.,Zhang, Q., Huffman, J. A., DeCarlo, P. F., Jayne, J. T., Mor-timer, P., Worsnop, D. R., Kolb, C. E., Johnson, K. S., Zuberi,B., Marr, L. C., Volkamer, R., Molina, L. T., Molina, M. J., Car-denas, B., Bernabe, R. M., Marquez, C., Gaffney, J. S., Marley,N. A., Laskin, A., Shutthanandan, V., Xie, Y., Brune, W., Lesher,R., Shirley, T., and Jimenez, J. L.: Characterization of ambientaerosols in Mexico City during the MCMA-2003 campaign withAerosol Mass Spectrometry: results from the CENICA Super-site, Atmos. Chem. Phys., 6, 925–946, 2006,http://www.atmos-chem-phys.net/6/925/2006/.
San Martini, F. M., Dunlea, E. J., Volkamer, R., Onasch, T. B.,Jayne, J. T., Canagaratna, M. R., Worsnop, D. R., Kolb, C.E., Shorter, J. H., Herndon, S. C., Zahniser, M. S., Salcedo,D., Dzepina, K., Jimenez, J. L., Ortega, J. M., Johnson, K. S.,McRae, G. J., Molina, L. T., and Molina, M. J.: Implementation
4048 P. F. DeCarlo et al.: Aerosol size and chemistry measurements during MILAGRO
of a Markov Chain Monte Carlo method to inorganic aerosolmodeling of observations from the MCMA-2003 campaign –Part II: Model application to the CENICA, Pedregal and SantaAna sites, Atmos. Chem. Phys., 6, 4889–4904, 2006,http://www.atmos-chem-phys.net/6/4889/2006/.
Schauer, J. J., Rogge, W. F., Hildemann, L. M., Mazurek, M. A.,and Cass, G. R.: Source apportionment of airborne particulatematter using organic compounds as tracers, Atmos. Environ., 30,3837–3855, 1996.
Schneider, J., Weimer, S., Drewnick, F., Borrmann, S., Helas, G.,Gwaze, P., Schmid, O., Andreae, M. O., and Kirchner, U.: Massspectrometric analysis and aerodynamic properties of varioustypes of combustion-related aerosol particles, Int. J. Mass Spec-trom., 258, 37–49, 2006.
Seinfeld, J. H., and Pandis, S. N.: Atmospheric chemistry andphysics : from air pollution to climate change, Wiley, New York,xxvii, 1326 pp., 1998.
Shinozuka, Y., Clarke, A. D., Howell, S. G., Kapustin, V. N.,McNaughton, C. S., Zhou, J. C., and Anderson, B. E.: Air-craft profiles of aerosol microphysics and optical propertiesover North America: Aerosol optical depth and its associationwith PM2.5 and water uptake, J. Geophys. Res.-Atmos., 112,D12S20, doi:10.1029/2006JD007918, 2007.
Smithsonian Global Volcanism Program: Volcanoes of Mexico andCentral America,http://www.volcano.si.edu/world/region.cfm?rnum=1401, 2007.
Stolzenburg, M., Kreisberg, N., and Hering, S.: Atmospheric sizedistributions measured by differential mobility optical particlesize spectrometry, Aerosol Sci. Tech., 29, 402–418, 1998.
Stone, E. A., Snyder, D. C., Sheesley, R. J., Sullivan, A. P., Weber,R. J., and Schauer, J. J.: Source apportionment of fine organicaerosol in Mexico City during the MILAGRO Experiment 2006,Atmos. Chem. Phys., 8, 1249–1259, 2008,http://www.atmos-chem-phys.net/8/1249/2008/.
Takegawa, N., Miyazaki, Y., Kondo, Y., Komazaki, Y., Miyakawa,T., Jimenez, J. L., Jayne, J. T., Worsnop, D. R., Allan, J. D.,and Weber, R. J.: Characterization of an Aerodyne Aerosol MassSpectrometer (AMS): Intercomparison with other aerosol instru-ments, Aerosol Sci. Tech., 39, 760–770, 2005.
Tanaka, P. L., Riemer, D. D., Chang, S. H., Yarwood, G.,McDonald-Buller, E. C., Apel, E. C., Orlando, J. J., Silva, P.J., Jimenez, J. L., Canagaratna, M. R., Neece, J. D., Mullins,C. B., and Allen, D. T.: Direct evidence for chlorine-enhancedurban ozone formation in Houston, Texas, Atmos. Environ., 37,1393–1400, 2003.
Ulbrich, I. M., Canagaratna, M. R., Zhang, Q., Worsnop, D. R., andJimenez, J. L.: Interpretation of Organic Components from Pos-itive Matrix Factorization of Aerosol Mass Spectrometric Data. ,Atmos. Chem. Phys. Discuss., 8, 6729–6791, 2008,http://www.atmos-chem-phys-discuss.net/8/6729/2008/.
Volkamer, R., Jimenez, J. L., San Martini, F., Dzepina, K., Zhang,Q., Salcedo, D., Molina, L. T., Worsnop, D. R., and Molina, M.J.: Secondary organic aerosol formation from anthropogenic airpollution: Rapid and higher than expected, Geophys. Res. Lett.,33, L17811, doi:10.1029/2006GL026899., 2006.
Volkamer, R., San Martini, F., Molina, L. T., Salcedo, D., Jimenez,J. L., and Molina, M. J.: A Missing Sink for Gas-Phase Glyoxalin Mexico City: Formation of Secondary Organic Aerosol, Geo-phys. Res. Lett., 34, L19807, doi:19810.11029/12007GL030752,2007.
Wang, S. C. and Flagan, R. C.: Scanning Electrical Mobility Spec-trometer, Aerosol Sci. Tech., 13, 230–240, 1990.
Watson, J. G.: Visibility: Science and regulation, J. Air Waste Man-age., 52, 628–713, 2002.
Yokelson, R., Urbanski, S., Atlas, E., Toohey, D., Alvarado, E.,Crounse, J., Wennberg, P., Fisher, M., Wold, C., Campos, T.,Adachi, K., Buseck, P. R., and Hao, W. M.: Emissions from for-est fires near Mexico City, Atmos. Chem. Phys., 7, 5569–5584,2007,http://www.atmos-chem-phys.net/7/5569/2007/.
Zhang, Q., Stanier, C. O., Canagaratna, M. R., Jayne, J. T.,Worsnop, D. R., Pandis, S. N., and Jimenez, J. L.: Insightsinto the chemistry of new particle formation and growth eventsin Pittsburgh based on aerosol mass spectrometry, Environ. Sci.Technol., 38, 4797–4809, 2004.
Zhang, Q., Alfarra, M. R., Worsnop, D. R., Allan, J. D., Coe,H., Canagaratna, M. R., and Jimenez, J. L.: Deconvolutionand Quantification of Primary and Oxygenated Organic AerosolsBased on Aerosol Mass Spectrometry. Part 1: Development andValidation of the Method, Environ. Sci. Technol., 39, 4938–4952,2005a.
Zhang, Q., Canagaratna, M. R., Jayne, J. T., Worsnop, D. R., andJimenez, J. L.: Time and Size-Resolved Chemical Compositionof Submicron Particles in Pittsburgh – Implications for AerosolSources and Processes, J. Geophys. Res.-Atmos., 110, D07S09,doi:10.1029/2004JD004649, 2005b.
Zhang, Q., Worsnop, D. R., Canagaratna, M. R., and Jimenez, J. L.:Hydrocarbon-like and oxygenated organic aerosols in Pittsburgh:insights into sources and processes of organic aerosols, Atmos.Chem. Phys., 5, 3289–3311, 2005c,http://www.atmos-chem-phys.net/5/3289/2005/.
Zhang, Q., Jimenez, J. L., Canagaratna, M. R., Allan, J. D., Coe,H., Ulbrich, I., Alfarra, M. R., Takami, A., Middlebrook, A.M., Sun, Y. L., Dzepina, K., Dunlea, E., Docherty, K., De-Carlo, P. F., Salcedo, D., Onasch, T., Jayne, J. T., Miyoshi,T., Shimono, A., Hatakeyama, S., Takegawa, N., Kondo, Y.,Schneider, J., Drewnick, F., Borrmann, S., Weimer, S., Demer-jian, K., Williams, P., Bower, K., Bahreini, R., Cottrell, L.,Griffin, R. J., Rautiainen, J., Sun, J. Y., Zhang, Y. M., andWorsnop, D. R.: Ubiquity and dominance of oxygenated speciesin organic aerosols in anthropogenically-influenced NorthernHemisphere midlatitudes, Geophys. Res. Lett., 34, L13801,doi:13810.11029/12007GL029979, 2007a.
Zhang, Q., Jimenez, J. L., Worsnop, D. R., and Canagaratna, M.: ACase Study of Urban Particle Acidity and Its Influence on Sec-ondary Organic Aerosol, Environ. Sci. Technol., 41, 3213–3219,2007b.