Fast Drying and Film Formation of Latex Dispersions Studied with FTIR Spectroscopic Imaging James A. Kimber, † Matthias Gerst, ‡ and Sergei G. Kazarian *,† Department of Chemical Engineering, Imperial College London, London, SW7 2AZ, United Kingdom, and BASF Advanced Chemicals Co., Ltd., GMU/SD, 300 Jiang Xin Sha Road, Pudong Shanghai 200137, P. R. China E-mail: [email protected]Abstract Drying of thin latex films (≈20 μm) at high drying speeds (of the order of sec- onds) has been studied by fast chemical imaging. ATR-FTIR spectroscopic imaging combined with a fast “kinetic” mode was used to acquire spectral images without co- addition, enabling the amount of water and homogeneity of drying film to be studied over time. Drying profiles, constructed from analysing the water content in each im- age, show two stages of drying, a fast and a slow region. The formulation of latex dispersions affects the onset of slow drying and the volume fraction of water remain- ing at the onset of slow drying. In this work, the effect of physical properties, film thickness and glass transition temperature (T g ), were investigated, as well as the ef- fect of monomer composition where two monomoers, 2-Ethylhexylacrylate (EHA) and * To whom correspondence should be addressed † Department of Chemical Engineering, Imperial College London, London, SW7 2AZ, United Kingdom ‡ BASF Advanced Chemicals Co., Ltd., GMU/SD, 300 Jiang Xin Sha Road, Pudong Shanghai 200137, P. R. China 1
Transcript
Fast Drying and Film Formation of Latex
Dispersions Studied with FTIR Spectroscopic
Imaging
James A. Kimber,† Matthias Gerst,‡ and Sergei G. Kazarian∗,†
Department of Chemical Engineering, Imperial College London, London, SW7 2AZ, United
Drying of thin latex films (≈20 µm) at high drying speeds (of the order of sec-
onds) has been studied by fast chemical imaging. ATR-FTIR spectroscopic imaging
combined with a fast “kinetic” mode was used to acquire spectral images without co-
addition, enabling the amount of water and homogeneity of drying film to be studied
over time. Drying profiles, constructed from analysing the water content in each im-
age, show two stages of drying, a fast and a slow region. The formulation of latex
dispersions affects the onset of slow drying and the volume fraction of water remain-
ing at the onset of slow drying. In this work, the effect of physical properties, film
thickness and glass transition temperature (Tg), were investigated, as well as the ef-
fect of monomer composition where two monomoers, 2-Ethylhexylacrylate (EHA) and
∗To whom correspondence should be addressed†Department of Chemical Engineering, Imperial College London, London, SW7 2AZ, United Kingdom‡BASF Advanced Chemicals Co., Ltd., GMU/SD, 300 Jiang Xin Sha Road, Pudong Shanghai 200137, P.
R. China
1
nButylacrylate (nBA) and the amount of hydrophilic comonomer, Methylmethacrylate
(MMA) were varied. It was found that thicker films produced slower overall drying,
and that the formulation with a Tg above the minimum film formation temperature
(MFFT) did not dry evenly, exhibiting cracking. However, the drying kinetics of high
and low Tg films were similar, highlighting the advantage of using a spatially-resolved
spectroscopic approach. Formulations containing more MMA dried faster than those
with less. This was due to the hydrophilicity of MMA and the increase in Tg of the
dispersion from the addition of MMA. Overall, FTIR spectroscopic imaging was shown
to be a suitable approach in measuring film drying at high speeds as both chemical
changes and chemical distribution could be analysed over time.
Introduction
Latex, or more generally, colloidal or polymeric dispersions, are a colloidal suspension of
polymer particles typically between 1 nm and 1 µm. The synthesis of latex dispersions is
often accomplished using emulsion polymerisation in which monomers such as acrylates, are
emulsified in solution containing surfactant and polymerisation initiators.1,2 The application
of latex dispersions is common for paints and adhesives, and the use of water-based disper-
sions is environmentally advantageous over those employing organic solvents. During latex
film formation, the solvent evaporates, latex particles pack, deform and eventually coalesce.
The latter stages of particle deformation coalescence is particularly important in obtain-
ing a homogeneous, optically transparent film. Depending on the latex composition (e.g.
main monomer, co-monomer, solvent and surfactant), temperature of drying and the rate
at which water evaporation occurs, different qualities of films are obtained. For example,
drying at temperatures below the minimum film formation temperature (MFFT), particles
will not coalesce, resulting in a brittle or powdery film, whereas when drying above the glass
transition temperature (Tg), molecular chains diffuse between the latex particles, resulting
in a continuous polymer film. In some cases, the stages of film formation may occur at
2
different times within the film. At high drying temperatures where water evaporation is
very fast, particles at the surface may coalesce to form a film, trapping water below and
hindering subsequent drying. In these cases, applying higher drying temperatures can result
in slower film drying. The mechanisms of film formation along with methods in which they
are analysed have been extensively reviewed.3–6 In this paper, particular interest is paid to
the formation of thin latex films at high temperatures as this most closely matches condi-
tions in industrial coating applications. Assessing film formation over time under industrially
relevant conditions is challenging due to the high mass transfer rates involved. Cryogenic
Scanning Electron Microscopy (SEM), where films are quenched at various points through-
out drying and studied using SEM, reveals the spatial distribution of latex particles and
where coalescence has occurred.7 Advances in SEM such as Environmental Scanning Elec-
tron Microscopy (ESEM)8 or Wet Scanning Tunneling Electron Microscopy9 allow in-situ
drying to be studied, although this must still occur under vacuum conditions. Conventional
NMR,10 or Gradient At Right-angles to the Field or GARField, have been used to study the
water content within a drying film11 as well as cross-linking12 and spectroscopic approaches
such as Inverse-Micro-Raman-Spectroscopy13 and infrared microscopy14 have provided fur-
ther insight into the distributions of polymer and water during drying. These approaches
average over a volume of the film in the case of conventional NMR, give insight into one
dimension in the case of GARField, or are point-based (infrared microscopy and Raman)
and thus require a degree of mapping in order to probe different parts of the film as it dries.
When drying proceeds slowly compared to the time required to map regions of interest, the
film can be assumed to be in a pseudo-steady state condition during these times. However,
for faster drying speeds (i.e. seconds), it would not be possible to map a line or area within
the time frame.
Attenuated Total Reflection Fourier Transform Infrared (ATR-FTIR) has been applied
to study dynamic processes such as crystallization of droplets,15 latex film formation,16
with multi-bounce ATR offering insight at both the film-air interface and the film-substrate
3
interface17 and this technique has also been used to measure latex binder migration upon
drying.18 Recent advances in computational speed and the introduction of infrared array
detectors enable film formation to be studied at high temperatures and speeds while retaining
chemical specificity and also providing spatial information without the use of mapping. Focal
plane array detectors combined with ATR-FTIR spectrometers have been used to study
a wide range of dynamic systems19 such as pharmaceuticals,20 biological systems21 and
protein crystallisation.22 The key advantages of this imaging approach over in-situ mapping
or quench-based approaches are that an area of the film can be monitored chemically and
spatially as it dries quickly under high temperature air, with little interference or geometric
constraints, other than the film drying on the impermeable ATR crystal surface. It thus
allows a close approximation to drying conditions that would occur in industrial coaters.
In this work, ATR-FTIR spectroscopic imaging is used to study thin film formation under
industrially relevant conditions (fast drying speeds using high temperature air) and show the
effects of changing formulation parameters on drying performance.
Experimental Section
FTIR spectroscopic imaging
FTIR spectroscopy relies on the absorbance of specific frequencies of infrared by a sample.
These frequencies correspond to vibrational modes of different functional groups or chemical
bonds within a sample and thus a spectrum (plot of absorbance against frequency) can be
used to identify the components present in a system. The Lambert-Beer law can be used
to relate absorbance of specific spectral bands to concentration, enabling quantitative infor-
mation to be obtained. FTIR spectroscopic imaging combines conventional single-element
FTIR spectroscopy with a Focal Plane Array (FPA) detector containing an array of 64 x
64 pixels. Each pixel resolves a full infrared spectrum simultaneously from different parts
of the sample, enabling a variety of dynamic systems to be studied in a chemically specific
4
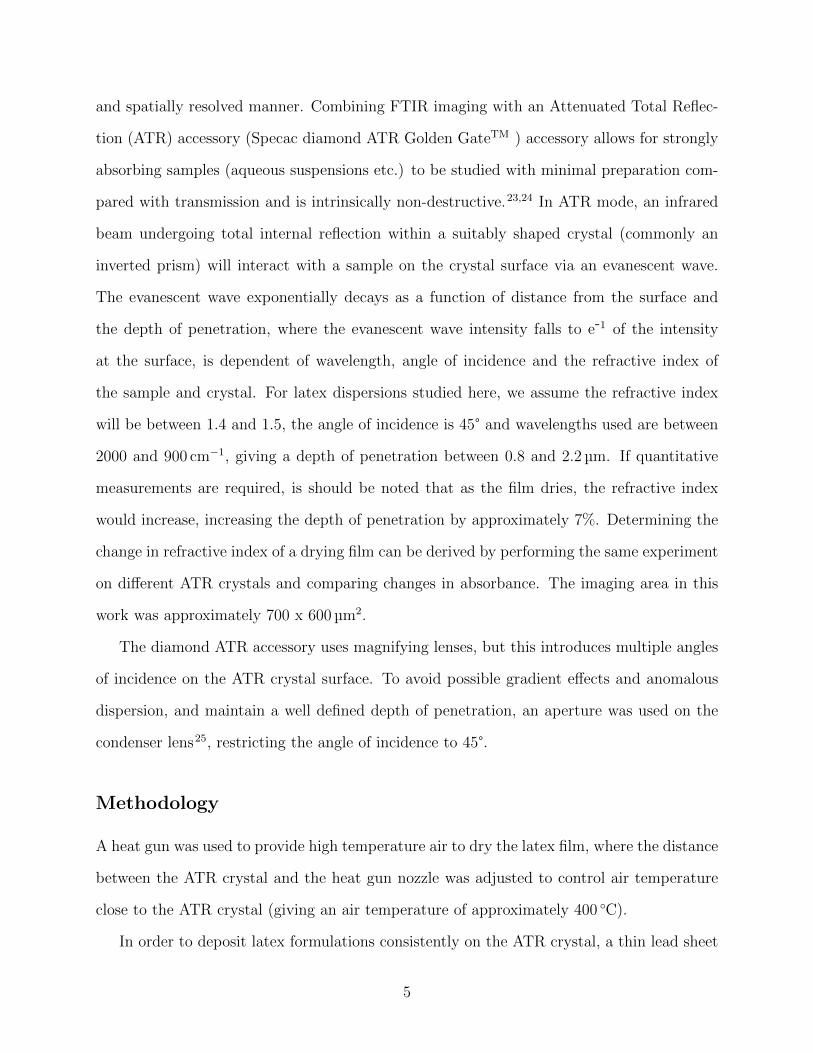
and spatially resolved manner. Combining FTIR imaging with an Attenuated Total Reflec-
tion (ATR) accessory (Specac diamond ATR Golden GateTM ) accessory allows for strongly
absorbing samples (aqueous suspensions etc.) to be studied with minimal preparation com-
pared with transmission and is intrinsically non-destructive.23,24 In ATR mode, an infrared
beam undergoing total internal reflection within a suitably shaped crystal (commonly an
inverted prism) will interact with a sample on the crystal surface via an evanescent wave.
The evanescent wave exponentially decays as a function of distance from the surface and
the depth of penetration, where the evanescent wave intensity falls to e-1 of the intensity
at the surface, is dependent of wavelength, angle of incidence and the refractive index of
the sample and crystal. For latex dispersions studied here, we assume the refractive index
will be between 1.4 and 1.5, the angle of incidence is 45° and wavelengths used are between
2000 and 900 cm−1, giving a depth of penetration between 0.8 and 2.2 µm. If quantitative
measurements are required, is should be noted that as the film dries, the refractive index
would increase, increasing the depth of penetration by approximately 7%. Determining the
change in refractive index of a drying film can be derived by performing the same experiment
on different ATR crystals and comparing changes in absorbance. The imaging area in this
work was approximately 700 x 600 µm2.
The diamond ATR accessory uses magnifying lenses, but this introduces multiple angles
of incidence on the ATR crystal surface. To avoid possible gradient effects and anomalous
dispersion, and maintain a well defined depth of penetration, an aperture was used on the
condenser lens25, restricting the angle of incidence to 45°.
Methodology
A heat gun was used to provide high temperature air to dry the latex film, where the distance
between the ATR crystal and the heat gun nozzle was adjusted to control air temperature
close to the ATR crystal (giving an air temperature of approximately 400 ◦C).
In order to deposit latex formulations consistently on the ATR crystal, a thin lead sheet
5
with a 5.5 mm hole, was placed on the tungsten carbide disk such that the hole was centrally
aligned to the ATR crystal. Using a microlitre pipette, 2 to 3 µl, depending on the viscosity
of formulation, was spread onto the ATR crystal. Prior to deposition, the heat gun was
switched on to stabilise the air temperature out of the nozzle, and the spectrometer was
instructed to start measuring. The latex formulation was then pipetted and spread within
the lead ring over the ATR crystal, and immediately after three scans, the heat gun was
placed over the sample at the required height. The images were measured in “kinetic” mode,
where interferograms were acquired but not co-added and processed only after all scans were
completed. The number of scans was set to 30, resulting in a series of spectral images
approximately 1.011 seconds apart. The speed of acquisition depends on interferometer
scanning speed, spectral resolution (in this work, 8 cm−1), spectral range (2000 cm−1 to
900 cm−1, achieved using a low-pass filter) and FPA refresh rate. Further optimisation of
these parameters can be used to acquire images of moving droplets at 50 ms intervals26. The
spectrometer used in this work was a Bruker Equinox 55 with IMAC macrochamber. Images
were generated from spectra by numerical integration of certain spectral bands. The carbonyl
band between 1755 cm−1 and 1705 cm−1 was used to visualise the distribution of acrylic over
time, and the bending mode of water between 1692 cm−1 and 1580 cm−1 was used to visualise
water. The integration limits for these bands were chosen so as to minimise the influence
from adjacent bands, while providing sufficient integral area to reduce the influence of noise,
an important consideration since each spectrum is the result of one scan. The accuracy of
this approach could be improved using multivariate analysis, which takes into account the
whole spectrum rather than single spectral bands, further reducing the error from spectral
noise and band overlap. In this work, the normalised change in the spectral band of the
bending mode of water, is of primary interest, which is indicative of water loss within the
drying film. Figure 1 shows schematically the set-up used and an example spectrum with
band integration, used to produce the images.
The thickness and homogeneity of the resulting film was measured using a confocal
6
0
0.02
0.04
0.06
0.08
0.1
0.12
0.14
0.16
0.18
900 1000 1100 1200 1300 1400 1500 1600 1700 1800
Abs
orba
nce
[-]
Wavenumber [cm-1]
Infrar
ed To FPAAperture
Lens
ATR diamond
Heat gunLatex film
FPA detector
Integratedabsorbance
Low
High
Figure 1: Schematic of film drying on the ATR crystal showing the aperture on the con-denser lens and the generation of images from all spectra by spatially plotting the integratedabsorbance of the bending mode of water (between 1692 cm−1 and 1580 cm−1) or carbonylband (between 1755 cm−1 and 1705 cm−1) for water or polymer visualisation respectively.
microscope with an XYZ-motorized stage. The use of an internal aperture was used to
visually assess focus on the surface of the film within an accuracy of ±2 µm. By scratching
the dried film off part of the ATR crystal and focusing on this exposed part using the
motorized stage, a read-out of the film thickness can be obtained. Depending on the amount
of latex formulation initially deposited and how effectively it was spread, the target thickness
was 20 µm to 24 µm.
Spectral image analysis
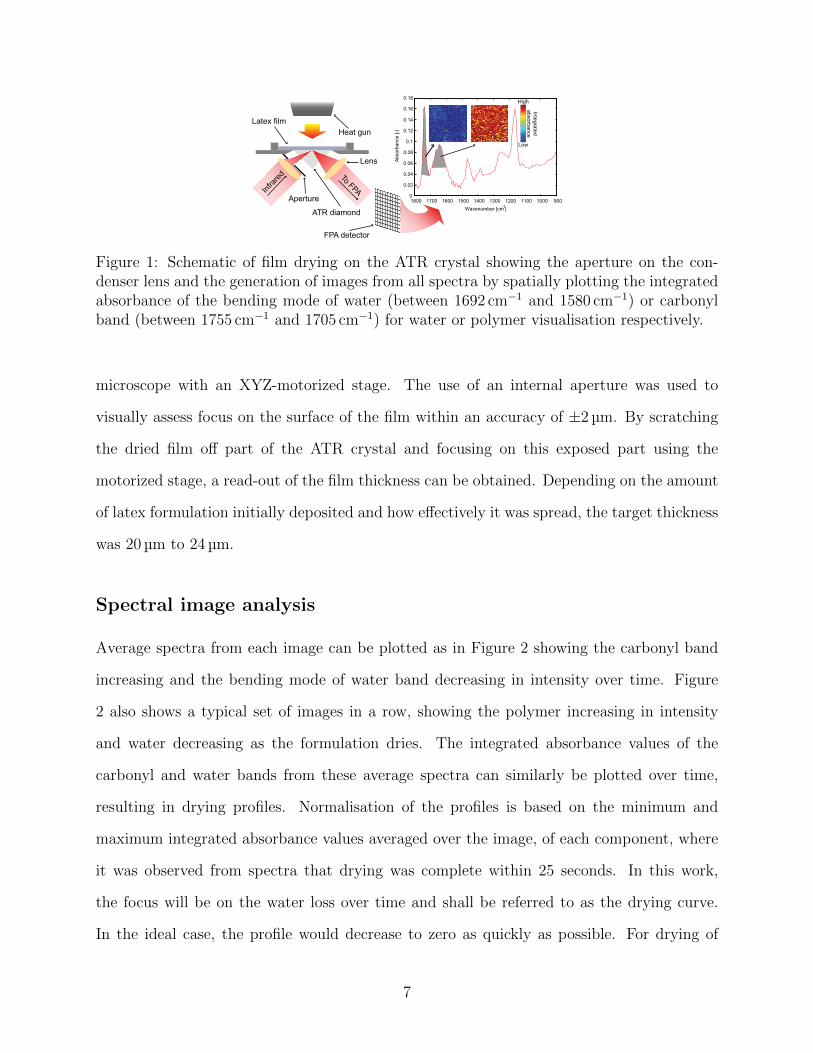
Average spectra from each image can be plotted as in Figure 2 showing the carbonyl band
increasing and the bending mode of water band decreasing in intensity over time. Figure
2 also shows a typical set of images in a row, showing the polymer increasing in intensity
and water decreasing as the formulation dries. The integrated absorbance values of the
carbonyl and water bands from these average spectra can similarly be plotted over time,
resulting in drying profiles. Normalisation of the profiles is based on the minimum and
maximum integrated absorbance values averaged over the image, of each component, where
it was observed from spectra that drying was complete within 25 seconds. In this work,
the focus will be on the water loss over time and shall be referred to as the drying curve.
In the ideal case, the profile would decrease to zero as quickly as possible. For drying of
7
latex dispersions, two stages are seen, a fast drying region, a plateau and a slow drying
region towards the end. This correlates with similar studies in which two27 or three28 drying
stages are proposed. In the case of three stages, the first is evaporation of water from the
surface, causing latex particles to pack, the second stage occurs as the packed latex particles
deform and the third is where polymer chains interdiffuse and the remaining water leaves
the film either via capillaries or diffusing through the polymer itself. In two-stage drying,
it is proposed that bulk water evaporates first, but in the second stage, a moving boundary
occurs in the film where water evaporates from this boundary, percolating through the dry
top layers. A comparison between the two theories has been extensively covered in review
articles and compared with experiments or mathematical models.5,29–31
For comparison between latex compositions, the time between the application of heat and
the start of slow drying can be defined as tfast and the time between the onset of slow drying
and the end of film drying can be defined as tslow . At the point of slow drying, the normalised
integrated absorbance of water will be some positive value, with lower values indicating less
water in the film at the start of slow drying. This quantity is of interest as ideally, as much
water as possible would be lost in the fast drying regime. As the dispersions contain the
same volume fraction of water, it is possible to compare this value between formulations.
To ascertain these values, a segmented polynomial with four control points was fitted to the
data. The first point would be set to the maximum of the drying curve, the last point set to
the first zero crossing point and the two intermediate points fitted to the drying curve so as
to minimise the mean squared error of the fitted line with the data. The second point would
be at the transition between fast and slow drying, and the third would be at the end of the
plateau.
In cases of fast drying, latex particles can accumulate on the surface and can form a
more or less dense skin, hindering the evaporation of water from below. The propensity for
accumulation of particles depends on the drying rate as if the rate of evaporation is slower
than the diffusion of the latex particles, a film will not be formed whereas in the reverse case,
8
-0.05
0
0.05
0.1
0.15
0.2
0.25
0.3
0.35
0.4
900 1000 1100 1200 1300 1400 1500 1600 1700 1800
Abs
orba
nce
[-]
Wavenumber [cm-1]
0
0.2
0.4
0.6
0.8
1
-5 0 5 10 15 20 25 30
Nor
mal
ised
inte
grat
ed a
bsor
banc
e [-]
Time [s]
WaterPolymer
Polymer
Water
Polymer
tfast tslow
Water
Time
Fast region
Plateau
Slow drying
Figure 2: Average spectra from each image plotted over time (top) with example imagestrips (middle, each image is 700 x 600 µm2) and plots of the average integrated absorbancefor water and polymer in each image over time (bottom). The features of the drying curve,can be further defined as an initial fast drying region (tfast), a plateau and a tail-off tslow .The y-axis value where tfast becomes tslow is the fraction of water remaining with respect tothe starting volume fraction of water. The latex dispersion used in this example contained99% ethylhexylacrylate and 1% acrylic acid.
9
particles cannot redistribute or diffuse in time during evaporation of the water. The Peclet
number can be used to express this mathematically in Equation 1, where H is the thickness
of the film (m), E is the evaporation rate of water (ms−1) and Dp is the diffusion coefficient
of the latex particles (m2s−1).
Pe =HE
Dp
(1)
If Pe > 1 then accumulation of particles and skin formation is likely to occur. The values of
H, E and Dp can be estimated either from experimental results or derived from the Stokes-
Einstein equation. For all formulations, the volume fraction of latex particles to water is
approximately 50%, and the particle diameters are approximately 225 nm. The height of
the film before drying can thus be assumed to be twice that of the final film thickness. The
evaporation rate can be estimated from the gradient of the fast drying region from Figure 2 as
the concentration of water is proportional to the integrated absorbance. The Stokes-Einstein
equation models diffusion of spherical particles and is given by:
Dp =kBT
6πηrp(2)
In Equation 2, kB is the Boltzmann constant, T is the temperature and η is the dy-
namic viscosity of water. The diffusion coefficient of the latex particles is approximately
2.2× 10⁻¹² m2s−1 and thus a typical Peclet number would be 5 for this system at the start
of drying, thus being in a region where accumulation of particles and skin formation is likely.
Although with ATR it is not possible to see through the whole thickness of the film,
it offers insights into processes occurring at the substrate. For example, in Figure 2, the
polymer curve appears to dip at 15 seconds. This may be due to particle migration caused
by Brownian motion, where particles migrating to the surface are trapped in the upper layer
as they coalesce. It was found by Zang et al32 studying latex clay coatings, that if heating is
10
applied soon after coating, latex particles migrate to the surface. Conversely, if the coating
is left to dry at room temperature for a time before being dried in an oven, the latex particles
become immobilized with the other clay particles as the water slowly evaporates and thus
during fast drying, the particles do not move. In this work, there are no other particles
and drying occurs quickly after deposition, hence it is expected that particles will migrate
to the surface and become trapped as they form part of the skin. The high Peclet number
in this work predicts the formation of a skin and after an initial high rate of evaporation,
the latex particles pack and sinter together, slowing further evaporation (Figure 3). In the
evanescent field, the water cannot leave the film easily, hence the appearance of a plateau.
After the formation of a skin or film, pores within the film would close due to polymer chain
interdiffusion. The rate at which this occurs depends on the glass transition temperature
(Tg) and for thin films, it is envisioned that water would evaporate quickly through the
pores before they close. However, the rate of polymer chain interdiffusion would still have
an effect on water evaporation even for thin films as pores would close at different rates.
For dispersions with a low Tg , polymer chains interdiffuse faster than dispersions with high
Tg , causing a slowing of water evaporation.33 For films with high Tg , though water would
evaporate quickly, a porous or cracked film can result.
Materials
All latex dispersions were supplied by BASF and were based on nButylacrylate (nBA) or
Ethylhexylacrylate (EHA), with the addition of acrylic acid (AA) and in cases, methyl-
methacrylate (MMA) as comonomers. The particle sizes of all formulations were approxi-
mately 220 nm, pH between 6.2 and 7.3 and solid volume fraction of approximately 50%.
11
ATR crystal
Evanescent wave
Infrared beam
Water Latex particlesA B C
Figure 3: Schematic of high-speed drying of a latex dispersion on an ATR crystal. Atthe start of drying (A), latex particles are evenly dispersed in water but aggregate at thetop surface as water evaporates faster than the particles can diffuse (B). Particles at thesurface (C) deform and sinter together, hindering evaporation of the remaining water, givingrise to slower drying. As drying progresses, the concentration of latex particles within theevanescent wave increases (B) and the remaining water at the onset of slow drying (C) withinthe evanescent wave cannot evaporate as quickly due to skin formation.
Results and discussion
Drying of water containing silica nanoparticles
To demonstrate the effect of non-interacting or non-sintering particles on drying and as-
sess experimental reproducibility, silica nanoparticles of diameter 100 nm were suspended in
distilled water at 50% (v/v) and dried according to the specified method. Figure 4 shows
the results from three experimental runs and the images of silica and water from all three
experiments. The water in all cases dries similarly and there is no slow region as the par-
ticles do not sinter together or release adsorbed or absorbed water. The images, generated
from integration of the band between 1122 and 1022 cm−1, show that at the end of drying,
the silica nanoparticles are pulled away from the centre due to surface tension producing
a non-uniform film. The drying profiles, which were generated from averaged pixels of the
integrated absorbance images, demonstrate what would be observed with a single element
detector and do not show the inhomogeneous drying as seen in the images. From this, the
absorbance of the spectral band of silica appears to decrease but this is only because the
particles are moving out of the field of view, leaving voids which are also averaged when gen-
12
erating the drying curve. With imaging, it is possible to selectively mask out these regions
so as to average only regions containing silica.
Silica
Water
0
0.2
0.4
0.6
0.8
1
-5 0 5 10 15 20 25 30
Nor
mal
ised
inte
grat
ed a
bsor
banc
e [-]
Time [s]
Water Silica
Time [s]0 5 10 15 20 25
Figure 4: Averaged drying profiles of the silica nanoparticles and water, and integratedabsorbance images of silica and water.
Effect of glass transition temperature (Tg)
As previously reported, polymer particles with high Tg will not sinter together upon drying
below the MFFT, and form cracked or powdery films. Conversely, dispersions with low Tg
drying above the MFFT will sinter together sooner during drying and could give rise to
skin formation which would hinder further drying. In this experiment, two dispersions with
glass transition temperatures approximately 41 ◦C and 20 ◦C were dried. The glass transition
temperature was altered by controlling the percentage MMA in the formulations from 45%
nBA (Tg calculated to be 20.3 ◦C) to 32% (Tg calculated to be 40.6 ◦C). The images in Figure
5 show that for the film with high Tg , a cracked film is formed whereas the other dispersion
produced a more uniform film. The drying curves for the films with high Tg have hardly any
slow drying region as the large cracks provide paths for water to evaporate in contrast to
13
the low Tg dispersion, where a slow drying region is clearly visible and the film is uniform.
For the low Tg formulations, no plateau is observed in the slow drying region indicating that
water was not trapped strongly in this formulation. The polymer curve and images for the
high Tg are scaled on a different basis to the others. This is due to the inhomogeneity of the
final film and normalisation, which would usually occur based on maximum and minimum
integrated absorbance values averaged over the image (valid for homogeneous films), would
not apply in this case. As before, selected pixel masking could be used to account for the
inhomogeneity, allowing the normalisation to function properly. Here, the curve is presented
to indicate the problem with inhomogeneous films and use of a single element detector, which
would produce a similar result. It is interesting to see that the curve reaches a minimum at
the 12 second mark, likely due to particle movement during drying. This trapping effect32
could be more pronounced for high Tg films, as the surface temperature is likely to be high
enough for partial sintering to occur while particles below the surface can freely migrate to
this top layer to be trapped. A skin does not form in this case and the averaging effect as in
the previous section causes the final integrated absorbance to be low due to the presence of
voids. Both this and the previous section show that with spectroscopic imaging, it’s possible
to assess the quality of film formation and ascertain the cause of erratic drying curves due
to inhomogeneity.
Effect of film thickness
Drying rates can be influenced by film thickness as thin films would dry quickly due to the
smaller mass and heat transfer distances. In these experiments, the final film thickness is
reported rather than the initial film thickness and as all experiments contained the same
volume fraction of solids, the final film thickness can be used as a basis for comparison. For
this purpose, a dispersion with a Tg of −32.6 ◦C (calculated) was used (monomer composition
89% nBA, 10% MMA, 1% AA with NH3 added afterwards to bring the pH to 8.5). As shown
in Figure 6, the total drying time increases as film thickness increases but the effects of thicker
14
Polymer - Tg = 41ºC
Water - Tg = 41ºC
Water - Tg = 20ºC
Polymer - Tg = 20ºC
Time [s]0 5 10 15 20 25
0
0.2
0.4
0.6
0.8
1
-5 0 5 10 15 20 25 30
Nor
mal
ised
inte
grat
ed a
bsor
banc
e [-]
Time [s]
Water - Tg = 20ºCWater - Tg = 41ºC
Polymer - Tg = 20ºCPolymer - Tg = 41ºC
Figure 5: Drying profiles of latex films with high (41 ◦C) and low (20 ◦C) glass transitiontemperatures with example images showing homogeneous drying for the film with low Tg
and cracked film formation for film with high Tg .
15
films are more pronounced in the slow drying region (the length of the plateau and the overall
magnitude of tslow), with the fast drying region not being as greatly affected. With thicker
films, more water will be trapped to produce the plateau, and the thicker film will also
hinder water evaporation compared with thinner films. It is also possible that the rate of
pore closure is a factor, where for thin films, water would evaporate before polymer chains
interdiffuse significantly (the diffusion coefficient of the polymer chains being the determining
factor). The fast drying region is generally less affected as the particles would not have yet
aggregated or sintered together as much, except in the case of thicker films where at the
surface, this would start to happen more significantly, affecting also this region.
0
0.2
0.4
0.6
0.8
1
-5 0 5 10 15 20 25 30
Nor
mal
ised
inte
grat
ed a
bsor
banc
e [-]
Time [s]
15 µm17 µm22 µm26 µm30 µm34 µm
Figure 6: Drying profiles of the same latex dispersion with different final thicknesses.
Using the quantities defined previously (fraction of water remaining and tslow), the effect
of film thickness can be plotted against these variables for more quantitative analysis. Figure
7 shows plots of film thickness against the fraction of water remaining and value of tslow
respectively.
The effect of doubling the film thickness increases the fraction of remaining water by
approximately 12%, and the slow drying regime extends by approximately ten seconds.
These results show that with high-speed imaging, drying of even thin films (¡20 µm) can
be studied, and that the thickness has a large effect on the slow drying region. It appears
that for very thin films (¡15 µm) of this formulation, the plateau region could disappear
16
0.32
0.34
0.36
0.38
0.4
0.42
0.44
0.46
0.48
15 20 25 30 35
Frac
tion
of w
ater
rem
aini
ng [-
]
Thickness [µm]
4
6
8
10
12
14
16
18
20
15 20 25 30 35
t slo
w [s
]
Thickness [µm]
A B
Figure 7: Final film thickness plotted against A) the fraction of water remaining at the onsetof slow drying and B) tslow .
completely.
Effect of nBA vs. EHA and % MMA
The main monomers, 2-ethylhexylacrylate (EHA) and nButylacrylate (nBA) were compared
along with differing amounts of comonomer, methylmethacrylate (MMA) at 0%, 5% and
10% fractions. Acrylic acid (1%) was present in all formulations and a summary of these,
along with their Tg values, is shown in Table 1. Films whose final thicknesses were between
20 and 24 µm were chosen for this study. The EHA and nBA monomers are structurally
similar apart from the ethyl side-chain in EHA, making the EHA based formulations more
hydrophobic than nBA and this difference appears to cause pronounced differences in the
drying characteristics. Plotting the slow drying time against the fraction of water remaining
highlights the best formulation for drying as an ideal formulations would occupy the lower
left of the graph. This is shown in Figure 8 which are based on an average of four experi-
mental runs. The error bars are higher for the nBA formulations as spreading to form a flat
film was more difficult due to the dispersion’s higher viscosity. The importance of consistent
film thickness when comparing formulations is apparent as shown in the previous section, as
thickness variations are a significant source of error between measurements. It is clear that
17
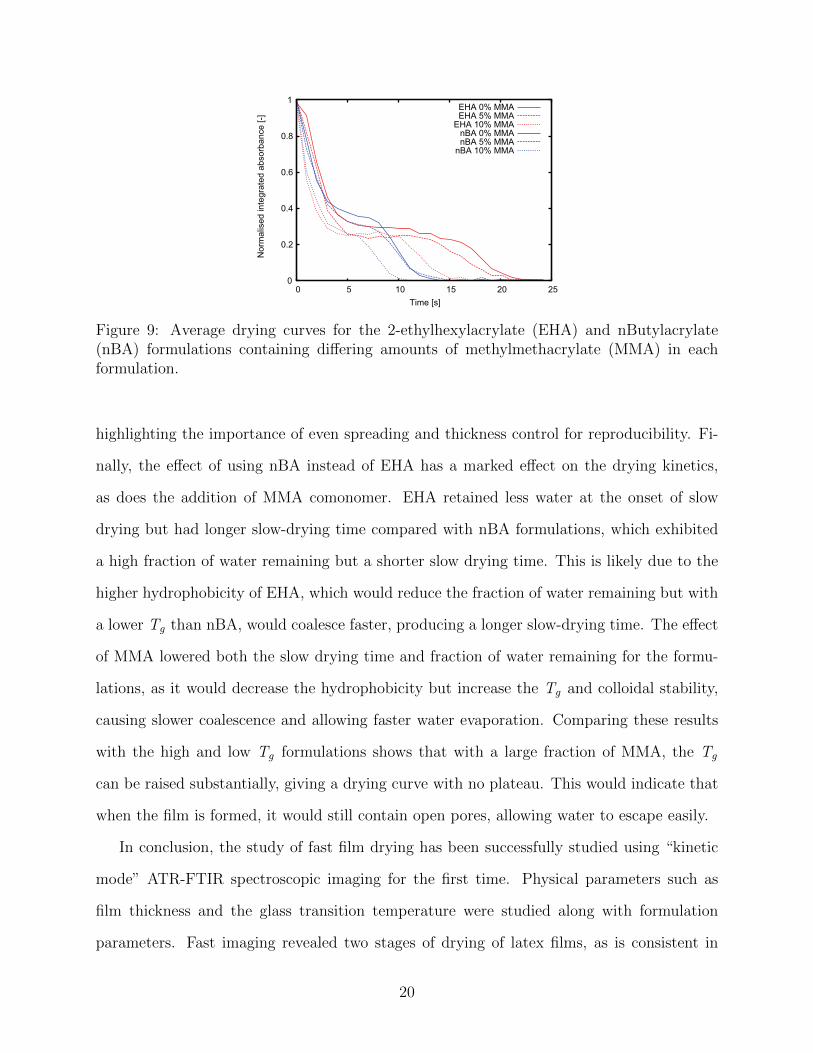
the addition of methylmethacrylate significantly improves the drying characteristics of both
formulations due to the hydrophilic effect of the MMA. Figure 9 shows the drying curves
from these experiments, where it is clear that the addition of MMA improves the drying
characteristics of both EHA and nBA formulations. It can also be seen that EHA formu-
lations have lower fractions of water remaining, potentially due to its lower hydrophilicity,
but extended slow drying times, such that they dry overall more slowly than the nBA for-
mulations. This would indicate formation of a less permeable film for water evaporation
once the particles sinter together, compared with the nBA formulations where at the onset
of slow drying, the water can still permeate. The Tg of the dispersions also increases with
the addition of MMA, which has been shown to decrease the drying time33 as the films
with higher Tg do not coalesce as quickly as those with low Tg . These observations are
consistent with those reported for high and low Tg dispersions and while it is not possible to
view directly the porosity of the film using ATR-FTIR imaging, SEM images indicate that
films with higher Tg retain some of their porosity even after drying, taking much longer for
particle deformation and chain interdiffusion.34,35 It is also known that the colloidal stability
is affected by the presence of MMA, and higher colloidal stability leads to less wet sintering
and thus faster drying.36
Table 1: Table of latex compositions used to study the effects of nBA, EHA and MMA ondrying characteristics.
Figure 8: tslow plotted against the fraction of water remaining for both nBA and EHA for-mulations, with differing amounts of methylmethacrylate in each formulation. The numbersadjacent to the data points indicate the percentage of methylmethacrylate. Error bars arethe standard error based on 4 measurements.
Conclusions
The study of fast-drying thin films has been achieved with spectroscopic imaging, demon-
strating its applicability to these systems. The use of kinetic-mode (scans without coaddi-
tion) allows for the high-speed acquisition of spectral data-cubes which can then be further
processed to extract information about the drying of the film. The observed drying curves are
consistent with current theoretical understanding and further improvements in this area such
as modelling drying films and how the evanescent wave would observe various phenomena
would improve the information available using this method.
The drying of silica nanoparticles demonstrated the drying characteristics of particles
which do not sinter together during drying unlike latex particles. As the silica nanoparticles
were mobile throughout the entire drying process, they agglomerated due to the capillary
forces of the remaining water evaporating. The higher Tg (41 ◦C) dispersion exhibited crack-
ing compared to the film with lower Tg (20 ◦C), indicating that the particles could not sinter
together as the water evaporated. FTIR imaging observed this cracking phenomena which
would not have been observed as easily using single-element spectroscopic detection methods.
The film thickness dramatically affected drying times, especially in the slow-drying region,
19
0
0.2
0.4
0.6
0.8
1
0 5 10 15 20 25
Nor
mal
ised
inte
grat
ed a
bsor
banc
e [-]
Time [s]
EHA 0% MMAEHA 5% MMA
EHA 10% MMAnBA 0% MMAnBA 5% MMA
nBA 10% MMA
Figure 9: Average drying curves for the 2-ethylhexylacrylate (EHA) and nButylacrylate(nBA) formulations containing differing amounts of methylmethacrylate (MMA) in eachformulation.
highlighting the importance of even spreading and thickness control for reproducibility. Fi-
nally, the effect of using nBA instead of EHA has a marked effect on the drying kinetics,
as does the addition of MMA comonomer. EHA retained less water at the onset of slow
drying but had longer slow-drying time compared with nBA formulations, which exhibited
a high fraction of water remaining but a shorter slow drying time. This is likely due to the
higher hydrophobicity of EHA, which would reduce the fraction of water remaining but with
a lower Tg than nBA, would coalesce faster, producing a longer slow-drying time. The effect
of MMA lowered both the slow drying time and fraction of water remaining for the formu-
lations, as it would decrease the hydrophobicity but increase the Tg and colloidal stability,
causing slower coalescence and allowing faster water evaporation. Comparing these results
with the high and low Tg formulations shows that with a large fraction of MMA, the Tg
can be raised substantially, giving a drying curve with no plateau. This would indicate that
when the film is formed, it would still contain open pores, allowing water to escape easily.
In conclusion, the study of fast film drying has been successfully studied using “kinetic
mode” ATR-FTIR spectroscopic imaging for the first time. Physical parameters such as
film thickness and the glass transition temperature were studied along with formulation
parameters. Fast imaging revealed two stages of drying of latex films, as is consistent in
20
literature, and further analysis of the drying curves allows relationships to be established
between physical/formulation parameters and their effects on different drying regimes. High-
speed ATR-FTIR imaging could thus be applied to a wide range of thin-film systems where
rapid mass transfer occurs, allowing formulations to be studied under industrially relevant
conditions which could lead to more effective formulation optimisation.
Acknowledgements
S.G. Kazarian acknowledges support from the EPSRC grant no. EP/L020564/1. We ac-
knowledge the help and advice from Professor Joe Keddie from the University of Surrey,
United Kingdom.
References
(1) Chern, C. Emulsion polymerization mechanisms and kinetics. Prog. Polym. Sci. 2006,
31, 443–486.
(2) Lovell, P.; El-Aasser, M. Emulsion polymerization and emulsion polymers ; J. Wiley,
1997.
(3) Routh, A. F. Drying of thin colloidal films. Rep. Prog. Phys. 2013, 76, 046603–.
(4) Keddie, J. L.; Routh, A. F. In Fundamentals of Latex Film Formation; Pasch, H., Ed.;
Springer Netherlands, 2010.
(5) Steward, P.; Hearn, J.; Wilkinson, M. An overview of polymer latex film formation and