�
�
�
�
�
FAST FASHION RETAIL:
A CONSUMER PERSPECTIVE
Raleshaba Moeng
11096650
A research project submitted to the Gordon Institute of Business Science,
University of Pretoria, in partial fulfilment of the requirements for the degree of
Master of Business Administration.
01 August 2011
Copyright © 2012, University of Pretoria. All rights reserved. The copyright in this work vests in the University of Pretoria. No part of this work may be reproduced or transmitted in any form or by any means, without the prior written permission of the University of Pretoria.
Abstract
The superior financial performance of retailers who utilise Fast Fashion
strategies have focussed attention on these methods while simultaneously
pressurising other retailers to follow suit. Fast Fashion refers to strategies
employed by retailers to meet frequently changing consumer tastes and
demands by optimising their design and production processes.
This study aimed to determine the applicability of Fast Fashion in South Africa
by conducting a study of consumers who frequent fashion retail stores. The
literature review indicated that there were four key Fast Fashion variables that
were related to consumer behaviour: Renewal Cycles, Supply, Quality and
Price.
The findings showed that Renewal Cycles and Price are key variables for
consumers in fashion retail, affecting the frequency of purchases and store
visits. The implication of this result is that retailers who implement Fast Fashion
strategies would do best by selecting strategies that directly impact these key
variables.
���
�
Declaration
I declare that this research project is my own work. It is submitted in partial
fulfilment of the requirements for the degree of Master of Business
Administration at the Gordon Institute of Business Science, University of
Pretoria. It has not been submitted before for any degree or examination in any
other university. I further declare that I have obtained the necessary
authorisation and consent to carry out this research.
Raleshaba Moeng
Name Signature Date
����
�
ACKNOWLEDGEMENTS
To my family
Thank you for the support and encouragement
To my supervisor: Mr Michael Goldman
Thank you for your guidance and advice in compiling this study
To my fellow students
Thank you for sharing this journey with me
���
�
TABLE OF CONTENTS
ABSTRACT ………………………………………………………………………………… I
DECLARATION ………………………………………………………………………… II
ACKNOWLEDGEMENTS ……………………………………………………………… III
TABLE OF CONTENTS ……………………………………………………………… IV
LIST OF FIGURES ………………………………………………………………………… VII
LIST OF TABLES ………………………………………………………………………… VIII
ABBREVIATIONS ………………………………………………………………………… IX
Chapter 1 INTRODUCTION TO THE RESEARCH PROBLEM ………………………… 1
1.1 Introduction ……………………………………………………………… 1
1.2 Defining the research problem and research objectives …..…………… 1
1.2.1 Defining Fast Fashion ………………………………………….… 1
1.2.2 Effects of Fast Fashion …………………………………………… 3
1.3 Need for the research ………………………………………………….…… 4
1.3.1 Link between research objectives and the need for the research. 6
1.4 Summary ……………………………………………….……………………… 7
Chapter 2 LITERATURE REVIEW ………………………….………………………… 8
2.1 Introduction …………….………………………………………………… 8
2.2 Fashion Retail ……………………………….……………………………… 8
2.2.1 Defining Fashion …………………………………………………… 8
2.2.2 The nature of Fashion Retail ……………………………….… 10
2.3 Fast Fashion ……………………………………………………………… 13
2.3.1 Components of Fast Fashion …………………………………. 15
2.4 Consumer Behavior …………………………………………………….. 19
2.4.1 Key Consumer Variables ………………………………………..… 21
2.5 Conclusion ………………………………………………………………….…… 27
Chapter 3 RESEARCH PROPOSITIONS ………………………………..………… 28
3.1 Introduction ……………………………………………………….…… 28
3.2 Research Propositions …………………………………………….……… 28
Chapter 4 RESEARCH METHODOLOGY …………………………………….…… 30
4.1 Introduction ………………………………………………………….…… 30
4.2 Research Design ………………………………………………………….…… 30
��
�
4.3 Unit of Analysis ………………………………….…………………………… 31
4.4 Population ……………………………………………………………………… 31
4.5 Sampling Method ……………………………………………………………… 32
4.6 Sample Size ……………………………………………………………… 33
4.7 Instrument ……………………………………………………………………… 34
4.8 Data Collection ……………………………………………………………… 36
4.9 Data Analysis ……………………………………………………………… 40
4.10 Potential Research Limitations …………………………………………… 41
4.11 Conclusion ……………………………………………………………………… 41
Chapter 5 RESULTS ………………………………………………………………………… 42
5.1 Introduction ……………………………………………………………… 42
5.2 Sample Description ……………………………………………………………… 42
5.3 Data Evaluation ……………………………………………………………… 43
5.4 Survey Results ……………………………………………………………… 44
5.4.1 Demographic Information …………………………………………… 45
5.4.2 Purchase Behavior …………………………………………… 47
5.5 Testing the Research Propositions ………………………………………….. 49
5.5.1 Research Proposition 1 – Renewal Cycle ………………………… 51
5.5.1.1 Descriptive statistics and test for normality ……. 51
5.5.1.2 Inferential Statistics – Correlation ……………… 52
5.5.1.3 Regression Analysis …………………………………. 54
5.5.1.4 Research Proposition 1 – Conclusion ……………… 57
5.5.2 Research Proposition 2 – Supply ………………………………… 58
5.5.2.1 Descriptive statistics and test for normality …… 58
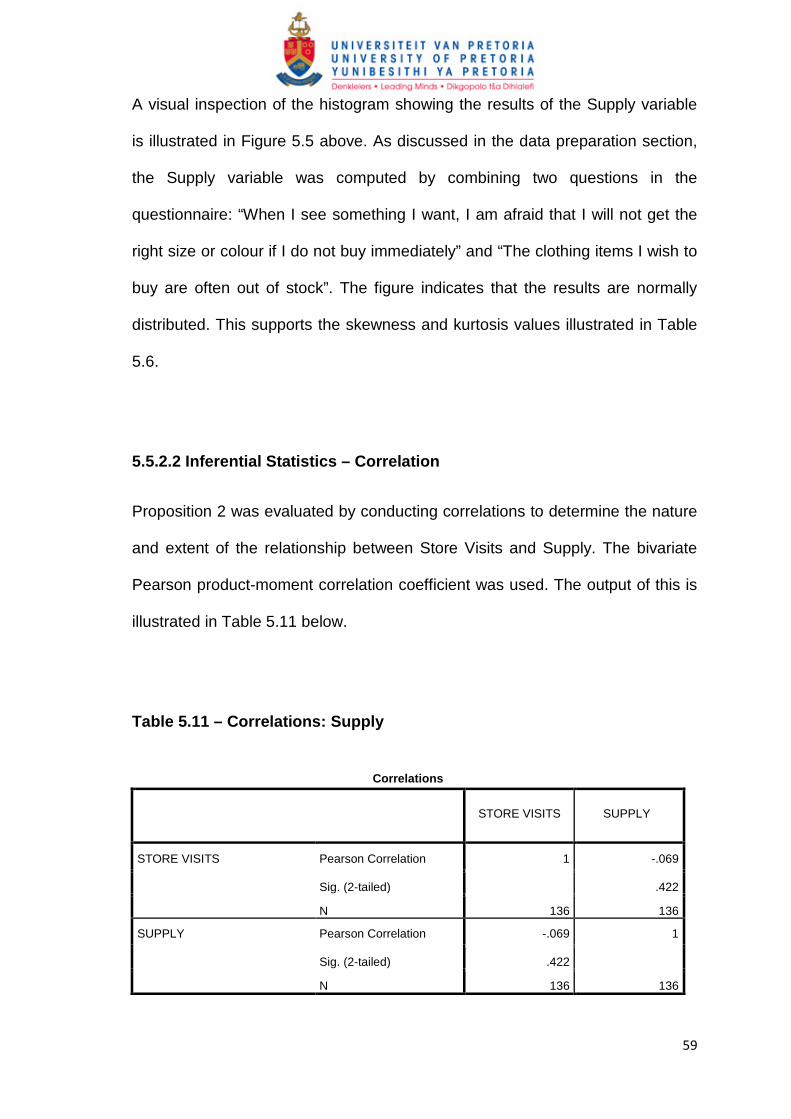
5.5.2.2 Inferential Statistics – Correlation ……………… 59
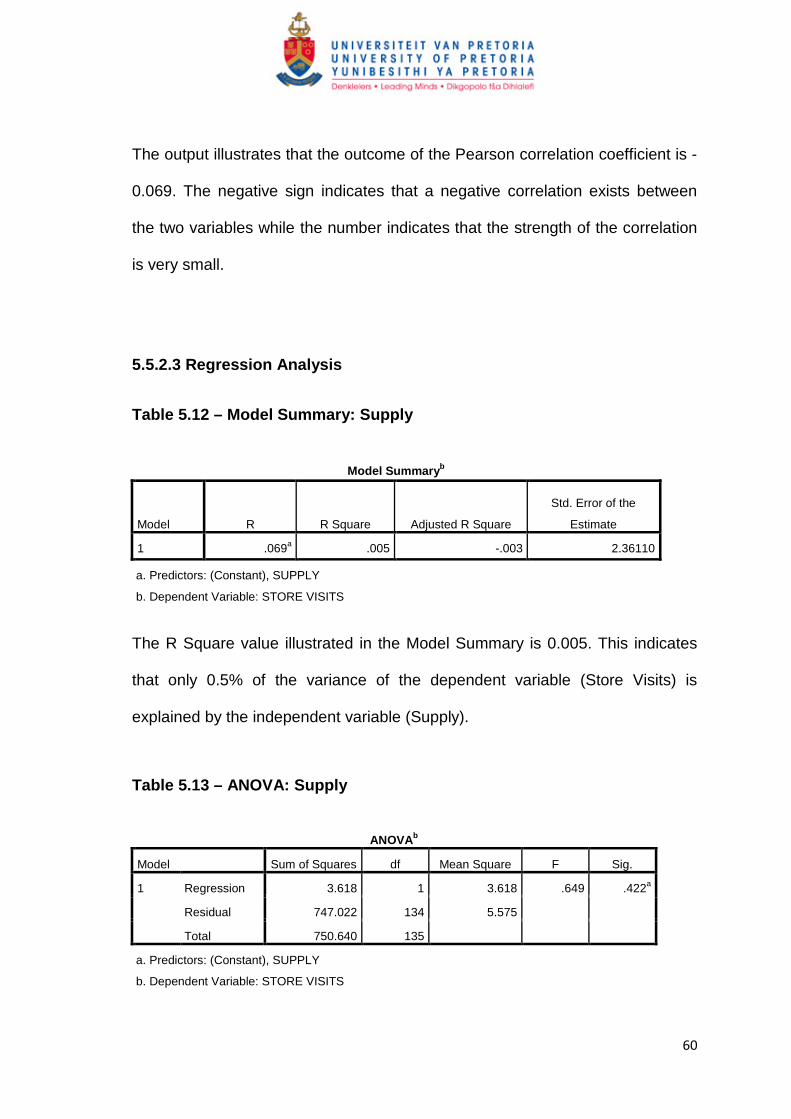
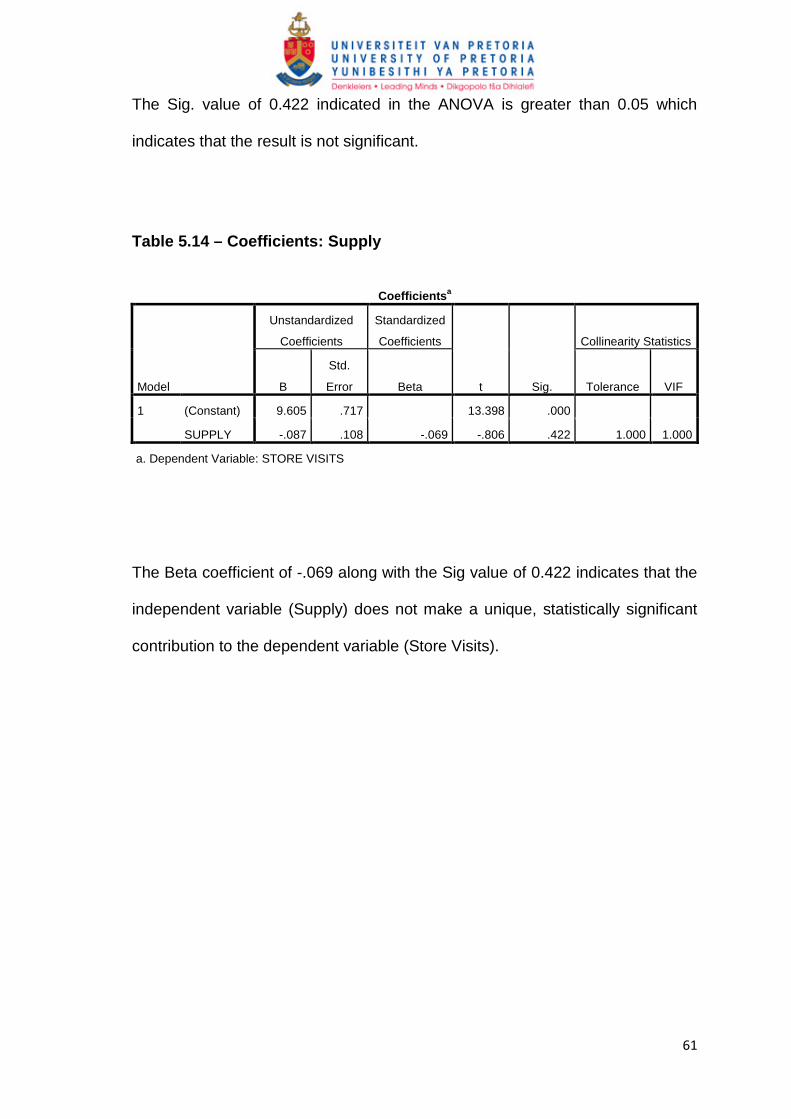
5.5.2.3 Regression analysis ………………………………… 60
5.5.2.4 Research Proposition 2 – Conclusion ……………… 62
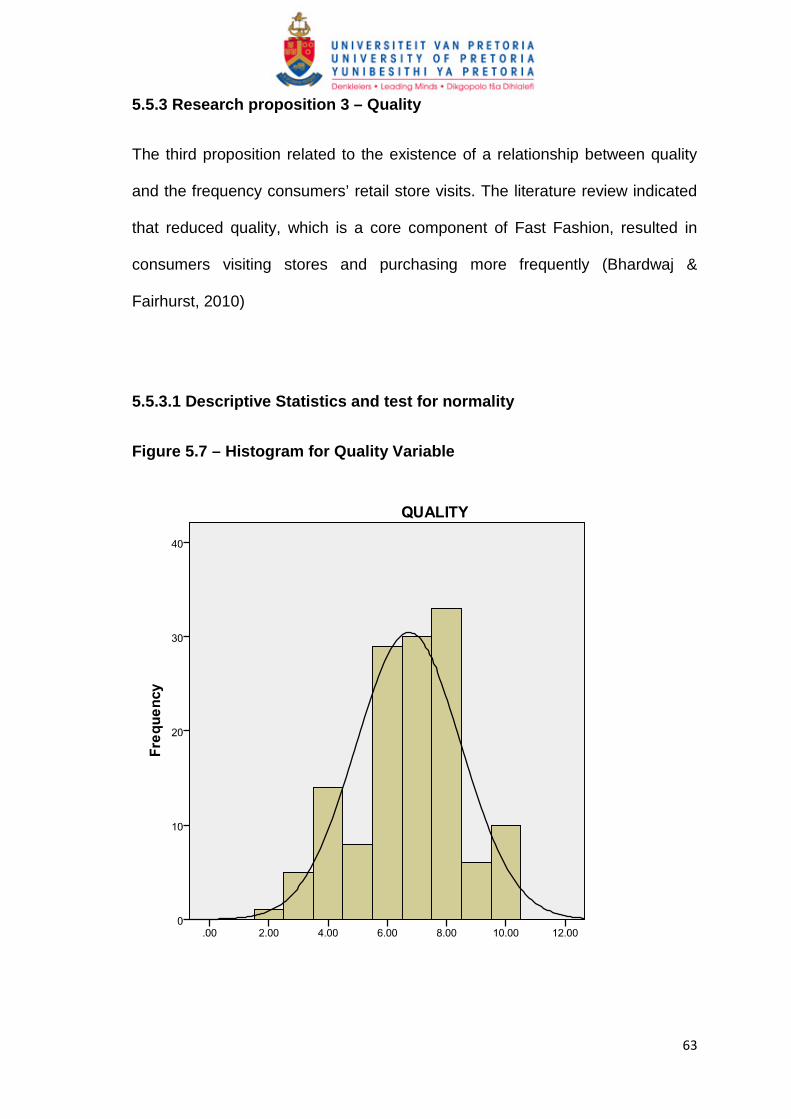
5.5.3 Research Proposition 3 – Quality …………………………………… 63
5.5.3.1 Descriptive statistics and test for normality ……… 63
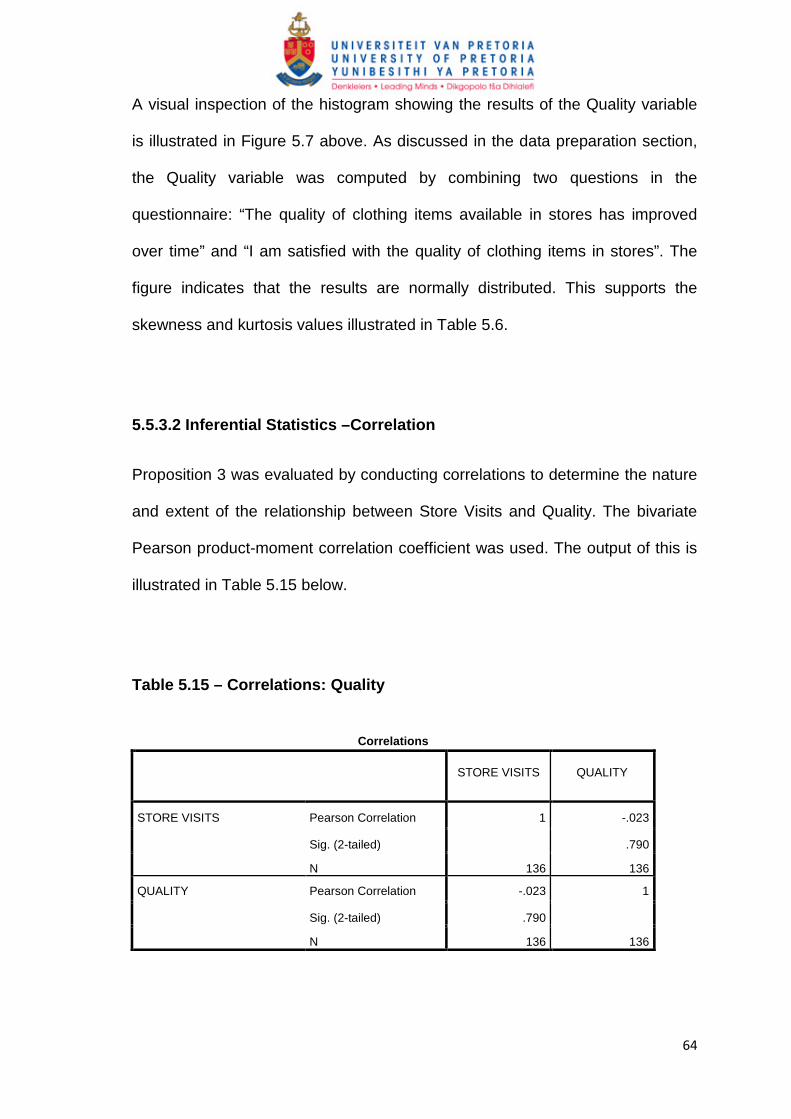
5.5.3.2 Inferential Statistics – Correlation ………………. 64
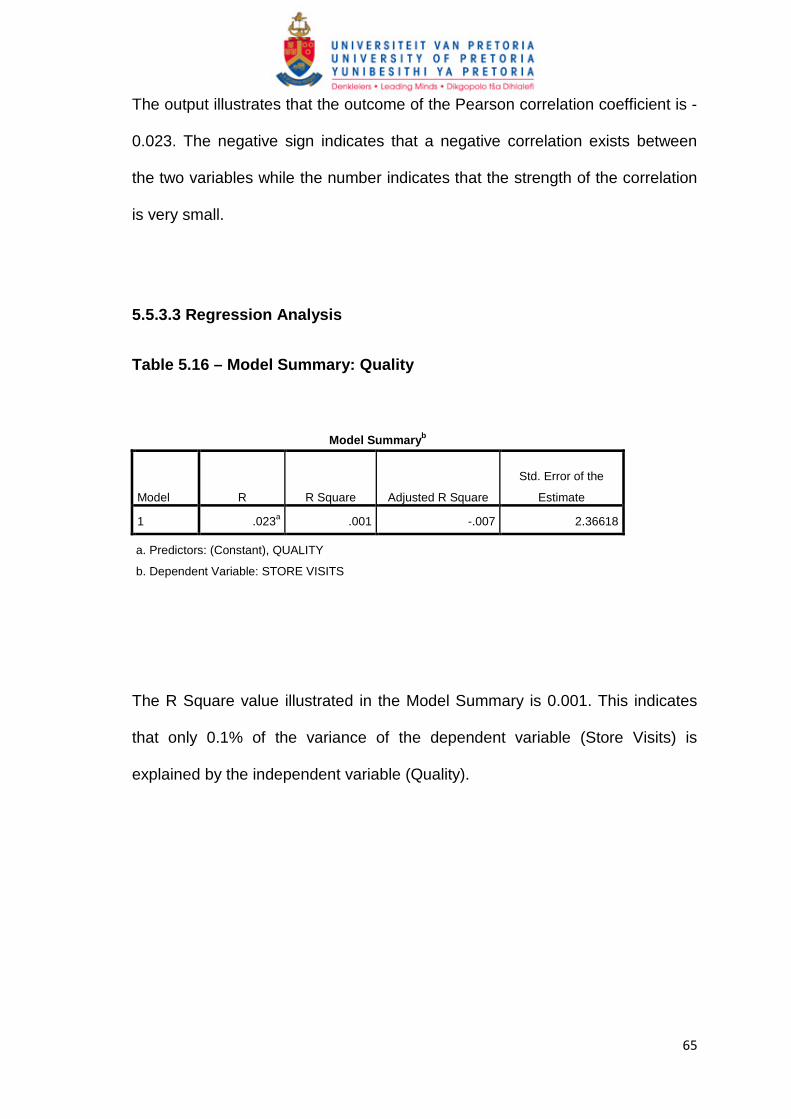
5.5.3.3 Regression Analysis …………………………….…. 65
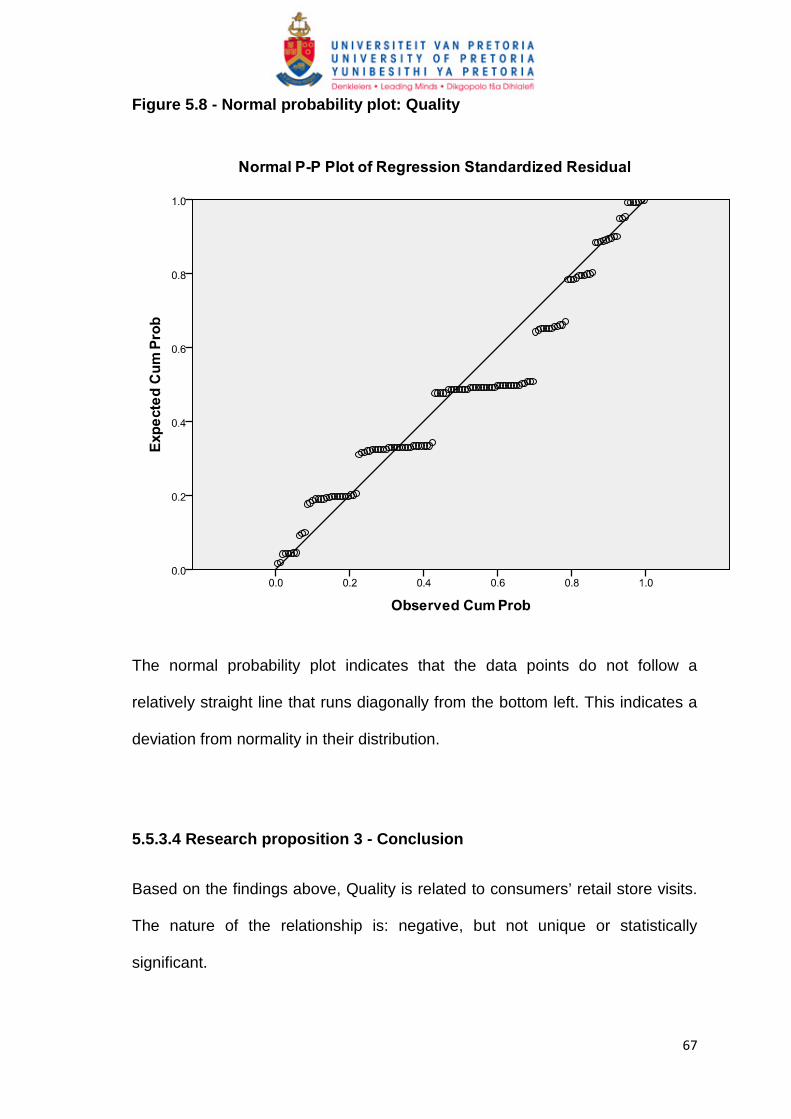
5.5.3.4 Research Proposition 3 – Conclusion …………..… 67
���
�
5.5.4 Research Proposition 4 – Price ……………………………….. 68
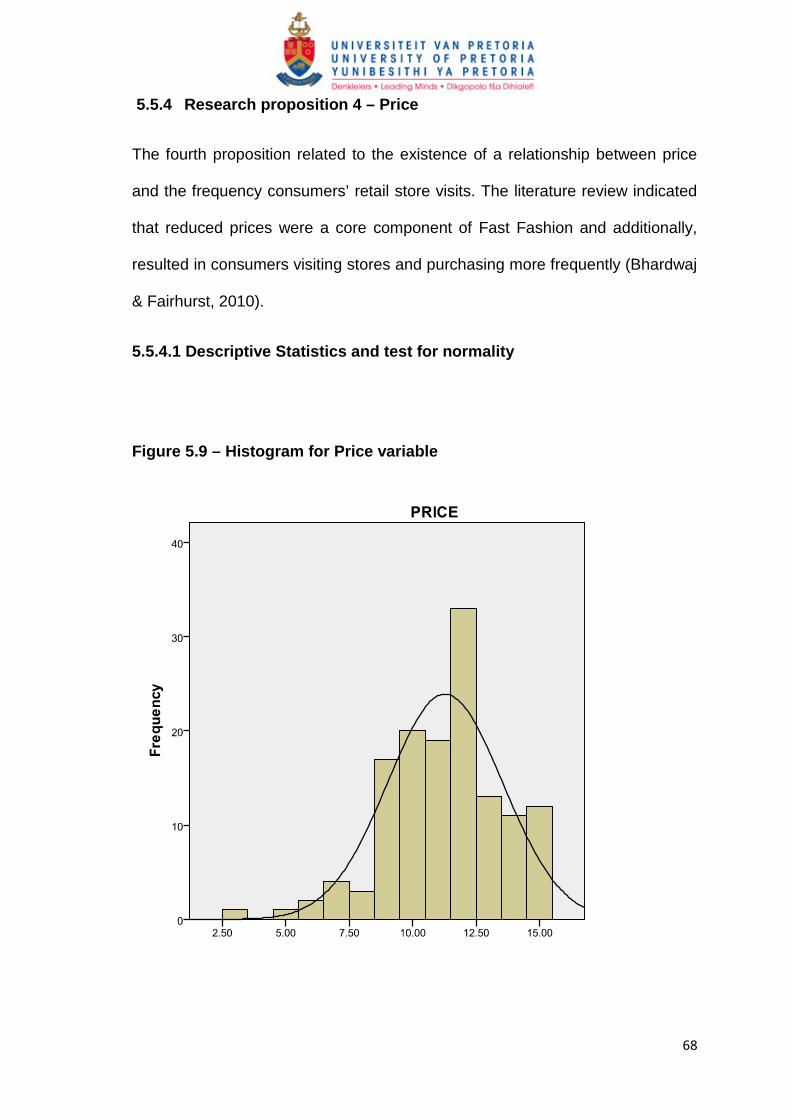
5.5.4.1 Descriptive statistics and test for normality …….. 68
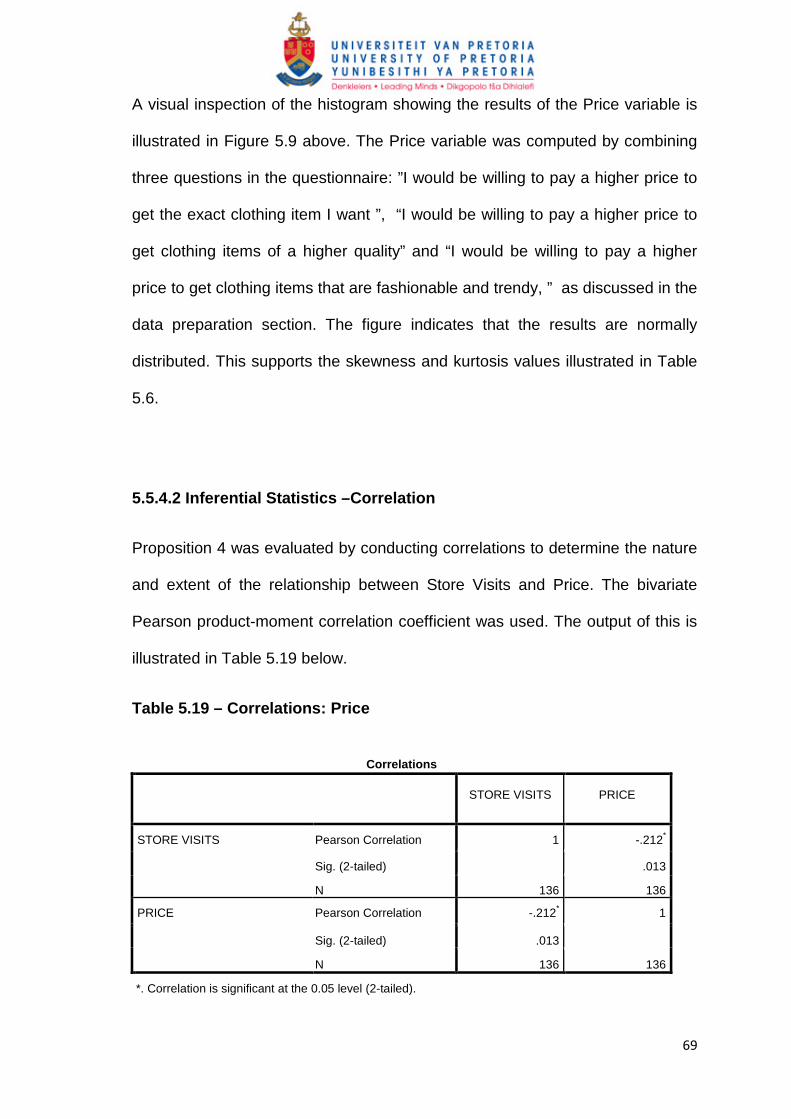
5.5.4.2 Inferential Statistics – Correlation ………………. 69
5.5.4.3 Regression Analysis ………………………………….. 70
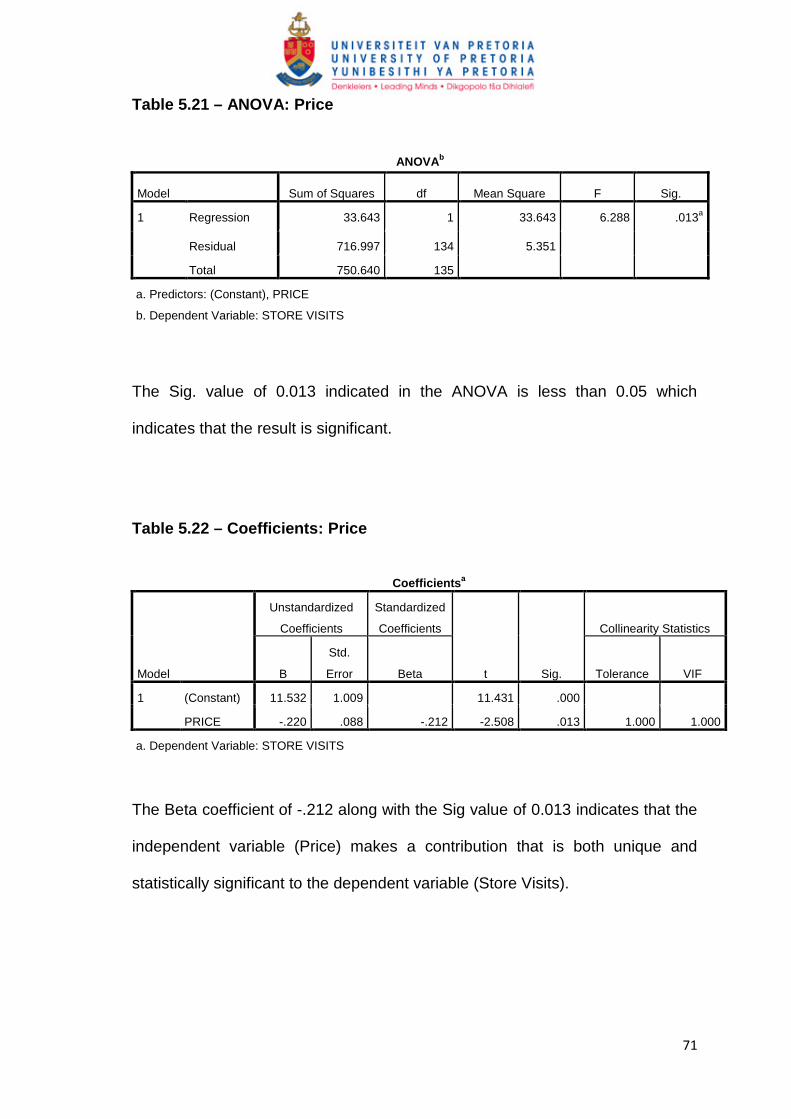
5.5.4.4 Research Proposition 4 – Conclusion ………………. 72
5.5.5 Research Proposition 5 – Gender …………………………………. 73
5.5.5.1 Descriptive Statistics …………………………………. 73
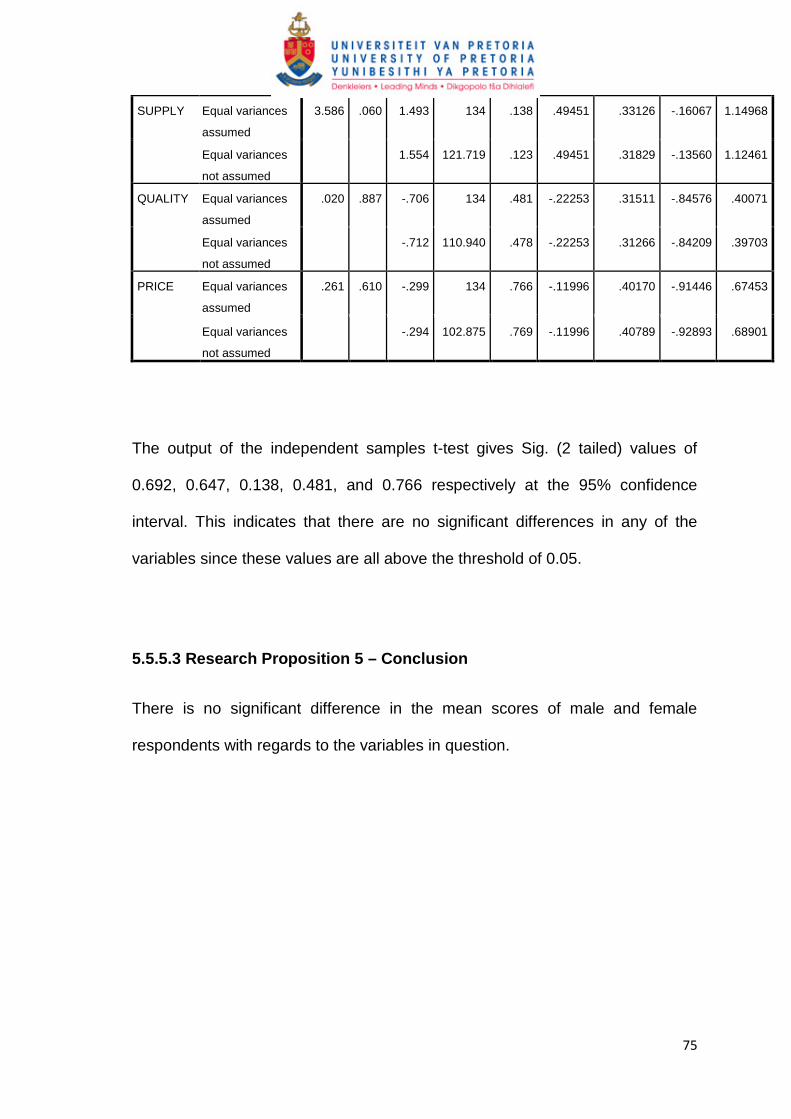
5.5.5.2 Inferential Statistics – t-test for means ……………… 74
5.5.5.3 Research Proposition 5 – Conclusion ……………… 75
Chapter 6 DISCUSSION OF RESULTS ……………………………………………………. 76
6.1 Introduction ……………………………………………………………… 76
6.2 Research proposition 1 – Renewal Cycles ………….……………………… 78
6.3 Research proposition 2 – Supply …………………………………….…….. 79
6.4 Research proposition 3 – Quality …………………………………….…….. 80
6.5 Research proposition 4 – Price ……………………………………..……. 81
6.6 Research proposition 5 – Gender ……………………………………..……. 81
6.7 Conclusion ………………………………………………………………………. 82
Chapter 7 CONCLUSIONS AND RECOMMENDATIONS ………………………… 83
7.1 Introduction ………………………………………………………………. 83
7.2 Summary of Key Findings …………………………………..………………… 83
7.3 Research Limits …………………………………..…………………….…… 84
7.4 Recommendations ……………………………………………………………… 85
7.5 Suggestions for Further Research …………………………………………… 86
7.6 Conclusion ………………………………………………………..………………… 86
REFERENCES ……………………………………………………………………………..…….. 88
APPENDICIES ……………………………………………………………………………….….. 94
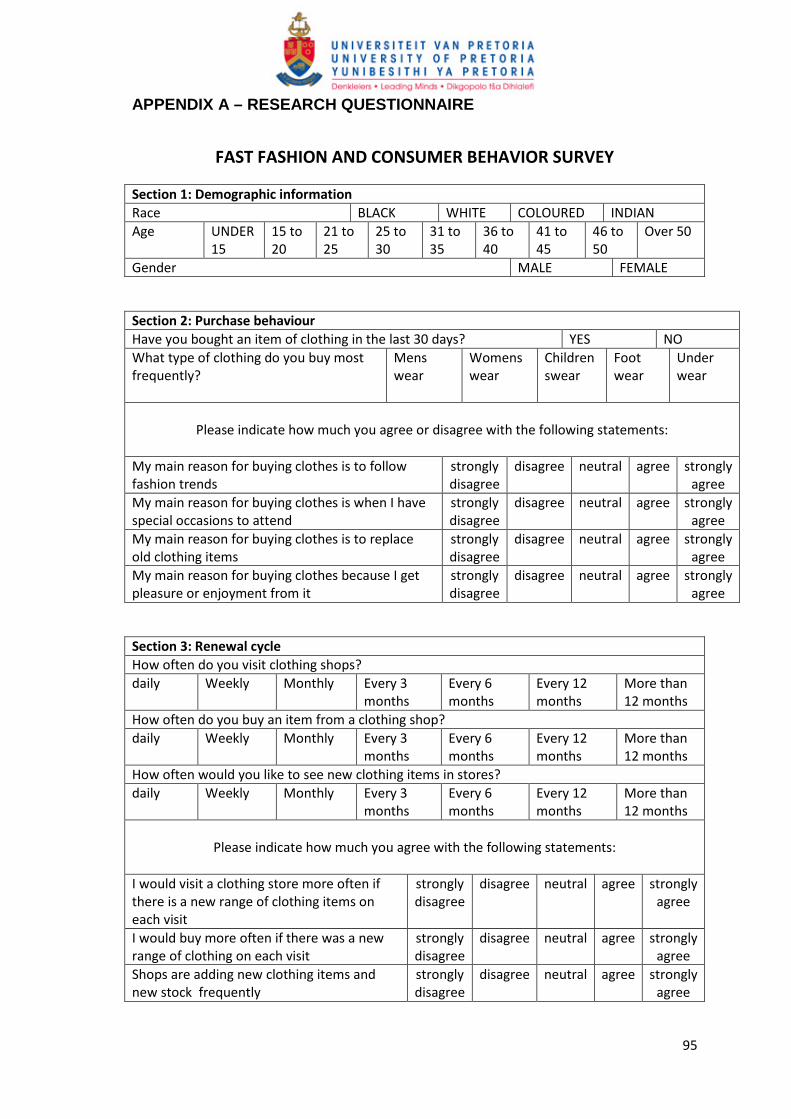
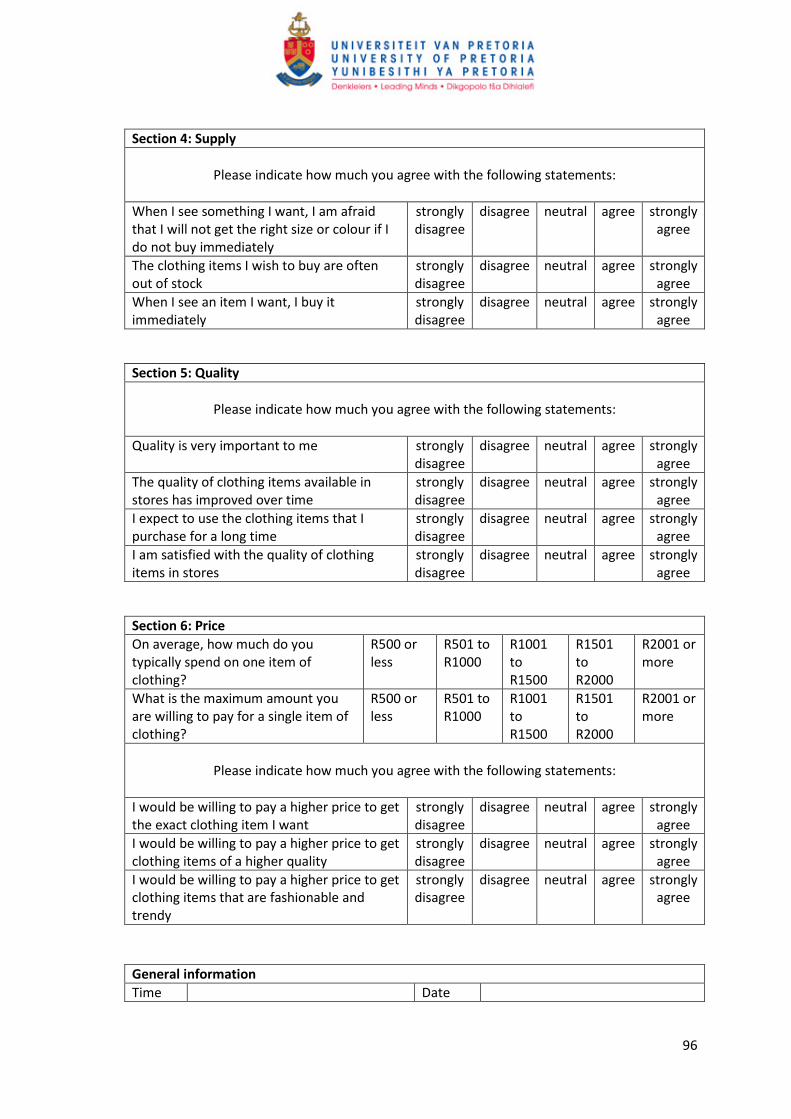
APPENDIX A – Questionnaire ………………………………………………………………. 95
����
�
LIST OF FIGURES
FIGURE PAGE
Figure 2.1 – Theoretical perspectives on Fast Fashion ………………… 16
Figure 2.2 – Holistic definition of Fast Fashion …………………………. 19
Figure 5.1 – Clothing category purchased most frequently …………. 47
Figure 5.2 – Histogram of Store Visits …………………………………. 52
Figure 5.3 – Histogram of Renewal Cycles variable …………………. 53
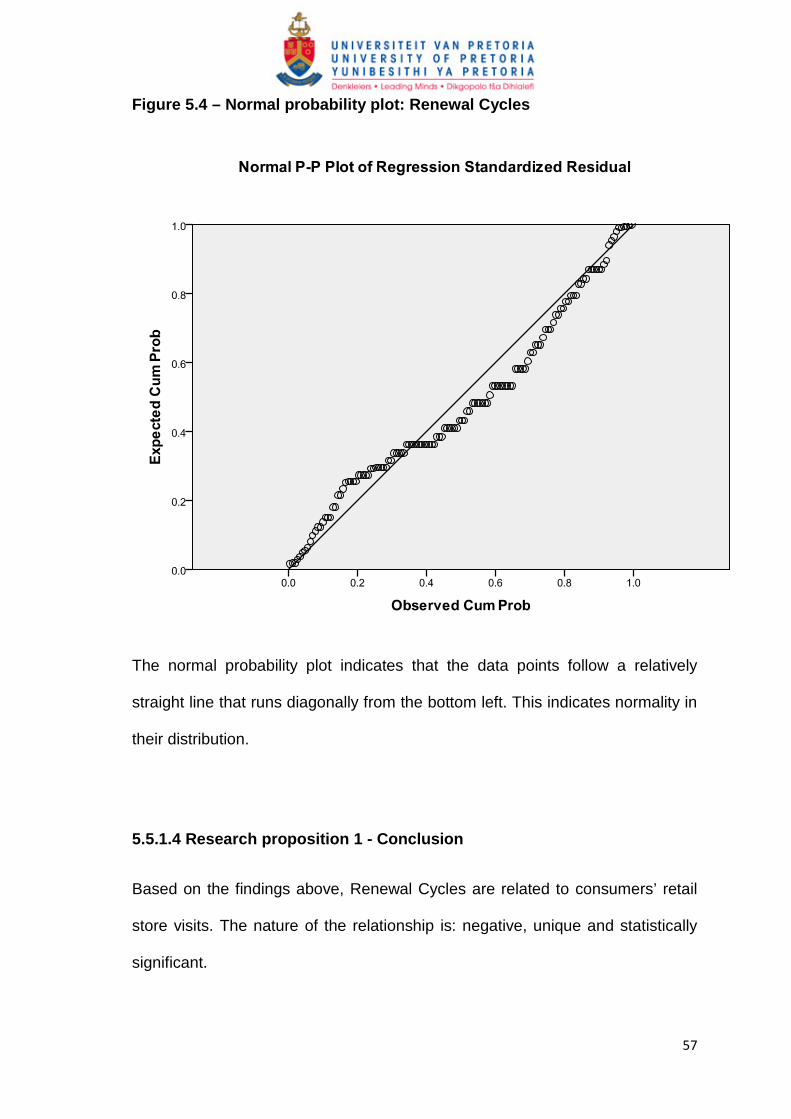
Figure 5.4 – Normal probability plot: Renewal Cycles ………………… 57
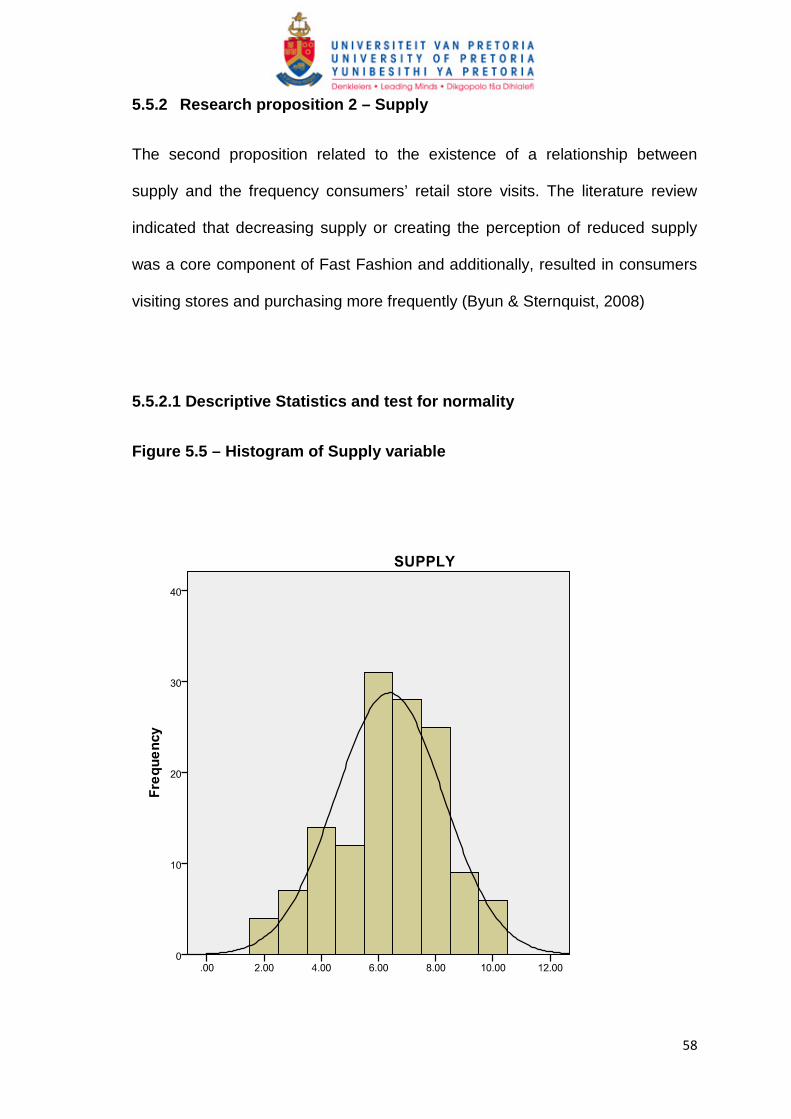
Figure 5.5 – Histogram of Supply variable ………………………… 58
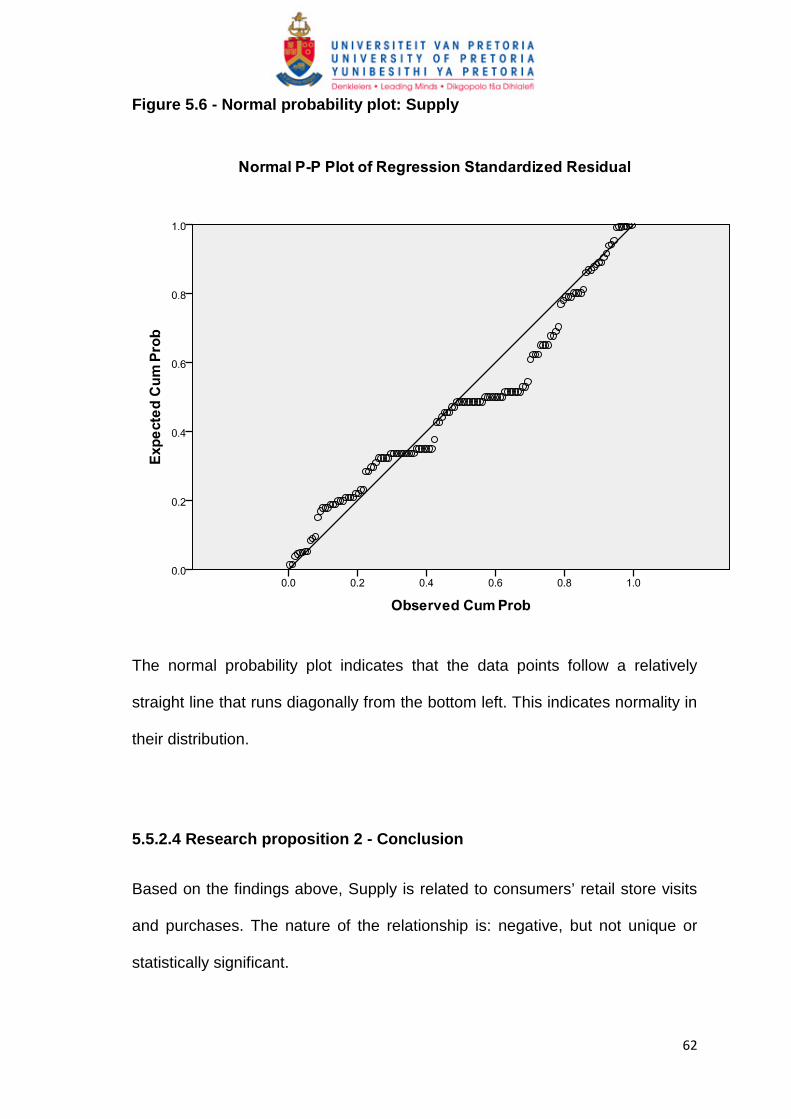
Figure 5.6 - Normal probability plot: Supply ………………………… 62
Figure 5.7 – Histogram for Quality Variable ………………………… 63
Figure 5.8 - Normal probability plot: Quality ………………………… 67
Figure 5.9 – Histogram for Price variable ………………………… 68
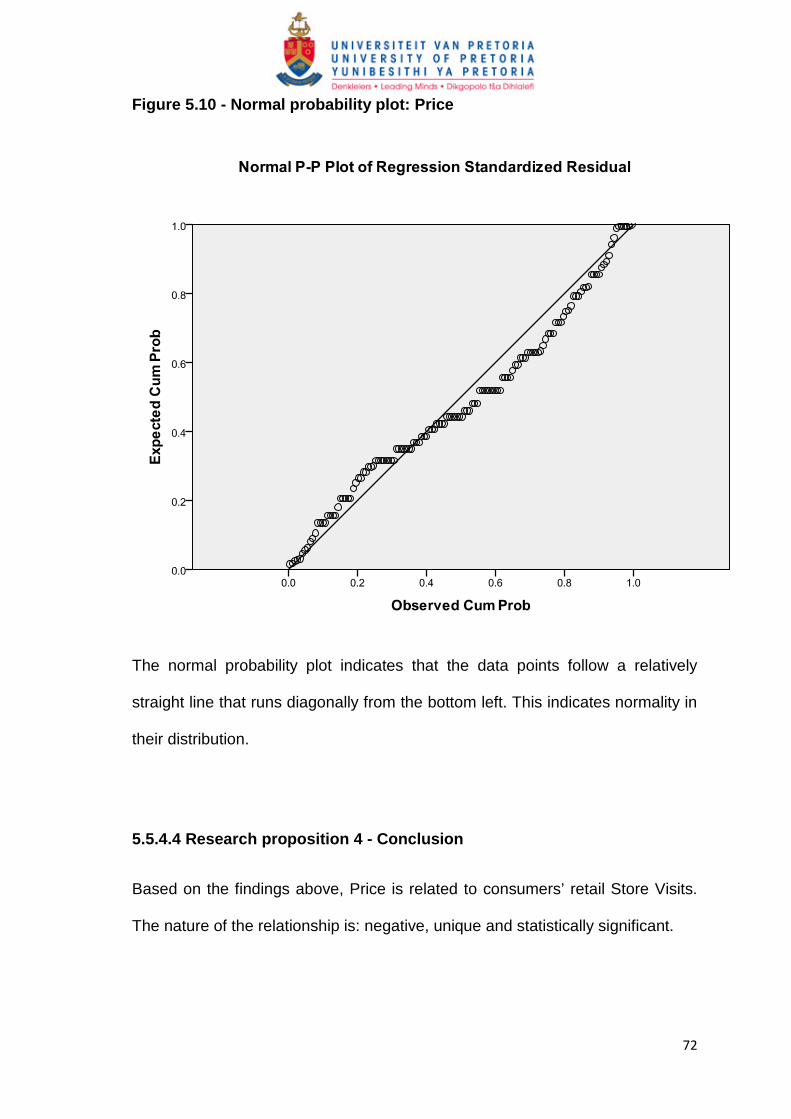
Figure 5.10 - Normal probability plot: Price ………………………… 72
�����
�
LIST OF TABLES
TABLE PAGE
Table 5.1 – Sample Description ……………………………………………. 42
Table 5.2 – Race profile of the sample ……………………………………. 45
Table 5.3 – Age profile of the sample ……………………………………. 46
Table 5.4 – Gender profile of the sample ……………………………. 46
Table 5.5 Descriptive statistics ……………………………………………. 48
Table 5.6 – Descriptive Statistics: skewness and kurtosis …………….. 50
Table 5.7 – Correlations: Renewal Cycles ………………………….... 54
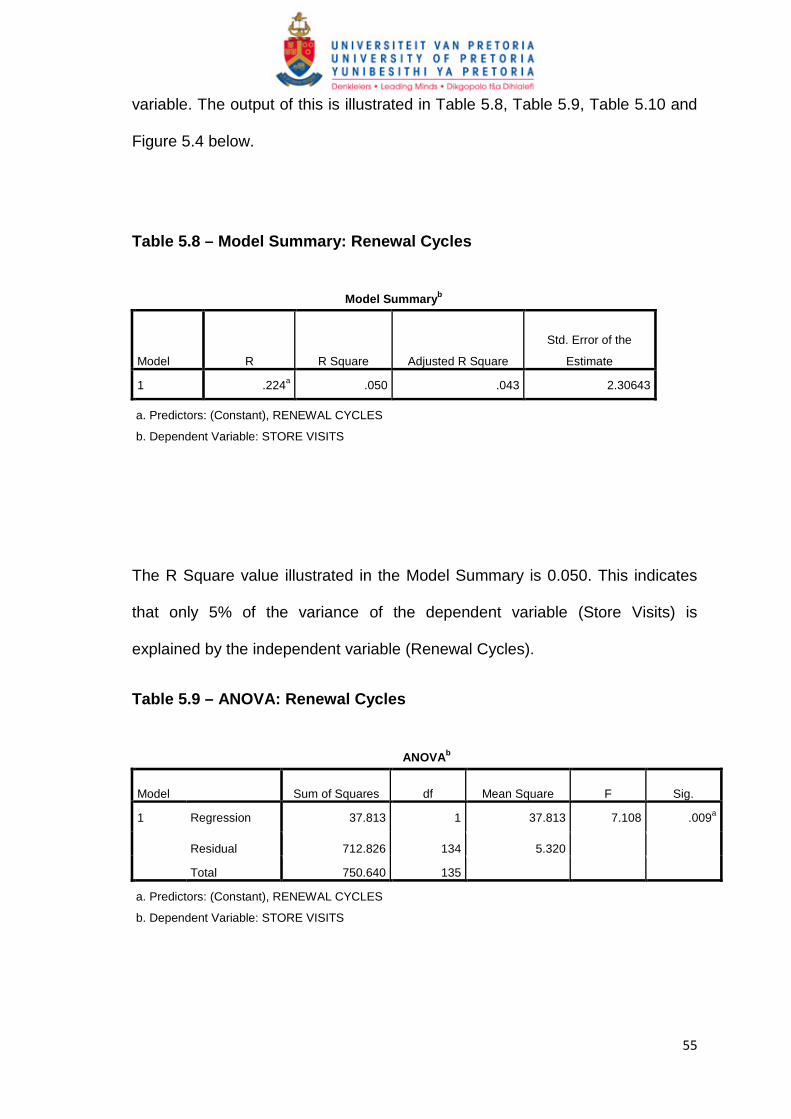
Table 5.8 – Model Summary: Renewal Cycles …………………………….. 55
Table 5.9 – ANOVA: Renewal Cycles ……………………………………. 55
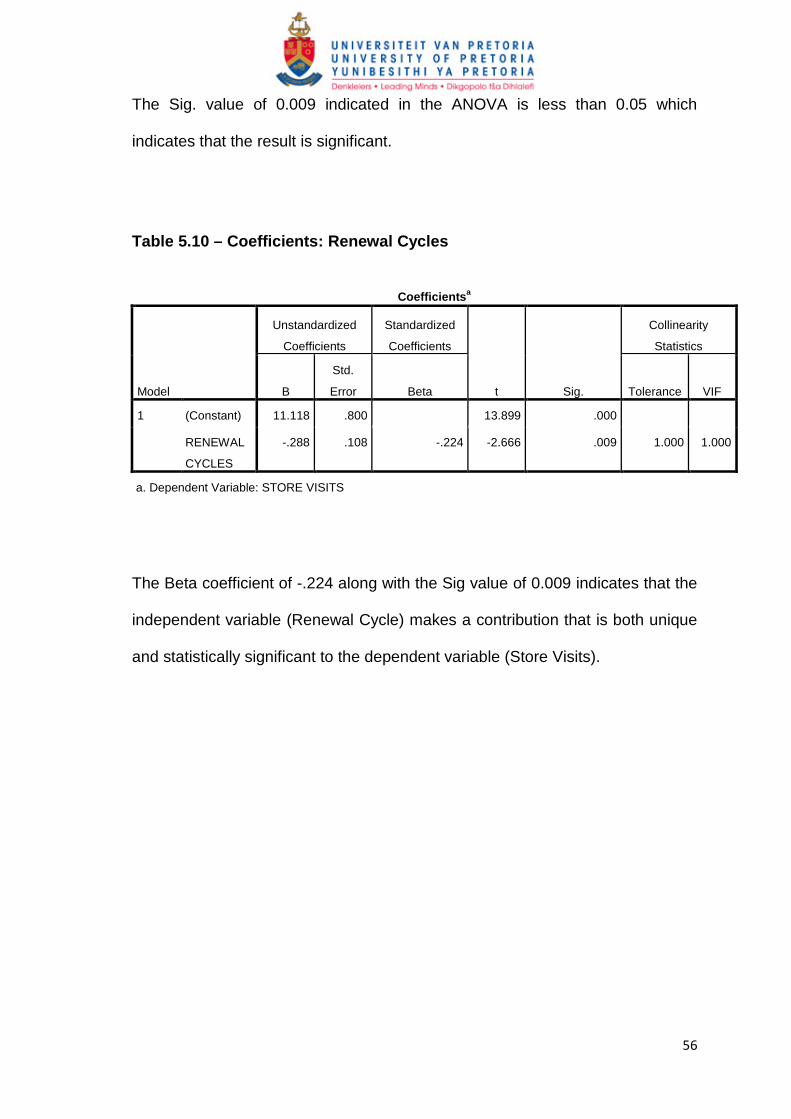
Table 5.10 – Coefficients: Renewal Cycles ……………………………. 56
Table 5.11 – Correlations: Supply ……………………………………. 59
Table 5.12 – Model Summary: Supply …………………………………… 60
Table 5.13 – ANOVA: Supply …………………………………………… 60
Table 5.14 – Coefficients: Supply …………………………………………… 61
Table 5.15 – Correlations: Quality …………………………………… 64
Table 5.16 – Model Summary: Quality …………………………………… 65
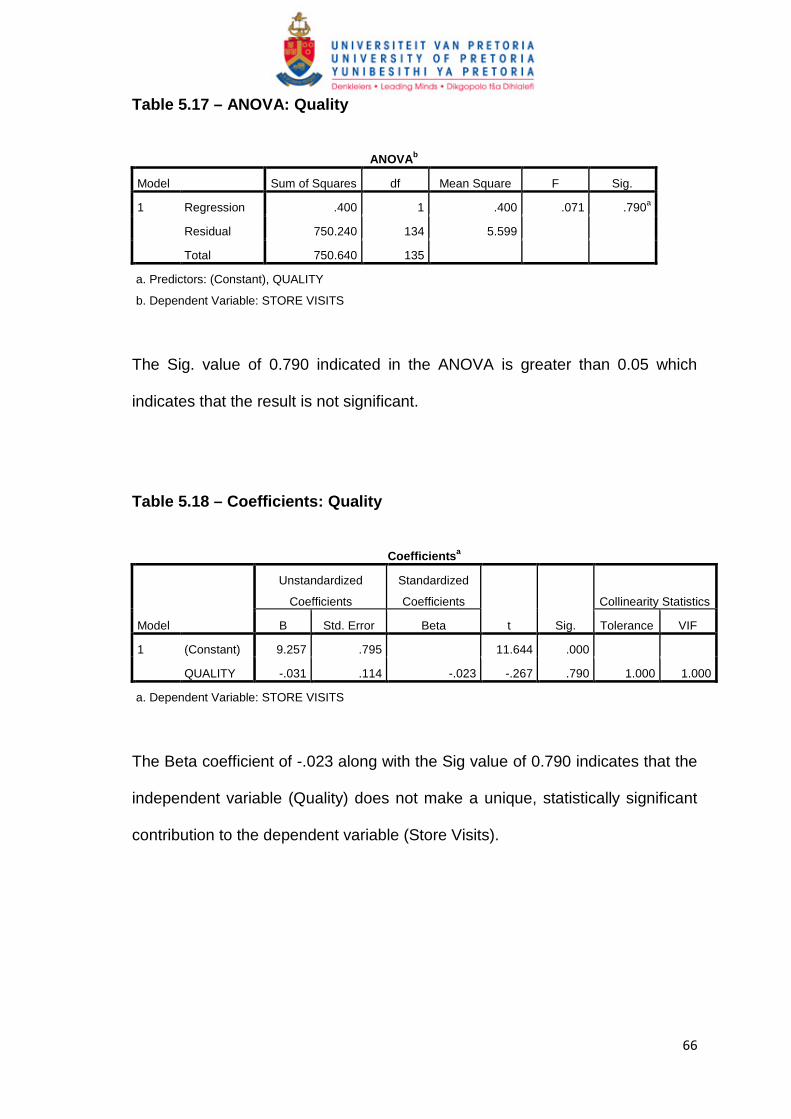
Table 5.17 – ANOVA: Quality …………………………………………… 66
Table 5.18 – Coefficients: Quality …………………………………… 66
Table 5.19 – Correlations: Price …………………………………………… 69
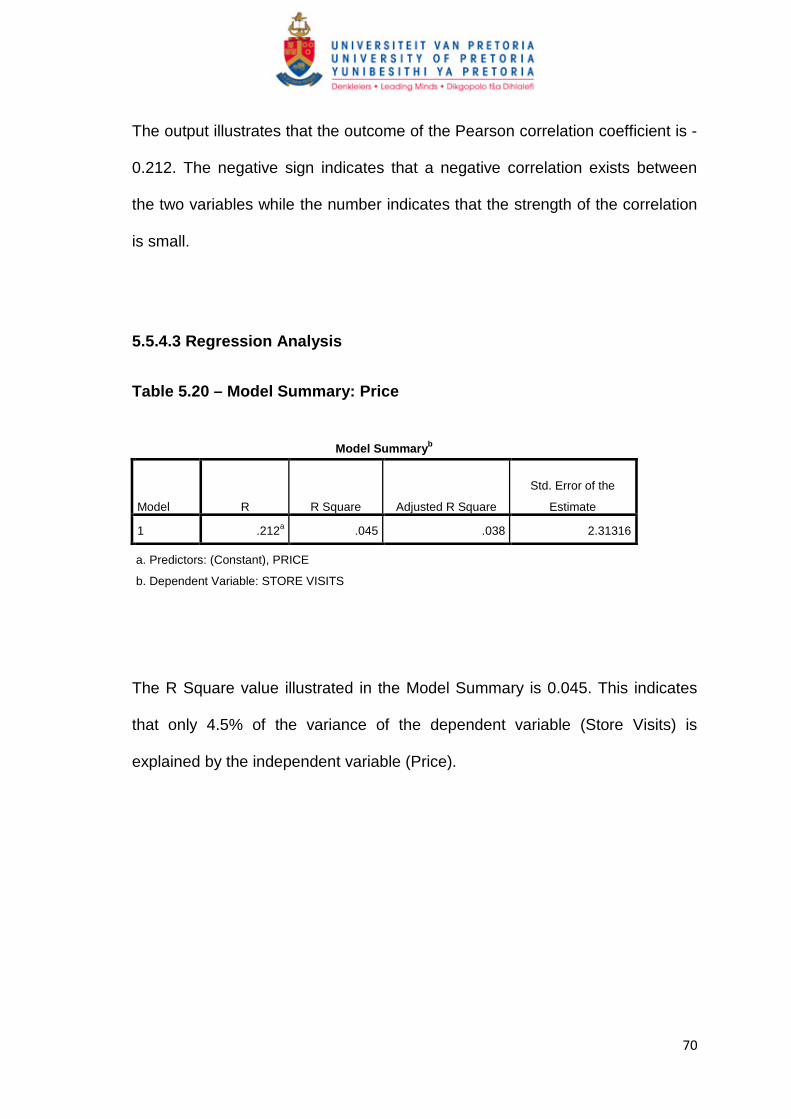
Table 5.20 – Model Summary: Price …………………………………… 70
Table 5.21 – ANOVA: Price …………………………………………… 71
Table 5.22 – Coefficients: Price …………………………………………… 71
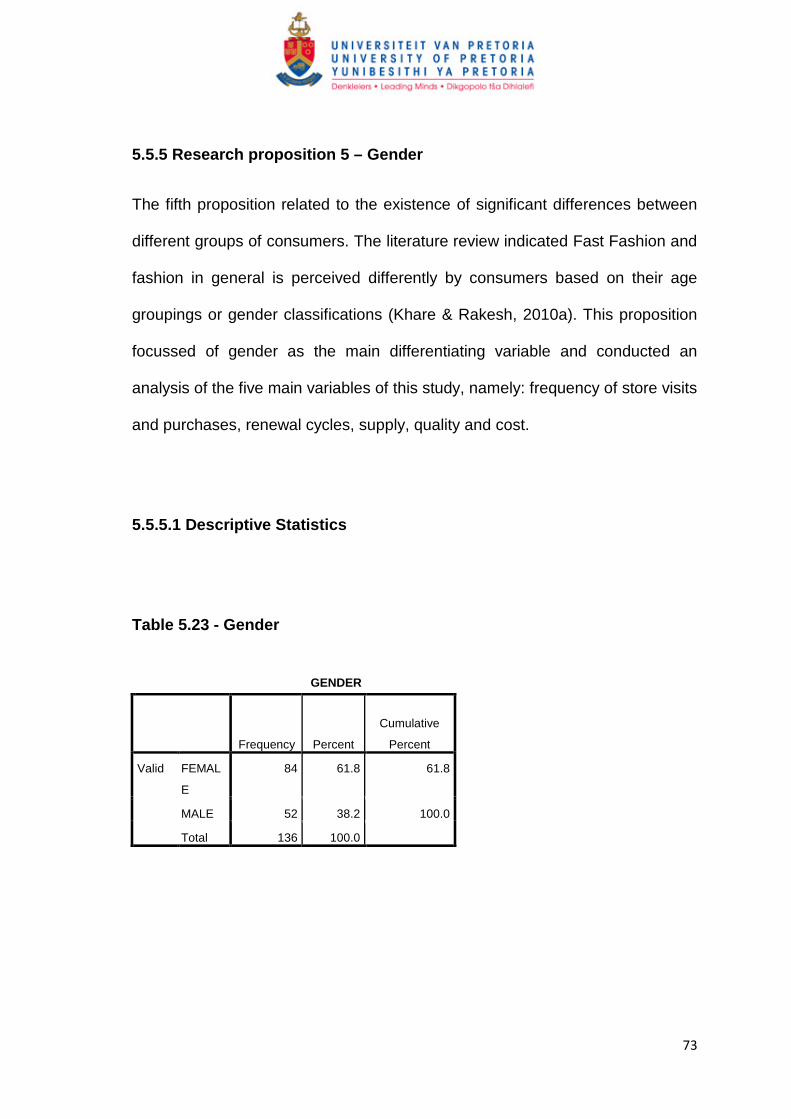
Table 5.23 – Gender …………………………………………………… 73
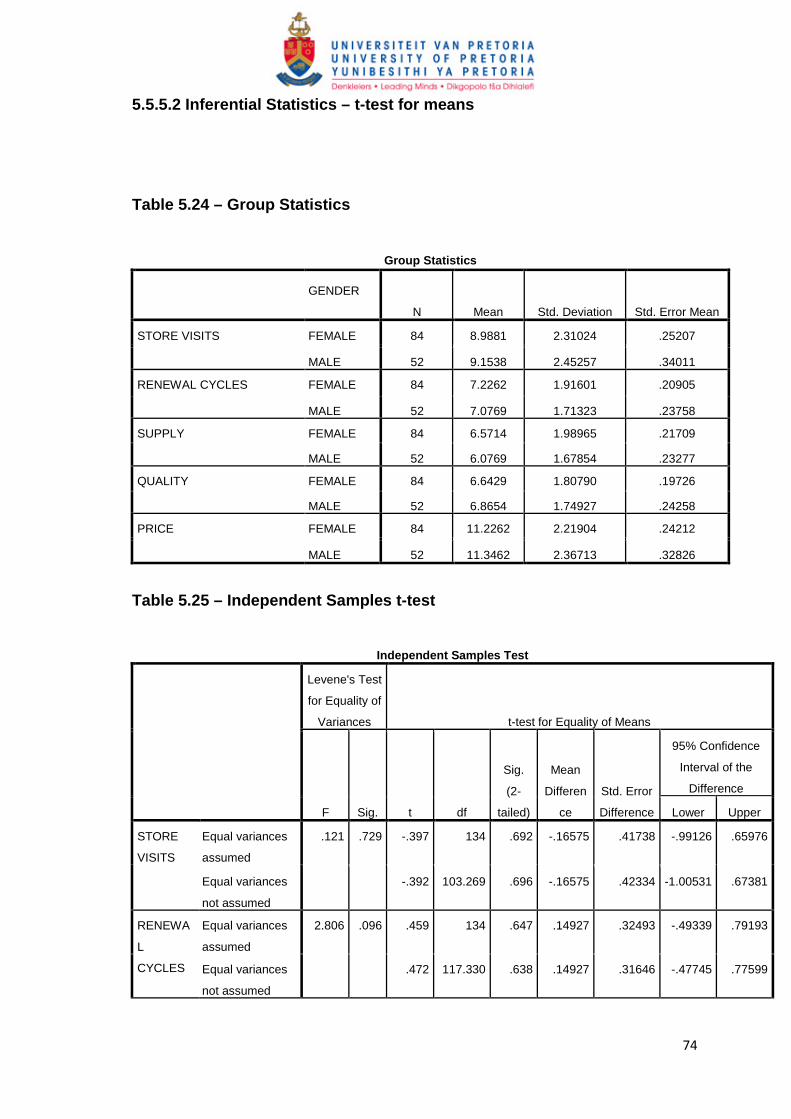
Table 5.24 – Group Statistics …………………………………………… 74
Table 5.25 – Independent Samples t-test ……………………………. 74
� �
���
�
ABBREVIATIONS
TFG – The Foschini Group
QR – Quick Response
JIT – Just-In-Time
��
�
Chapter 1: INTRODUCTION TO THE RESEARCH PROBLEM
1.1 Introduction
This chapter defines the research problem as well as the aims and objectives of
the research. The need for the research is explored from an academic as well
as a business perspective. Additionally, the relationship between the research
problem and the research objectives is defined.
1.2 Defining the research problem and research objectives
The objective of this study is to determine the applicability of Fast Fashion in
South Africa by conducting a study of consumers who frequent fashion retail
stores. The research problem is discussed below under the following headings:
Defining Fast Fashion, and Effects of Fast Fashion.
1.2.1 Defining Fast Fashion
In an article published in the Businessday (2011, June 6), The Foschini Group
(TFG), one of South Africa’s largest retailers reported a 15.5% increase in
turnover and an increase of 19.5% in the sales of its clothing due to their
adoption of Fast Fashion. This report was significant not only because of the
magnitude of the increases but also because it is the first instance where a
��
�
South African enterprise has credited their success to the adoption of Fast
Fashion.
Fast moving fashion or Fast Fashion describes a scenario where fashion
retailers implement a range of strategies in order to adequately meet market
demand by ensuring that they have the right product, in the right place at the
right time (Hayes & Jones, 2006). Although the concept began as a method
used by European retailers to gain competitive advantage in the market, it has
since been accepted globally as a critical requirement of modern day fashion
retail.
Fast Fashion is a term that describes a range of systems that aim to give a
fashion retailer an advantage in two areas: enhanced design and rapid
production (Cachon & Swinney, 2009b). Enhanced design is concerned with
achieving better integration with consumers in an attempt to provide goods that
meet their changing preferences and tastes while rapid production is concerned
with integrating elements of the supply chain in an attempt to minimise lead
times in business operations.
In the case of The Foschini Group, the superior set of annual results was
credited to the organisations adoption of three specific aspects of Fast Fashion;
reduced lead times, improved customer orientation and changing the criteria
used to select suppliers (Businessday, 2011, June 6).
��
�
Globally, there is a growing body of evidence which demonstrates that retailers
who follow a Fast Fashion strategy are able to sell their stock more quickly and
are more profitable than the ones who choose not to (Hayes & Jones, 2006). As
a result, Fast Fashion is seen as the key strategy for success in fashion retail
because of its unique combination of reduced production time and ability to
adapt to changes in consumer preferences.�
1.2.2 Effects of Fast Fashion
The enormity of the challenges faced by retailers is best described by the
following statement: “retailers must commit to their order quantities in advance
of observing sales. As a result, they often end up with some popular products
that sell out fast, whereas other unpopular products languish” (Liu & Ryzin,
2008, p. 1115). This results in loss of sales due to stock outs combined with
further losses that may result from having to sell unpopular stock at a discount.
An additional challenge is that modern consumers have adapted to this
deficiency in retailers operations and are increasingly timing their purchases to
coincide with sales and price reductions, resulting in further revenue losses for
retailers.
Fast Fashion strategies evolved as a response to the problems faced by
retailers and they have been demonstrated to provide a wide range of positive
effects. These effects include an increased consumer traffic in stores as well as
��
�
an improvement in ratios that measure the proportion of store visitors who
actually end up making a purchase (Barry, 2004).
The increased consumer traffic is quantified by Spanish fashion retailer Zara,
which is considered to be the worlds’ leading Fast Fashion retailer. The
organisation estimates that it gets an average of 17 visits per customer per year
compared with an average of four visits for other fashion firms (Castro, 2003
quoted in Lopez & Fan, 2009).
Findings of this nature have led to the emerging view that the basis for
competitive advantage in the fashion retail sector has shifted from aspects,
such as price and assortment towards having the ability to respond timeously to
changing fashion trends and evolving consumer demand (Barnes & Lea-
Greenwood, 2006).
1.3 Need for the Research
Emerging global trends such as the Fast Fashion model are changing the
conventional retail practices and have had a worldwide impact on business and
consumers alike. In spite of this, there is an existing gap in the literature in
terms of the consumer aspects of Fast Fashion.
The existing body of knowledge includes studies that have examined a number
of aspects of the Fast Fashion business model such as: the financial
performance of Fast Fashion retailers relative to conventional retailers (Hayes &
Jones, 2006), retail buyers and suppliers (Bruce & Daly, 2006), as well as
��
�
supply chain management in Fast Fashion (Barnes & Lea-Greenwood, 2006;
Doyle, Moore & Morgan 2006).
In an article that reviews the existing literature on Fast Fashion, Bhardwaj and
Fairhurst (2010) note that there is a lack of research into the response of
consumers towards Fast Fashion. “By knowing how and to what extent rapid
changing fashion affects consumers’ purchase behaviour and satisfaction
levels, retailers can develop strategies that can lead to improved profitability.”
(Bhardwaj & Fairhurst, 2010, p. 171)
The growing trend of globalisation has led to the internationalisation of retail
stores and fashion brands, thus increasing competition in the sector and forcing
local industry participants to continuously adapt their processes to ensure that
they are able to remain competitive. Internationalisation refers to the practice of
corporations entering new markets in diverse geographical areas to spreading
cost and risk, gain economies of scale and to gain international status (Lopez,
2009).
An example of this is the recent entry of Spanish Fast Fashion retailer Zara into
Australia, a move that is anticipated to take market share from existing players
while simultaneously forcing them to improve their ability to bring new
merchandise to the market at a rapid rate (The Australian, 2011, April 18).
Developments of this nature make it necessary to investigate the various
aspects of Fast Fashion in order to gain a better understanding of its
implications for business and consumers.
�
�
1.3 .1 Link between the research objectives and the need for the research
Studies by numerous scholars including Homburg, Koschate and Hoyer (2005)
have demonstrated that consumers who get the products they desire show
improved levels of satisfaction, thus enabling businesses to become more
profitable by charging higher prices to these consumers.
The implications for business wishing to adopt Fast Fashion are significant. In
addition to the costs which need to be incurred in implementing these
measures, there are also significant implications related to buying and sourcing
strategies as well as aspects related to the geography of their supply chains
(Barry, 2004).
Christopher, Lawson and Peck (2004 ) support this view by noting that it will be
necessary to implement radical changes to organisational structures and
strategies and to move away from traditional industry practices which are based
around forecasting demand months or even years in advance.
In spite of the strong focus on aspects related to business in the existing
academic literature, Fast Fashion is still considered to be a consumer-led and
consumer-driven innovation. This study expands the existing knowledge by
investigating the consumer aspects that are a prerequisite for the successful
implementation of Fast Fashion strategies.
�
�
1.4 Summary
The South African apparel retail environment is characterised by domination of
a small number of large retail chains owning several brands proliferated
throughout the country and engaged in intense rivalry to win market share
(Datamonitor, 2010). Because of their dominant positions, the movement of
these key players towards adopting Fast Fashion cannot be ignored since it will
have far reaching implications for the economy and the consumer market.
Gaining an understanding of consumers is critical for business managers who
intend to adopt Fast Fashion methodologies in their operations. This study fills
the gap in the existing body of knowledge by investigating fashion consumers
with the intention of using these results as the basis for a valuation of the
applicability of Fast Fashion retail systems in the South African market.
��
�
Chapter 2: LITERATURE REVIEW
2.1 Introduction
The review of the literature presents an argument based on academic literature.
This is organised around three main discussion areas: Fashion retail, Fast
Fashion and consumer behavior.
2.2 Fashion Retail
2.2.1 Defining Fashion
Fashion is commonly associated with apparel and clothing, however it is
important to note that there is an element of fashion in every facet of modern life
and it can be found in even the most unexpected places such as kitchen
utensils, gardening, food, furniture and clothing (Ander & Stern, 2004; Stanley,
2006).
In a study that sought to develop a predictor model for fashion trends, Cho and
Lee (2005) found that fashion was a general indicator of prevailing market
trends that may have been influenced by social, cultural or economic factors.
Additionally, fashion trends could be considered to be an indicator of
consumers’ current point of view or emotional state, meaning that consumers
were responsible for setting the trends while it was up to the industry to attempt
to follow them (Cho & Lee, 2005).
��
�
Evans (1989) also reflects the temporary nature of fashion when he includes an
element of time in his definition of fashion as the style or styles being worn by
consumers of clothing during a specific time period.
For the purpose of this paper, the scope will be limited to fashion as it applies to
apparel retail within the South African market. Fashion will be defined as
apparel and accessories that incorporate an element of style or trend that is
likely to be short lived (Christopher et al., 2004; Hayes & Jones, 2006).
When one considers fashion in the form of apparel or clothing, it is necessary to
make a distinction between functional and innovative products. Functional
products are characterised by stable predictable demand coupled with long life
cycles, while innovative products have unpredictable demand and short
lifecycles (Fisher, 1997).
Although clothing can be regarded as a functional product, fashion clothing,
being heavily influenced by elements of style and trends is widely considered to
be an innovative product. Fashion retailers must thus continuously predict what
customers will want in the future since being able to spot trends and translate
them into products in the shop in the shortest possible time has become a pre-
requisite for success in the fashion retail sector (Ander & Stern, 2004;
Christopher et al., 2004).
��
�
2.2.2 The Nature of fashion retail
Retail involves the entire range of activities that are concerned with the goal of
the provision of goods and services to customers (Akinboade, 2008). Although
the retail value chain typically consists of a number of different organisations
and intermediaries each serving a particular role in the provision of goods and
services, the role of the retailer continues to grow in prominence. This is
additionally highlighted in the observation that power has continued to shift
towards the retailers who, in many parts of the industry, can now dictate
product, pricing and manufacturing terms (Evans, 1989).
Individual retailers, compete with each other and must find ways to differentiate
themselves from competitors in order to become successful at winning market
share and becoming profitable. “Differentiation exists when a firm’s offering is
preferred on some buying occasions or by some customers over a rival firm’s
offerings. This preference presumes that there is some difference between
brands and buyers react to these differences” (Sharp & Dawes, 2001, p. 743)
In the opinion of Ander and Stern (2004) a retailer can succeed at differentiating
themselves by endeavouring to become superior in one of five critical areas:
assortment, price, fashion, solution oriented service or speed oriented service.
Assortment refers to the range of products and services on offer; price refers to
a retailer endeavouring to offer similar products at a lower price than
competitors; fashion refers to consistently having the latest products, brands,
colours, or styles; while solution and speed are based on having different
service levels to those on offer by competitors (Ander & Stern, 2004).
�
�
Ander and Sterns’ (2004) inclusion of fashion as one of the key differentiation
methods is seen as support for the argument that the basis for differentiation in
modern retail has evolved from aspects such as price and location to ensuring
that a retailer constantly has items that reflect the current state of consumers
fashion demands in stock.
An investigation into the evolution of the fashion industry by Bhardwaj and
Fairhurst (2010) revealed three significant changes that have taken place since
the 1990’s: the fading of mass production systems, increases in the number of
fashion seasons and changes in the structural characteristics of the industry.
Mass production systems which excelled at producing standardised items at low
cost fell out of favour due to evolving consumer tastes while fashion seasons,
that is the frequency with which merchandise in stores changes, increased from
two seasons a year (summer and winter) to between five and ten seasons per
year (Bhardwaj & Fairhurst, 2010).
The rationale for the drastic changes that the industry has experienced
becomes more evident when one considers the severe restrictions that
traditional practices introduced. Tyler, Jo Heeley and Bhamra (2006) illustrated
that traditional fashion industry practices introduce stumbling blocks by
hampering the following critical supply chain elements:
• forecasting of trends
��
�
• late stage product changes
• geographical proximity of suppliers to the market, and
• minimising stock outs and slow selling products
These findings concurred with earlier research which concluded that the fashion
industry practice of outsourcing production to low cost countries made it difficult
to re-order garments in response to mid-season changes in consumer demand
(Bitran, Caldentey & Mondschein, 1998). Fisher and Rajaram (2000) expanded
insight into the extent of this limitation by highlighting two core problems created
by conforming to traditional fashion industry practices; ordering too little which
may result in loss of potential sales and ordering too much which may result in
markdowns that may include selling obsolete stock below cost.
These drawbacks were quantified by Bruce and Daly (2006) who found that up
to one in three customers cannot find the goods they require in stock and pre-
season forecast errors may be as high as 50%, which negatively affects retailer
productivity.
Key structural changes which emerged to counter the problems of lengthy lead
times and complicated supply chains associated with outsourced manufacturing
included the widespread adoption of just-in-time (JIT) techniques as well as the
implementation of quick response (QR) strategies (Bhardwaj & Fairhurst, 2010).
These were supply chain innovations that went a long way towards reducing
lead times in the industry.
��
�
2.3 Fast Fashion
Fast moving fashion or Fast Fashion describes a scenario where fashion
retailers implement strategies to compress their lead times in order to
adequately meet market demand by ensuring that they have the right products
to meet consumer tastes and demands (Hayes & Jones, 2006). Ander and
Stern (2004) expand on this definition by emphasising that implementing Fast
Fashion strategies enables retailers to be able to consistently guarantee that
they will have the latest products in the required quantities just as customers
begin to buy them in volume.
Techniques used in Fast Fashion include optimising the buying cycle,
minimising lead times involved in a typical fashion operation, implementing
technology and communication systems, as well as consumer feedback
mechanisms and processes.
Gaining a precise definition of Fast Fashion is made challenging by the fact that
there is ongoing debate in academic and business circles regarding the
classification and components of Fast Fashion, each with its own definition. A
detailed analysis of these debates is presented in this study.
The most comprehensive definition is put forth by Byun and Sternquist (2008)
who define Fast Fashion as: “a marketing approach to respond to the latest
fashion trends by frequently updating products with a short renewal cycle and
turning the inventory at a rapid rate” (Byun & Sternquist, 2008, p. 135). This
definition implies that fast fashion has two broad aims, one concerned with
��
�
responding to fashion trends and another that is concerned with having the
ability to rapidly update inventory.
Much of the previous research in this field has focussed on the rapid production
components and techniques of Fast Fashion by expanding our knowledge of
the supply chain aspects of Fast Fashion systems. Milner and Kouvelis (2005)
found that quantity flexibility – the ability to determine and produce an
appropriate re-order quantity as well as timing flexibility – the ability to alter
production schedules, are required components for a supply chain that provides
innovative goods with evolving demand. Additionally, Quantity flexibility was
found to be of higher value for fashion driven products when compared to timing
flexibility (Milner & Kouvelis, 2005).
Christopher et al. (2004) demonstrated that traditional forecast-driven supply
chains, designed for a mass-production era, are not adequate to meet the
challenges of volatile and turbulent demand which is typical of fashion markets.
In addition, the authors argue that gaining the agility in supply networks that
enables rapid production necessitates radical changes in organisational
structures and strategies as well as a move away from forecast-driven supply
(Christopher et al., 2004).
Doyle et al. (2006) found that implementing partially agile supply chains would
sufficiently balance the need for customer responsiveness with the need for
operational and financial viability. For the scope of this research,
responsiveness and agility are defined as a combination of reduced time-to-
market, the ability to scale up or scale down quickly as well as the ability to
rapidly incorporate consumer preferences (Christopher et al., 2004).
��
�
Taking into account the definition of Fast Fashion as both a consumer driven
and supplier driven innovation, it is apparent that there is a gap that exists in the
current body of knowledge. The existence of this gap has been emphasised as
follows: “the literature on fast fashion highlights various aspects of supply chain
management, supported by supply chain theory to improve the business model
of fashion retailers. It is worth noting that not many studies have addressed fast
fashion as a consumer-driven approach, leaving this an under-researched area”
(Bhardwaj & Fairhurst, 2009, p. 170).
2.3.1 Components of Fast Fashion
The phenomenon of Fast Fashion came to the fore in the late 1990’s with the
entry of innovative retailers such as Zara into the mainstream retail market in
the UK (Barry, 2004).
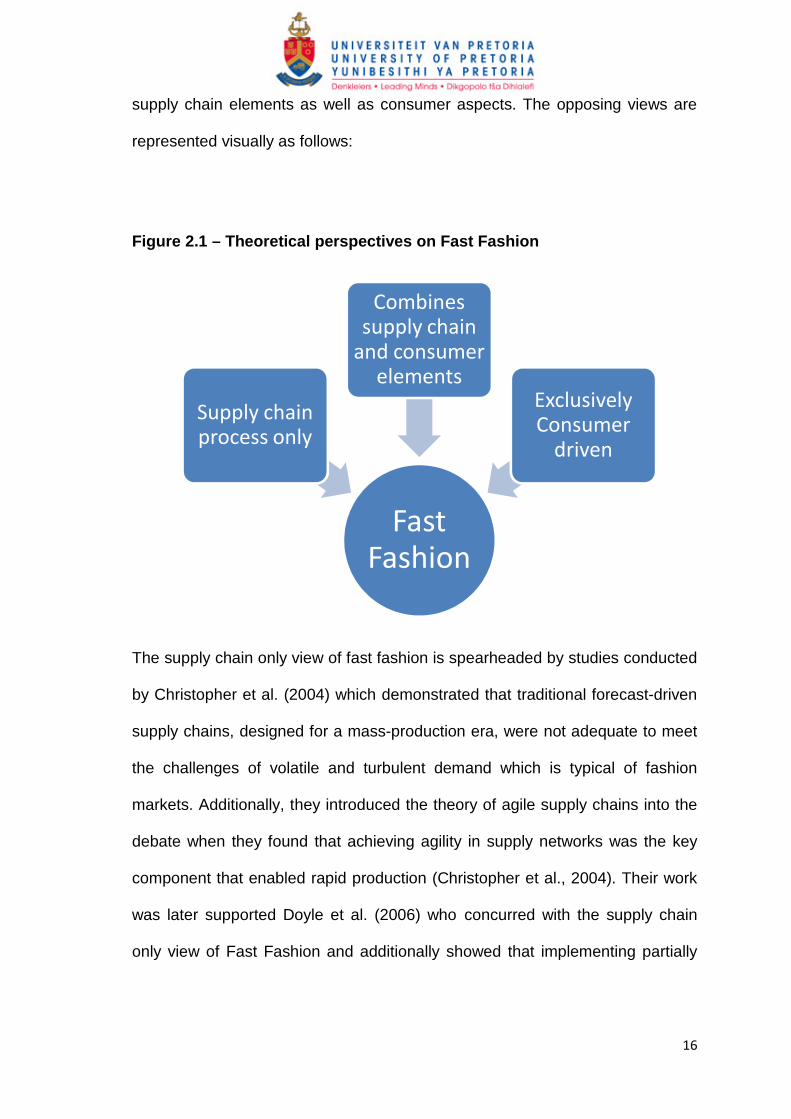
In spite of the fact that Fast Fashion is considered to be in its infancy and there
is limited academic insight on the subject, there is a vibrant debate taking place
in academic literature around the classification of Fast Fashion. Over time, three
opposing perspectives have emerged. One holds that Fast Fashion is a supply
chain process only while a second asserts that Fast Fashion is an exclusively
consumer driven phenomenon. A third argument holds that Fast Fashion
represents a new field of study because it represents a unique combination of
�
�
supply chain elements as well as consumer aspects. The opposing views are
represented visually as follows:
Figure 2.1 – Theoretical perspectives on Fast Fashion
The supply chain only view of fast fashion is spearheaded by studies conducted
by Christopher et al. (2004) which demonstrated that traditional forecast-driven
supply chains, designed for a mass-production era, were not adequate to meet
the challenges of volatile and turbulent demand which is typical of fashion
markets. Additionally, they introduced the theory of agile supply chains into the
debate when they found that achieving agility in supply networks was the key
component that enabled rapid production (Christopher et al., 2004). Their work
was later supported Doyle et al. (2006) who concurred with the supply chain
only view of Fast Fashion and additionally showed that implementing partially
�����
�������
�������������������������
�� !������������������
��"������ ������ ����
#$�����%��������� ���
"��%���
�
�
agile supply chains would sufficiently balance the need for customer
responsiveness with the need for operational and financial viability.
Milner and Kouvelis (2005) found that quantity flexibility – the ability to
determine and produce an appropriate re-order quantity as well as timing
flexibility – the ability to alter production schedules, are required components for
a supply chain that provides innovative goods with evolving demand.
Additionally, it was found that when dealing with fashion driven products such
as fashion clothing quantity flexibility was found to be of higher value than
timing flexibility (Milner & Kouvelis, 2005).
In addition to these authors who equated Fast Fashion to agile supply chains,
other studies were conducted which correlated Fast Fashion to other concepts
of supply chain theory, namely; just-in-time (JIT) systems and quick response
(QR) systems. This view was later strengthened by Bhardwaj and Fairhurst
(2010) who demonstrated that just-in-time and quick response strategies are
key supply chain innovations aimed at achieving lead time reductions.
The consumer driven view of Fast Fashion was entrenched by Barnes and Lea-
Greenwood (2006) who held the view that Fast Fashion was primarily a
response to changes in consumer demand thus implying that consumers were
the key drivers of Fast Fashion. “rather than simply being linked to existing
��
�
theory of supply chain management, and being a supply side driven process,
fast fashion is an advance in supply chain management theory and is different
to existing models of supply chain management as it is a completely consumer
driven process” (Barnes & Lea-Greenwood, 2006, p. 265).
The most recent perspective combines the divergent philosophies detailed
above and appears to be the view that has gained widespread acceptance. In
their investigation of the value of quick response and other responsive supply
chain techniques, Cachon and Swinney (2009b) assert that Fast Fashion
systems can be understood to be made up of a combination of two distinct
components, enhanced design and rapid production. Enhanced design is
consumer driven, reliant on consumers dictating their tastes and preferences
while rapid production is supply chain driven, concerned with reducing lead
times as much as possible. This is supported by a number of recent studies in
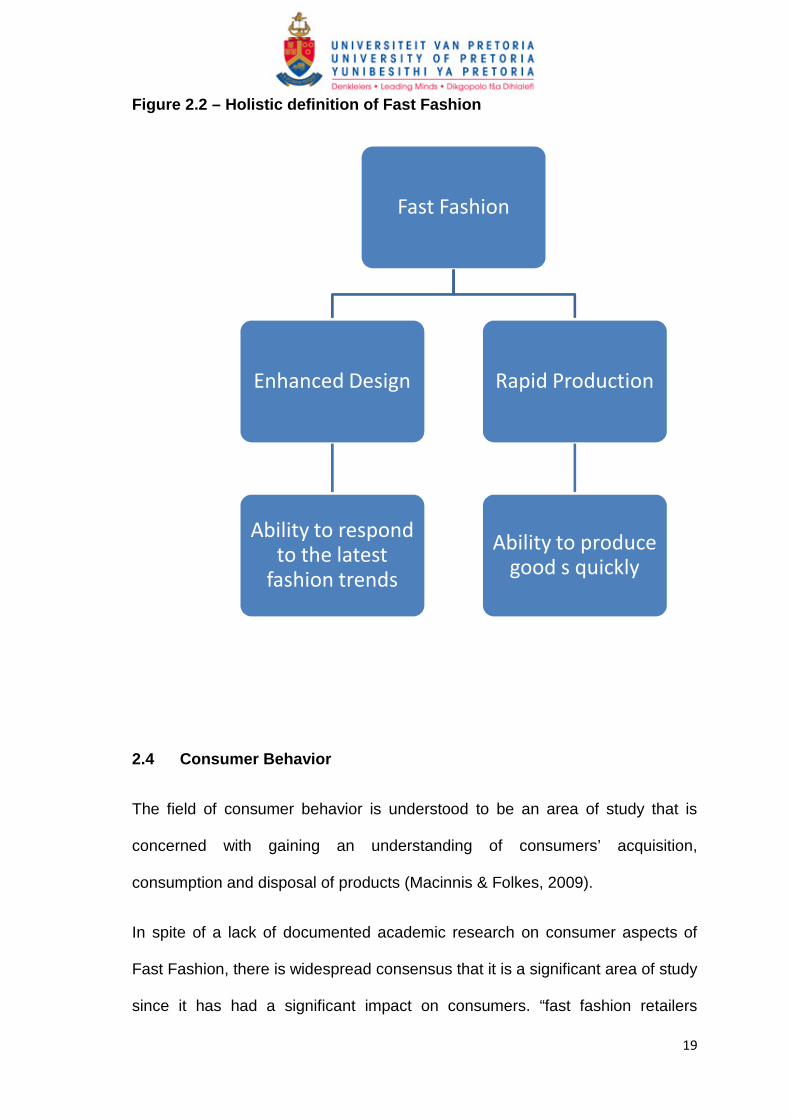
the field including Byun and Sternquist (2008) who define Fast Fashion in terms
of its two major objectives, one concerned with responding to the latest trends
and another that is concerned with shortening renewal cycles and increasing
the turnaround of inventory. This holistic definition of Fast Fashion can be
depicted as follows;
��
�
Figure 2.2 – Holistic definition of Fast Fashion
2.4 Consumer Behavior
The field of consumer behavior is understood to be an area of study that is
concerned with gaining an understanding of consumers’ acquisition,
consumption and disposal of products (Macinnis & Folkes, 2009).
In spite of a lack of documented academic research on consumer aspects of
Fast Fashion, there is widespread consensus that it is a significant area of study
since it has had a significant impact on consumers. “fast fashion retailers
������������
#������"�&���'�
(!���������������"���������������
)�����������"�
*���"�+��"������
(!������������"����'��"���,���-���
���
�
dramatically changed a conventional business model by significantly affecting
consumer shopping and purchase behaviour” (Byun & Sternquist, 2008, p. 134).
Purchase frequency, a key aspect of consumer behaviour in retailing, has been
measured in an attempt to classify individual shoppers according to the
characteristics of their shopping excursions. Kahn and Schmittlein (2001)
categorised shoppers into those that make many trips to the store and purchase
small amounts per trip and those that make fewer trips at more regular intervals.
Another key aspect of consumer behaviour is the concept of forward-looking or
strategic consumers, who delay their purchases in anticipation of a price
decrease or sale in the future (Nair, 2007). This leads to an expansion of the
classification of consumers based on purchasing behaviour by classifying
consumers into three distinct groupings: myopic consumers who always
purchase at the initial full price; bargain hunting consumers who purchase only
if the discounted price is sufficiently low; and strategic consumers who
strategically choose when to make their purchases by intentionally delaying
purchasing an item at the full price in order to purchase at a discount during an
end of season clearance or sale(Cachon & Swinney, 2009a).
In a separate research undertaking Cachon and Swinney (2009b) shed further
light on the relationship between Fast Fashion and strategic consumer
behaviour when they found that Fast Fashion systems can be of significant
value particularly when consumers exhibit strategic behaviour. This supported
their previous finding that the value of quick response or responsive supply
� �
�
chain techniques to a retailer is generally greater in the presence of strategic
consumers than without them.
A case study investigation of Zara, a global fast fashion retailer supports this
relationship by demonstrating that consumers visited this Fast Fashion retailer
17 times per year on average compared to the number of 5 visits per year that
was achieved by conventional retailers (Castro, 2003 cited by Lopez & Fan,
2009).
The authors ascribe this to the effects of Fast Fashion on a number of key retail
practices employed by Zara on aspects such as quality, pricing policies and
renewal of inventory in stores.
2.4.1 Key Consumer Variables
A number of studies reveal the importance of the renewal cycles in fashion retail
as a key variable in understanding consumer aspects of Fast Fashion. As
mentioned previously, a fashion season is the period of time during which a
specific range of items are sold to consumers. This is thus a measure of the
renewal cycle, that is the frequency with which merchandise in stores changes
(Bhardwaj & Fairhurst, 2010). Bhardwaj and Fairhurst (2010) identify two key
reasons for the increase in the number of fashion seasons in modern day retail;
changes in consumer’s lifestyles as well as consumers demand for fashion
clothing linked to special or specific occasions.
���
�
In a study into consumers’ behavioural responses to Fast Fashion, Byun and
Sternquist (2008) identify the combination of a short renewal cycle and a limited
supply of goods as the two most important components of a Fast Fashion
strategy. By demonstrating that both variables go hand in hand, in other words,
Fast Fashion retailers introduce new products frequently and they introduce
products in limited numbers, the investigation shows that these retailers are
thus able to encourage immediate action from shoppers. Additionally, a
relationship is established between the combination of the short renewal cycle
and limited supply, with consumers shopping decisions which may include how
often to visit a retail store and how often to purchase from a retail store (Byun &
Sternquist, 2008). It is therefore important to investigate these variables
simultaneously.
Additionally, it is noted that Fast Fashions’ ability to provide the most
fashionable merchandise at low prices makes the strategy appealing to
younger, fashion conscious consumers while simultaneously encouraging them
to purchase immediately and not delay their purchases (Byun & Sternquist,
2008).
These findings which identify renewal cycles and supply as key consumer
variables of Fast Fashion are consistent with key discoveries made some
decades ago. One such study into renewal cycles or stock turnover dates back
to the 1960’s. Dalrymple (1964) not only demonstrated that stock turnover had
���
�
an effect on a firms profits, he additionally argued that there were three main
strategies which could be used to increase stock turnover. These are:
• Increasing the amount of product advertising
• Lowering prices, or,
• Maintaining small amounts of inventory by eliminating slow-selling items
From definitions presented in this study it is evident that Fast Fashion utilises
the third strategy listed above. It is further proposed that a key requirement for
retailers who wish to follow this strategy would be the need to have the ability to
accurately forecast consumer demand Dalrymple (1964). This has also been
demonstrated to be on of Fast Fashions’ key strengths.
The perceived availability of supply or inventory is also a key consumer aspect
of Fast Fashion. Byun and Sternquist (2008) note that if consumers perceive
that a product is scarce or has limited supply, they are likely to find the product
more desirable. This would mean that retailers would be able to improve their
profitability by maintain a higher price on these items.
In spite of the theoretical suggestion that consumers will react negatively to
limited supply or stock outs of certain products, there is contradictory evidence
which demonstrates that consumers may react positively to such conditions. In
a study into consumer response to stockouts, Fitzsimons (2000) found that
consumers only react negatively to stockouts if they had a high level of
commitment to the item in question. These negative reactions were illustrated
by subjects showing decreased satisfaction levels and increased levels of
���
�
intentions to switch stores. In cases where there was no commitment to the
unavailable option, stockouts were perceived to be positive because they
simplified the process of selecting products (Fitzsimons, 2000).
The strategy of introducing new merchandise frequently by having multiple
fashion seasons necessitates a change in consumer purchase frequency.
Retailers would require consumers to respond by increasing the number of
store visits thus enabling retailers to realise adequate profit margins from
introducing shorter lifecycles. (Bhardwaj & Fairhurst, 2010)
This introduces the relationship between the frequency with which consumers
visit stores and the number of fashion seasons. These key variables and the
relationship between them will be investigated in this study.
The relationship between price and perceived quality is well documented in
academic literature. Boyle and Lathrop (2009) found that modern consumers
perceive a positive relationship between price and quality when evaluating
durable products such as clothing. In an earlier study on factors affecting quality
perceptions, Miyazaki, Grewal and Goodstein (2005) highlight the importance of
the core theory of information integration which states that in the absence of
sufficient amounts of intrinsic information (information about the physical
product), extrinsic information (factors that do not make up the physical product)
are used to assess product quality. The research concludes that the relationship
���
�
between price and quality holds in the presence of a secondary indicator such
as a strong brand or a positive country of origin (Miyazaki et al., 2005).
Crewe and Davenport (1992) proposed a relationship between the perceptions
of quality and cost in fashion. They went a step further by segmenting their
results according to age, demonstrating that Generation Y (born after 1990)
favour low quality clothing with a low cost while baby boomers (born between
1945 and 1965) favour higher quality merchandise (Crewe & Davenport, 1992).
These findings have led to Fast Fashion sometimes being referred to as
throwaway fashion, indicating the propensity for young consumers to purchase
items of low cost and low quality with the intention of using them infrequently
and then disposing of them. This phenomenon as well as its causes is
summarised as follows: “The trend of throwaway fashion owes much to
increases in fashion purchase frequency and a real reduction in price levels.
Furthermore, fast fashion retailers , such as H&M, TopShop and Zara, sell
garments that are expected to be used less than ten times at very comparative
price points” (Birtwistle & Moore, 2007).
Price is a key variable in measures of consumer behaviour. Literature suggests
the existence of a relationship between price and the frequency of consumer
store visits. One such study by Yuan and Han (2011) developed a model which
��
�
found that when prices increase, consumers respond by increasingly searching
for more alternatives while price reductions had the reverse effect.
Quality and price will therefore considered to be two key variables for this study.
The scope of this investigation will be restricted by excluding consumers over
the age of 50 and below the age of 15 in order to focus exclusively on the
segments that are particularly concerned with fashion. Khare and Rakesh
(2010a) support the isolation of these segments when they note that the youth,
which they refer to as generation Y, is the consumer segment that is most
receptive towards global trends and fashion in general. The authors go further
in analysing demographic factors which may be significant by additionally
highlighting that perceptions between males and females may differ because
women generally place greater importance on issues regarding fashion and
clothing (Khare & Rakesh, 2010a).
Workman and Studak (2006) also found that males and females were socialised
differently regarding behaviour towards clothing, appearance and dressing,
resulting in significant differences in behaviour and attitudes. Their research
concluded that men exhibited a need-based approach while women exhibited a
want based approach in their decision making processes (Workman & Studak,
2006). As a result of this, the investigation differentiates between male and
female consumers by seeking to investigate any differences that may exist
between these two distinct segments.
��
�
2.5 Conclusion
Fast Fashion describes a collection of strategies that seek to achieve two aims,
to better meet consumer demand by providing the products that they desire and
to provide these products in a timely manner. The literature indicates that the
key variables of Fast Fashion that affect consumer behaviour in fashion retailing
are Renewal Cycles, Supply, Quality and Price. Additionally, the frequency of
consumer store visits as well as the frequency of purchases are key aspects of
consumer behaviour.
���
�
Chapter 3: RESEARCH PROPOSITIONS
3.1 Introduction
The chapter describes the key variables and propositions that are developed
from Chapter 1 and the literature review outlined in Chapter 2.
3.2 Research Propositions
The literature review indicates that the frequency of purchases and the
number of visits made by consumers is a key measure of consumer behaviour
in Fast Fashion (Cachon & Swinney, 2009a; Castro, 2003; Kahn & Schmittlein,
2001; Lopez & Fan, 2009; Nair, 2007). Other key variables which are suggested
to have an impact on consumer purchase behaviour include: Renewal Cycles
(Bhardwaj & Fairhurst, 2010; Byun & Sternquist, 2008; Dalrymple, 1964),
Supply (Byun & Sternquist, 2008; Fitzsimons, 2000), Price (Birtwistle & Moore,
2007; Boyle & Lathrop, 2009; Crewe & Davenport, 1992; Miyazaki et al., 2005;
Yuan & Han, 2011 ), and Quality (Boyle & Lathrop, 2009; Crewe & Davenport,
1992; Miyazaki et al., 2005). Gender was also identified as a variable that could
introduce differences with respect to consumer variables (Khare & Rakesh,
2010a; Workman & Studak, 2006).
The following propositions were identified.
���
�
Proposition 1
Renewal cycles are related to the frequency of consumers’ retail store visits
Proposition 2
Supply is related to the frequency of consumers’ retail store visits
Proposition 3
Quality is related to the frequency of consumers’ retail store visits
Proposition 4
Price is related to the frequency of consumers’ retail store visits
Proposition 5
There are significant differences between male and female consumers in
relation to Renewal cycles, Supply, Quality and Price
���
�
Chapter 4: RESEARCH METHODOLOGY
4.1 Introduction
This chapter describes the methodology used in this study as well as a
justification of the methods used. The chapter discusses the research design,
population, sampling as well as the collection and analysis of data. The chapter
concludes with a brief discussion of the limitations of the research.
4.2 Research Design
The research design is defined as the basic plan that demonstrates how the
research questions will be related to the data gathered as well as the tools and
procedures that will be used to answer the research questions (Punch, 2001).
Saunders, Lewis, and Thornhill (2009) add that the research design should also
demonstrate that the researcher has given careful consideration to the reasons
for selecting a particular research design.
The researchers objective to measure selected variables in order to answer the
research propositions set out in Chapter 3 resulted in the selection of a
quantitative approach. Quantitative research is characterised by the collection
and analysis of numerical data (Saunders et al., 2009). Data is typically
collected using surveys and analysed by statistical methods. This is the
methodology used in this study.
� �
�
The review of existing literature covered in Chapter 2 highlighted the relevant
variables for this investigation as well as the gaps that exist in the current body
of knowledge.
The quantitative approach was selected as being suitable to answer the
research questions since this investigation was deemed to be explanatory in
nature as opposed to an exploratory study which would be more suited to
qualitative techniques. The data collected in this manner could thus be analysed
quantitatively using statistical methods (Saunders et al., 2009).
4.3 Unit of Analysis
The unit of analysis refers to the individual members of the population. The unit
of analysis for this study was regarded to be consumers who purchase clothing
from retail stores.
For the purposes of this research, clothing was defined as all forms of apparel
including menswear, womenswear, childrenswear, underwear and footwear.
4.4 Population
The population is a group that shares some common element. The population
for this study was South African consumers who have purchased at least one
item of clothing in the past month. A month was defined as a 30 day period.
Additionally, as highlighted in Chapter 2, it was determined that individuals
���
�
below the age of 15 as well as those above the age of 50 would fall outside the
scope of this study.
4.5 Sampling Method
A sample is defined as the selection of members from a population who will be
used to represent the population in its entirety (Tharenou, Donohue & Cooper,
2007).
According to Saunders et al. (2009), sampling provides a valid alternative for
situations where it would be impractical to survey a population in its entirety.
Logistical constraints make it unfeasible to conduct an analysis of the entire
population, thus the sample will be based on the population of SOWETO, a
township located in the Gauteng province of South Africa.
Probability sampling requires that the probability of each case being selected is
known and equal while in non-probability sampling, the chance of each case
being selected is not known (Saunders et al., 2009). Non probability sampling
was used in this investigation due to the nature of the research questions
requiring the use of a sample in which it would be difficult to compute the
possibility of each case being selected.
The convenience sampling methodology was used. Convenience sampling
involves selecting cases that are easily accessible to the researcher (Saunders
���
�
et al., 2009). The method of convenience sampling is well suited to instances
where there is likely to be a low level of variation in the population being
investigated. The use of convenience sampling was deemed to be appropriate
for this study since results obtained from convenience samples would be
generalisable to markets and locations that exhibit similar characteristics to
those considered in this investigation (McBurney, 2001). Saunders et al. (2009)
also verifies the generalisability of results of non-probability samples.
The researcher aimed to introduce a level of structure to the sampling
procedure and improve the possibility of this study being successfully replicated
by selecting an initial starting point using a random process and thereafter
selecting every fifth respondent encountered. In addition to making the study
more replicatable, this measure was also undertaken in order to reduce the
level of bias that is often encountered when using convenience sampling.
4.6 Sample Size
According to Tharenou et al., (2007) a sufficiently large sample size is required
in order to be able to test quantitative relationships. Saunders et al. (2009) add
that a large sample size is desired because it reduces the possibility of errors
when generalising the results of a sample to a population, thus making the
results of the sample more representative of the population.
���
�
A total of 173 responses were obtained of which 136 were valid. Two (2)
responses were excluded due to being incomplete or having unanswered
questions, eight (8) were excluded due to falling outside of the required age
groupings while 27 failed to meet the qualifying criteria which is buying at least
one item of clothing in the past month.
A larger sample size would have been preferred however the sample size
obtained was deemed to be appropriate. Additionally, it is desirable to obtain a
high response rate because this ensures that the sample is representative of
the population (Saunders et al., 2009).
Punch (2001) asserts that in order to determine the appropriate sample size in
quantitative research, the researcher needs to balance cost and access against
the level of precision required and the variability of the population being
measured. Additionally, Saunders et al. (2009) state that when using non-
probability sampling techniques, the researcher should use a level of discretion
in selecting a suitable sample size based on achieving credible results taking
the availability of resources into account.
4.7 Instrument
A structured questionnaire was administered to obtain data for analysis. A
questionnaire is a data collection technique that requires respondents to
respond to the same set of questions in a similar sequence (Saunders et al.,
���
�
2009). This technique was deemed to be suitable for this study because of its
ability to collect a large number of responses from a large number of
respondents in a cost effective manner.
Additionally, Tharenou et al. (2007) highlight that due to their structured format,
questionnaires are well suited for the collection of quantitative data.
The questionnaire comprised of a range of closed-ended questions as well as
responses based on the Likert scale. Closed-ended questions limit the
respondents’ possible answers to a set that is determined by the designer of the
questionnaire thus making responses easier to analyse (McBurney, 2001).
The choice of closed-ended questions is further justified by McBurney (2001)
who notes that these types of questions are well suited to studies of this nature
because they do not require respondents to be highly articulate in expressing
their responses.
The questionnaire also requested demographic information and included
instructions on how each sub-section was to be completed. The questionnaire
was divided into the following sections:
• Section 1: Demographic information
• Section 2: Purchase Behaviour
• Section 3: Renewal cycle
��
�
• Section 4: Supply
• Section 5: Quality
• Section 6: Price
Section 5 of the questionnaire was modelled according to an instrument used in
a consumer study by Choi et al. (2010) while Section 3 was modelled according
to a consumer study instrument used by Birtwistle and Morgan (2009).
The questionnaire was tested to determine the level of usability. Although no
changes were made based on the outcome of the testing, the researcher
identified specific questions that were prone to be left unanswered and ensured
that these were completed by respondents during data gathering. The
questionnaire that was used is included in Appendix A.
4.8 Data Collection
The research was undertaken from the 30th of June to the 9th of July, 2011. The
primary data was collected at the Maponya Mall Shopping Centre which is
located in SOWETO. This location was deemed to be appropriate because
Maponya Mall is considered to be one of the four key retail nodes within
SOWETO (Palmer Development Group, 2005).
��
�
In addition, there is a significant volume of literature that demonstrates that
shopping malls are ideal locations to find large numbers of consumers. An
example is the study by Khare and Rakesh (2010b) which demonstrated that
shopping malls are able to generate large amounts of consumer traffic when
compared to other locations.
The researcher walked in a counter-clockwise direction through the oval-shaped
walkway of the mall and requested every fifth person to complete a
questionnaire. The first respondent was selected randomly.
The researcher excluded individuals who appeared to be below the age of 15
and above the age of 50 as they were outside the scope of the study and
represented extreme cases that were likely to deviate from the typical case.
Saunders et al. (2009) provide support for this by stating that when using non-
probability sampling techniques, the researcher employs a level of subjective
judgement in determining the most appropriate sample.
Each respondent who was approached was informed that the research was for
academic purposes and that their responses were completely anonymous. They
were informed of the procedure to be followed and asked if they agreed to
participate prior to being handed a questionnaire and a pen. Data was gathered
using the questionnaire in Appendix A. Each respondent completed a
questionnaire while the researcher guided them through each question. The
���
�
involvement of the researcher during completion was deemed to be appropriate
for the following reasons:
• Because the questionnaire was compiled in English, the researcher
needed to translate to an African language in instances where
respondents required this
• The researcher was able to clarify questions and instructions in instances
where respondents required assistance
• The researcher could minimise the number of questions that were left
blank or unanswered
McBurney (2001) voices support for this methodology when he notes that face
to face personal interviews have several advantages including the fact that the
interviewer can motivate respondents to answer questions carefully, while
minimising the possibility of clarifying questions being misunderstood due to
factors such as illiteracy or poor vision.
The qualifying question of the questionnaire was whether the respondent had
purchased at least one item of clothing in the past thirty days. In instances
where the respondent had not made a purchase or fell outside of the desired
age groupings, the interviewer continued with the interview but these results
were excluded from the final sample since they fell outside of the scope of this
study.
���
�
The time taken to complete the questionnaire ranged from three minutes to ten
minutes depending on the amount of assistance that was required from the
interviewer.
To eliminate time and day bias, the researcher undertook the following steps:
• varying the time of day in which the surveys are conducted, and,
• varying the day of the week in which the surveys are conducted
The interviewer worked alone during weekdays since the volume of people in
the mall was relatively low. During the weekends, the researcher was assisted
by two individuals in order to cope with the increased volume of people.
Both assistants have completed their grade 12 studies. The assistants were
briefed on the purposes of the research and were trained on the procedure to
be followed in conducting interviews. In addition the assistants were required to
observed five interviews conducted by the researcher prior to commencing their
duties.
Respondents who declined to participate in the study were not requested to
give reasons for their refusal.
���
�
4.9 Data Analysis
For the purposes of data analysis, the researcher captured all manual
responses into a digital format. The gathered data was captured into a Microsoft
Excel spreadsheet and checked for consistency and errors.
Steps were taken to ensure the reliability and validity of the data. Reliability is
defined as the extent to which the data collection techniques used are able to
produce consistent findings while validity is concerned with the extent to which
the methods employed are able to measure the constructs they were intended
to measure (Saunders et al., 2009).
Steps such as varying the time and day of the week were taken to improve the
reliability of the data by reducing the level of participant bias. Pre-testing the
instrument and using components of instruments that were employed in other
successful studies were some of the steps taken to ensure sufficient validity.
Statistical analysis was conducted on the data using IBM SPSS Statistics 19,
taking into account the possibility of errors, biases and other research
limitations introduced by the methods and procedures selected. Descriptive
statistics as well as inferential statistics were conducted. Descriptive statistics
were used to provide information about the data that was collected. The
analysed data was presented in the form of charts, graphs and tables to
illustrate the findings.
� �
�
4.10 Potential Research Limitations
Sample size
A larger sample size would have been preferred as this would have improved
the level of confidence of the data while simultaneously reducing the possibility
of bias.
Geographic area
Despite the fact that steps were taken to reduce biases, such as collecting data
during different days of the week as well as at different times of day, the fact
that the research was conducted in a single location may limit the
generalisability of the findings and also result in obtaining a sample that does
not reflect the diverse characteristics of the population.
4.11 Conclusion
A quantitative research design was conducted. The study involved respondents
answering a questionnaire that measured the key variables identified as well as
demographic information. A total of 173 responses were collected.
�
���
�
Chapter 5: RESULTS
5.1 Introduction
The results to the research propositions outlined in Chapter 3 are presented
below. Inferential as well as descriptive statistical techniques are used to
present the data.
5.2 Sample Description
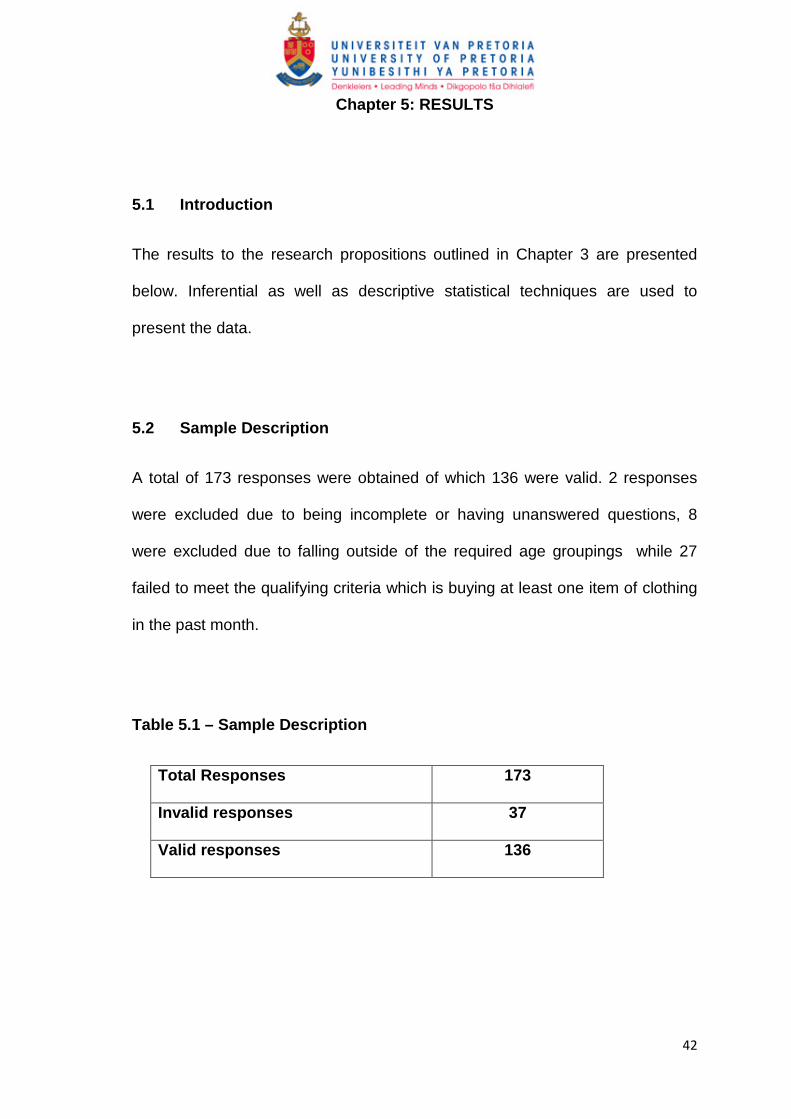
A total of 173 responses were obtained of which 136 were valid. 2 responses
were excluded due to being incomplete or having unanswered questions, 8
were excluded due to falling outside of the required age groupings while 27
failed to meet the qualifying criteria which is buying at least one item of clothing
in the past month.
Table 5.1 – Sample Description
Total Responses 173
Invalid responses 37
Valid responses 136
���
�
5.3 Data Evaluation
Data was evaluated to detect any anomalies, missing values and outliers. A
decision was taken to exclude all entries that had missing values or questions
that were left unanswered. The resulting data was deemed to be adequately
discreet and continuous.
The Store Visits variable was computed by combining two questions in the
questionnaire: “How often do you visit clothing shops?” and “How often do you
buy an item from a clothing shop?”. The Renewal Cycles variable was
computed by combining two questions in the questionnaire: “I would visit a
clothing store more often if there was a new range of clothing items on each
visit” and “I would buy more often if there was a new range of clothing on each
visit”.
The Supply variable was computed by combining two questions in the
questionnaire: “When I see something I want, I am afraid that I will not get the
right size or colour if I do not buy immediately” and “The clothing items I wish to
buy are often out of stock”. The Quality variable was computed by combining
two questions in the questionnaire: “The quality of clothing items available in
stores has improved over time” and “I am satisfied with the quality of clothing
items in stores”.
The Price variable was computed by combining three questions in the
questionnaire: ”I would be willing to pay a higher price to get the exact clothing
item I want ”, “I would be willing to pay a higher price to get clothing items of a
higher quality” and “I would be willing to pay a higher price to get clothing items
that are fashionable and trendy. ”
���
�
The internal consistency of the items in the questionnaire was verified using
Cronbach’s Alpha. The alpha values were 0.769, 0.706, 0.432, 0,638 and
0.654 for Store Visits, Renewal Cycles, Supply, Quality and Price respectively.
Pallant (2001) highlights that the value of Cronbach’s Alpha is affected by the
number of items used in the scale. The use of only two or three scale items for
each construct in this study may therefore result in alpha values that fall below
the generally accepted minimum threshold of 0.70. In some cases, the use of
alpha values as low as 0.60 is considered appropriate for cases involving the
initial validation of a research instrument (Khare & Rakesh, 2010a). The scale
and resulting constructs were deemed to be sufficiently reliable to proceed with
analysis.
5.4 Survey Results
The results of the survey conducted by means of a questionnaire are presented
below. The results follow the sequence of the questionnaire and the relevant
research propositions as outlined in Chapter 3 are indicated. The order of the
results is as follows:
• Demographic information
• Purchase Behaviour
• Proposition 1: Renewal cycle
• Proposition 2: Supply
• Proposition 3: Quality
���
�
• Proposition 4: Price
• Proposition 5: Gender
The qualifying question for the study was weather respondents had made at
least one purchase of a closing item in the past thirty days. Only those
respondents who answered positively were considered for the study.
5.4.1 Demographic Information
Descriptive statistics were used to obtain the demographic profile of the sample.
Three demographic variables were considered as part of Section 1 of the
questionnaire: race, age and gender. Figure 5.2 illustrates the profile of the
sample according to race, Figure 5.3 illustrates the profile of the sample
according to age and Figure 5.4 illustrates the profile of the sample according to
gender.
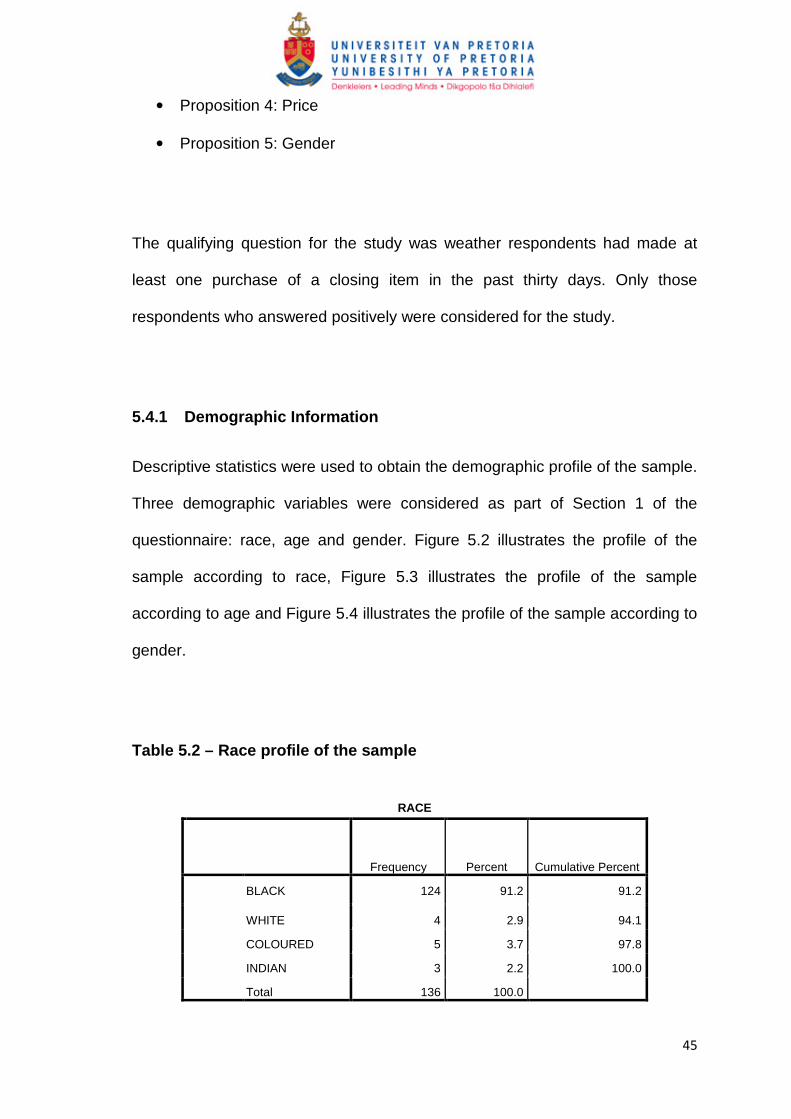
Table 5.2 – Race profile of the sample
RACE
Frequency Percent Cumulative Percent
BLACK 124 91.2 91.2
WHITE 4 2.9 94.1
COLOURED 5 3.7 97.8
INDIAN 3 2.2 100.0
Total 136 100.0
��
�
91.2% of the respondents were Black. White, Couloured and Indian
respondents made up 8.8% combined.
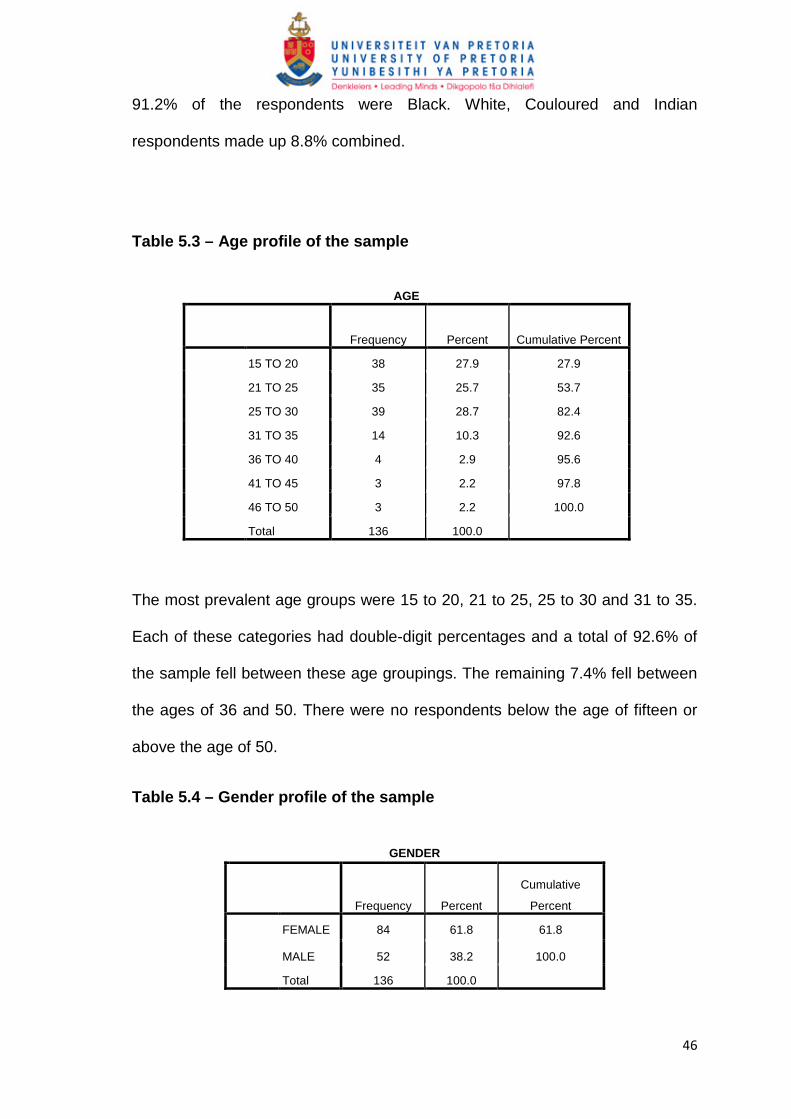
Table 5.3 – Age profile of the sample
AGE
Frequency Percent Cumulative Percent
15 TO 20 38 27.9 27.9
21 TO 25 35 25.7 53.7
25 TO 30 39 28.7 82.4
31 TO 35 14 10.3 92.6
36 TO 40 4 2.9 95.6
41 TO 45 3 2.2 97.8
46 TO 50 3 2.2 100.0
Total 136 100.0
The most prevalent age groups were 15 to 20, 21 to 25, 25 to 30 and 31 to 35.
Each of these categories had double-digit percentages and a total of 92.6% of
the sample fell between these age groupings. The remaining 7.4% fell between
the ages of 36 and 50. There were no respondents below the age of fifteen or
above the age of 50.
Table 5.4 – Gender profile of the sample
GENDER
Frequency Percent
Cumulative
Percent
FEMALE 84 61.8 61.8
MALE 52 38.2 100.0
Total 136 100.0
��
�
61.8% of the respondents were female while the remaining 38.2% was male.
5.4.2 Purchase behaviour
A combination of descriptive statistics as well as inferential statistics was used
to determine the purchase behaviour of the sample. In Section 2 of the
questionnaire, a total of six questions were asked regarding purchase
behaviour.
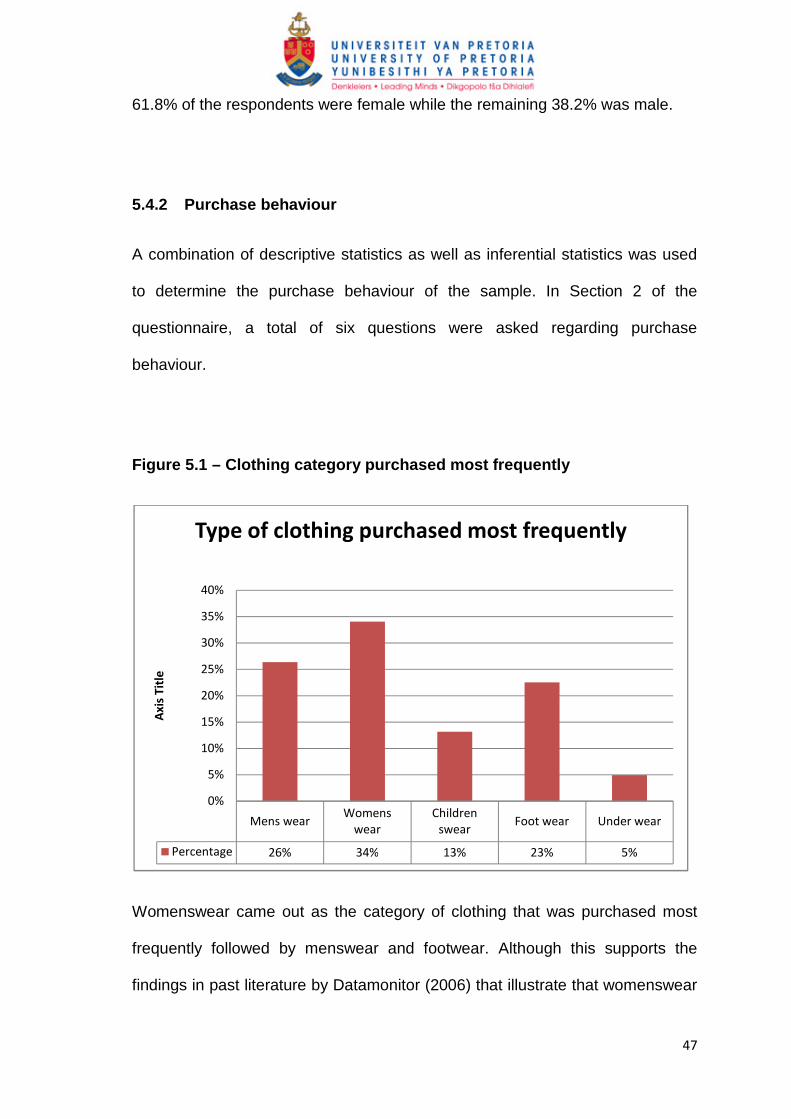
Figure 5.1 – Clothing category purchased most frequently
Womenswear came out as the category of clothing that was purchased most
frequently followed by menswear and footwear. Although this supports the
findings in past literature by Datamonitor (2006) that illustrate that womenswear
. ����/ ���0 � ����
/ ���
����"����
�/ ��������/ ��� 1�"���/ ���
+�������'� �2 ��2 �2 ��2 �2
�2
�2
�2
�2
��2
��2
��2
��2
��2
���������
���� �������������������� ���� ������
���
�
is the most frequently purchased clothing category, it is important to bear in
mind that this result may have been influenced by the fact that the majority of
respondents in this study were female.
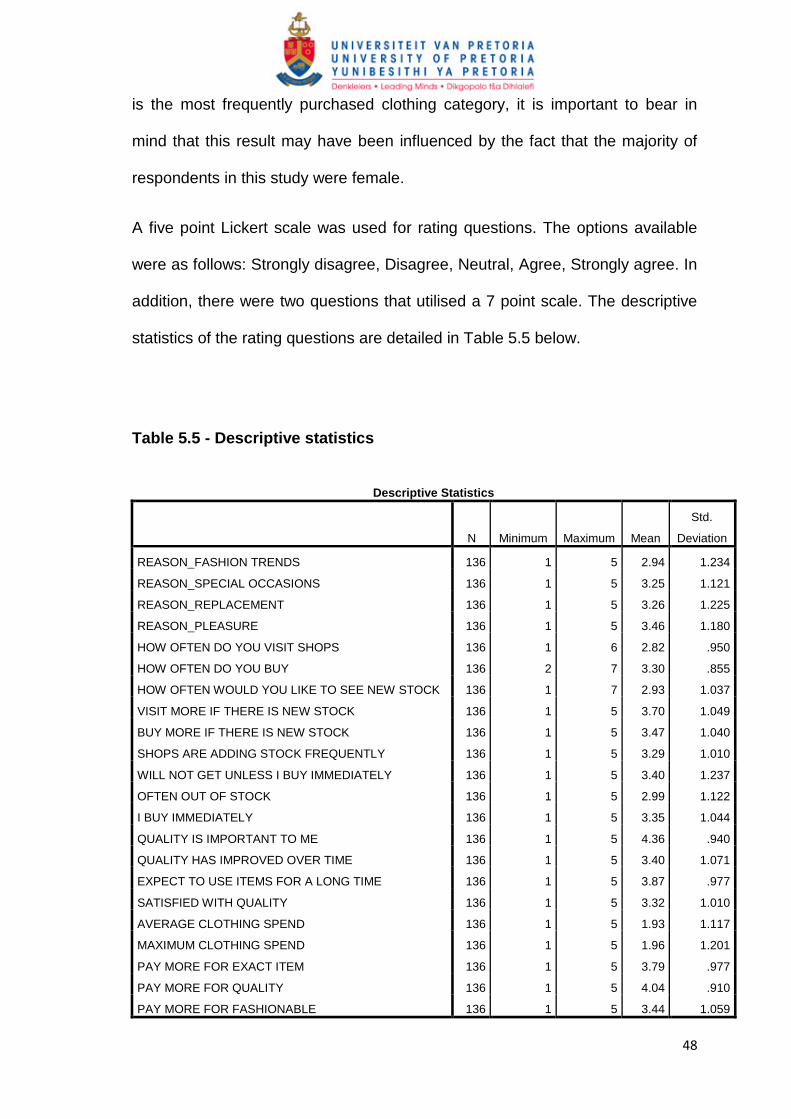
A five point Lickert scale was used for rating questions. The options available
were as follows: Strongly disagree, Disagree, Neutral, Agree, Strongly agree. In
addition, there were two questions that utilised a 7 point scale. The descriptive
statistics of the rating questions are detailed in Table 5.5 below.
Table 5.5 - Descriptive statistics
Descriptive Statistics
N Minimum Maximum Mean
Std.
Deviation
REASON_FASHION TRENDS 136 1 5 2.94 1.234
REASON_SPECIAL OCCASIONS 136 1 5 3.25 1.121
REASON_REPLACEMENT 136 1 5 3.26 1.225
REASON_PLEASURE 136 1 5 3.46 1.180
HOW OFTEN DO YOU VISIT SHOPS 136 1 6 2.82 .950
HOW OFTEN DO YOU BUY 136 2 7 3.30 .855
HOW OFTEN WOULD YOU LIKE TO SEE NEW STOCK 136 1 7 2.93 1.037
VISIT MORE IF THERE IS NEW STOCK 136 1 5 3.70 1.049
BUY MORE IF THERE IS NEW STOCK 136 1 5 3.47 1.040
SHOPS ARE ADDING STOCK FREQUENTLY 136 1 5 3.29 1.010
WILL NOT GET UNLESS I BUY IMMEDIATELY 136 1 5 3.40 1.237
OFTEN OUT OF STOCK 136 1 5 2.99 1.122
I BUY IMMEDIATELY 136 1 5 3.35 1.044
QUALITY IS IMPORTANT TO ME 136 1 5 4.36 .940
QUALITY HAS IMPROVED OVER TIME 136 1 5 3.40 1.071
EXPECT TO USE ITEMS FOR A LONG TIME 136 1 5 3.87 .977
SATISFIED WITH QUALITY 136 1 5 3.32 1.010
AVERAGE CLOTHING SPEND 136 1 5 1.93 1.117
MAXIMUM CLOTHING SPEND 136 1 5 1.96 1.201
PAY MORE FOR EXACT ITEM 136 1 5 3.79 .977
PAY MORE FOR QUALITY 136 1 5 4.04 .910
PAY MORE FOR FASHIONABLE 136 1 5 3.44 1.059
���
�
5.5 Testing the Research Propositions
The propositions being tested are detailed in Chapter 3 of this study and relate
to the literature review outlined in Chapter 2.
Descriptive as well as inferential statistics were conducted. The initial
examination consisted of compiling a histogram and box plot to conduct a visual
assessment, as well as determining the mean, standard deviation and level of
normality.
The statistical test chosen was correlation analysis which is described as “the
measurement of the strength of the linear relationship between two variables”
(Wiers, 2008, p. 567). The Pearson product moment correlation technique was
used. This is also known as the sample correlation coefficient. The technique
was deemed to be appropriate because it is able to provide a measure of linear
association between two variables (Anderson et al, 2007). The scale used for
the correlations is as follows: small = 0.10 to 0.29; medium = 0.30 to 0.49; large
= .50 to 1.0 (Pallant, 2001).
Additionally, a regression analysis was conducted in order to describe the
relationship between variables (Wiers, 2008). This is supported by Anderson et
al (2007) who indicate that detecting linear association between variables using
correlation does not necessarily imply causation.
���
�
Wiers (2008) highlights that as part of the methodology of a regression analysis,
a scatter plot or diagram may be constructed and then analysed visually to see
if the points could be said to roughly follow the shape of a straight line. This
methodology was also followed in this analysis.
For Propositions that require a comparison of groups, the t-test for means was
conducted. Wiers (2008) supports this method as a valid method of comparing
the means of two samples which are independent.
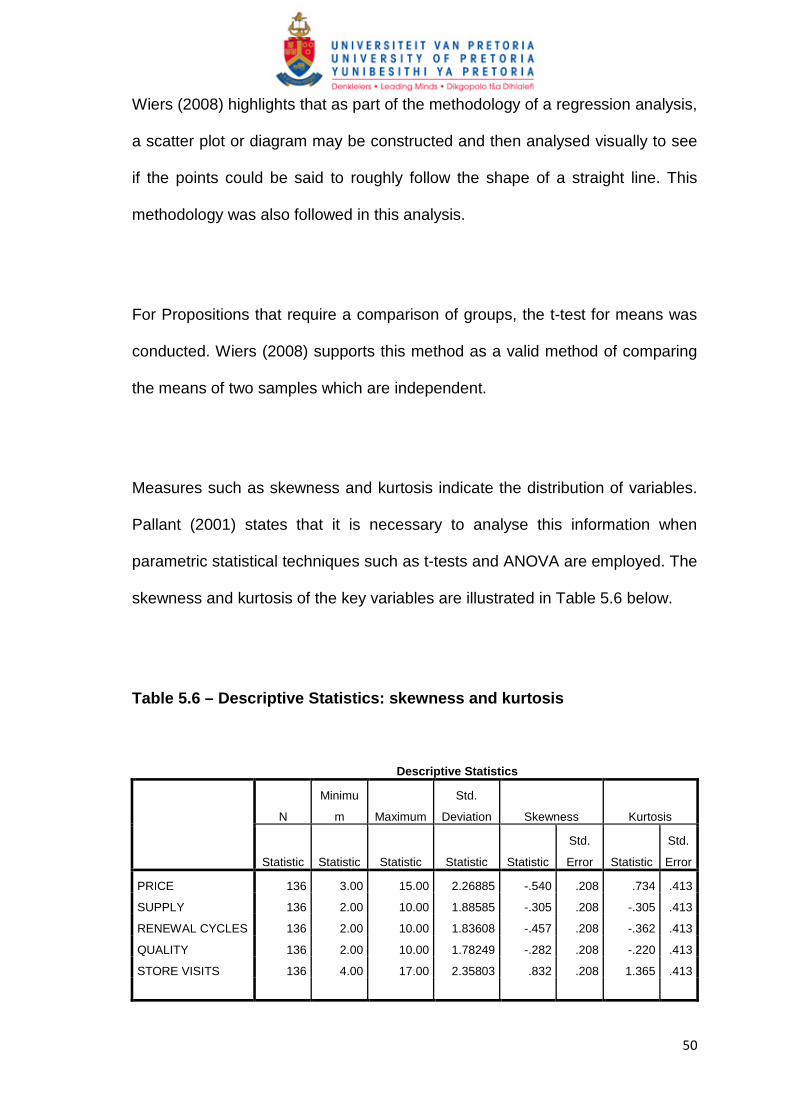
Measures such as skewness and kurtosis indicate the distribution of variables.
Pallant (2001) states that it is necessary to analyse this information when
parametric statistical techniques such as t-tests and ANOVA are employed. The
skewness and kurtosis of the key variables are illustrated in Table 5.6 below.
Table 5.6 – Descriptive Statistics: skewness and kurtosis
Descriptive Statistics
N
Minimu
m Maximum
Std.
Deviation Skewness Kurtosis
Statistic Statistic Statistic Statistic Statistic
Std.
Error Statistic
Std.
Error
PRICE 136 3.00 15.00 2.26885 -.540 .208 .734 .413
SUPPLY 136 2.00 10.00 1.88585 -.305 .208 -.305 .413
RENEWAL CYCLES 136 2.00 10.00 1.83608 -.457 .208 -.362 .413
QUALITY 136 2.00 10.00 1.78249 -.282 .208 -.220 .413
STORE VISITS 136 4.00 17.00 2.35803 .832 .208 1.365 .413
� �
�
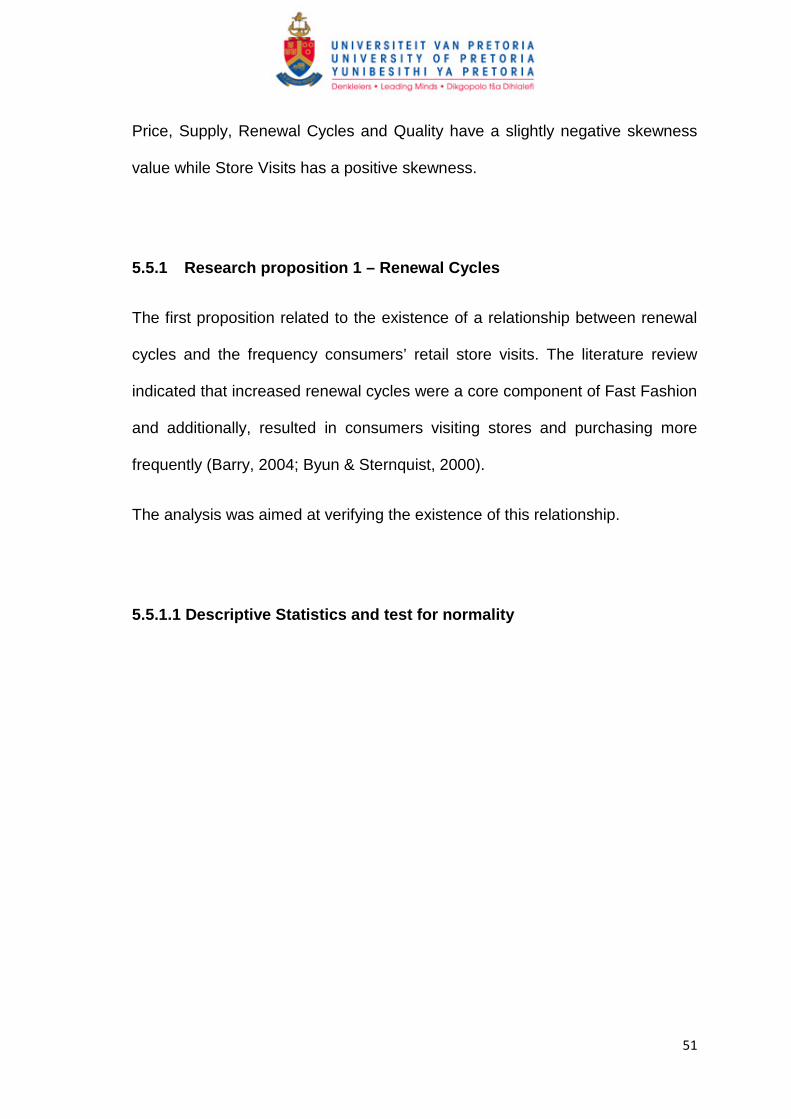
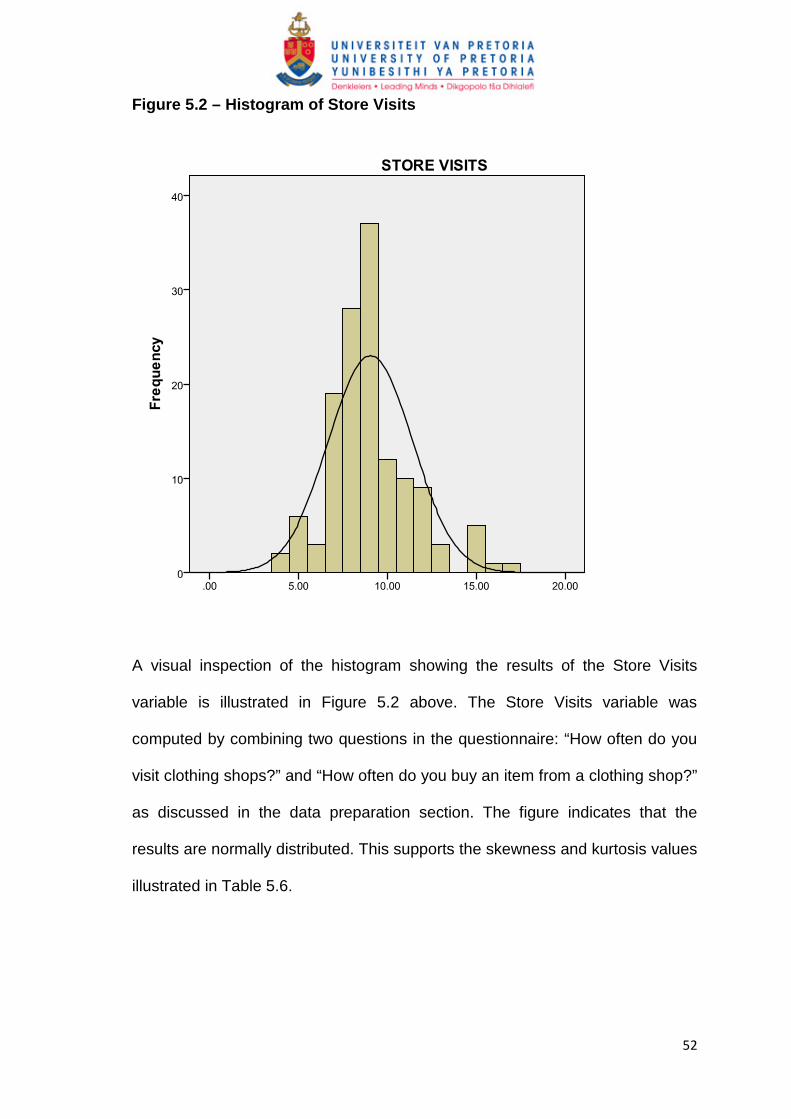
Price, Supply, Renewal Cycles and Quality have a slightly negative skewness
value while Store Visits has a positive skewness.
5.5.1 Research proposition 1 – Renewal Cycles
The first proposition related to the existence of a relationship between renewal
cycles and the frequency consumers’ retail store visits. The literature review
indicated that increased renewal cycles were a core component of Fast Fashion
and additionally, resulted in consumers visiting stores and purchasing more
frequently (Barry, 2004; Byun & Sternquist, 2000).
The analysis was aimed at verifying the existence of this relationship.
5.5.1.1 Descriptive Statistics and test for normality
���
�
Figure 5.2 – Histogram of Store Visits
A visual inspection of the histogram showing the results of the Store Visits
variable is illustrated in Figure 5.2 above. The Store Visits variable was
computed by combining two questions in the questionnaire: “How often do you
visit clothing shops?” and “How often do you buy an item from a clothing shop?”
as discussed in the data preparation section. The figure indicates that the
results are normally distributed. This supports the skewness and kurtosis values
illustrated in Table 5.6.
���
�
Figure 5.3 – Histogram of Renewal Cycles variable
A visual inspection of the histogram showing the results of the Renewal Cycles
variable is illustrated in Figure 5.3 above. This supports the skewness and
kurtosis values illustrated in Table 5.8. As discussed in the data preparation
section, the Renewal Cycles variable was computed by combining two
questions in the questionnaire: “I would visit a clothing store more often if there
was a new range of clothing items on each visit” and “I would buy more often if
there was a new range of clothing on each visit”. The figure indicates that the
results are normally distributed.
���
�
5.5.1.2 Inferential Statistics – Correlation
Proposition 1 was evaluated by conducting correlations to determine the nature
and extent of the relationship between Store Visits and Renewal Cycles. The
bivariate Pearson product-moment correlation coefficient was used. The output
of this is illustrated in Table 5.7 below.
Table 5.7 – Correlations: Renewal Cycles
Correlations
STORE VISITS
RENEWAL
CYCLES
STORE VISITS Pearson Correlation 1 -.224**
Sig. (2-tailed) .009
N 136 136
RENEWAL CYCLES Pearson Correlation -.224** 1
Sig. (2-tailed) .009
N 136 136
**. Correlation is significant at the 0.01 level (2-tailed).
The output illustrates that the outcome of the Pearson correlation coefficient is -
0.224. The negative sign indicates that a negative correlation exists between
the two variables while the number indicates that the strength of the correlation
is small.
5.5.1.3 Regression Analysis
Multiple regression was used to analyse the relationship between Store Visits,
which is the dependent variable and Renewal Cycles, which is the independent
���
�
variable. The output of this is illustrated in Table 5.8, Table 5.9, Table 5.10 and
Figure 5.4 below.
Table 5.8 – Model Summary: Renewal Cycles
Model Summaryb
Model R R Square Adjusted R Square
Std. Error of the
Estimate
1 .224a .050 .043 2.30643
a. Predictors: (Constant), RENEWAL CYCLES
b. Dependent Variable: STORE VISITS
The R Square value illustrated in the Model Summary is 0.050. This indicates
that only 5% of the variance of the dependent variable (Store Visits) is
explained by the independent variable (Renewal Cycles).
Table 5.9 – ANOVA: Renewal Cycles
ANOVAb
Model Sum of Squares df Mean Square F Sig.
1 Regression 37.813 1 37.813 7.108 .009a
Residual 712.826 134 5.320
Total 750.640 135
a. Predictors: (Constant), RENEWAL CYCLES
b. Dependent Variable: STORE VISITS
��
�
The Sig. value of 0.009 indicated in the ANOVA is less than 0.05 which
indicates that the result is significant.
Table 5.10 – Coefficients: Renewal Cycles
Coefficientsa
Model
Unstandardized
Coefficients
Standardized
Coefficients
t Sig.
Collinearity
Statistics
B
Std.
Error Beta Tolerance VIF
1 (Constant) 11.118 .800 13.899 .000
RENEWAL
CYCLES
-.288 .108 -.224 -2.666 .009 1.000 1.000
a. Dependent Variable: STORE VISITS
The Beta coefficient of -.224 along with the Sig value of 0.009 indicates that the
independent variable (Renewal Cycle) makes a contribution that is both unique
and statistically significant to the dependent variable (Store Visits).
��
�
Figure 5.4 – Normal probability plot: Renewal Cycles
The normal probability plot indicates that the data points follow a relatively
straight line that runs diagonally from the bottom left. This indicates normality in
their distribution.
5.5.1.4 Research proposition 1 - Conclusion
Based on the findings above, Renewal Cycles are related to consumers’ retail
store visits. The nature of the relationship is: negative, unique and statistically
significant.
���
�
5.5.2 Research proposition 2 – Supply
The second proposition related to the existence of a relationship between
supply and the frequency consumers’ retail store visits. The literature review
indicated that decreasing supply or creating the perception of reduced supply
was a core component of Fast Fashion and additionally, resulted in consumers
visiting stores and purchasing more frequently (Byun & Sternquist, 2008)
5.5.2.1 Descriptive Statistics and test for normality
Figure 5.5 – Histogram of Supply variable
���
�
A visual inspection of the histogram showing the results of the Supply variable
is illustrated in Figure 5.5 above. As discussed in the data preparation section,
the Supply variable was computed by combining two questions in the
questionnaire: “When I see something I want, I am afraid that I will not get the
right size or colour if I do not buy immediately” and “The clothing items I wish to
buy are often out of stock”. The figure indicates that the results are normally
distributed. This supports the skewness and kurtosis values illustrated in Table
5.6.
5.5.2.2 Inferential Statistics – Correlation
Proposition 2 was evaluated by conducting correlations to determine the nature
and extent of the relationship between Store Visits and Supply. The bivariate
Pearson product-moment correlation coefficient was used. The output of this is
illustrated in Table 5.11 below.
Table 5.11 – Correlations: Supply
Correlations
STORE VISITS
SUPPLY
STORE VISITS Pearson Correlation 1 -.069
Sig. (2-tailed) .422
N 136 136
SUPPLY Pearson Correlation -.069 1
Sig. (2-tailed) .422
N 136 136
��
�
The output illustrates that the outcome of the Pearson correlation coefficient is -
0.069. The negative sign indicates that a negative correlation exists between
the two variables while the number indicates that the strength of the correlation
is very small.
5.5.2.3 Regression Analysis
Table 5.12 – Model Summary: Supply
Model Summaryb
Model R R Square Adjusted R Square
Std. Error of the
Estimate
1 .069a .005 -.003 2.36110
a. Predictors: (Constant), SUPPLY
b. Dependent Variable: STORE VISITS
The R Square value illustrated in the Model Summary is 0.005. This indicates
that only 0.5% of the variance of the dependent variable (Store Visits) is
explained by the independent variable (Supply).
Table 5.13 – ANOVA: Supply
ANOVAb
Model Sum of Squares df Mean Square F Sig.
1 Regression 3.618 1 3.618 .649 .422a
Residual 747.022 134 5.575
Total 750.640 135
a. Predictors: (Constant), SUPPLY
b. Dependent Variable: STORE VISITS
�
�
The Sig. value of 0.422 indicated in the ANOVA is greater than 0.05 which
indicates that the result is not significant.
Table 5.14 – Coefficients: Supply
Coefficientsa
Model
Unstandardized
Coefficients
Standardized
Coefficients
t Sig.
Collinearity Statistics
B
Std.
Error Beta Tolerance VIF
1 (Constant) 9.605 .717 13.398 .000
SUPPLY -.087 .108 -.069 -.806 .422 1.000 1.000
a. Dependent Variable: STORE VISITS
The Beta coefficient of -.069 along with the Sig value of 0.422 indicates that the
independent variable (Supply) does not make a unique, statistically significant
contribution to the dependent variable (Store Visits).
��
�
Figure 5.6 - Normal probability plot: Supply
The normal probability plot indicates that the data points follow a relatively
straight line that runs diagonally from the bottom left. This indicates normality in
their distribution.
5.5.2.4 Research proposition 2 - Conclusion
Based on the findings above, Supply is related to consumers’ retail store visits
and purchases. The nature of the relationship is: negative, but not unique or
statistically significant.
��
�
5.5.3 Research proposition 3 – Quality
The third proposition related to the existence of a relationship between quality
and the frequency consumers’ retail store visits. The literature review indicated
that reduced quality, which is a core component of Fast Fashion, resulted in
consumers visiting stores and purchasing more frequently (Bhardwaj &
Fairhurst, 2010)
5.5.3.1 Descriptive Statistics and test for normality
Figure 5.7 – Histogram for Quality Variable
��
�
A visual inspection of the histogram showing the results of the Quality variable
is illustrated in Figure 5.7 above. As discussed in the data preparation section,
the Quality variable was computed by combining two questions in the
questionnaire: “The quality of clothing items available in stores has improved
over time” and “I am satisfied with the quality of clothing items in stores”. The
figure indicates that the results are normally distributed. This supports the
skewness and kurtosis values illustrated in Table 5.6.
5.5.3.2 Inferential Statistics –Correlation
Proposition 3 was evaluated by conducting correlations to determine the nature
and extent of the relationship between Store Visits and Quality. The bivariate
Pearson product-moment correlation coefficient was used. The output of this is
illustrated in Table 5.15 below.
Table 5.15 – Correlations: Quality
Correlations
STORE VISITS
QUALITY
STORE VISITS Pearson Correlation 1 -.023
Sig. (2-tailed) .790
N 136 136
QUALITY Pearson Correlation -.023 1
Sig. (2-tailed) .790
N 136 136
��
�
The output illustrates that the outcome of the Pearson correlation coefficient is -
0.023. The negative sign indicates that a negative correlation exists between
the two variables while the number indicates that the strength of the correlation
is very small.
5.5.3.3 Regression Analysis
Table 5.16 – Model Summary: Quality
Model Summaryb
Model R R Square Adjusted R Square
Std. Error of the
Estimate
1 .023a .001 -.007 2.36618
a. Predictors: (Constant), QUALITY
b. Dependent Variable: STORE VISITS
The R Square value illustrated in the Model Summary is 0.001. This indicates
that only 0.1% of the variance of the dependent variable (Store Visits) is
explained by the independent variable (Quality).
�
�
Table 5.17 – ANOVA: Quality
ANOVAb
Model Sum of Squares df Mean Square F Sig.
1 Regression .400 1 .400 .071 .790a
Residual 750.240 134 5.599
Total 750.640 135
a. Predictors: (Constant), QUALITY
b. Dependent Variable: STORE VISITS
The Sig. value of 0.790 indicated in the ANOVA is greater than 0.05 which
indicates that the result is not significant.
Table 5.18 – Coefficients: Quality
Coefficientsa
Model
Unstandardized
Coefficients
Standardized
Coefficients
t Sig.
Collinearity Statistics
B Std. Error Beta Tolerance VIF
1 (Constant) 9.257 .795 11.644 .000
QUALITY -.031 .114 -.023 -.267 .790 1.000 1.000
a. Dependent Variable: STORE VISITS
The Beta coefficient of -.023 along with the Sig value of 0.790 indicates that the
independent variable (Quality) does not make a unique, statistically significant
contribution to the dependent variable (Store Visits).
�
�
Figure 5.8 - Normal probability plot: Quality
The normal probability plot indicates that the data points do not follow a
relatively straight line that runs diagonally from the bottom left. This indicates a
deviation from normality in their distribution.
5.5.3.4 Research proposition 3 - Conclusion
Based on the findings above, Quality is related to consumers’ retail store visits.
The nature of the relationship is: negative, but not unique or statistically
significant.
��
�
5.5.4 Research proposition 4 – Price
The fourth proposition related to the existence of a relationship between price
and the frequency consumers’ retail store visits. The literature review indicated
that reduced prices were a core component of Fast Fashion and additionally,
resulted in consumers visiting stores and purchasing more frequently (Bhardwaj
& Fairhurst, 2010).
5.5.4.1 Descriptive Statistics and test for normality
Figure 5.9 – Histogram for Price variable
��
�
A visual inspection of the histogram showing the results of the Price variable is
illustrated in Figure 5.9 above. The Price variable was computed by combining
three questions in the questionnaire: ”I would be willing to pay a higher price to
get the exact clothing item I want ”, “I would be willing to pay a higher price to
get clothing items of a higher quality” and “I would be willing to pay a higher
price to get clothing items that are fashionable and trendy, ” as discussed in the
data preparation section. The figure indicates that the results are normally
distributed. This supports the skewness and kurtosis values illustrated in Table
5.6.
5.5.4.2 Inferential Statistics –Correlation
Proposition 4 was evaluated by conducting correlations to determine the nature
and extent of the relationship between Store Visits and Price. The bivariate
Pearson product-moment correlation coefficient was used. The output of this is
illustrated in Table 5.19 below.
Table 5.19 – Correlations: Price
Correlations
STORE VISITS
PRICE
STORE VISITS Pearson Correlation 1 -.212*
Sig. (2-tailed) .013
N 136 136
PRICE Pearson Correlation -.212* 1
Sig. (2-tailed) .013
N 136 136
*. Correlation is significant at the 0.05 level (2-tailed).
��
�
The output illustrates that the outcome of the Pearson correlation coefficient is -
0.212. The negative sign indicates that a negative correlation exists between
the two variables while the number indicates that the strength of the correlation
is small.
5.5.4.3 Regression Analysis
Table 5.20 – Model Summary: Price
Model Summaryb
Model R R Square Adjusted R Square
Std. Error of the
Estimate
1 .212a .045 .038 2.31316
a. Predictors: (Constant), PRICE
b. Dependent Variable: STORE VISITS
The R Square value illustrated in the Model Summary is 0.045. This indicates
that only 4.5% of the variance of the dependent variable (Store Visits) is
explained by the independent variable (Price).
�
�
Table 5.21 – ANOVA: Price
ANOVAb
Model Sum of Squares df Mean Square F Sig.
1 Regression 33.643 1 33.643 6.288 .013a
Residual 716.997 134 5.351
Total 750.640 135
a. Predictors: (Constant), PRICE
b. Dependent Variable: STORE VISITS
The Sig. value of 0.013 indicated in the ANOVA is less than 0.05 which
indicates that the result is significant.
Table 5.22 – Coefficients: Price
Coefficientsa
Model
Unstandardized
Coefficients
Standardized
Coefficients
t Sig.
Collinearity Statistics
B
Std.
Error Beta Tolerance VIF
1 (Constant) 11.532 1.009 11.431 .000
PRICE -.220 .088 -.212 -2.508 .013 1.000 1.000
a. Dependent Variable: STORE VISITS
The Beta coefficient of -.212 along with the Sig value of 0.013 indicates that the
independent variable (Price) makes a contribution that is both unique and
statistically significant to the dependent variable (Store Visits).
��
�
Figure 5.10 - Normal probability plot: Price
The normal probability plot indicates that the data points follow a relatively
straight line that runs diagonally from the bottom left. This indicates normality in
their distribution.
5.5.4.4 Research proposition 4 - Conclusion
Based on the findings above, Price is related to consumers’ retail Store Visits.
The nature of the relationship is: negative, unique and statistically significant.
��
�
5.5.5 Research proposition 5 – Gender
The fifth proposition related to the existence of significant differences between
different groups of consumers. The literature review indicated Fast Fashion and
fashion in general is perceived differently by consumers based on their age
groupings or gender classifications (Khare & Rakesh, 2010a). This proposition
focussed of gender as the main differentiating variable and conducted an
analysis of the five main variables of this study, namely: frequency of store visits
and purchases, renewal cycles, supply, quality and cost.
5.5.5.1 Descriptive Statistics
Table 5.23 - Gender
GENDER
Frequency Percent
Cumulative
Percent
Valid FEMAL
E
84 61.8 61.8
MALE 52 38.2 100.0
Total 136 100.0
��
�
5.5.5.2 Inferential Statistics – t-test for means
Table 5.24 – Group Statistics
Group Statistics
GENDER
N Mean Std. Deviation Std. Error Mean
STORE VISITS FEMALE 84 8.9881 2.31024 .25207
MALE 52 9.1538 2.45257 .34011
RENEWAL CYCLES FEMALE 84 7.2262 1.91601 .20905
MALE 52 7.0769 1.71323 .23758
SUPPLY FEMALE 84 6.5714 1.98965 .21709
MALE 52 6.0769 1.67854 .23277
QUALITY FEMALE 84 6.6429 1.80790 .19726
MALE 52 6.8654 1.74927 .24258
PRICE FEMALE 84 11.2262 2.21904 .24212
MALE 52 11.3462 2.36713 .32826
Table 5.25 – Independent Samples t-test
Independent Samples Test
Levene's Test
for Equality of
Variances t-test for Equality of Means
F Sig. t df
Sig.
(2-
tailed)
Mean
Differen
ce
Std. Error
Difference
95% Confidence
Interval of the
Difference
Lower Upper
STORE
VISITS
Equal variances
assumed
.121 .729 -.397 134 .692 -.16575 .41738 -.99126 .65976
Equal variances
not assumed -.392 103.269 .696 -.16575 .42334 -1.00531 .67381
RENEWA
L
CYCLES
Equal variances
assumed
2.806 .096 .459 134 .647 .14927 .32493 -.49339 .79193
Equal variances
not assumed .472 117.330 .638 .14927 .31646 -.47745 .77599
��
�
SUPPLY Equal variances
assumed
3.586 .060 1.493 134 .138 .49451 .33126 -.16067 1.14968
Equal variances
not assumed 1.554 121.719 .123 .49451 .31829 -.13560 1.12461
QUALITY Equal variances
assumed
.020 .887 -.706 134 .481 -.22253 .31511 -.84576 .40071
Equal variances
not assumed -.712 110.940 .478 -.22253 .31266 -.84209 .39703
PRICE Equal variances
assumed
.261 .610 -.299 134 .766 -.11996 .40170 -.91446 .67453
Equal variances
not assumed -.294 102.875 .769 -.11996 .40789 -.92893 .68901
The output of the independent samples t-test gives Sig. (2 tailed) values of
0.692, 0.647, 0.138, 0.481, and 0.766 respectively at the 95% confidence
interval. This indicates that there are no significant differences in any of the
variables since these values are all above the threshold of 0.05.
5.5.5.3 Research Proposition 5 – Conclusion
There is no significant difference in the mean scores of male and female
respondents with regards to the variables in question.
�
�
�
Chapter 6: DISCUSSIONS OF RESULTS
6.1 Introduction
As discussed in the introduction detailed in Chapter 1 Fast Fashion has become
standard practice for modern fashion retailers. The chapter demonstrated two
key business drivers for the adoption of this strategy.
The first key motivator for businesses to adopt Fast Fashion is its ability to
provide superior returns and sales when compared to other retailers, this was
evidenced by the latest results of South African retail giant, The Foschini Group
(TFG) which credited their success on the adoption of Fast Fashion. The
second motivator is the adoption of Fast Fashion as a defence against other
firms who may seek to gain a competitive advantage by adopting the strategy
and thus gain market dominance. This was evidenced by the entry of Fast
Fashion retailer Zara into the Australian market, a move that is anticipated to
negatively impact retailers sales volumes and prices: “without a doubt, Zara will
take market share from other local brands. They will take a little bit from a lot of
retailers. Some may not survive.” (The Australian, 2011, April 18, p. 23).
In addition to the business perspective of Fast Fashion, the academic
perspective was also introduced. The current body of literature was briefly
reviewed while potential gaps relating to consumer aspects of Fast Fashion
were highlighted.
�
�
The literature review outlined in Chapter 2 distilled a comprehensive definition
of Fast Fashion by exploring a range of previous studies on the subject. The
context of the phenomenon was created by outlining the challenges faced by
retailers and the manner in which Fast Fashion attempted to solve these. The
three key theoretical perspectives and the arguments that underpin them were
briefly discussed, one asserting that Fast Fashion is a supply chain innovation,
another stating that it belongs exclusively in the realm of consumers while a
third view held that Fast Fashion is a combination of both.
The perspective which was adopted held that Fast Fashion systems are made
up of a combination of two distinct components: enhanced design, which is
consumer driven, and rapid production, which is supply chain driven (Byun &
Sternquist, 2008; Cachon & Swinney, 2009a). The discussion continued with a
focus on the gap that was identified in the consumer aspects of Fast Fashion.
Consumer behaviour was discussed along with its key variables. Renewal
Cycles, Supply, Quality, Price and Gender were outlined in the literature as
variables that were related to consumers in addition to being critical aspect
impacted by Fast Fashion. Potential relationships that exist between these
constructs were also highlighted.
��
�
Chapter 3 formalised five propositions related to the key consumer variables
identified. Data was gathered according to the Methodology outlined in Chapter
4 and the results were outlined in Chapter 5.
6.2 Research proposition 1 – Renewal Cycles
“Renewal cycles are related to the frequency of consumers’ retail store visits ”
The evaluation of the first proposition yielded a mixed set of results. The
Literature review suggested that by increasing their renewal cycles (getting new
stock more often) retailers were able to encourage consumers to frequent their
stores more often. The results of the Pearson correlation coefficient however
indicated that this relationship is negative in nature, implying that an increase in
the renewal cycle is likely to result in reduced frequency of store visits and vice
versa.
This unexpected result demonstrates the view that consumers seldom evaluate
renewal cycles in isolation and often combine it with other factors. Harrow and
Lea-greenwood (2005) found that consumer satisfaction, which is marked by
increased store loyalty and increased buying frequency, consisted of three
elements: shopping systems satisfaction, buying systems satisfaction and
satisfaction derived from the use of the product. The renewal cycle variable in
this study explored the shopping system dynamic in isolation which may
��
�
account for the mixed set of results. The strength of this negative relationship
was found to be small, but statistically significant.
The regression analysis indicated that Renewal Cycles only accounted for 5%
of the variation in Store Visits. This was illustrated by The R Square value of
0.050. This result implies that there exists other variables which have a more
significant bearing in determining the Store Visits variable. The ANOVA and
coefficient beta indicate that the result is both unique and statistically significant.
Both the Renewal cycles and the Store Visits variables were normally
distributed. Their cumulative probability plot was also found to be normally
distributed.
6.3 Research proposition 2 – Supply
“Supply is related to the frequency of consumers’ retail store visits”
The literature review indicated that reduced supply (by limiting quantities of
stock available) resulted in consumers visiting stores and purchasing more
frequently. The evaluation of the second proposition revealed that the Pearson
correlation coefficient had a negative sign, thus the proposed negative
correlation was supported meaning that reducing the amount of stock available
resulted in consumers increasing the frequency of their store visits and
purchases.
���
�
The magnitude of this relationship was deemed to be very small. This was
supported by the R Square value which indicates that only 0.5% of the variance
in the Store Visits variable is explained by the Supply variable. The ANOVA and
coefficients indicate that this result is not unique or statistically significant.
The histogram indicates that the Supply variable is normally distributed.
6.4 Research proposition 3 – Quality
“Quality is related to the frequency of consumers’ retail store visits ”
The literature review indicated that reduced quality, resulted in consumers
increasing the frequency of their store visits. Although the negative Pearson
correlation coefficient supported this proposition, the result of the ANOVA and
regression analysis this result to be very small and statistically insignificant.
This result makes intuitive sense and supports an observation made in the
literature review that quality and price are often evaluated simultaneously by
consumers. Miyazaki et al. (2005), Grewal and Goodstein (2005), as well as
Boyle and Lathrop (2009) all held that a relationship exists between price and
� �
�
quality because price is often used by consumers as an indicator of product
quality. Additionally, other product related attributes such as warranties, country
of origin or brand names are used as an indicator of quality and have an
influence of the perceptions that consumers have of quality (Miyazaki et al.,
2005). Moderating for these external influences or including them in the
construct of the Quality variable may be required to gain a clearer perspective.
6.5 Research proposition 4 – Price
“Cost is related to the frequency of consumers’ retail store visits ”
The evaluation of the fourth proposition upheld the findings outlined in the
literature review which indicated that reduced prices resulted in consumers
visiting stores and purchasing more frequently. The Pearson correlation
coefficient of -0.212 supported this negative relationship. It was also indicated
that 4.5% of the variance in the Store Visits variable is due to the Prive variable.
The ANOVA and coefficients indicate that this result is both unique and
statistically significant while the normal distribution of the variables is verified by
the normal probability plot.
6.6 Research proposition 5 – Gender
“There are significant differences between male and female consumers in
relation to Renewal cycles, Supply, Quality and Cost”
���
�
The literature review indicated Fast Fashion and fashion in general is perceived
differently by consumers based on their age groupings or gender classifications.
The results of the independent samples t-test at the 95% confidence interval
indicates that there is no significant difference in the mean scores of male and
female respondents with regards to the variables in question.
Although this finding runs counter to the findings of studies mentioned in the
literature review outlined in Chapter 2, it is important to note that the sample
was collected from a single location which may have limited the variance of
responses received.
6.7 Conclusion
The discussion of the results indicates that Renewal Cycles, Supply, Quality
and Price are negatively correlated to Store Visits. In addition, Renewal Cycles
and Price were found to be statistically significant while Supply and Quality
were found to be statistically insignificant.
The discussion indicates that there exist other variables which have a larger
impact on Store Visits, thus highlighting a potential area of further research.
���
�
Chapter 7: CONCLUSION AND RECOMMENDATIONS
7.1 Introduction
This chapter indicates the main findings of the study and indicates areas for
future research. Recommendations are put forth and the limitations of the study
are outlined.
7.2 Summary of Key Findings
As outlined in the introduction presented in Chapter 1, the objective of this study
was to determine the applicability of Fast Fashion in South Africa by conducting
a study on consumers who frequent fashion retail stores. Key variables relating
to Fast Fashion and consumer behaviour were identified and propositions were
formulated and measured to gain conclusions which could be analysed.
The evidence presented in this study found that there was only a moderate level
of support for two propositions, while there was no support for the remaining
three. The propositions that received sufficient evidence to support them were:
• Proposition 1: Renewal cycles are related to the frequency of
consumers’ retail store Consumers, and
• Proposition 4: Price is related to the frequency of consumers’ retail
store visits
���
�
The propositions which were not supported were:
• Proposition 2: Supply is related to the frequency of consumers’ retail
store visits
• Proposition 3: Quality is related to the frequency of consumers’ retail
store visits, and
• Proposition 5: There are significant differences between male and
female consumers in relation to Renewal cycles, Supply, Quality and
Price
As mentioned previously, the propositions that were supported only received a
moderate amount of support. This implies that the key drivers of consumer
purchase behavior are still not sufficiently understood and there exist other
significant variables that have an impact on this consumer population.
7.3 Research Limitations
Because the research was conducted in a single geographical area, the
demographic profile of respondents was dominated by a single racial group and
did not adequately represent the demographic diversity of South Africa’s
consumer market.
Additionally, the instrument used had a limited number of scale items for each
construct that was measured. The internal consistency and reliability of the
findings could have been improved by using more scale items or questions to
measure each key construct or variable.
���
�
7.4 Recommendations
Based on these findings, it would seem that Price and Renewal Cycles would
be the key factors that would drive consumers towards increasing the frequency
of their visits to retail outlets as well as the frequency of their purchases.
As highlighted prior, the consumer is the initiator in the modern retail
environment. The retailer is tasked with having to respond to consumer tastes
and demands in the provision of goods and services. Should the retailer select
Fast Fashion as a means of response, these findings would suggest that it
would be prudent to implement Fast Fashion elements that will enable the
retailer to provide the consumer with a frequently changing range of products
(increased Renewal Cycles) in a cost effective manner (reduced Price).
The practices of international Fast Fashion giant, Zara provide a prime example
of mechanisms which can be implemented based on the findings of this study.
The first illustration is Zara’s low inventory policy: “every store receives small
batches of products twice a week, avoiding large inventories and creating a
climate of scarcity and opportunity” (Lopez & Fan, 2009, p. 281). Another
example is the retailers’ implementation of a consumer-centred pricing policy:
“Zara follows a market-based pricing strategy which sets the target prices that
the buyer is willing to pay” (Lopez & Fan, 2009, p. 281).
��
�
7.5 Suggestions for Further Research
As mentioned previously, one of the implications of the results of this study is
that there exist other variables that may significantly influence consumer
behaviour in fashion retail and potentially impact on retailers who wish to
implement Fast Fashion strategies. This study identified branding, country of
origin, warranties and service levels as potential variables which may be
explored.
Furthermore, it has been noted that a potential limitation of this study is the use
of a fairly homogeneous sample and a single location. It is suggested that this
study be repeated using a broader sample and geographical coverage in order
to get a broader perspective that is more representative of South Africa’s
demographic profile.
7.6 Conclusion
The researcher has found evidence demonstrating that Renewal Cycles and
Price are key variables for consumers in fashion retail affecting the frequency of
purchases and store visits. In addition, Supply and Quality were found to make
no significant contribution while there were no differences observed between
different gender groups.
It was recommended that the key variables which were found to be significant to
consumers be used as the basis for the implementation of any Fast Fashion
retail strategies.
��
�
It was further suggested that future research should be conducted to uncover
more key variables and to gain responses from demographically diverse
groups.
���
�
REFERENCES
Akinboade, O.A., Mokwena, M.P., & Kinfack, E.C. (2008). Estimating profit
efficiency among South African retail firms using stochastic frontier approach.
The International Review of Retail, Distribution and Consumer Research, 18(5),
511-520
Ander, W.N., & Stern, N. Z. (2004). Winning at retail: developing a sustained
model for retail success, New Jersey: John Wiley and Sons.
Anderson, D.R., Sweeney, D.J., Williams, T.A., Freeman, J., & Shoesmith, E.
(2007). Statistics for Business and Economics. London. Thomson Learning.
Barnes, L., & Lea-Greenwood, G. (2006). Fast fashioning the supply chain:
shaping the research agenda. Journal of Fashion Marketing and Management,
10(3), 259-271
Barry, N. (2004). Fast Fashion. European Retail Digest. 41, 1-8
Bhardwaj, V., & Fairhurst, A. (2010). Fast fashion: Response to changes in the
fashion industry. The international review of Retail, Distribution and Consumer
Research, 20(1), 165-173
Birtwistle, G., & Moore, C.M. (2007). Fashion clothing – Where does it all end
up. International Journal of Retail and Distribution Management. 35(3), 210-216
Birtwistle, G., & Morgan, L.R. (2009). An investigation of young fashion
consumer’s disposal habits. International Journal of Consumer Studies. 33,
190-198
���
�
Bitran, G., Caldentey, R., & Mondschein, S. (1998). Coordinating clearance
markdown sales of seasonal products in retail chains. Operations Research,
46(5), 609-624
Boyle, P.J., & Lathrop, E.S. (2009). Are consumers’ perceptions of price-quality
relationships well calibrated? International Journal of Consumer Studies, 33, 58-
63
Bruce, M., & Daly, L. (2006). Buyer behaviour for fast fashion. Journal of
Fashion Marketing and Management, 10(3), 329–344
Businessday, (2011, June 6). Fast fashion elemental to Foschini. Retrieved
from http://www.businessday.co.za/Content.aspx?id=144852, Accessed on
2011 June 17
Byun, S.E., & Sternquist, B. (2008). The antecedents of in-store hoarding:
Measurement and application in the fast fashion retail environment. The
International Review of Retail, Distribution and Consumer Research, 18(2), 133-
147
Cachon, G.P., & Swinney, R. (2009a). Purchase, pricing, and quick response in
the presence of strategic consumers. Management Science, 55(3), 497–511
Cachon, G.P., & Swinney, R. (2009b). The Value of Fast Fashion: Rapid
Production, Enhanced Design, and Strategic Consumer Behavior (Unpublished
doctoral dissertation or master’s thesis). The Wharton School, University of
Pennsylvania, Philadelphia
Castro, I. (2003). Zara Japan Corporation, Boletin Economico de ICE, 2770, 95-
98
���
�
Cho, H., & Lee, J. (2005). Development of a microscopic model on recent
fashion trends on the basis of consumer emotion. International Journal of
Consumer Studies, 29(1), 17-33
Choi, T., Liu, N., Liu, S., & Mak, J. To, Y. (2010). Fast fashion brand
extensions: An empirical study of consumer preferences. Brand Management,
17(7), 472-487
Christopher, M., Lowson, R., & Peck, H (2004). Creating agile supply chains in
the retail industry. International Journal of Retail & Distribution Management,
32(8), 367-378
Crewe, L., & Davenport, E. (1992). The puppet-show: changing buyer-supplier
relationships within clothing retailing. Transactions of the Institute for British
Geographers, 17, 183-197
Dalrymple, D.J. (1964). How important is stock turnover. Journal of Retailing,
40(4), 1-5
Datamonitor PLC. (2010). Apparel Retail Industry Profile: South Africa.
Datamonitor Plc
Doyle, S.A., Moore, C.M., & Morgan, L. (2006). Supplier management in fast
moving fashion retailing. Journal of Fashion, Marketing and Management,
10(3), 272-281
Evans, M. (1989). Consumer behaviour towards fashion. European Journal of
Marketing, 23(7), 7-16
� �
�
Fisher, L.M. (1997). What is the right supply chain fro your product. Harvard
Business Review, March-April 1997, 105-116
Fisher, M., & Rajaram, K. (2000). Accurate retail testing of fashion
merchandise: Methodology and application. Marketing Science, 19(3), 266-278
Fitzsimons, G.J. (2000). Consumer response to stockouts. Journal of Consumer
Research, 27, 249-267
Harrow, C., & Lea-Greenwood, G. (2005). The unhappy shopper, a retail
experience: Exploring fashion, fit and affordability. International Journal of Retail
and Distribution Management, 33(4), 298-309
Hayes, S.G., & Jones, N. (2006). Fast fashion: A financial snapshot. Journal of
Fashion Marketing and Management, 10(3), 288-300
Homburg, C., Koschate, N., & Hoyer, W.D. (2005). Do satisfied customers really
pay more? A study of customer satisfaction and willingness to pay. Journal of
Marketing, 69, 84-96
Kahn, B.E., & Schmittlein, D.C. (2001). The Relationship between purchases
made on promotion and shopping trip behavior. Journal of Retailing, 63(3), 294-
315
Khare, A., & Rakesh, S. (2010a). Predictors of fashion clothing involvement
among Indian youth. Journal of Targeting, Measurement and Analysis for
Marketing, 18(3), 209-220
Khare, A., & Rakesh, S. (2010b). Retailers in malls: Retailers’ preferences for
store space in Indian malls. Journal of Retail & Leisure Property, 9, 125-135
���
�
Lopez, C., & Fan, Y. (2009). Internationalisation of the Spanish fashion brand
Zara. Journal of Fashion Marketing and Management, 13(2), 279-296
Macinnis, D.J., & Folkes, V.S. (2009). The disciplinary status of consumer
behavior: A sociology of science perspective on key controversies. Journal of
Consumer Research, 30, 899-914
McBurney, D.H. (2001). Research methods, Fifth Edition, United States of
America, Wadsworth
Milner, J.M., & Kouvelis P. (2005). Order quantity and timing flexibility in supply
chains: The role of demand characteristics. Management Science, 51(6), 970-
985
Miyazaki, A.D., Grewal, D., & Goodstein, R.C. (2005). The effect of multiple
extrinsic cues on quality perceptions: A matter of consistency. Journal of
Consumer Research, 32, 146-153
Nair, H. (2007). Intertemporal price discrimination with forward-looking
consumers: Application to the US market for console video-games. Quantitative
Marketing and Economics, 5, 239-292
Pallant, J. (2001). SPSS Survival Manual, Great Britain. Open University Press
Palmer Development Group (2004). Description of retail nodes in SOWETO.
Retrieved from http:// www.joburg-archive.co.za/srs/retail_nodes.pdf, Accessed
on 21 January 2011
Punch, F.P. (2001). Developing Effective Research proposals, London, Sage
publications
���
�
Saunders, M., Lewis, P., & Thornhill, A. (2009). Research Methods for Business
Students, Fifth edition, England, Pearson Professional Limited
Sharp, B., & Dawes, J. (2001). What is differentiation and how does it work?
Journal of Marketing Management, 17, 739-759
Stanley, J. (2006). Just about everything a retail manager needs to know in
South Africa. South Africa. Zebra Press
Tharenou, P., Donohue, R., & Cooper, B. (2007). Management Research
Methods, First Edition, United States of America , Cambridge University Press
The Australian ( 2011, April 18). Rivals race to match Zara’s fast fashion. p23-
23. Date accessed 2011 June 17
Tyler, D., Heeley, J., & Bhamra, T. (2006). Supply chain influences on new
product development in fashion clothing. Journal of Fashion Marketing and
Management, 10(3), 316-328
Weiers, R. M. (2008). Introductory Business Statistics, Seventh Edition. London.
Cengage Learning
Workman, J.E., & Studak, C.M. (2006). Fashion consumers and fashion
problem recognition style. International Journal of Consumer Studies, 30, 75-84
Yuan, H., & Song, H (2011).
The effects of consumers’ price expectation on sellers’ dynamic pricing
strategies. Journal of Marketing Research, 47, 48-61
���
�
APPENDICIES
���
�
APPENDIX A – RESEARCH QUESTIONNAIRE
����������� � ��� � ��� � � ! "#�$"��%�� #�� #%"&�
�������'(��� ����������� ��� ������
*���� 34(�5� 0 6 �7#� �8 48 1*#&� �9& �(9 �
('�� 19&#*�
��
�����
���
� ����
���
������
���
� ����
���
�����
���
� ����
���
�����
���
8 %������
:��"��� . (4#� �#. (4#�
�
�������)(�*�������+��,������
6�%������!��'��������� ��)��������'����������������"���;� <#�� 98 �
0 ����������)��������'�"������!��� ����
)��,������;��
�
. ����
/ ����
0 � ����
/ ����
����"����
�/ ����
�����
/ ����
1�"���
/ ����
� �
+��������"��������/ � ���������'�������"���'����/ ��������)����/ ��'������ ����=�
�
. �� �����������)���!����'���������������)����/ �
)�����������"��
�����'���
"���'����
"���'���� �������� �'���� �����'���
�'����
. �� �����������)���!����'������������/ ��������%��
��������������������������"�
�����'���
"���'����
"���'���� �������� �'���� �����'���
�'����
. �� �����������)���!����'�����������������������
��"��������'���� ��
�����'���
"���'����
"���'���� �������� �'���� �����'���
�'����
. �� �����������)���!����'���������!���������'���
��������������>�� ����)�� ����
�����'���
"���'����
"���'���� �������� �'���� �����'���
�'����
�
�������-(�#�. �������
6�/ ��)����"������%������������'������;��
"����� 0 ��-��� . ������� #%������
������
#%�����
������
#%���� ��
������
. ���������
�� ������
6�/ ��)����"������!��������� �)�� ����������'�����;��
"����� 0 ��-��� . ������� #%������
������
#%�����
������
#%���� ��
������
. ���������
�� ������
6�/ ��)����/ ���"�������-�����������/ ��������'���� �����������;��
"����� 0 ��-��� . ������� #%������
������
#%�����
������
#%���� ��
������
. ���������
�� ������
�
+��������"��������/ � ���������'����/ ��������)����/ ��'������ ����=�
�
��/ ���"�%��������������'������� �����)�����)�
�������������/ ����'���)��������'���� �����
�����%������
�����'���
"���'����
"���'���� �������� �'���� �����'���
�'����
��/ ���"�!��� �����)�����)�������/ �������/ �
���'���)��������'���������%������
�����'���
"���'����
"���'���� �������� �'���� �����'���
�'����
�����������""��'���/ ��������'���� ����"�
��/ �����-��)��,��������
�����'���
"���'����
"���'���� �������� �'���� �����'���
�'����
�
��
�
�
�������/(�������
�
+��������"��������/ � ���������'����/ ��������)����/ ��'������ ����=�
�
0 ������������ �����'���/ ���?���� ��)���"�
�������/ ��������'���������'�����@�������������)���
"������!���� �"��������
�����'���
"���'����
"���'���� �������� �'���� �����'���
�'����
7����������'���� ����/ �������!��������)����
�����)�����-��
�����'���
"���'����
"���'���� �������� �'���� �����'���
�'����
0 ���������������� ���/ ���?���!������
� �"��������
�����'���
"���'����
"���'���� �������� �'���� �����'���
�'����
�
�������0(�1 ������
�
+��������"��������/ � ���������'����/ ��������)����/ ��'������ ����=�
�
A ����������%����� ����������� ��� �����'���
"���'����
"���'���� �������� �'���� �����'���
�'����
7���,��������)��������'���� ���%����!������
������������ ���%�"��%����� ���
�����'���
"���'����
"���'���� �������� �'���� �����'���
�'����
���$�����������������������'���� ���������
���������)��������'��� ���
�����'���
"���'����
"���'���� �������� �'���� �����'���
�'����
��� ������)��"�/ ��������,��������)��������'�
��� �������������
�����'���
"���'����
"���'���� �������� �'���� �����'���
�'����
�
�������2(�*����
8 ���%���'�?���/ � ����"������
��������������"����������� ��)�
�������';��
*�������
�����
*�� ����
* ����
* �� �
���
* ����
* �� �
���
*�����
*��� ����
����
0 ����������� �$� � �� ���������
����/ �����'��������)��������'������ ��)�
�������';��
*�������
�����
*�� ����
* ����
* �� �
���
* ����
* �� �
���
*�����
*��� ����
����
�
+��������"��������/ � ���������'����/ ��������)����/ ��'������ ����=�
�
��/ ���"�!��/ �����'������������'�������������'���
�����$�����������'���� ���/ �����
�����'���
"���'����
"���'���� �������� �'���� �����'���
�'����
��/ ���"�!��/ �����'������������'�������������'���
�������'���� ���)�����'����,��������
�����'���
"���'����
"���'���� �������� �'���� �����'���
�'����
��/ ���"�!��/ �����'������������'�������������'���
�������'���� �����������)�������!�����"�
����"���
�����'���
"���'����
"���'���� �������� �'���� �����'���
�'����
�
3������� ��� ������
7� �� � &���� �