Page 1
7/31/2019 Fast Fourier
http://slidepdf.com/reader/full/fast-fourier 1/18
http://www.facstaff.bucknell.edu/mastascu/elessonshtml/Freq/Freq4.html#FourierSeries
An Introduction To Fourier AnalysisIntroduction
The Fourier Series
Calculating The CoefficientsAn Example - Repetitive Pulse
ProblemsYou are at: Basic Concepts - System Models - Fourier Series
Click here to return to the Table of Contents
What are you trying to do in this lesson?
Here are some goals for this lesson
Given a signal as a time function,
Be able to compute the frequency components of the signal.
Be able to predict how the signal will interact with linear systems and
circuits using frequency response methods.
The first goal is really to be able to express a periodic signal in
frequency response language. The second goal is to be able to take a
frequency representation of a signal and use that representation to
predict how the signal will interact with systems.
Why Use Frequency Representations When We Can Represent AnySignal With Time Functions?
Signals are functions of time. A frequency response
representation is a way of representing the same signal as a
frequency function. Why bother - especially when we can represent
the signal as a function of time and manipulate it any way we want
there? For example,
• In a system, if we have the time function, we can solve an input-output differential equation to get the output, and
• We can plot functions of time and get information about them,
and
• etc., etc.
Page 2
7/31/2019 Fast Fourier
http://slidepdf.com/reader/full/fast-fourier 2/18
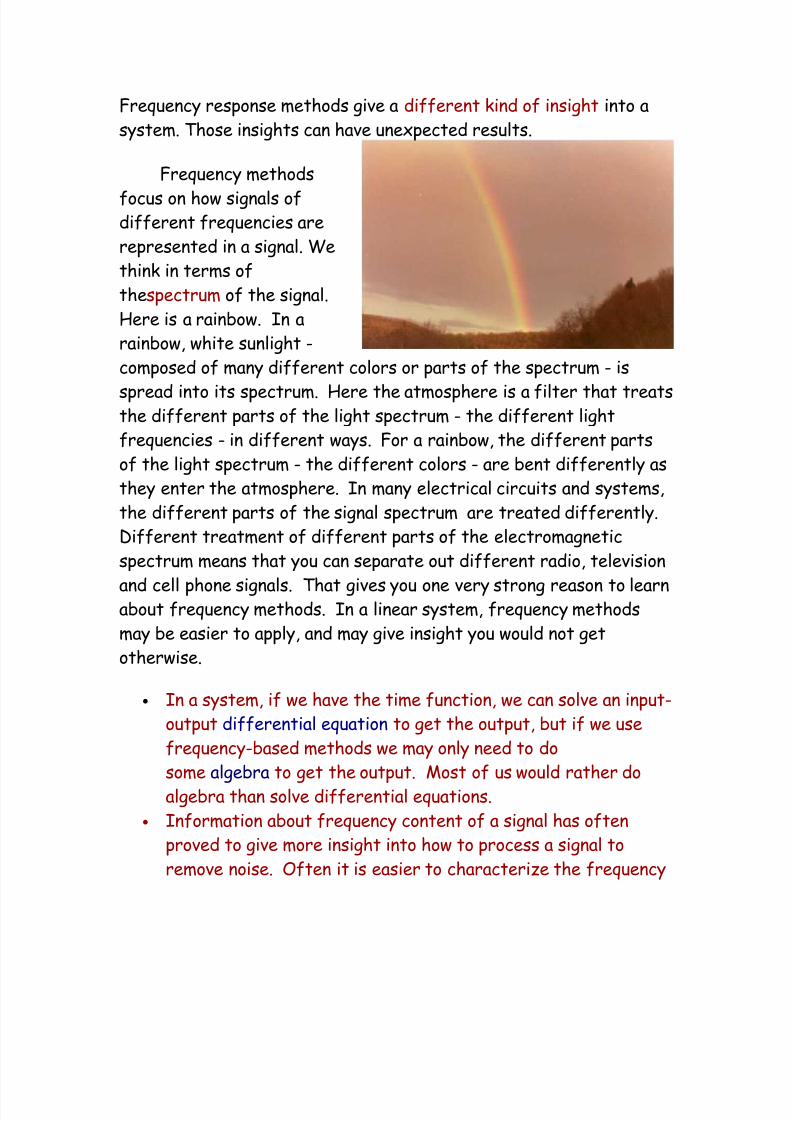
Frequency response methods give a different kind of insight into a
system. Those insights can have unexpected results.
Frequency methods
focus on how signals ofdifferent frequencies are
represented in a signal. We
think in terms of
thespectrum of the signal.
Here is a rainbow. In a
rainbow, white sunlight -
composed of many different colors or parts of the spectrum - is
spread into its spectrum. Here the atmosphere is a filter that treatsthe different parts of the light spectrum - the different light
frequencies - in different ways. For a rainbow, the different parts
of the light spectrum - the different colors - are bent differently as
they enter the atmosphere. In many electrical circuits and systems,
the different parts of the signal spectrum are treated differently.
Different treatment of different parts of the electromagnetic
spectrum means that you can separate out different radio, television
and cell phone signals. That gives you one very strong reason to learnabout frequency methods. In a linear system, frequency methods
may be easier to apply, and may give insight you would not get
otherwise.
• In a system, if we have the time function, we can solve an input-
output differential equation to get the output, but if we use
frequency-based methods we may only need to do
some algebra to get the output. Most of us would rather do
algebra than solve differential equations.
• Information about frequency content of a signal has often
proved to give more insight into how to process a signal to
remove noise. Often it is easier to characterize the frequency
Page 3
7/31/2019 Fast Fourier
http://slidepdf.com/reader/full/fast-fourier 3/18
content of a noise signal than it is to give a time description of
the noise.
So, give it a shot and try learning about frequency response
methods. They can save you time and money in the long run.Goals: What are you trying to do in this lesson?
Given a signal as a time function,
Be able to compute the frequency components of the signal.
Be able to predict how the signal will interact with linearsystems
and circuits using frequency response methods.
The Fourier Series
Some time ago, Fourier, doing heat transfer work, demonstratedthat any periodic signal can be viewed as a linear composition of sine
waves. Lets look at a periodic wave. Here is an example plot of a
signal that repeats every second.
Clearly this signal is not a sinusoid - and it looks as though it has
no relationship to sinusoidal signals. However, over a century ago,
Fourier showed that a periodic signal can always be represented as a
sum of sinusoids (sines and cosines, or sines with angles). That
representation is now called a Fourier Series in his honor.
Fourier not only showed that it was possible to represent a
periodic signal with sinusoids, he showed how to do it. Assuming this
signal repeats every T seconds, then we can describe it as a sum of
sinusoids. Here is the form of the sum. Fourier gave an explicit way
Page 4
7/31/2019 Fast Fourier
http://slidepdf.com/reader/full/fast-fourier 4/18
to get the coefficients in a Fourier Series and we need to look at
that in a while. First we are going to look at how a signal can be built
from a sum of sinusoids.
Here's that signal again. Is this signal a sum of sinusoids? We will
examine that question here now, starting with a single sine signal.
Here is a single sine signal.
The expression for this signal is just:
Sig(t) = 1 * sin(2 t/T) and T = 1 second.
Now, we are going to add one other sine to our original sine signal.
The sine we add will be at three times the frequency of the original
and it will be one third as large.
Page 5
7/31/2019 Fast Fourier
http://slidepdf.com/reader/full/fast-fourier 5/18
Sig(t) = 1 * sin(2 t/T) + (1/3) * sin(6 t/T)
This looks a little different. Continue by adding one more sine signal
- at five times the original frequency and one-fifth of the original
size.
Sig(t) = 1 * sin(2 t/T) + (1/3) * sin(6 t/T) + (1/5) * sin(10 t/T)
This is getting interesting. We are just adding in terms at odd
multiples of the original frequency. Here's what the signal looks like
with the terms up to the 11th multiple.
Page 6
7/31/2019 Fast Fourier
http://slidepdf.com/reader/full/fast-fourier 6/18
This looks like a fairly lousy square wave. Let's add a lot more terms
and see what happens.
Here is the signal with terms up to the 49th multiple.
At this point is seems that this process is giving us a signal thatis getting closer and closer to a square wave signal. However, this
looks like a fairly lousy square wave. Let's add a lot more terms and
see what happens.
Here is the signal with odd terms up to the 79th multiple. Now
we're getting a pretty clear indication of a square wave with an
amplitude a little under 0.8. In fact, the way we are building this
signal we are using Fourier's results. We know the formula for the
series that converges to a square wave.
In fact, the way we are building this signal we are using
Fourier's results. We know the formula for the series that converges
Page 7
7/31/2019 Fast Fourier
http://slidepdf.com/reader/full/fast-fourier 7/18
to a square wave. Here's the formula. For a perfectly accurate
representation, let N go to infinity.
Now, we're going to give you a chance to do this kind of experiment
yourself. Shown below is an interactive demo that will let you control
the number of terms in the summation above. In the demo you can
also control the frequency.
Experiments
E1 In the demo above, do the following.
o Start with a single term in the series and plot the
response. A single term should give you a sine wave signal
with an amplitude of 1.0.
o
Slowly increment the number of terms so that you includethe third harmonic (two terms), the fifth harmonic (three
terms), etc.
o Does the peak value increase or decrease as you increase
the number of terms?
o Determine if you can get the series to a point where the
approximation is always within 5% of the ideal square
wave.o When the series looks like it has converged, determine
the value of the square wave amplitude. Compare that to
the amplitude of the sine wave you started with in the
first step.
Page 8
7/31/2019 Fast Fourier
http://slidepdf.com/reader/full/fast-fourier 8/18
Let's examine another case. Here is another simulator. However,
here the function that is implemented is given by the sum below.
Here is the simulator
Experiments
E2 In the demo above, do the following.
o Start with a single term in the series and plot the
response. A single term should give you a sine wave signal
with an amplitude of 1.0.
o Slowly increment the number of terms so that you include
the third harmonic (two terms), the fifth harmonic (three
terms), etc.
o Does the function approach a square wave.
o Is there anything you notice about the approximation,especially near the discontinuity?
Calculating The Fourier Series Coefficients
At this point there are a few questions that we need to address.
Here are some questions that need to be answered.
• What kind of functions can be represented using these types ofseries?
o Actually, most periodic signals can be represented with a
series composed of sines and cosines. Even
discontinuities (like in the square wave function or the
sawtooth function in the simulations) will not present an
Page 9
7/31/2019 Fast Fourier
http://slidepdf.com/reader/full/fast-fourier 9/18
insurmountable problem, although you might expect (from
the simulation results) that there are some phenomena we
need to account for right at the discontinuities.
• How do you figure out what the series is for any given function?
o That's an interesting question, and we will discuss thatsoon. There are some mathematical results we will need,
but you should be prepared for that.
• Are there any practical implications to all of this?
o Since functions can be thought of as being composed of
sines at cosines at different frequencies, and since
various linear systems process sinusoidal signals in a way
that is frequency dependent, these two facts mean that
the response of a system with a periodic input can bepredicted using frequency response methods.
o Many signals are now analyzed using frequency component
concepts. Special computational techniques (particularly
the FFT, or Fast Fourier Transform) have been developed
to calculate frequency components quickly for various
signals. Signals that have been analyzed include sound
signals in earthquakes, bridge vibrations under dynamic
load (as well as stress vibrations in many differentstructures from tall buildings to aircraft vibrations) and
communication signals (including the signals themselves as
well as the noise that interferes with the signals).
Now, let's try to answer some of these questions, starting with the
computation of the frequency components.
In general, a periodic signal can be represented as a sum of both
sines and cosines. Also, since sines and cosines have no average term,
periodic signals that have a non-zero average can have a constant
component. Altogether, the series becomes the one shown below.
This series can be used to represent many periodic functions. The
function, f(t), is assumed to be periodic.
Page 10
7/31/2019 Fast Fourier
http://slidepdf.com/reader/full/fast-fourier 10/18
The coefficients, an and bn, are what you need to know to generate
the signal.
To compute the coefficients we take advantage of some
properties of sinusoidal signals. The starting point is to integrate a
product of f(t) with one of the sinusoidal components as shown below.
Now, if we assume that the function, f(t), can be represented by the
series above, we can replace f(t) with the series in the integral.
Here, we note the following:
• f = 1/T,
• o = 2 f.
Then, when we do the integration, we can use some properties of the
sinusoidal functions. In all cases here, the integral is take over
exactly one period of the periodic signal, f(t).
Page 11
7/31/2019 Fast Fourier
http://slidepdf.com/reader/full/fast-fourier 11/18
So, when we do the integration of the function, f(t), multiplied by any
sine or cosine function, they almost all work out to be zero. The only
one that doesn't work out to be zero is the one where n and m are
equal.
Realizing all of this, we can conclude:
or:
Which gives us a way to compute any of the b's in the Fourier Series.
At this point we have half of our problem solved because we cancompute the b's, but we still need to compute the a's. However, we
can do the same thing for the a's that we did for the b's (and we will
let you do that yourself) and we get the following expressions for the
coefficients.
and these expressions are good for n>0 and m> 0. The only
coefficient not covered is ao which is given by:
Page 12
7/31/2019 Fast Fourier
http://slidepdf.com/reader/full/fast-fourier 12/18
So, now we have a way to find all of the coefficients in a Fourier
Series expansion. Let us apply what we know to an example.
Example/Experiment
E3 We will compute the Fourier Series of a general pulse that
repeats. The pulse sequence is shown below. The pulse signal varies
between zero volts and one volt.
Now, to evaluate the coefficients, we do the integrations indicated
above. We have the following.
or:
an = 2Asin(n oT p)/(nT o)
an = Asin(n oT p)/(n )
Similarly,
Page 13
7/31/2019 Fast Fourier
http://slidepdf.com/reader/full/fast-fourier 13/18
or:bn = 2A[-cos(n oT p) + 1]/(nT o)
bn = A[-cos(n oT p) + 1]/(n )
and,
ao = (T p/T)
Now, we can compute some of the coefficients for a particular case.We will examine the situation where the pulse is high for one-fourth
of the period, i.e. when T p = T/4. In that situation we have:
n oT p = (n2 /T)T p = n /2
Note that the a's (the cosine coefficients) will all be zero for even
n's, while the b's (the sine coefficients) will be zero for every fourth
n. That being said, the coefficients we have computed are given in
the table below. For this table we have assumed a period of 4seconds. We'll show that later in a real-time simulator.
n an bn
0 .25 -
1 .31831 .31831
2 0 .31831
3 -.10610 .10610
4 0 0
5 .06366 .06366
6 0 .10610
7 -.04547 .04547
8 0 0
9 .03537 .03537
Page 14
7/31/2019 Fast Fourier
http://slidepdf.com/reader/full/fast-fourier 14/18
10 0 .06366
Now, we can check whether these coefficients actually produce a
pulse. Here is a real-time simulator that will let you check that. It
has been pre-loaded with the coefficients we calculated above toproduce a pulse. However, since we are only using harmonics up to
the 10th harmonic, it will not be an exact representation.
Run the simulator to check whether we are close. Then do the
following.
Questions/Problems
Using the simulator, answer the following questions
Q1 Does the waveform with 10 harmonics look like - with more
harmonics - it will converge to the pulse we started with?
P1 Determine the average value (i.e. DC component) of the signal.
Enter your answer in the box below, then click the button to submit
your answer. You will get a grade on a 0 (completely wrong) to 100
(perfectly accurate answer) scale.
Your grade is:
Example/Experiment
E4 Next, we will compute the Fourier Series of a triangle wave, as
pictured below.
Page 15
7/31/2019 Fast Fourier
http://slidepdf.com/reader/full/fast-fourier 15/18
Now, to evaluate the coefficients, we need to do the integrations
indicated above. However, we know a few things about this function.
o The triangle function above is even. In other words, if
T(t) is the triangle signal above.
T(t) = T(-t).
o Since the function is even, there can be no odd functions
in the Fourier expansion.
In other words, there are not sine terms since
sin(x) = -sin(-x), i.e. the sine function is odd.
o The triangle function above has odd symmetry around the
quarter period point. In other words, if you look at the
wave as though it were centered at t = T/4, you find oddsymmetry. Even harmonic cosine functions have even
symmetry around this point. (That would be the second
harmonic cosine, the fourth harmonic cosine, etc.) In this
figure, you can see the triangle wave, a second harmonic
cosine wave, and the product of the two. The product of
the even harmonic cosine signal and this triangle signal do
not have any net area - in a period, or even in half a
period.
Page 16
7/31/2019 Fast Fourier
http://slidepdf.com/reader/full/fast-fourier 16/18
o The conclusion that we reach is that there will be no even
harmonic cosine terms. Since there are no sine termswhatsoever, that means that the entire Fourier Series is
composed of odd harmonic cosines only. Thus, we need
only compute those terms.
o Doing the computation, we note that we need only do the
computation for one half of a period, and double the
result.
o The result is: (NOTE: You can check the integral as a
problem for the interested student.)
bk = 8A/( 2k2) as long as k is odd
bk = 0 for even k.
Now, if you click here you can get to an example problem where you
can check this calculation. Go to that example problem and answer
the questions there.
At this point you have the basic knowledge you need to compute
Page 17
7/31/2019 Fast Fourier
http://slidepdf.com/reader/full/fast-fourier 17/18
Fourier Series representations for periodic signals. Moreover, when
you encounter the Fast Fourier Transform (FFT) you should be able
to understand the concepts you will encounter there. Fourier Series
concepts are useful in their own right, but they are also the building
blocks you need to be able to understand Fourier and laPlacetransforms, and, in turn, those concepts are the fundamental
concepts you need when you encounter linear systems and control
systems.
Problems
o Problem Freq4P01 - Half Wave Rectified Sine Wave
o Problem Freq4P00A - A Guided Problem
o Problem Freq4P00B - A Guided Problemo Problem Freq4P01 - Rectified Sine Wave
o Problem Freq4P02 - Periodic Pulse (Centered at t = 0)
o Problem Freq4P03 - Data from "twanging" a bar
o Problem Freq4P04 - Random data with possible embedded
periodic signal - A
o Problem Freq4P05 - Random data with possible embedded
periodic signal - B
o Problem Freq4P06 - Random data with possible embeddedperiodic signal - C
o Problem Freq4P07 - Random data with possible embedded
periodic signal - D
o Problem Freq4P08 - Data from a noisy pressure sensor
o Problem Freq4P09 - Digital Filter - A
o Problem Freq4P10 - Digital Filter - B
o Problem Freq4P11 - Digital Filter - C
o
Problem Freq4P12 - Digital Filter - Do Problem Freq4P13 -
o Problem Freq4P14 -
o Problem Freq4P15 -
o Problem Freq4P16 - Noisy Periodic Signal
o Problem Freq4P17 - FFTing a 5 Volt Square Wave
Page 18
7/31/2019 Fast Fourier
http://slidepdf.com/reader/full/fast-fourier 18/18
Tools
o A Fourier Series Calculator.
Useful Link(s)Mathworld
Java Applet you can listen to
http://lpsa.swarthmore.edu/ZXform/FwdZXform/FwdZXform.html